Upcoming webinar on 'Inforiver Charts : The fastest way to deliver stories in Power BI', Aug 29th , Monday, 10.30 AM CST. Register Now
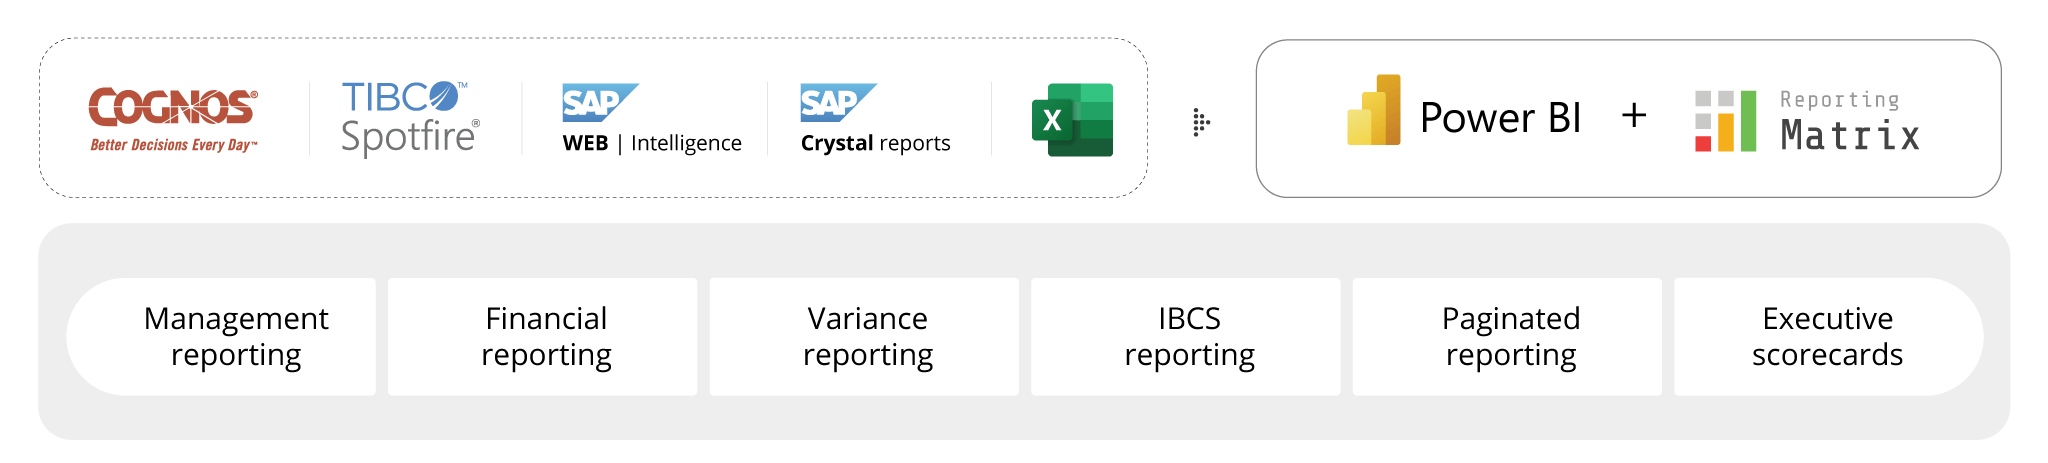
Inforiver Matrix visual has been renamed to Reporting Matrix. This change will be reflected in Microsoft AppSource from the next release.
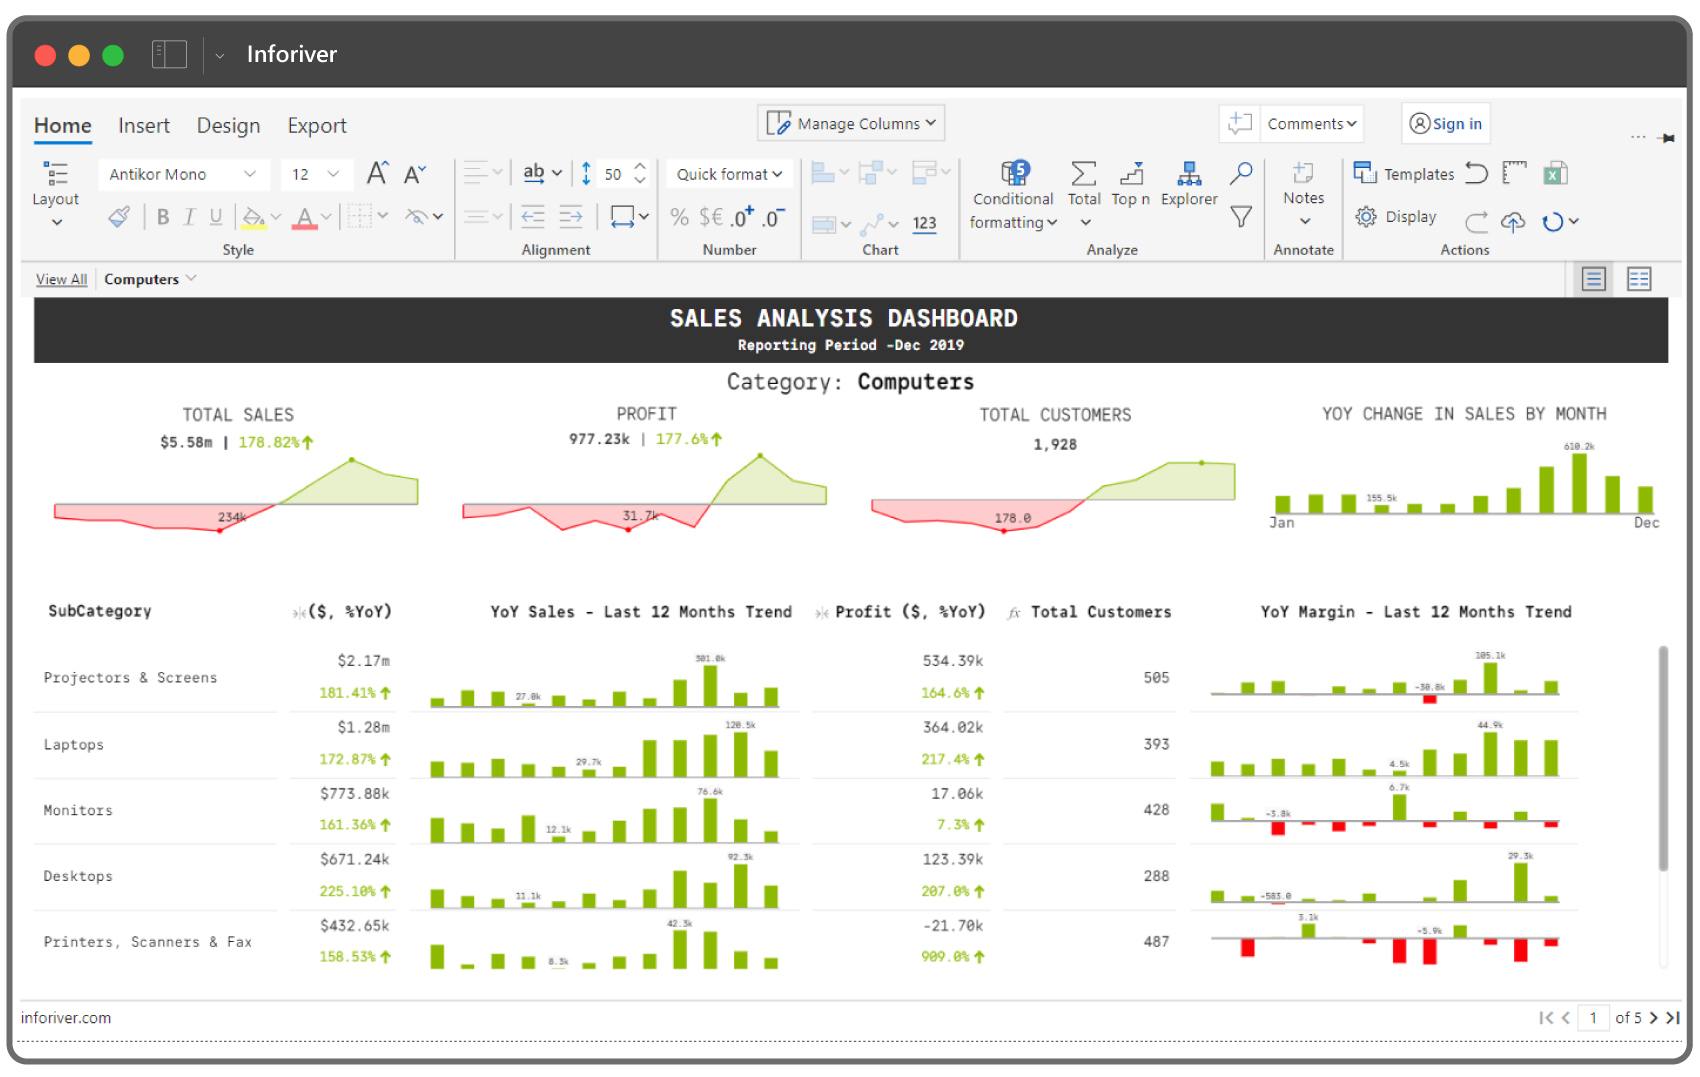
Build highly formatted & interactive paginated reports
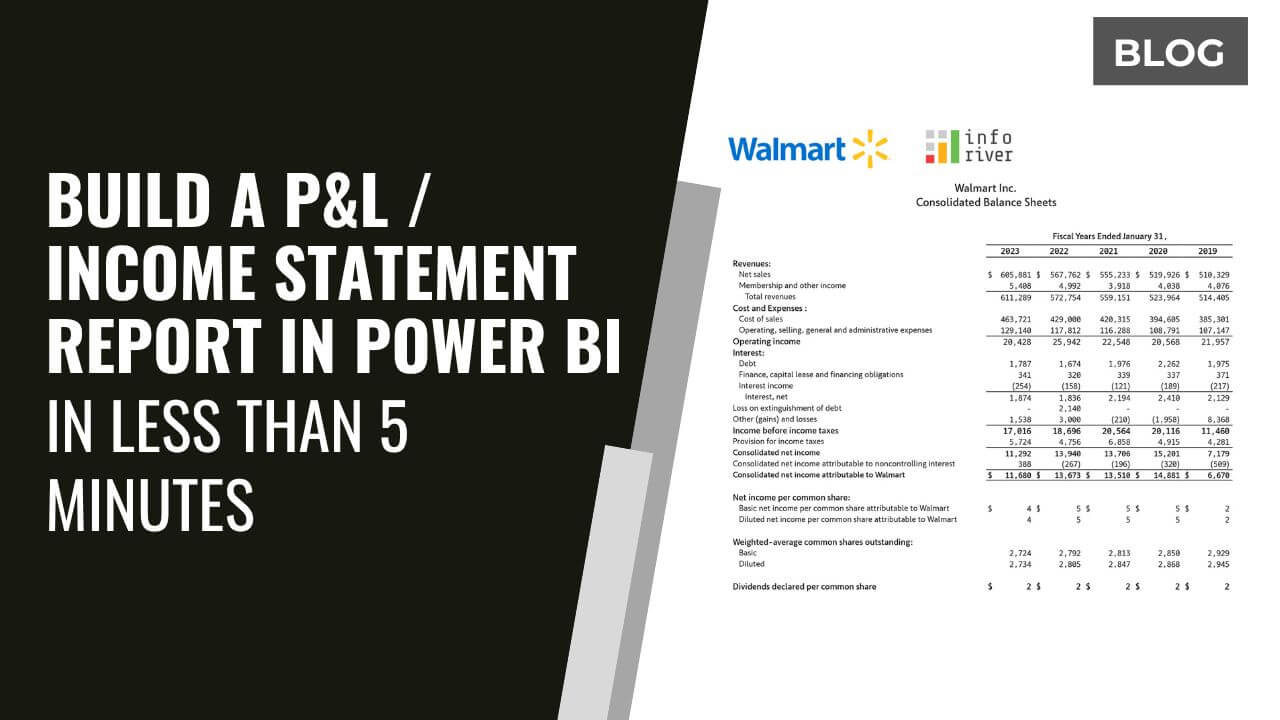
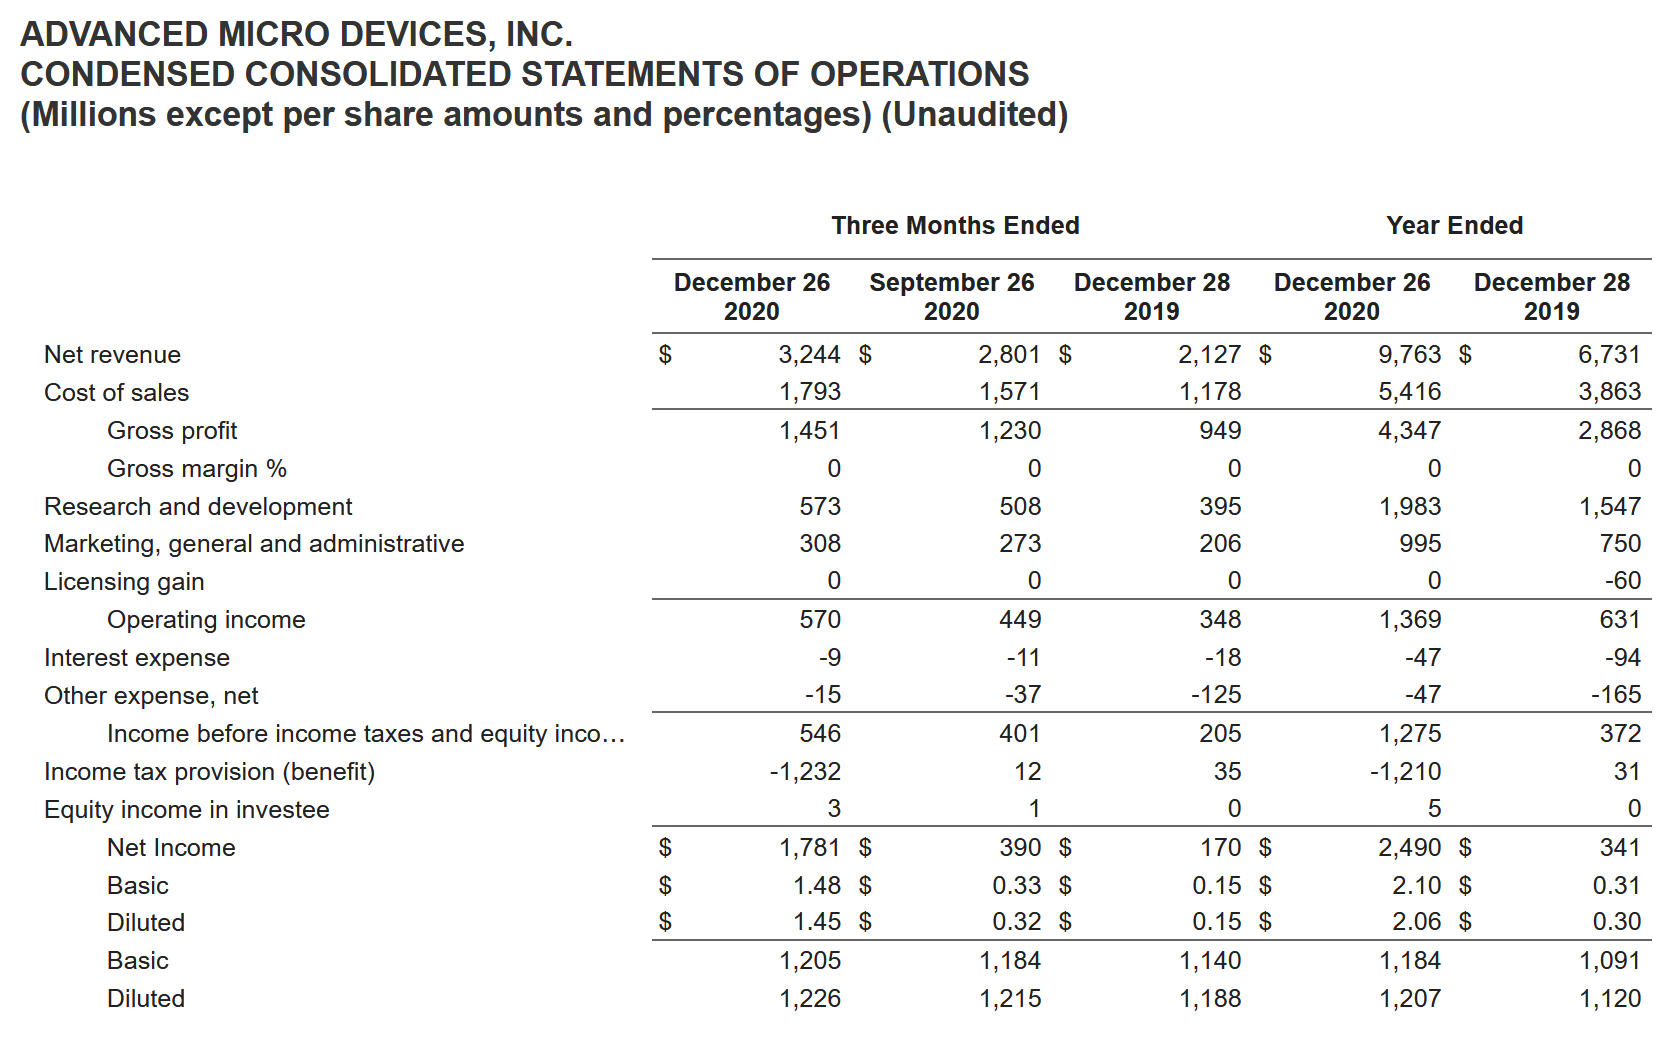
Deliver highly formatted income statements, balance sheets, cash flow statements, and more
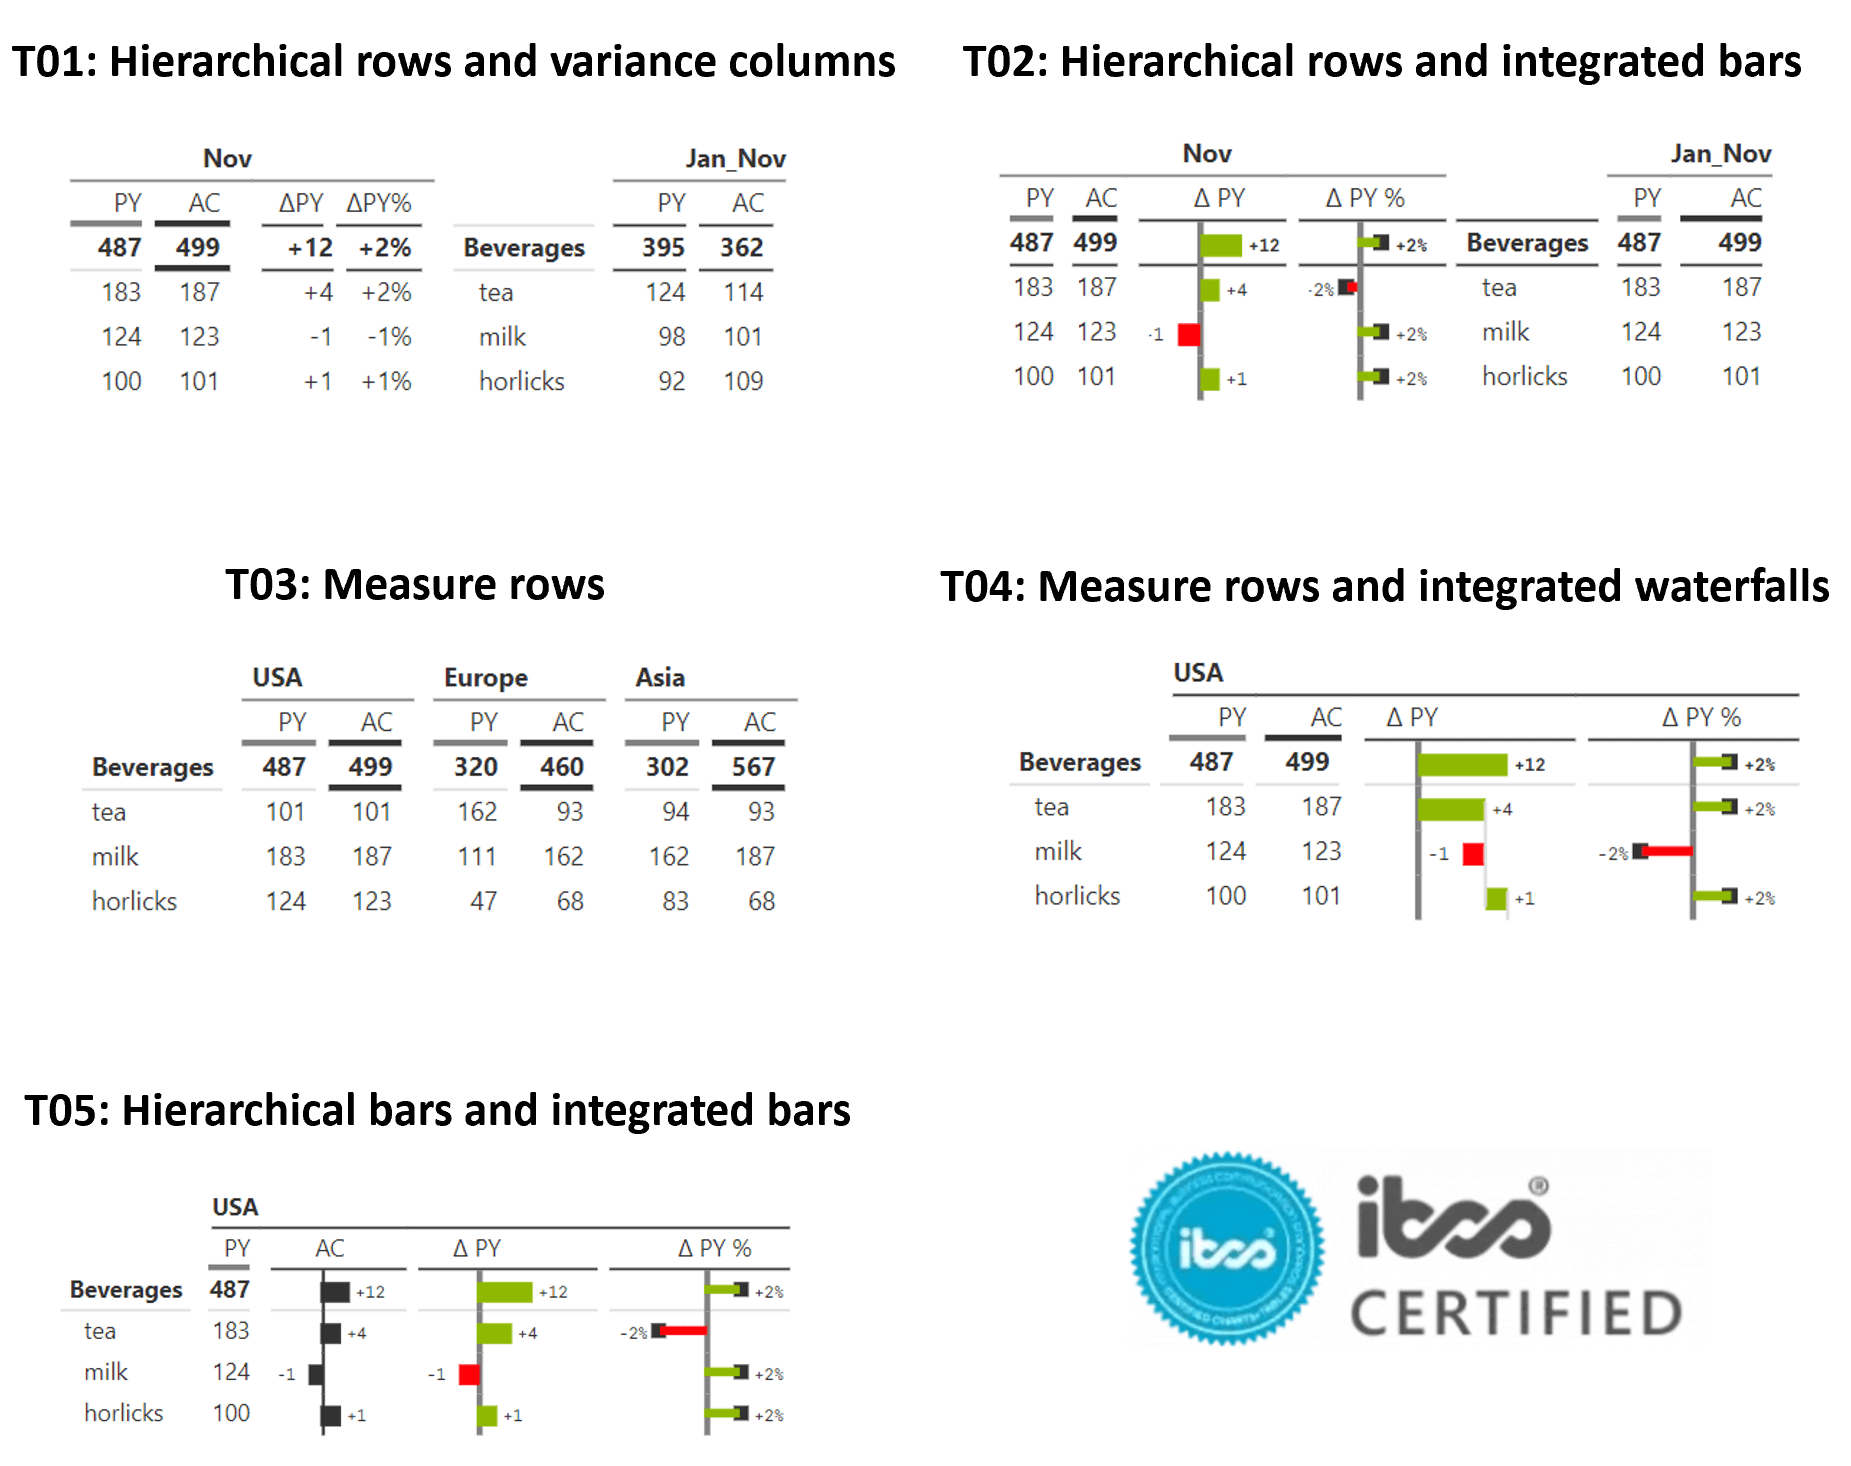
Deliver performance & variance reporting using 1-click International Business Communication Standards (IBCS) templates


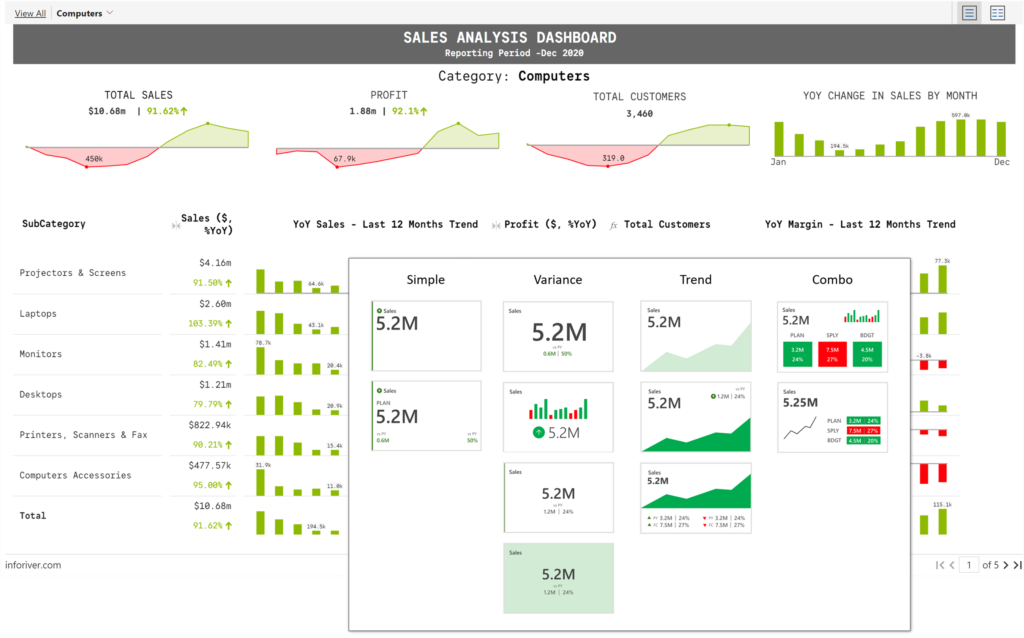
Deliver a range of charts and visualizations in your matrix reports in a single click
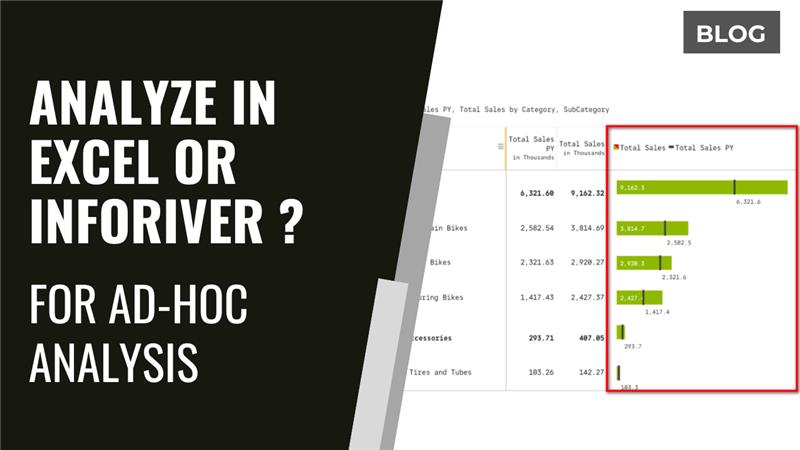
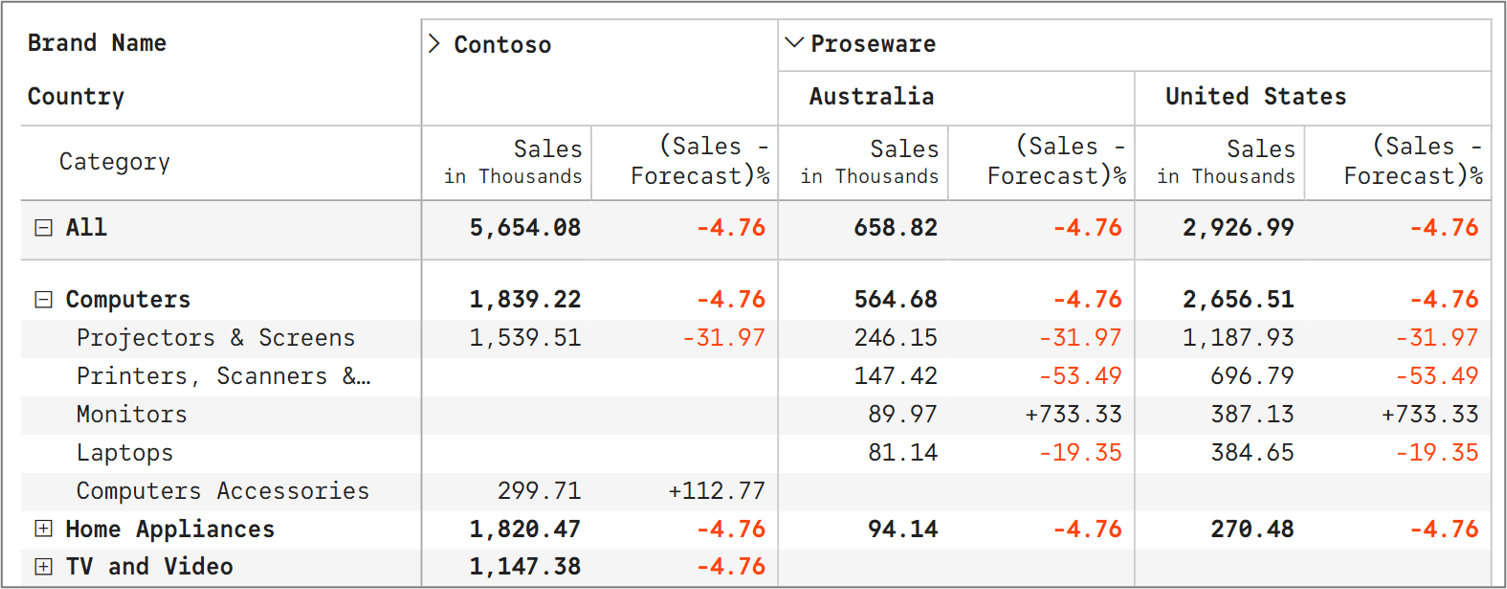
Enrich your analysis & decision-making by applying pivot-table like capabilities inside Power BI
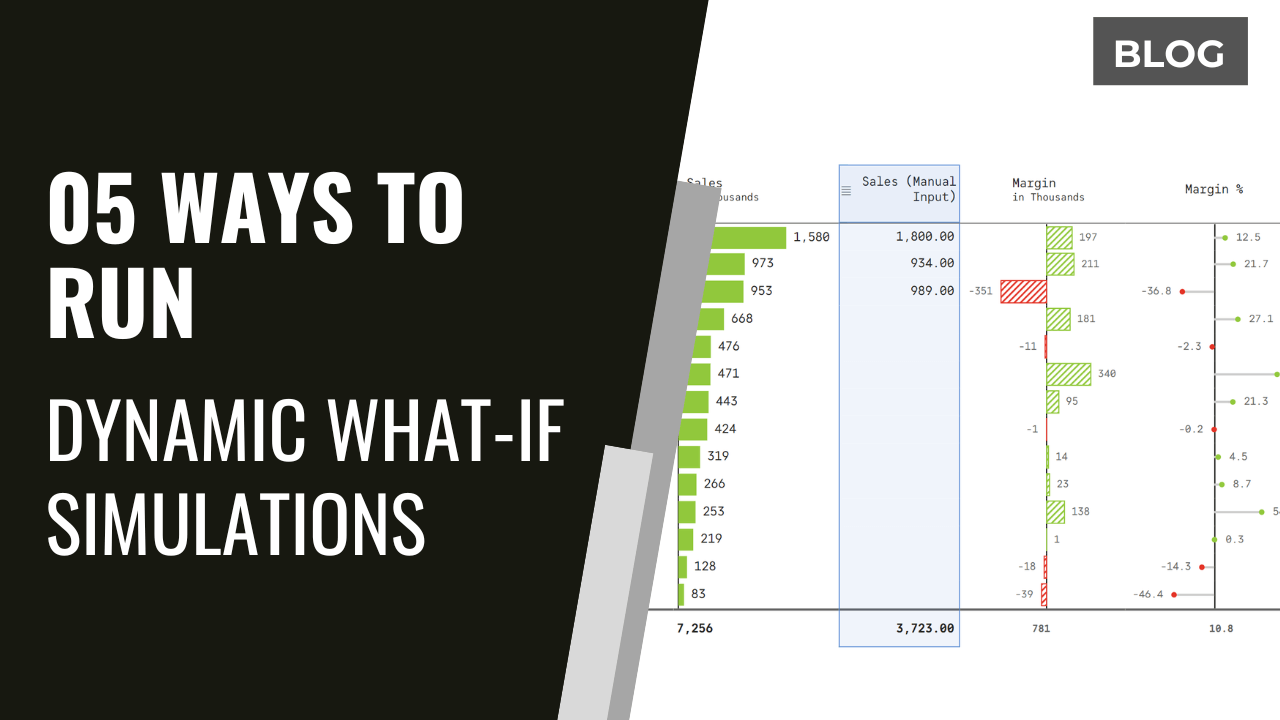
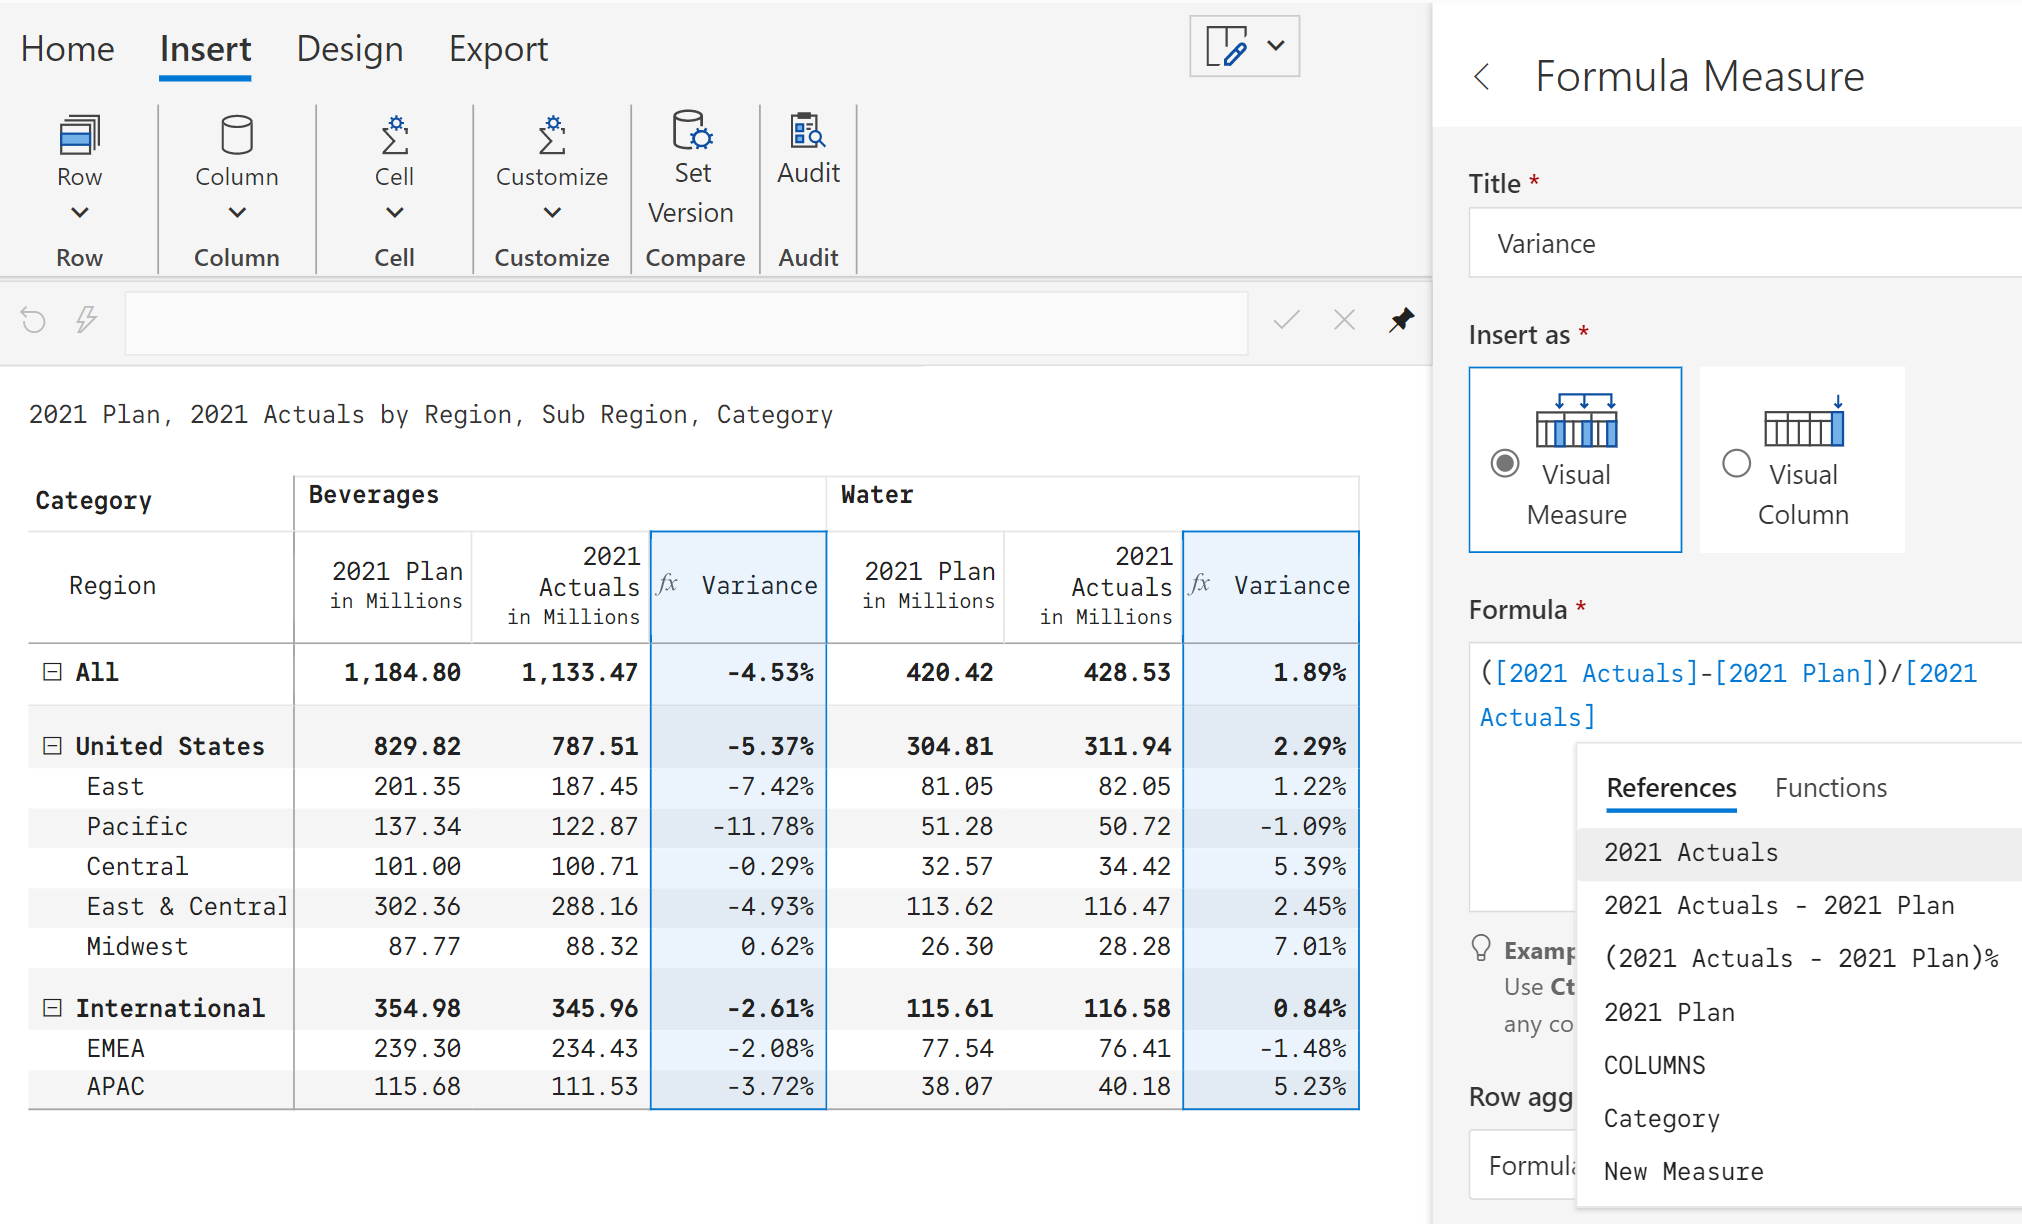
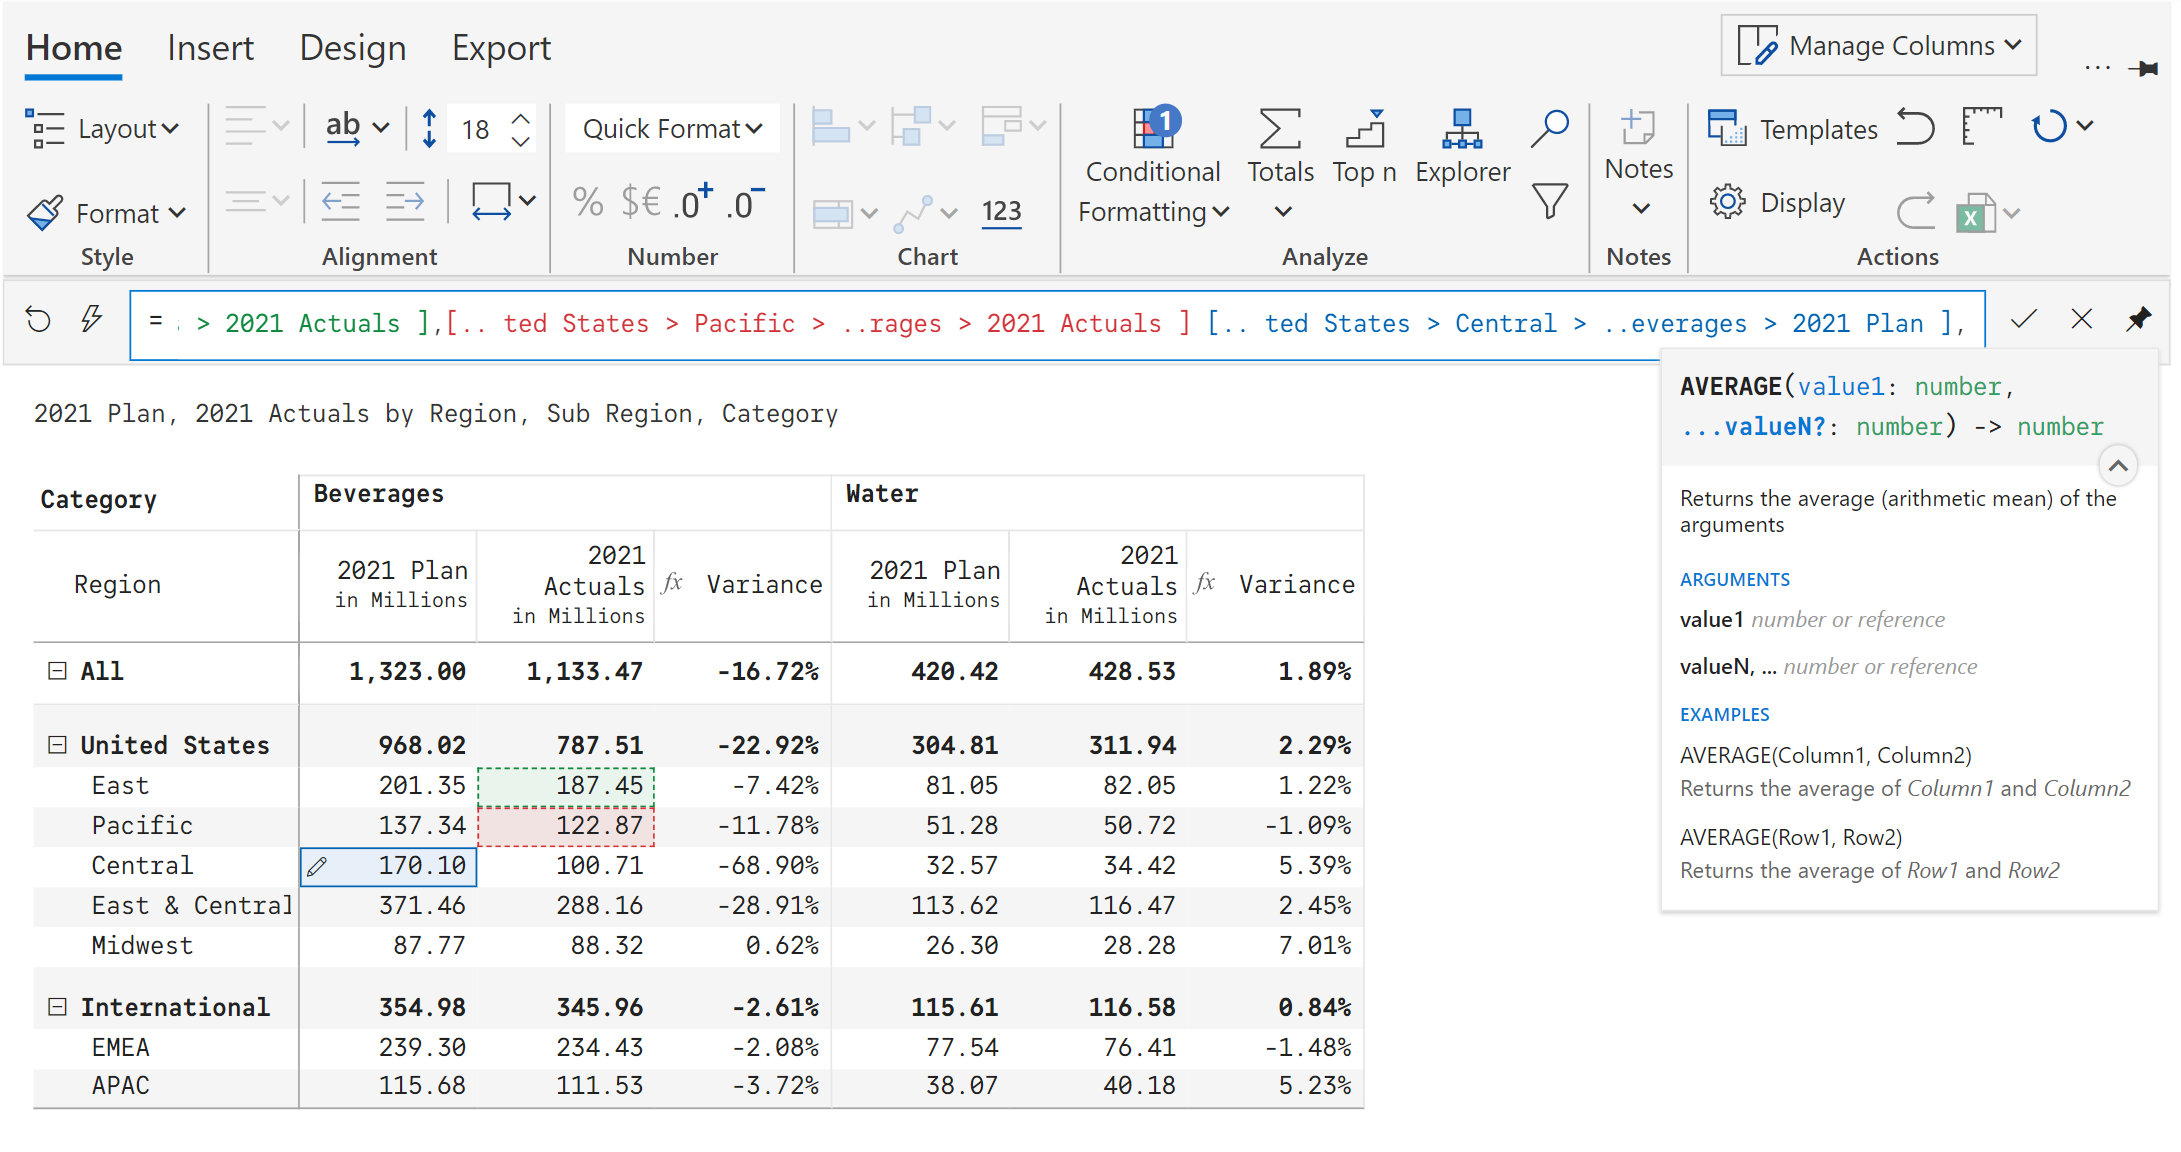
Insert, edit or update cell values using values or formula; supports formula references to other cells
Leverage powerful formula engine to insert rows, columns and measures at the visual-level

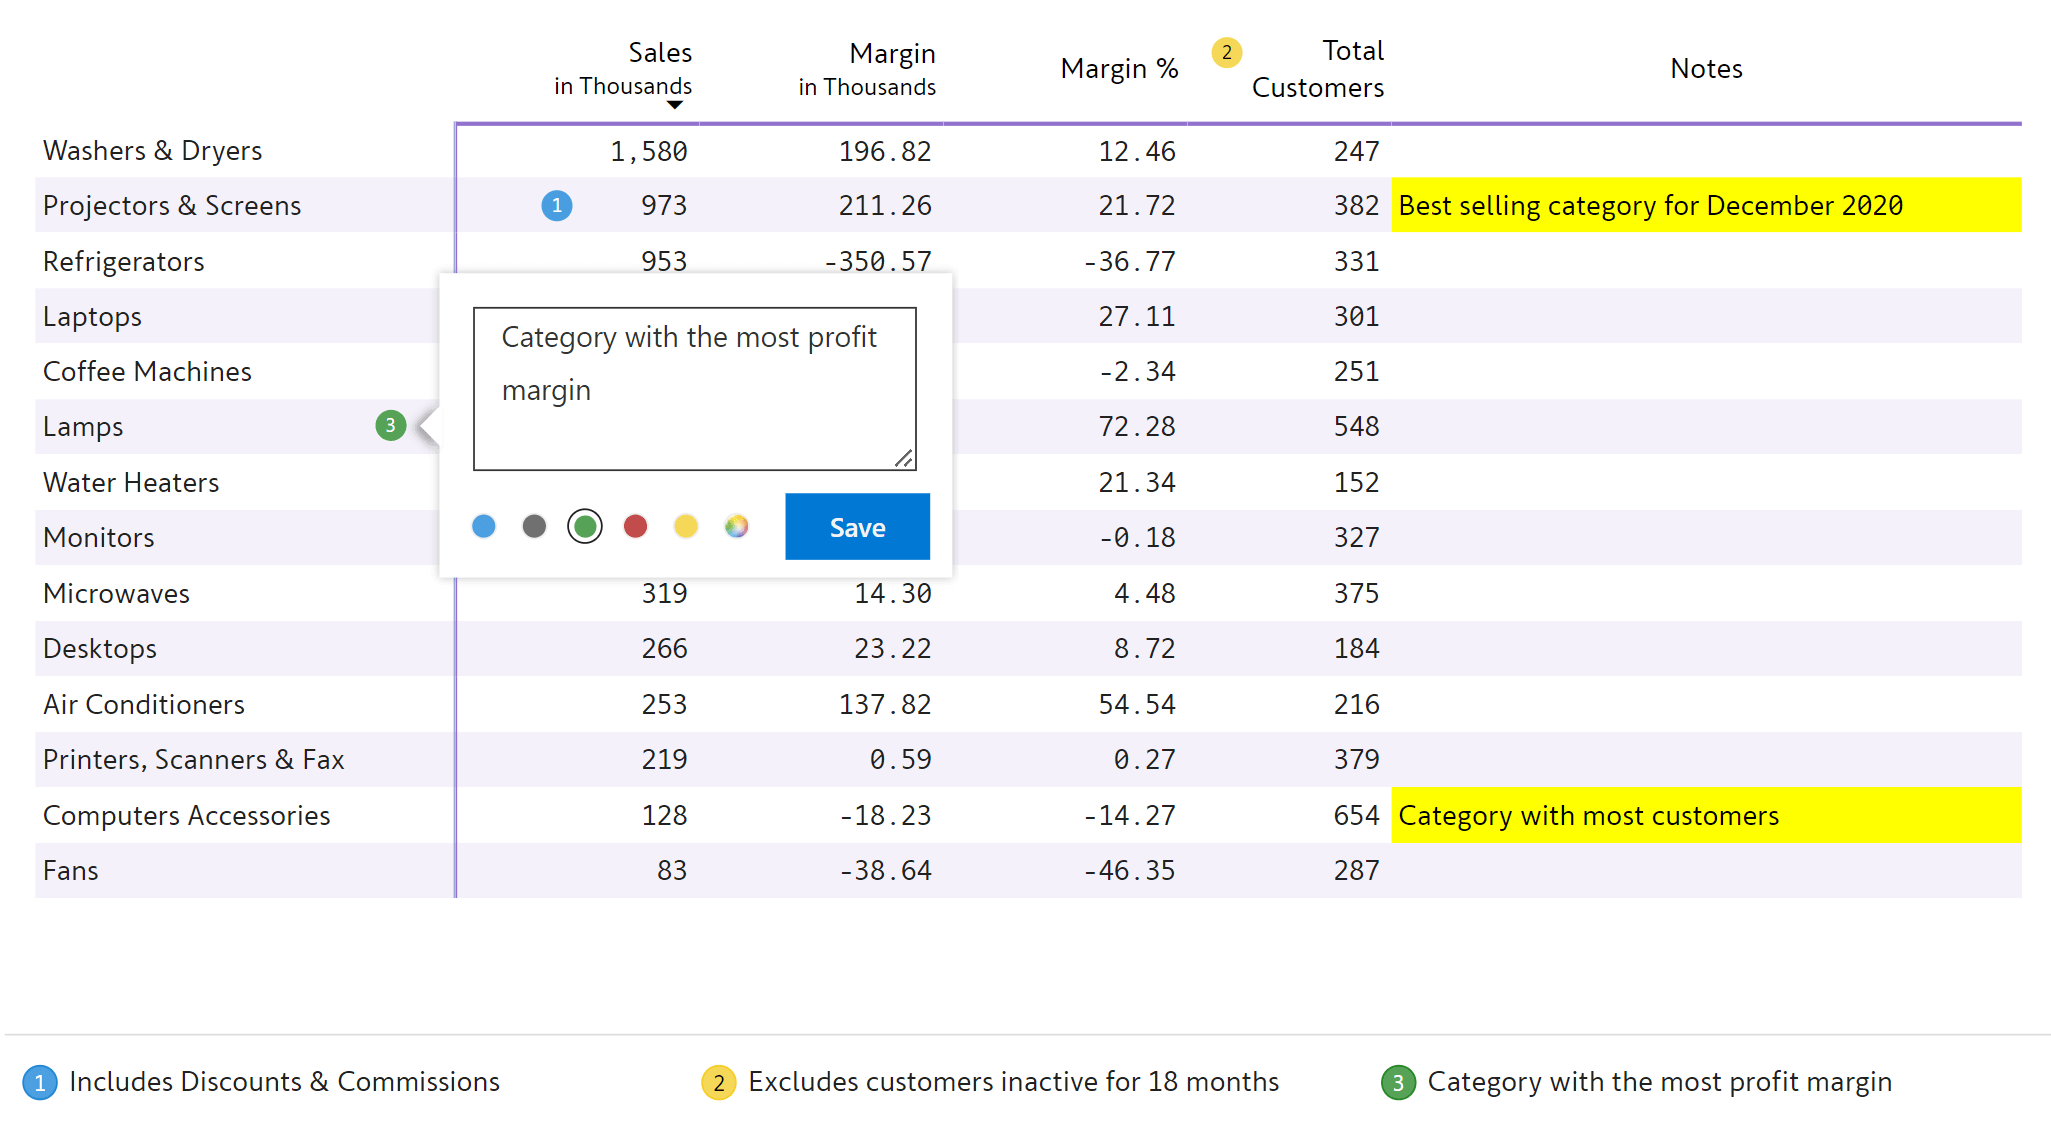
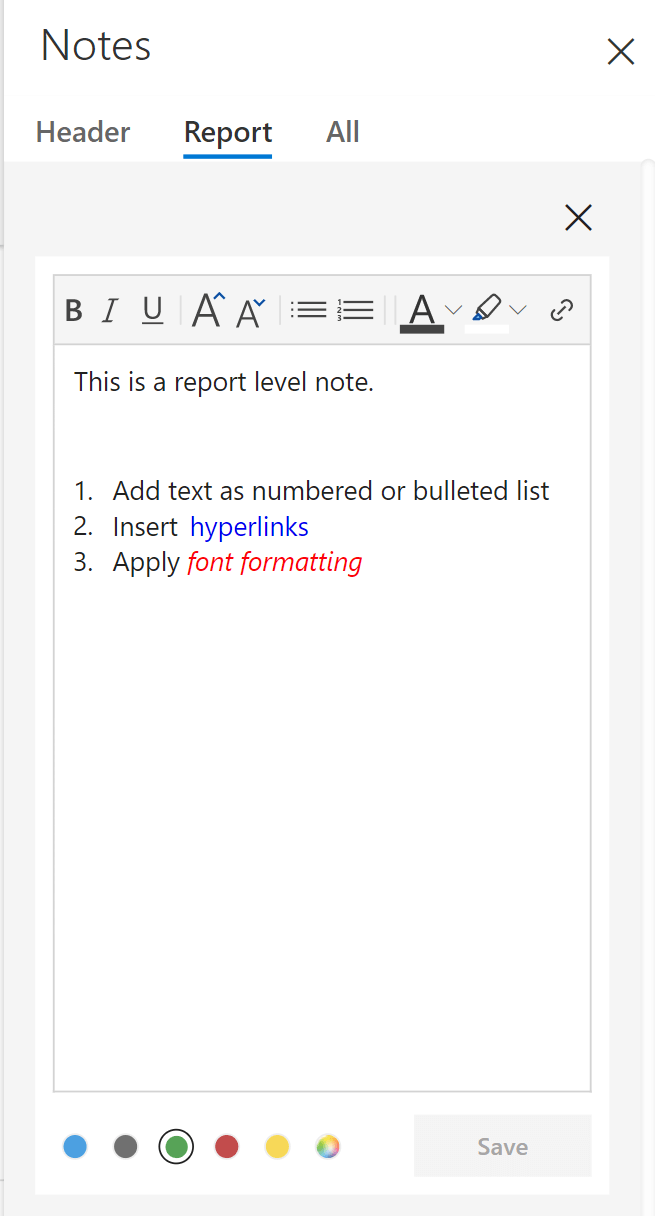
Enhance your data stories with cell, row & column-level notes/footnotes & annotations. Report level notes and marker mode are also available
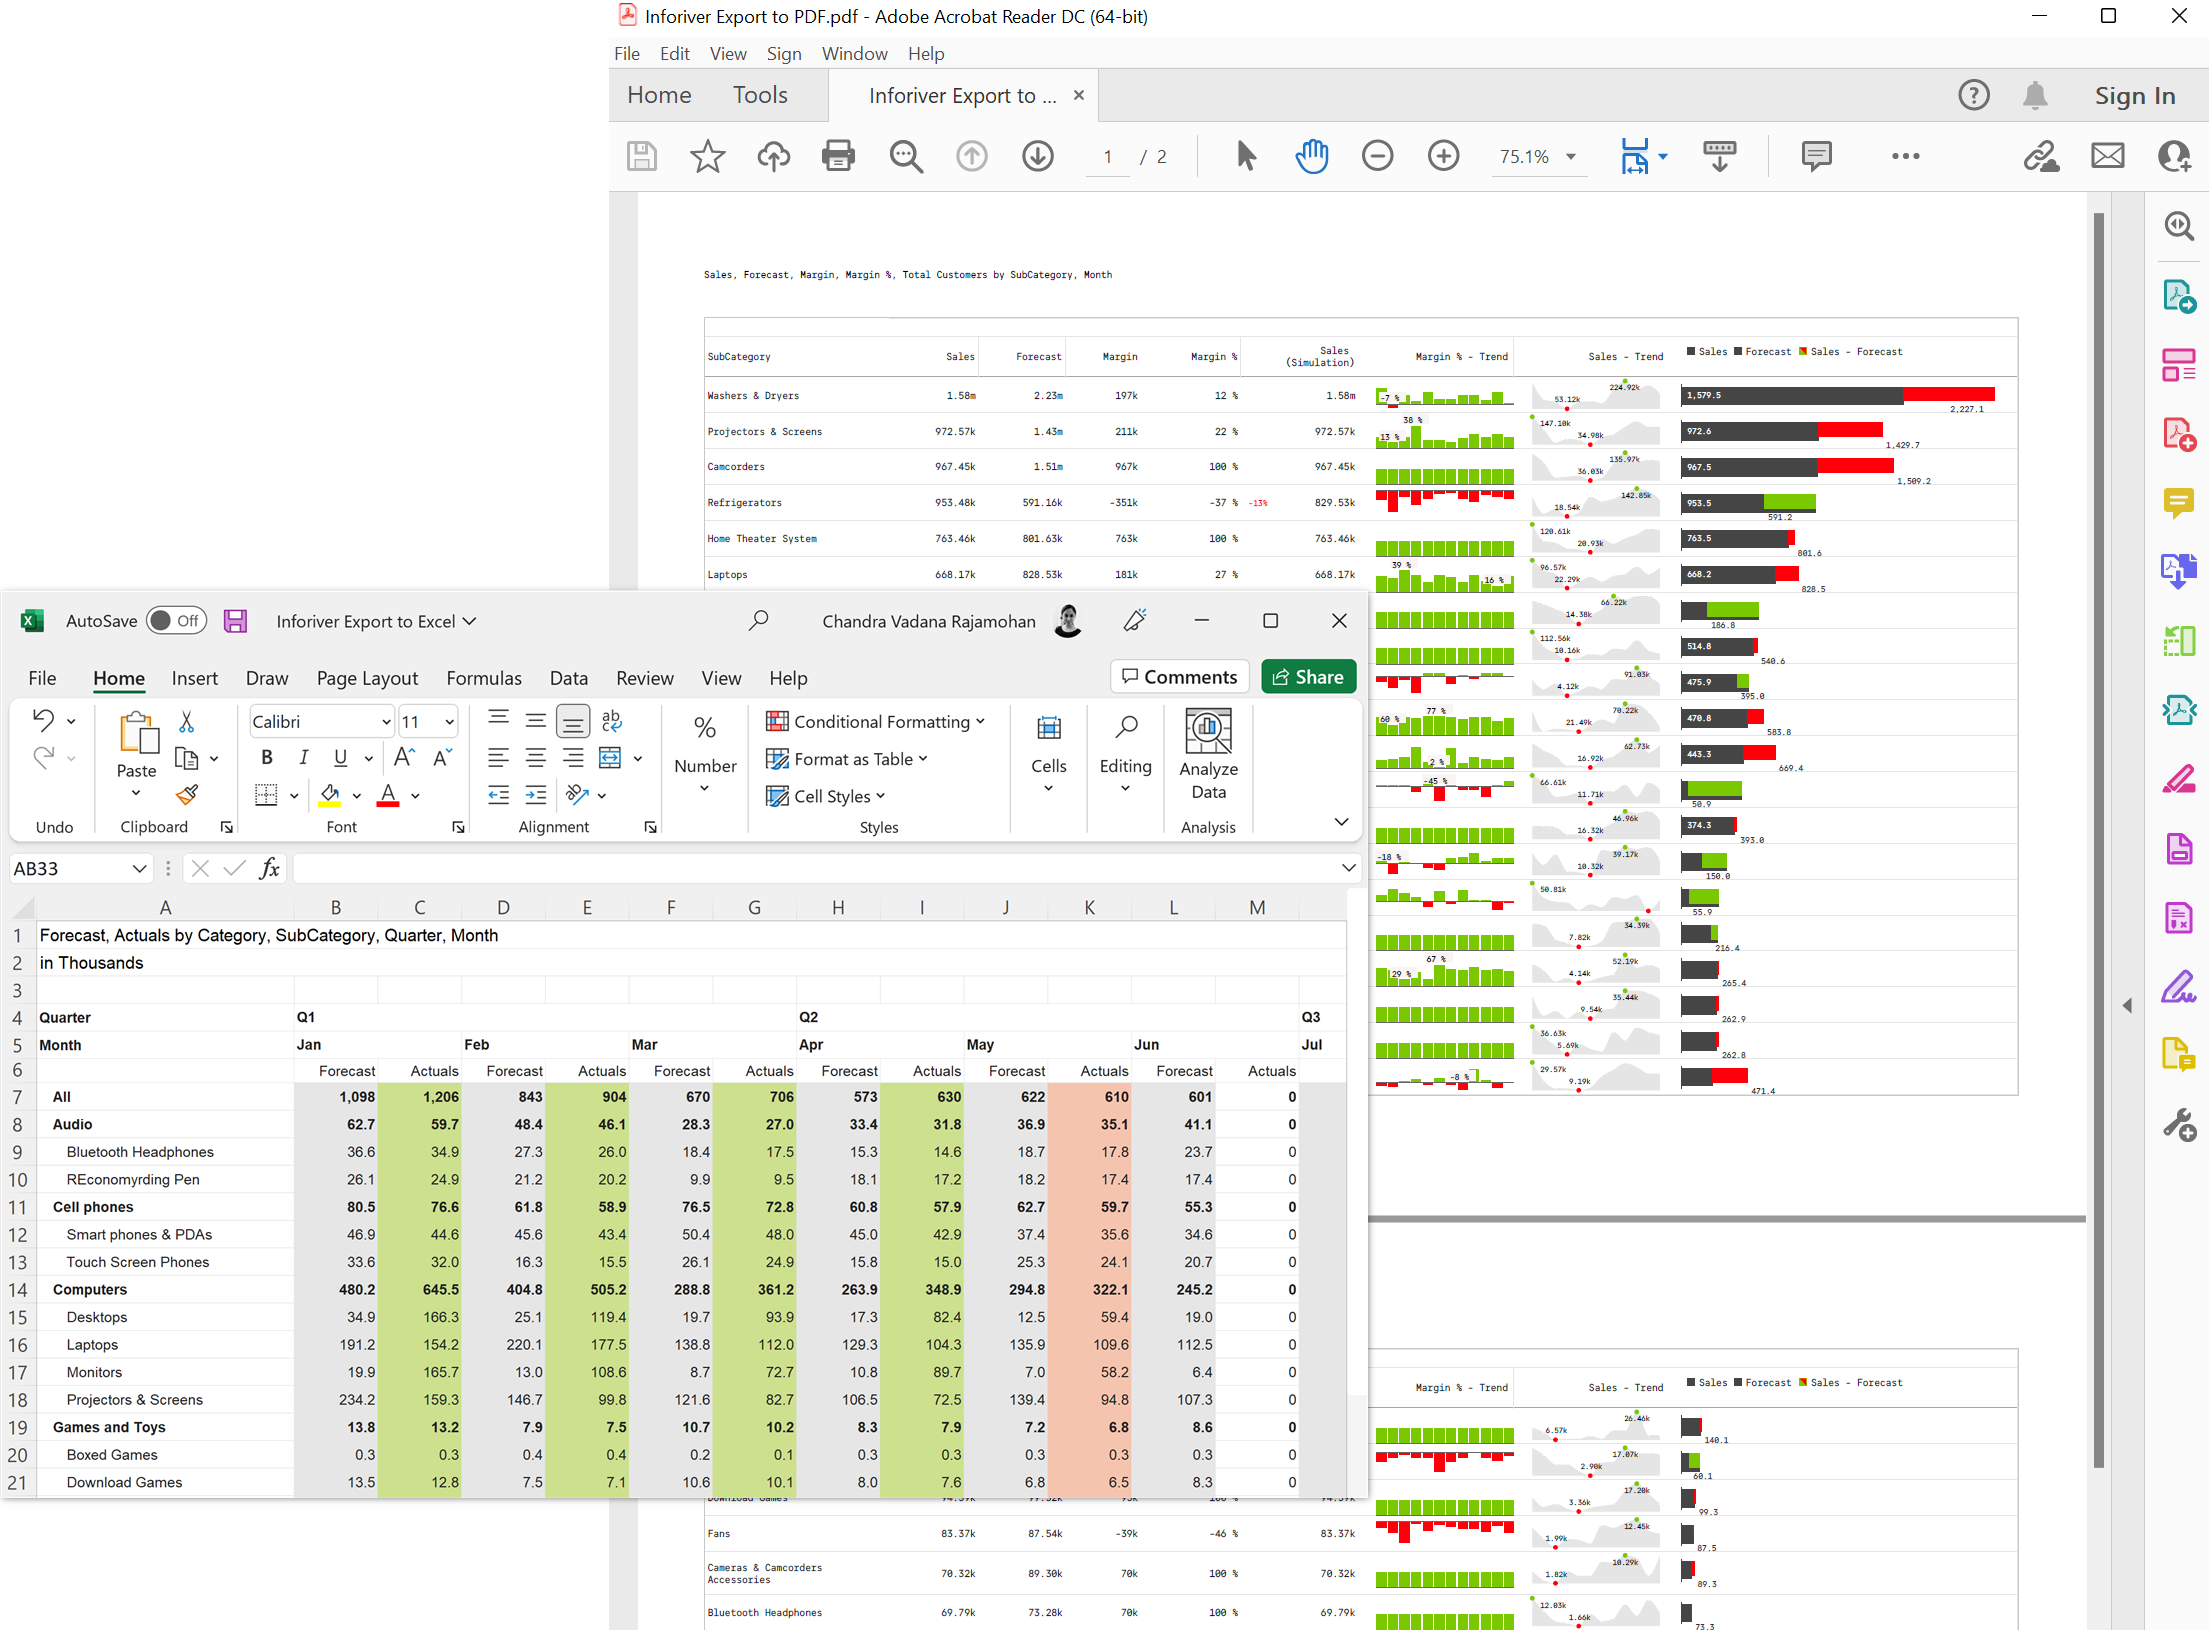
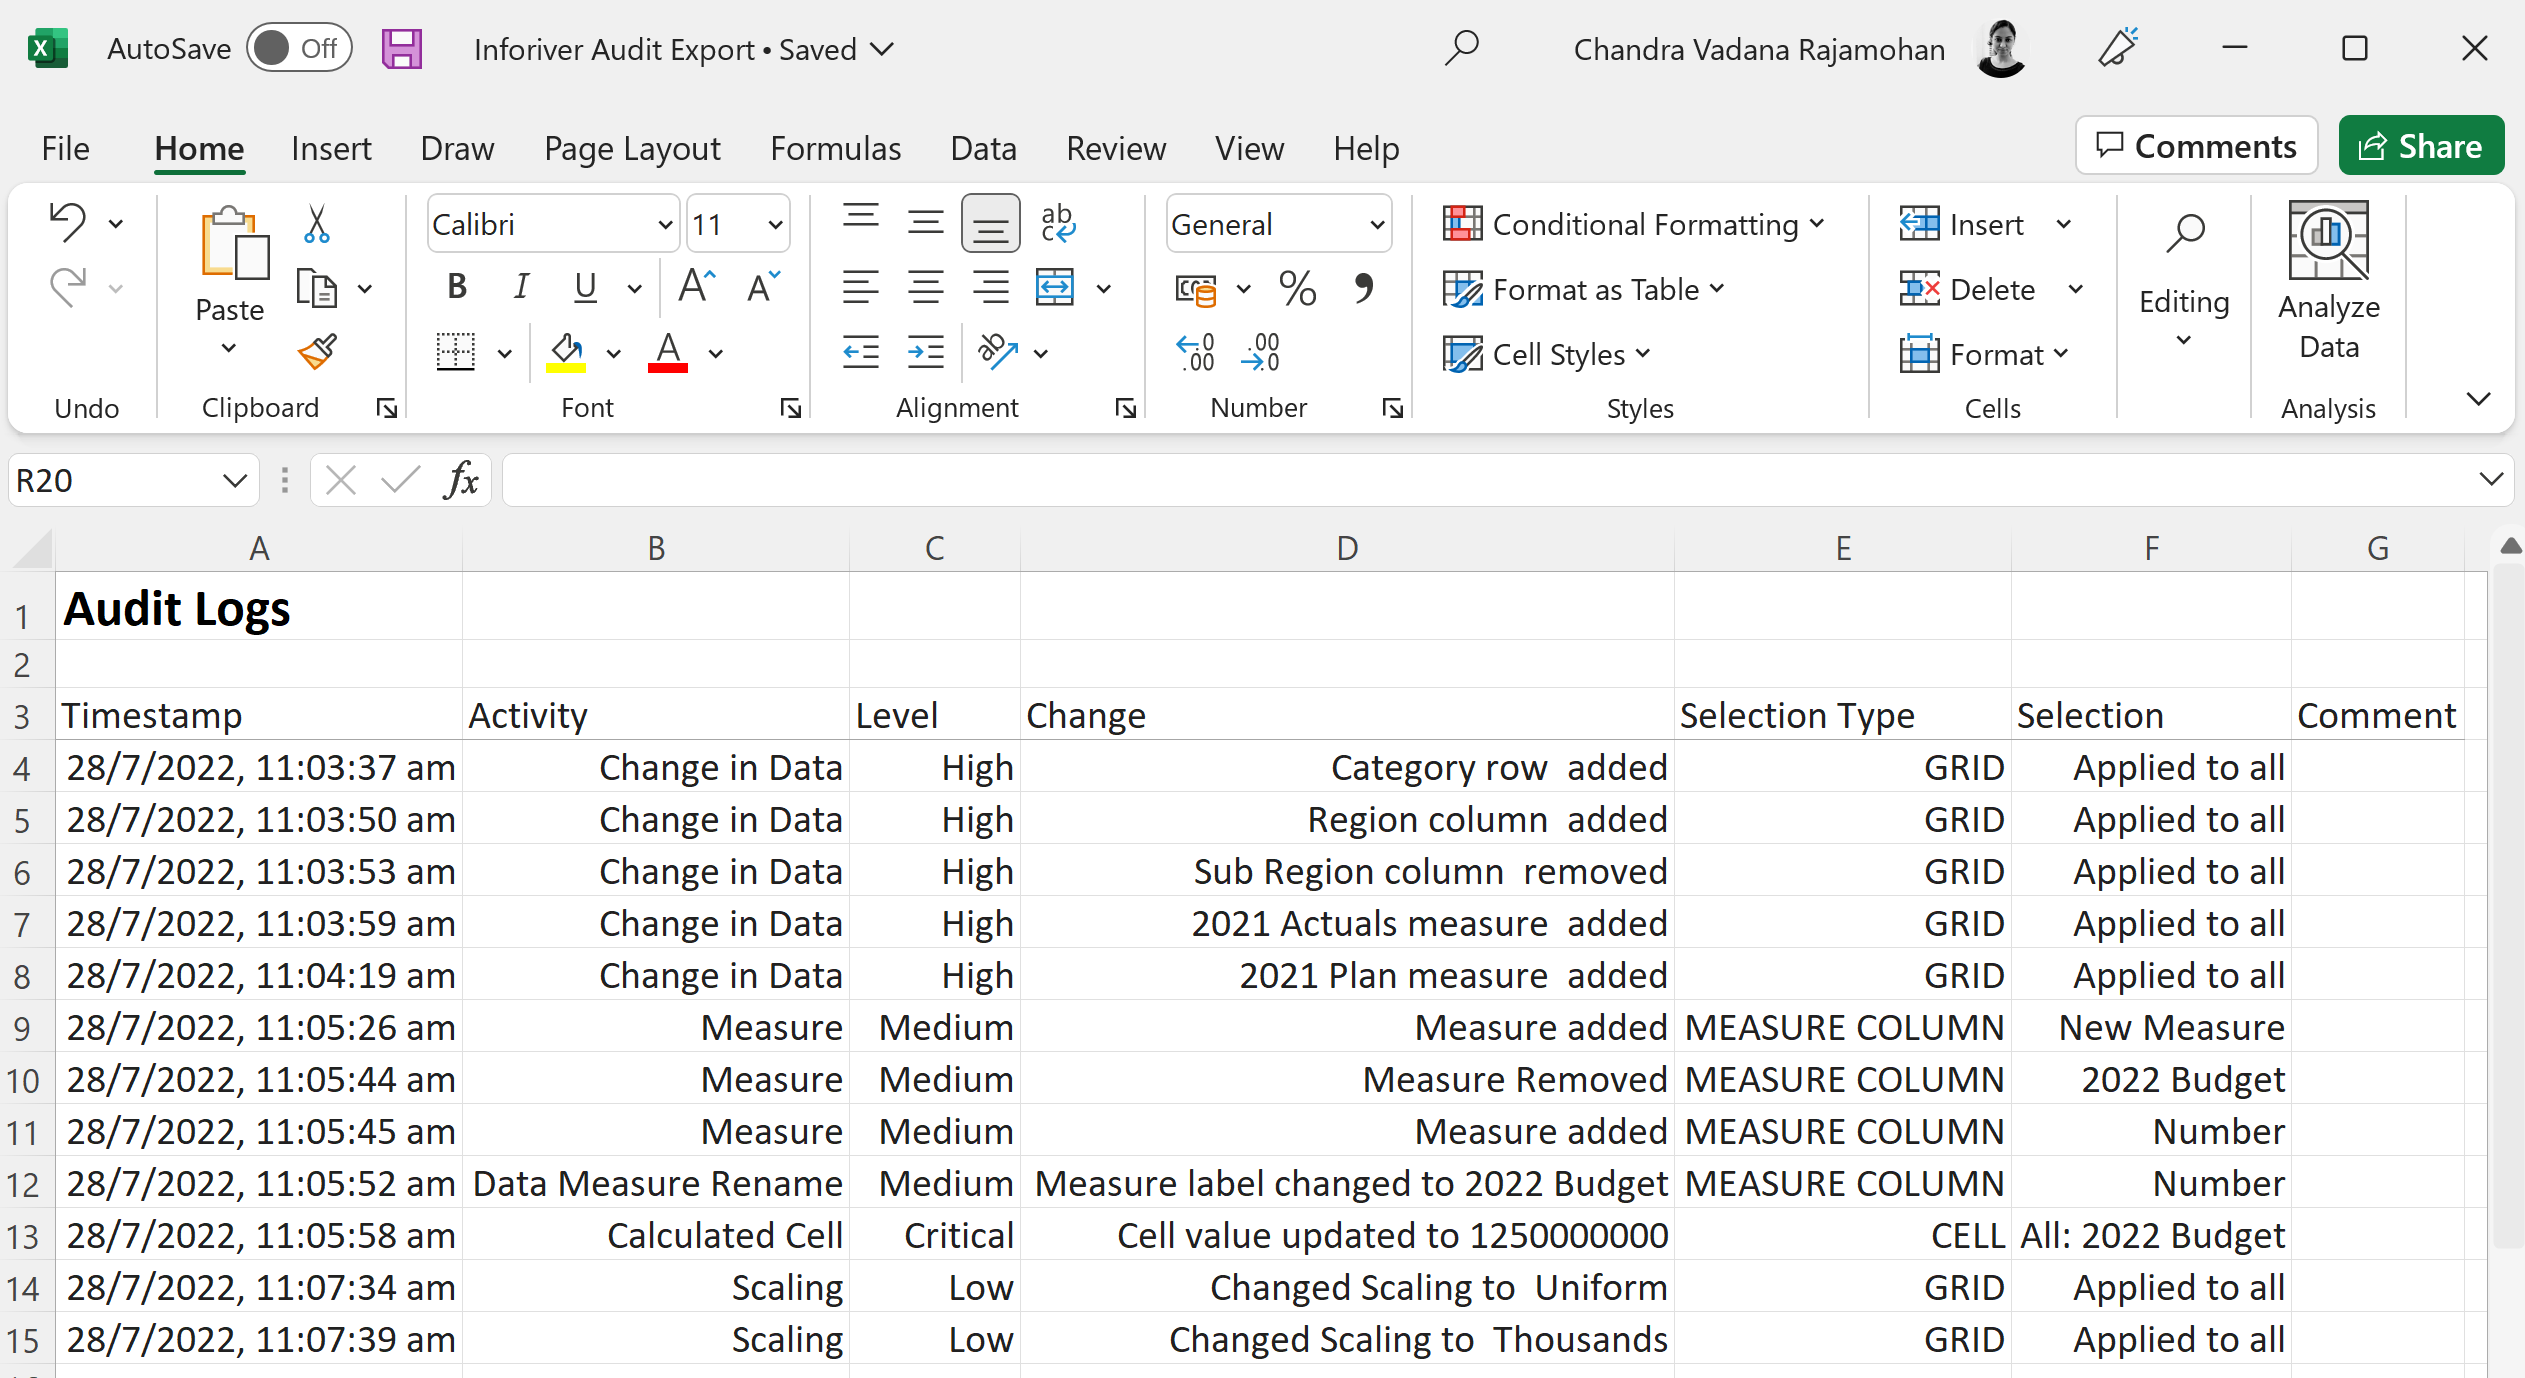
Export to Excel or PDF without losing formatting
The industry-leading export capability delivers the following:
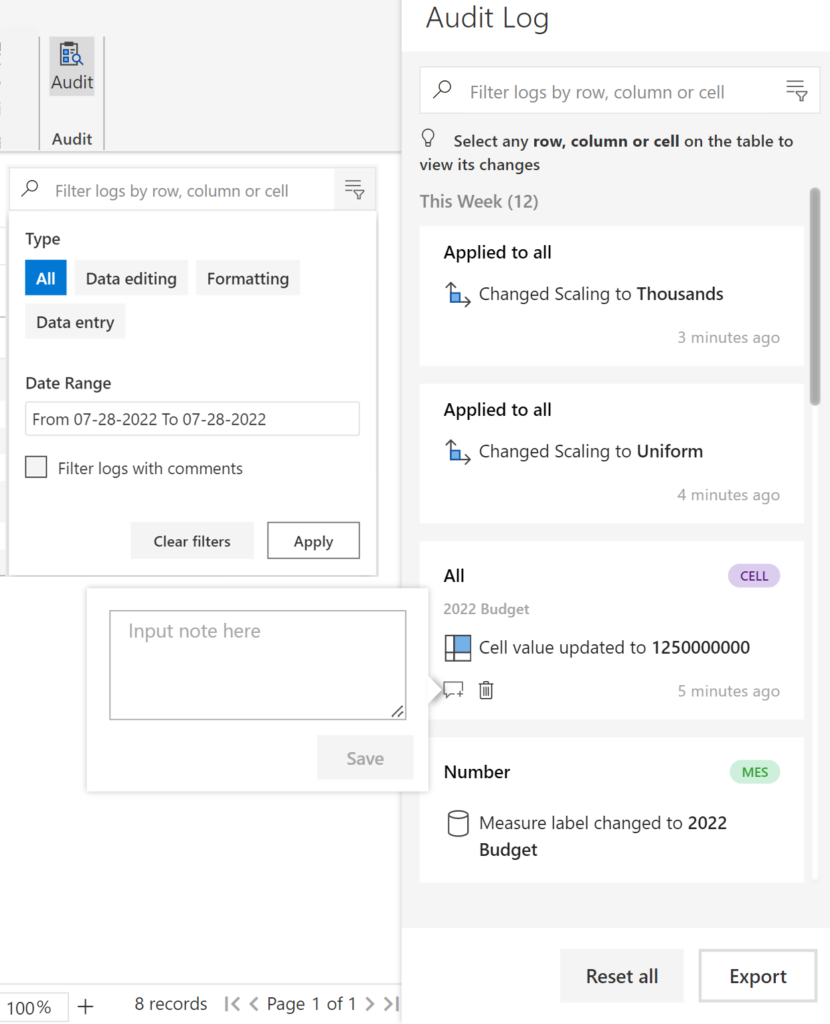
Track changes to your report using an interactive, filterable, exportable and comment-enabled audit log
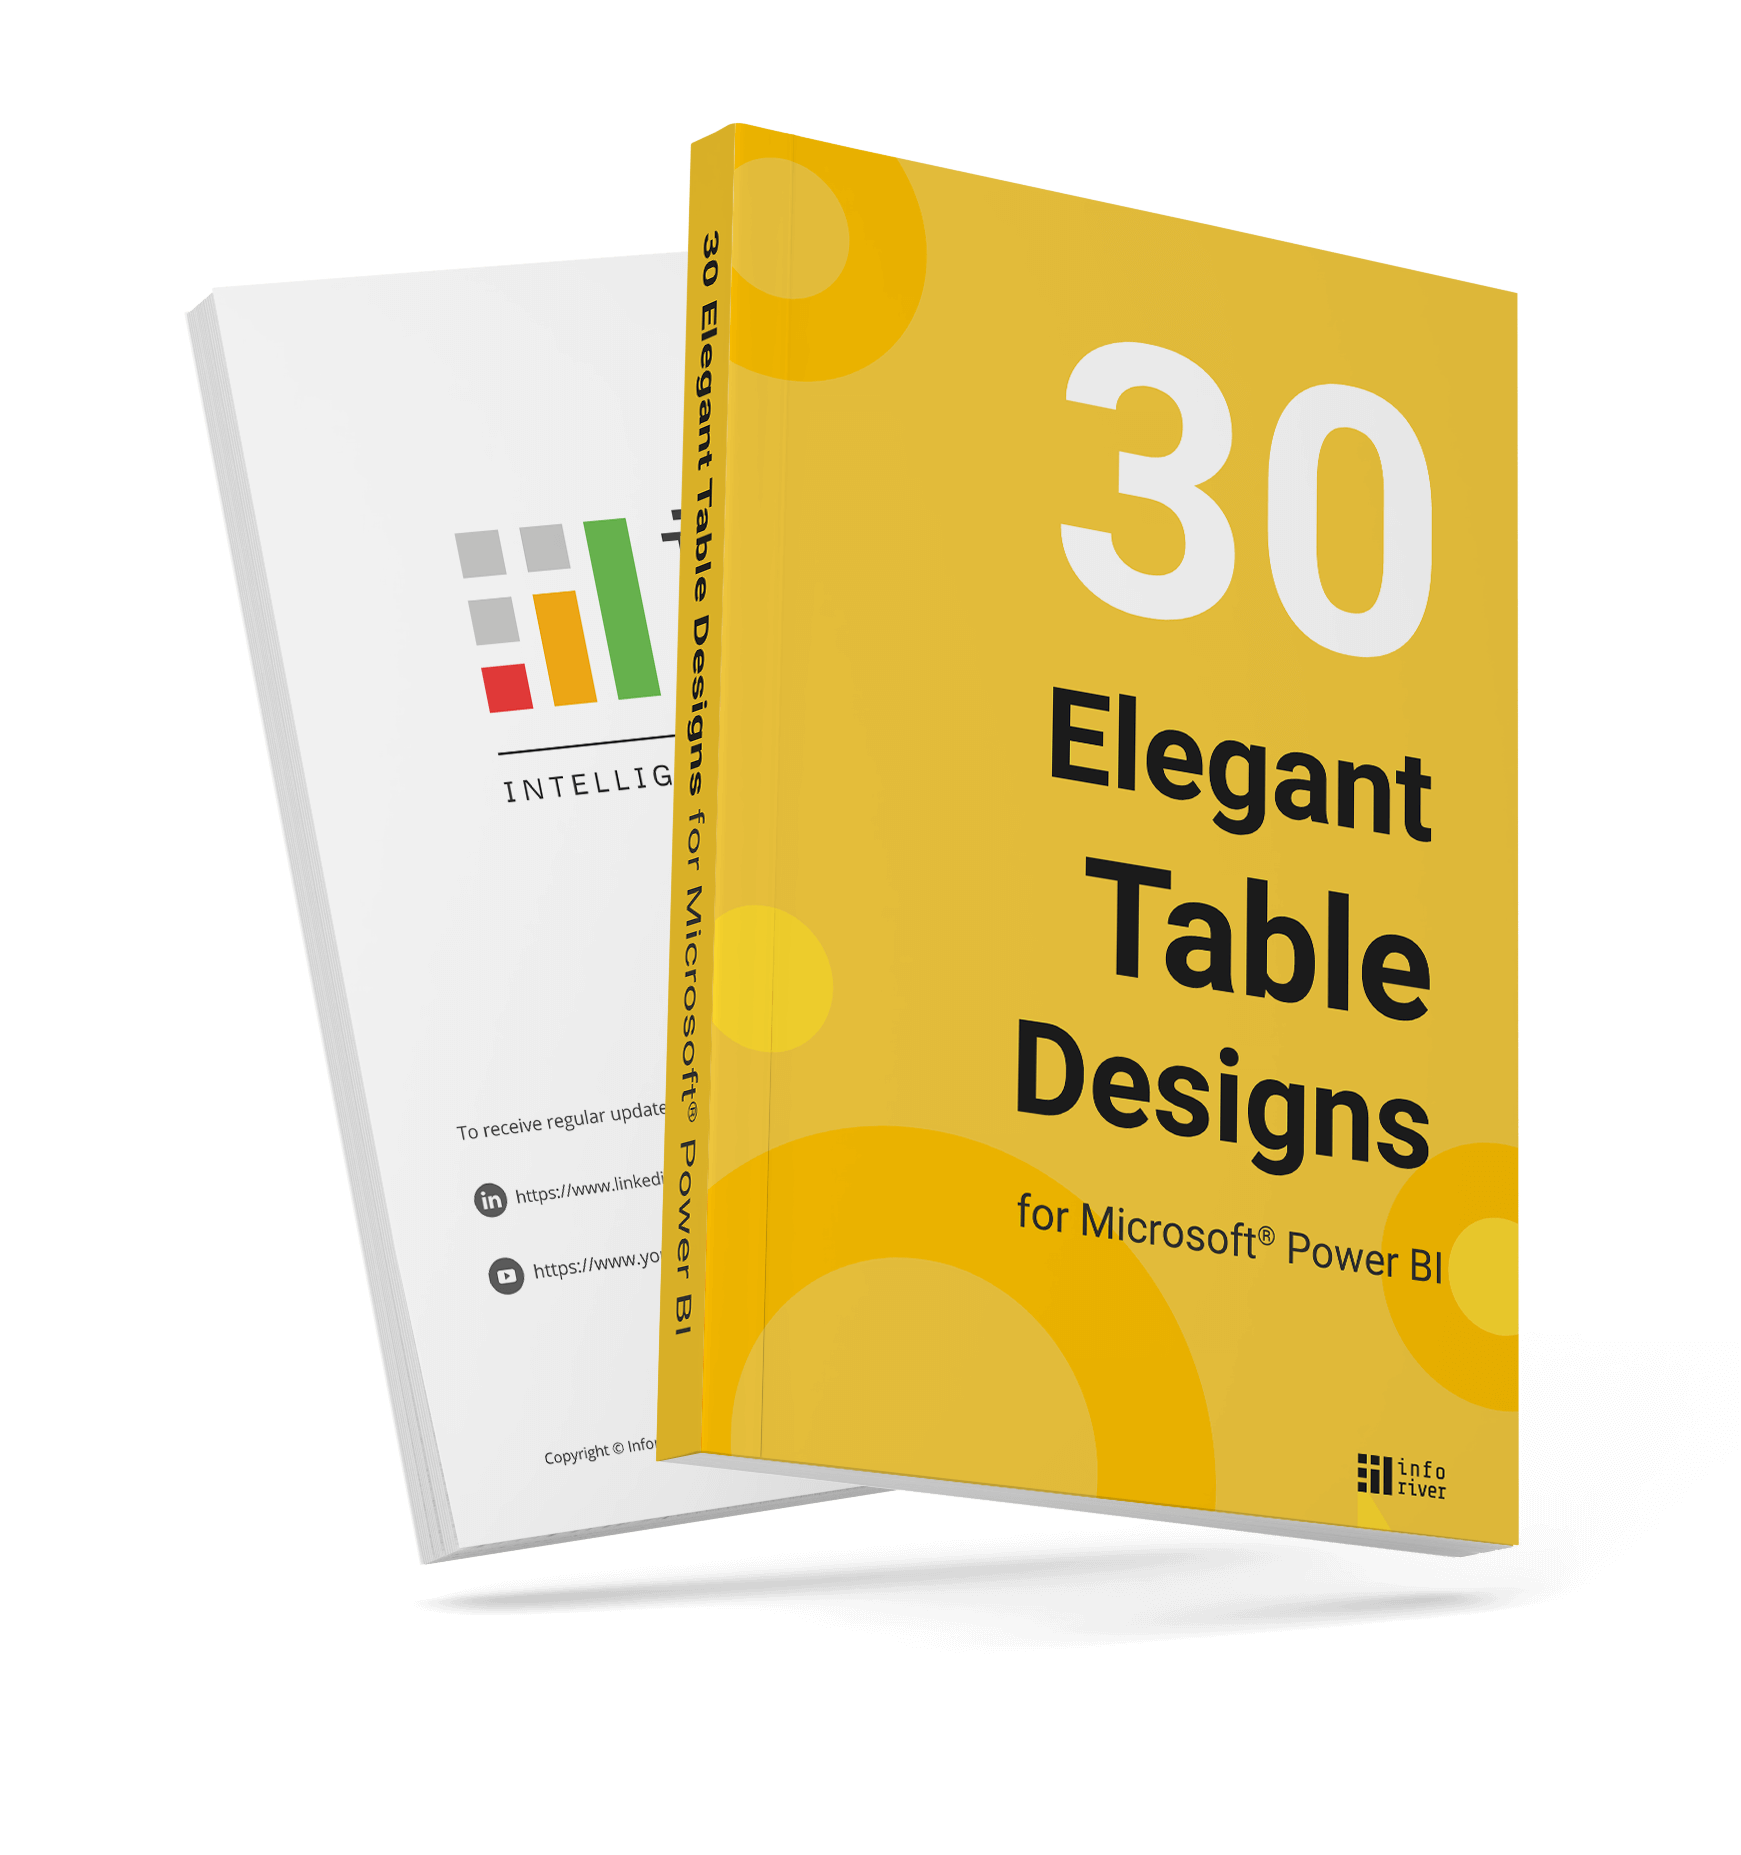
30 elegant table designs for Microsoft Power BI
Explore 30 elegant table designs (and a few bonus designs) that you can recreate in Power BI in less than a minute each without using scripting or DAX (PBIX included)
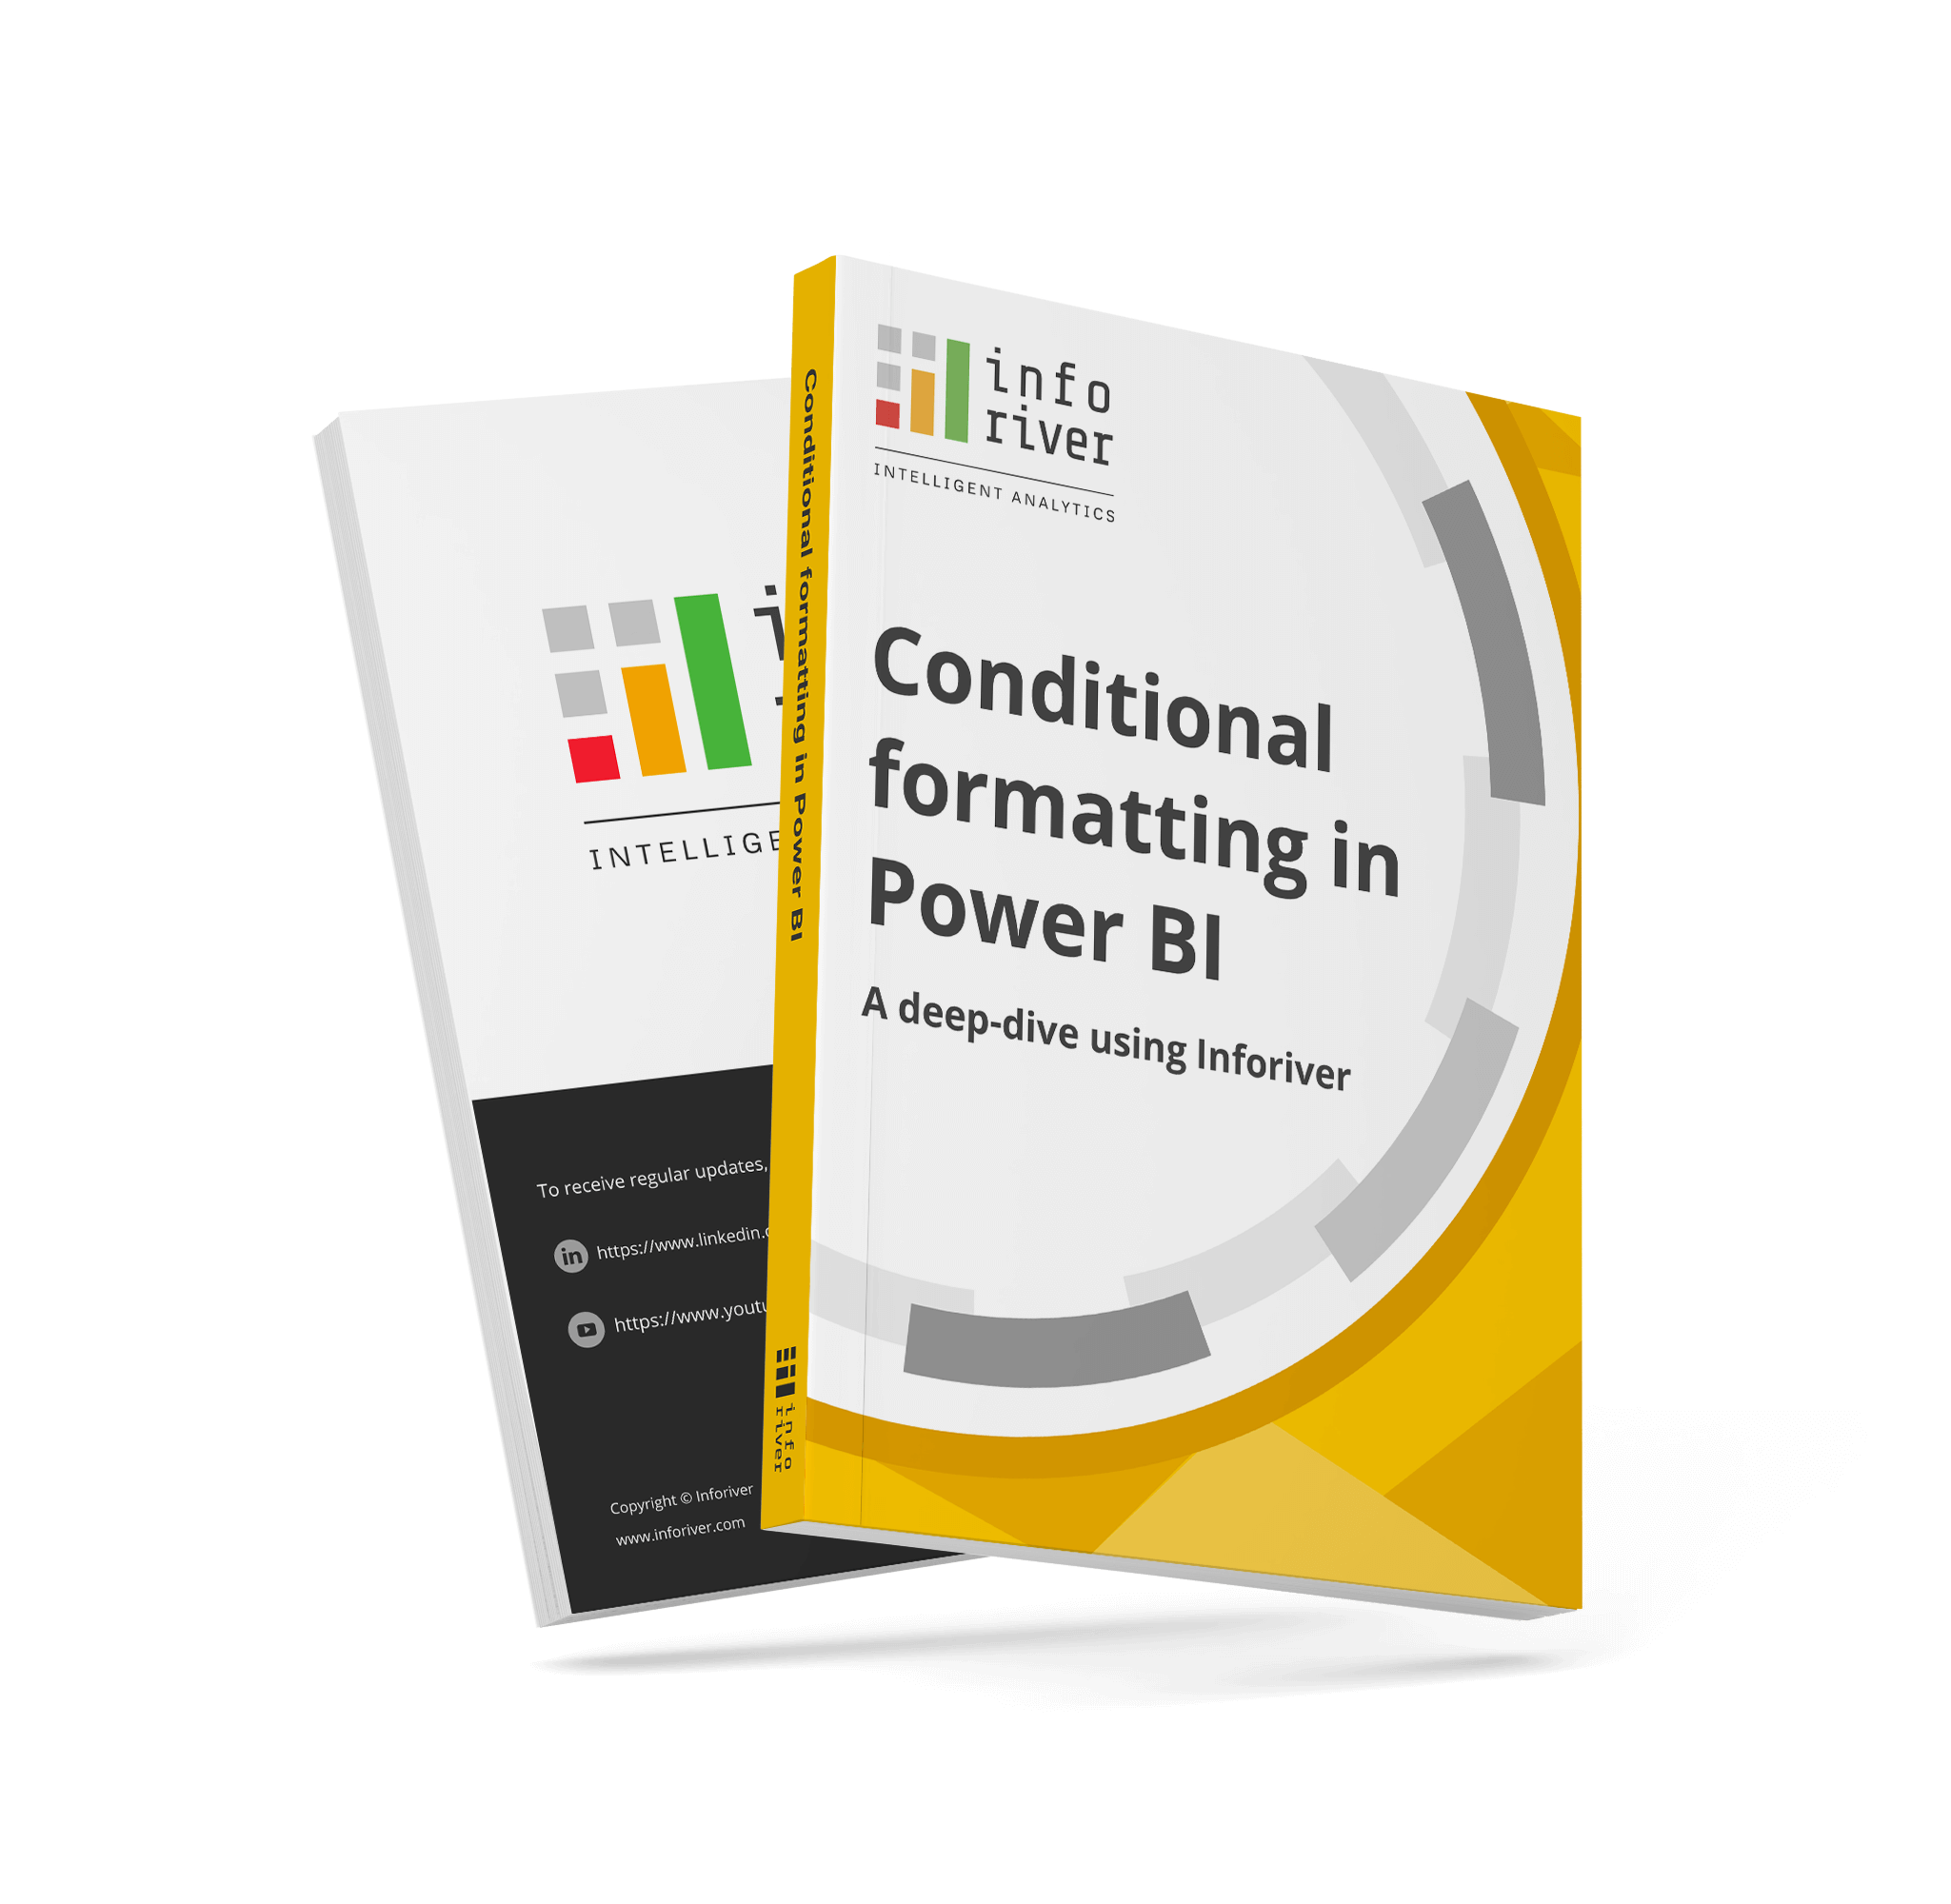
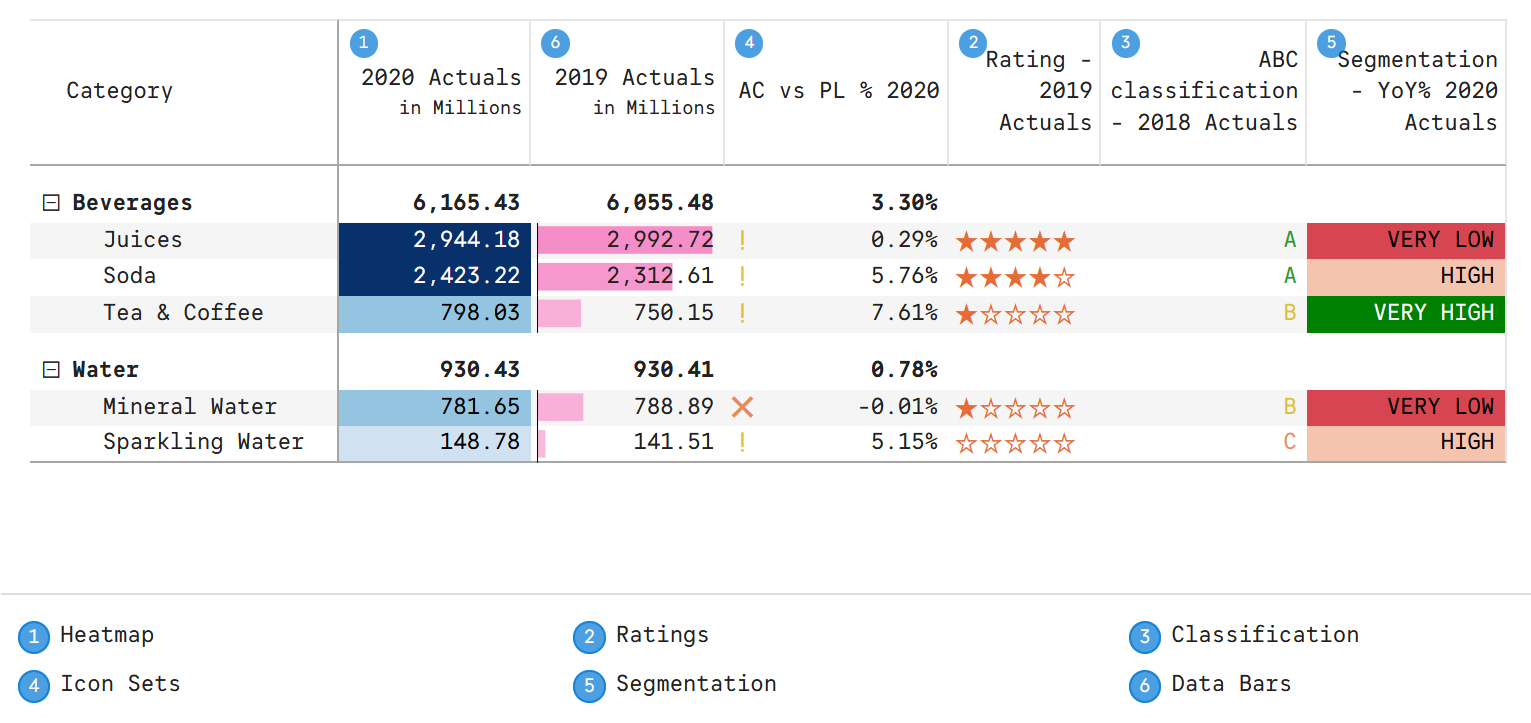
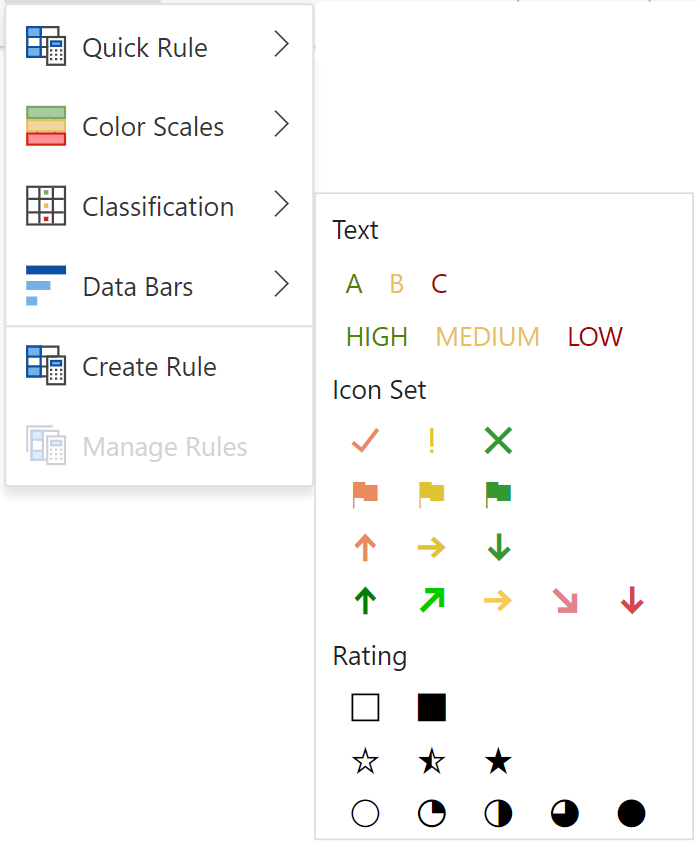
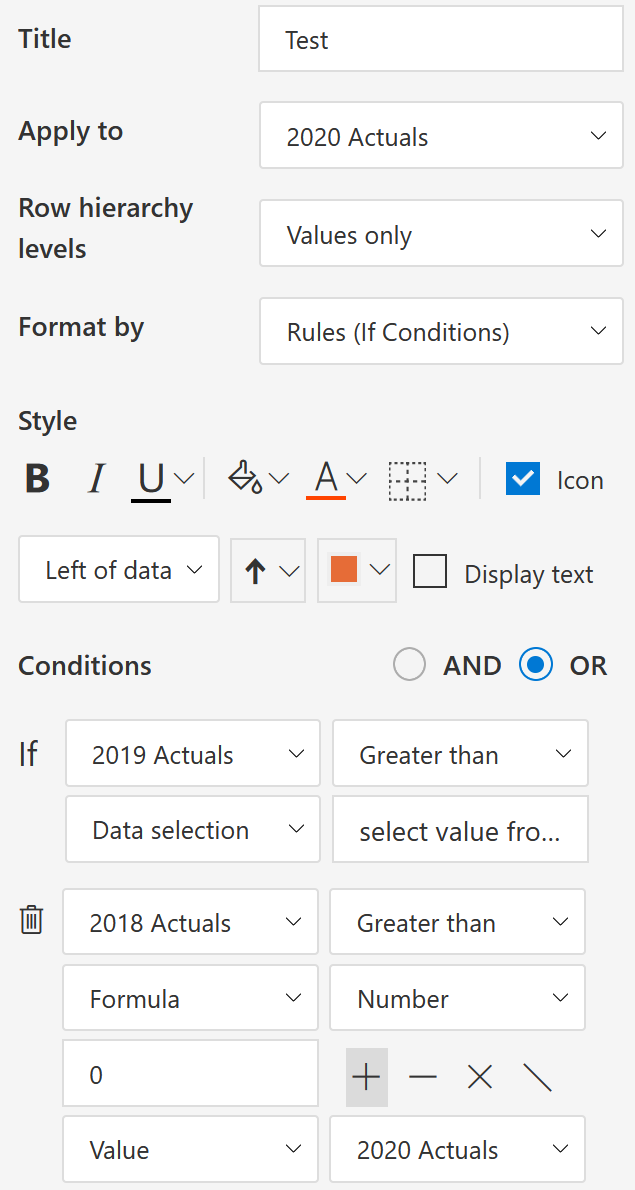
Conditional formatting in Power BI
Learn how to implement powerful Conditional Formatting in Power BI reports with Inforiver. Get this free ebook to discover the full range of formatting capabilities, all without the need for coding or DAX.
14 financial modelling templates for Microsoft Power BI
Explore 14 financial modelling templates that you can create in Power BI without using scripting or DAX.

Learn how you can quickly forecast multiple items with seasonality right inside Power BI!

Register here for a FREE 6-month exclusive access to Reporting Matrix


About Inforiver!
Inforiver is the fastest way to do everything in Power BI. It enables citizen developer productivity and unleashes true self-service with our intuitive and interactive no-code data app suite for Microsoft Power BI. The product is developed by Lumel Technologies Inc, who are #1 Power BI Visuals AppSource Partner serving over 3,000+ customers worldwide with their xViz, Inforiver, and ValQ offerings.


 Join this webinar for a wide-ranging exploration of different chart types and their uses, their role in effective data stories and a LIVE DEMO in Power BI on creating 50+ chart types with in-built storytelling customizations.