Upcoming webinar on 'Inforiver Charts : The fastest way to deliver stories in Power BI', Aug 29th , Monday, 10.30 AM CST. Register Now
Upcoming webinar on 'Inforiver Charts : The fastest way to deliver stories in Power BI', Aug 29th , Monday, 10.30 AM CST. Register Now
Conditional formatting serves multiple purposes in reports and dashboards. It can be used to:

In this document, we will quickly explore various conditional formatting capabilities that you can deliver in your Power BI reports. These capabilities can be accessed from the toolbar in Inforiver, and they can be implemented in a few clicks without any need for coding or DAX.
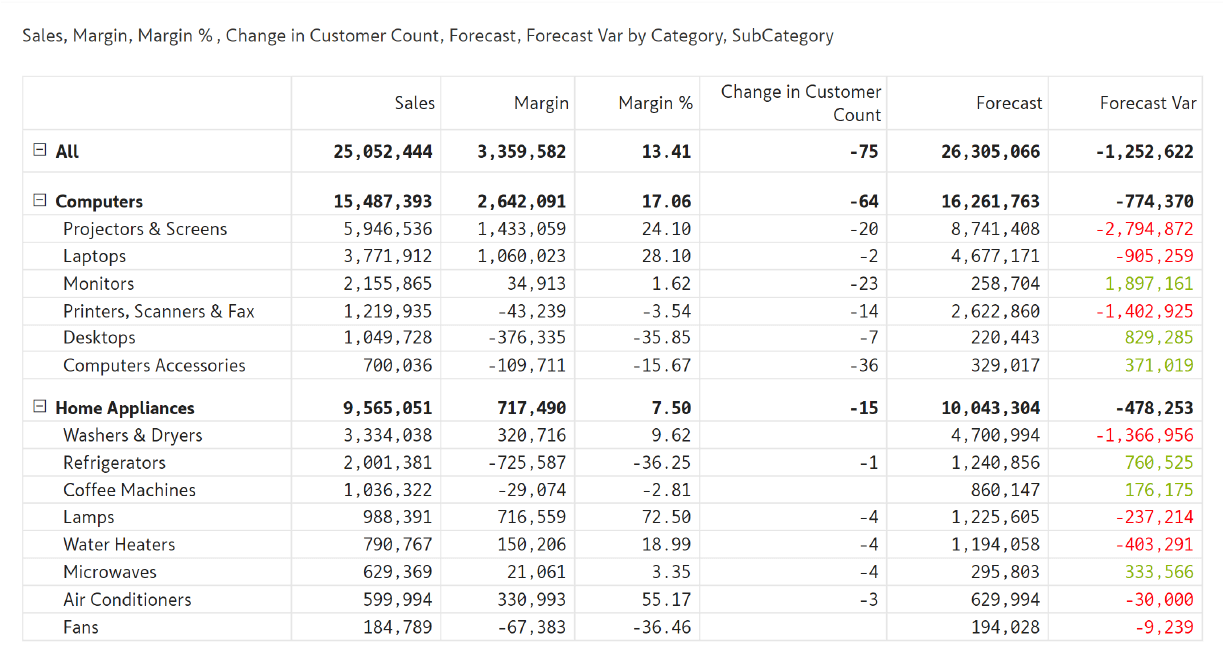
Quickly highlight positive and negative values in a row or a column.
You can achieve this formatting by clicking on Conditional Formatting --> Quick Rule from the menu.
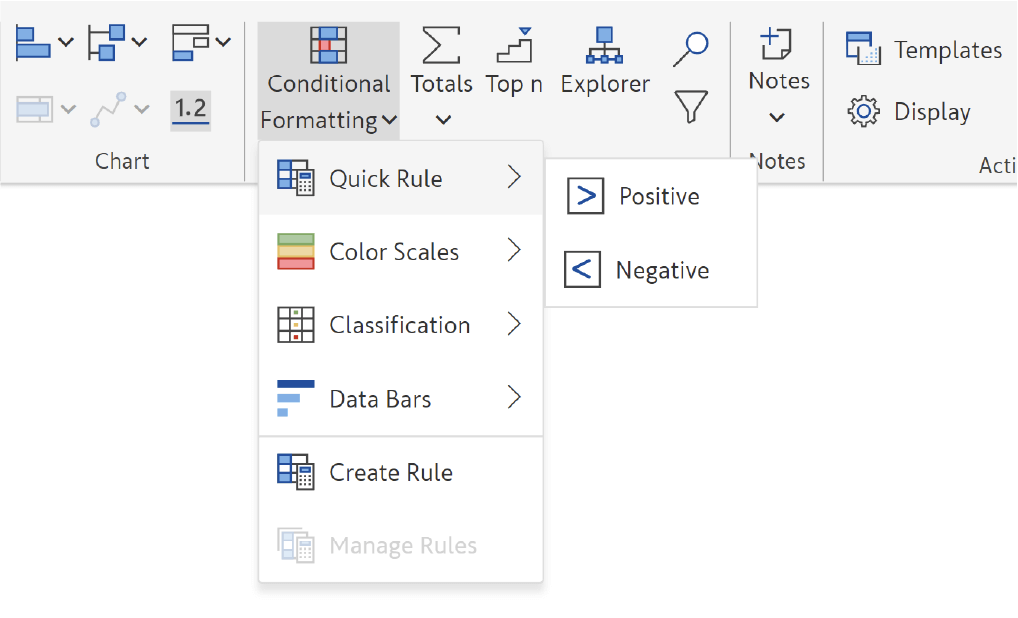
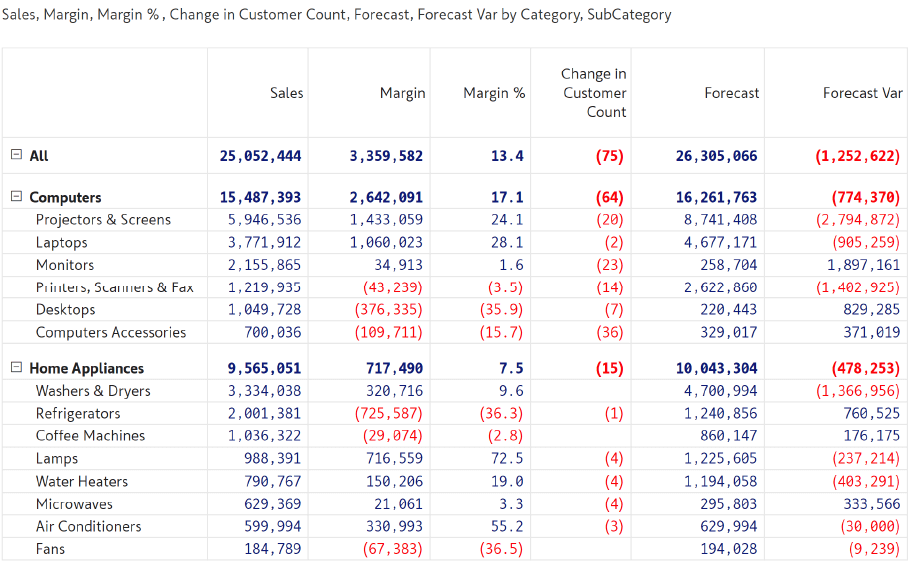
Apply quick rules to your entire table with just one click, without the need to create multiple rules for each column.
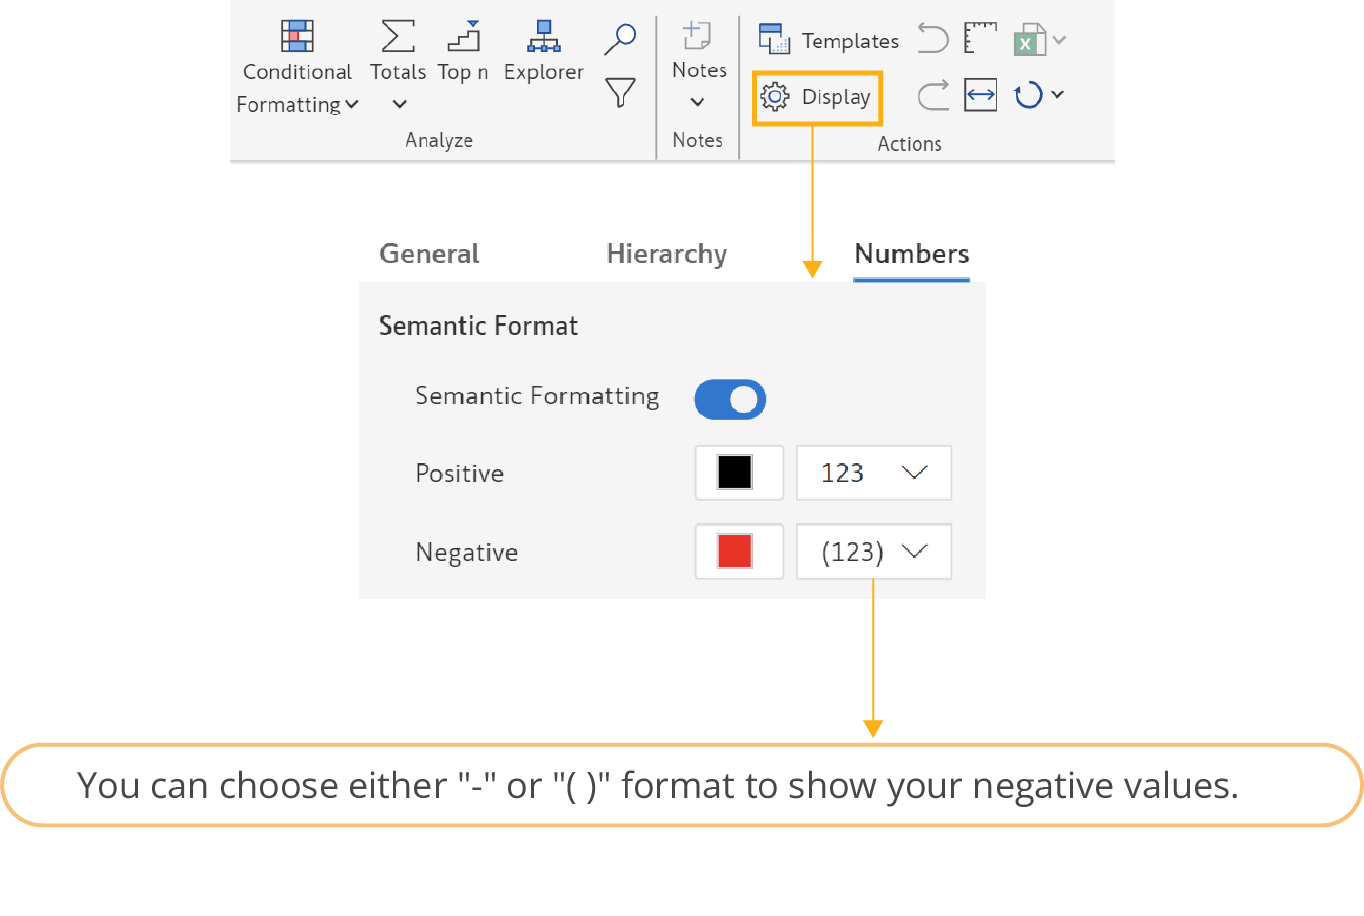
For example, this table is formatted to display negative values in "()" and positive values in blue.
To apply Semantic Formatting Click on Display --> select “Numbers”.
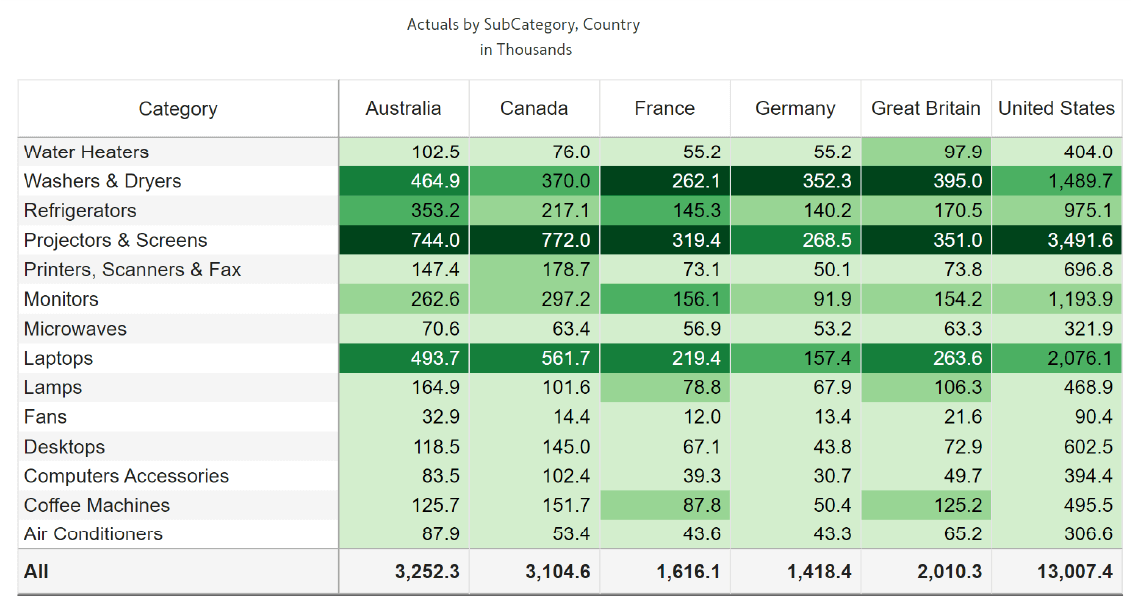
Take a closer look at this table displaying sales data for six different countries. The sales values are highlighted using a color scale.
If you observe closely, you will realize that the color scale is applied to each column individually (using a single rule) to rank category performance within each country.
Note that the font colors automatically switch to white when the background color gets darker, ensuring maximum readability and clarity for the reader.
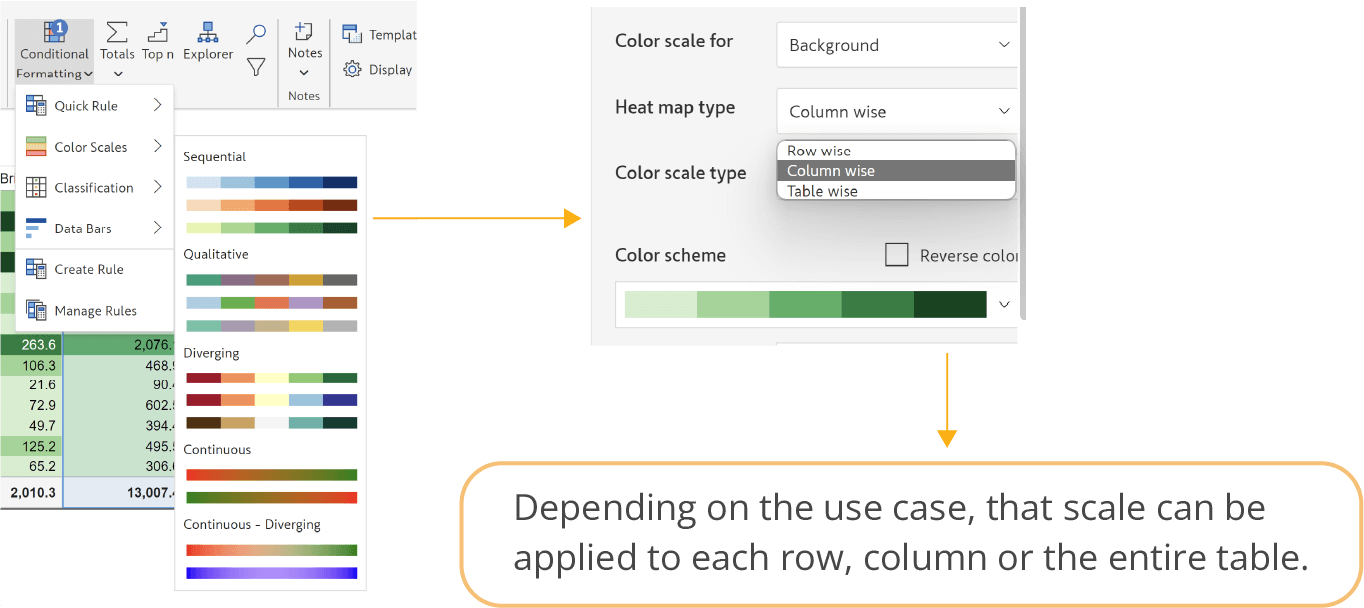
You can apply this heatmap formatting by clicking on conditional formatting --> Color Scales.
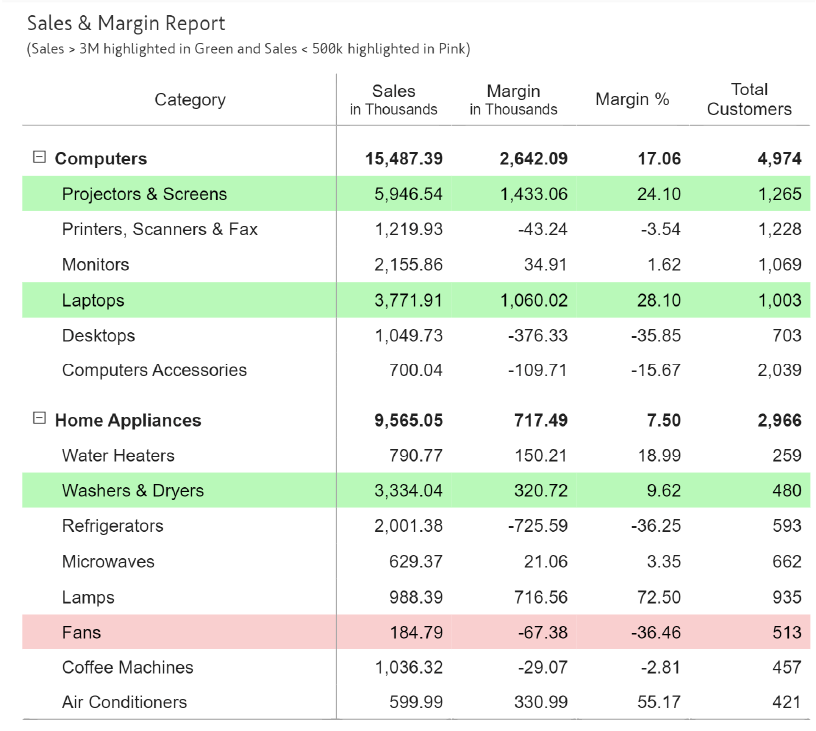
Here is a sales and margin report that highlights specific rows. The rows in green
correspond to sales > 3M and the rows in red correspond to sales < 500k.
To improve user experience, row height has been increased slightly to provide more space.
You can deliver such a report in two ways: through dynamic conditional formatting, or simple, static, cell-level formatting as you do in Excel.
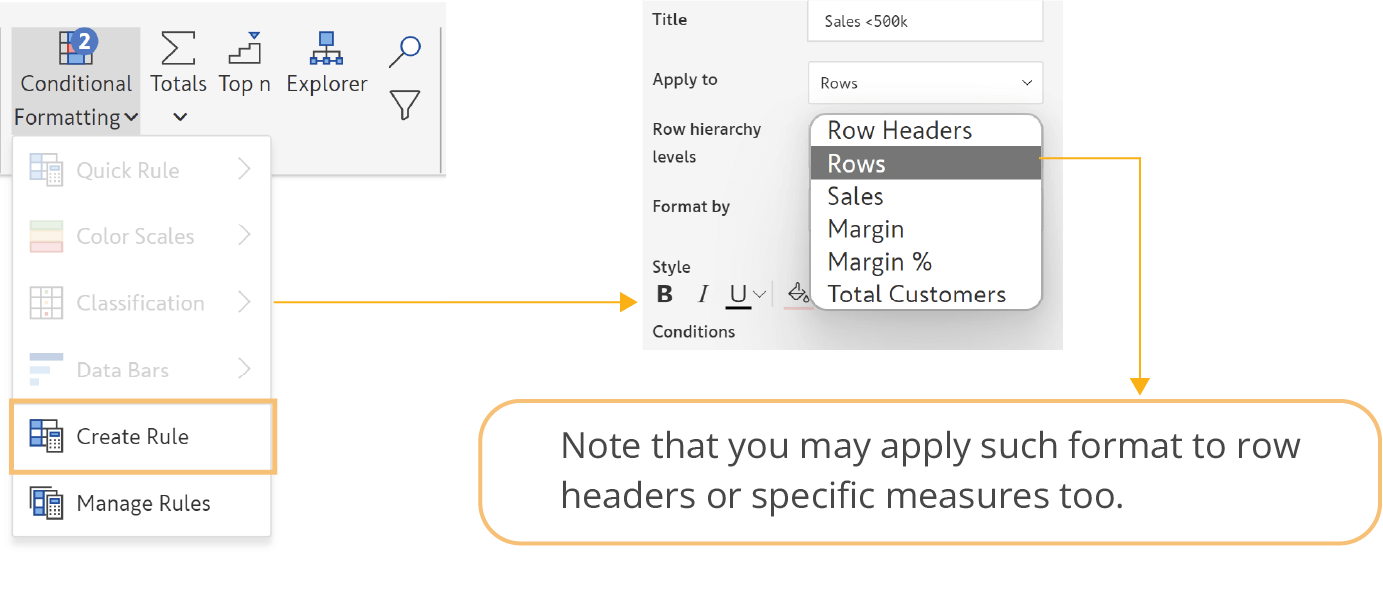
The choice ultimately depends on your specific use case and requirements. To do this through conditional formatting, click on Create Rule, and set ‘Apply to’ to Rows.
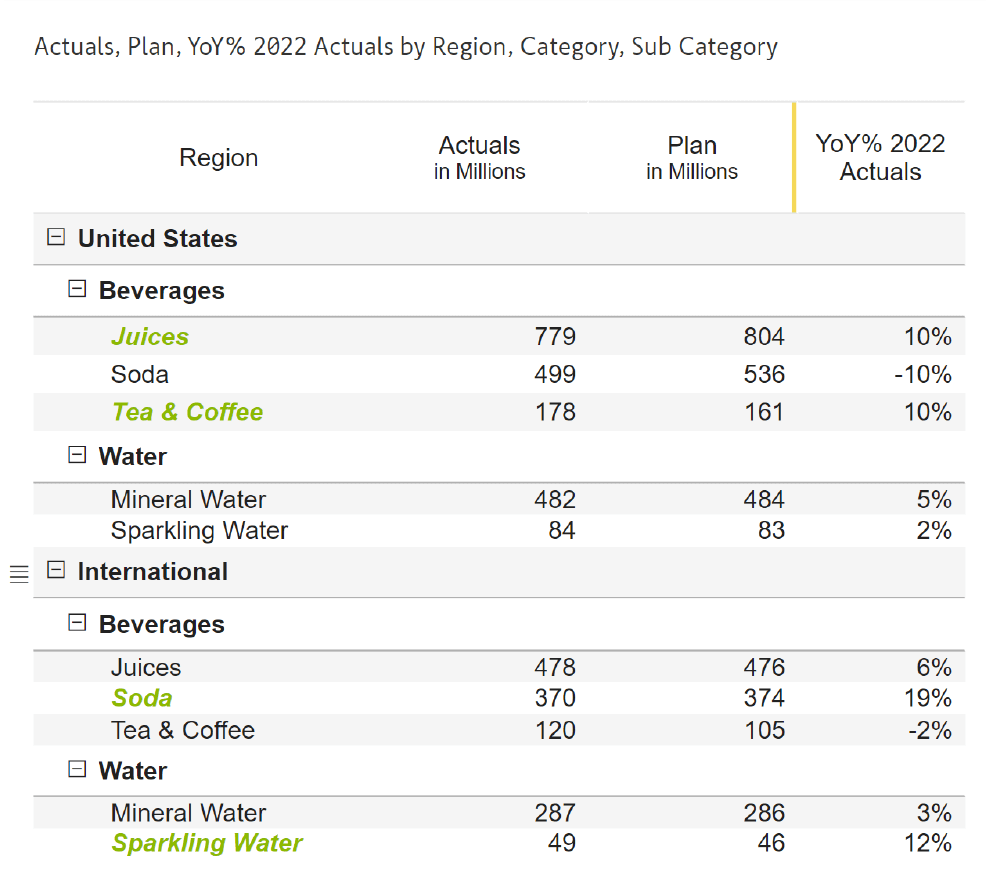
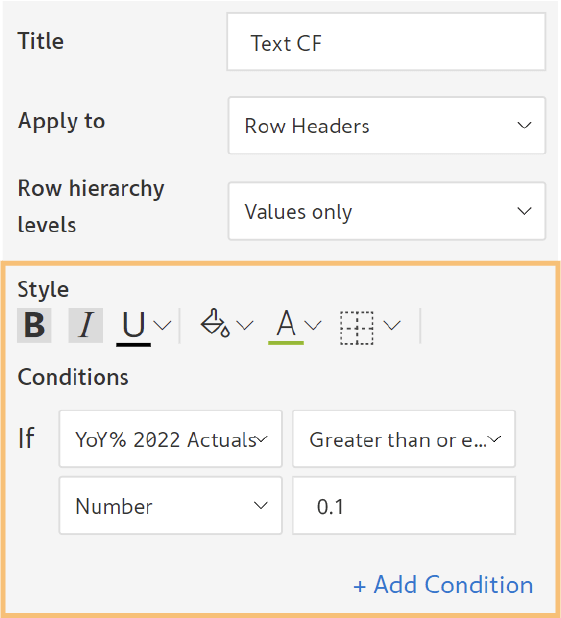
This is similar to the previous example. However, we have set the ‘Apply to’ to Row Headers as shown below.
We are targeting items whose YoY% growth is greater than or equal to 10%.
Note that we are also formatting the text in green, with the font bold and italicized.
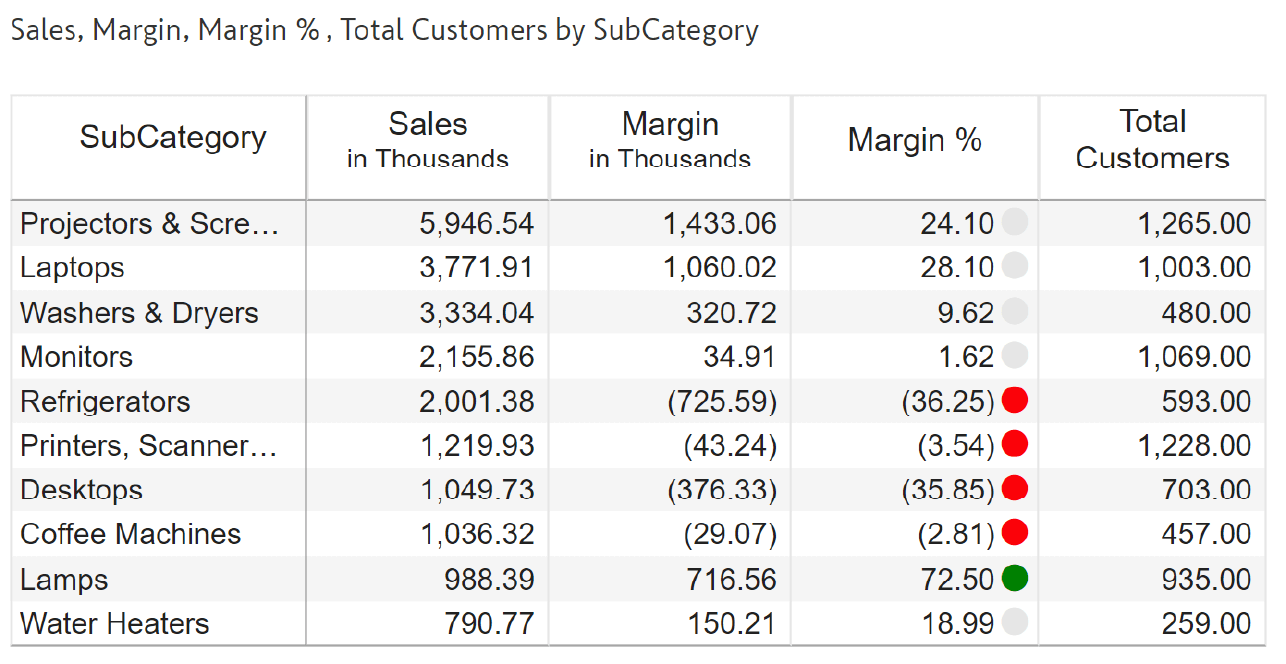
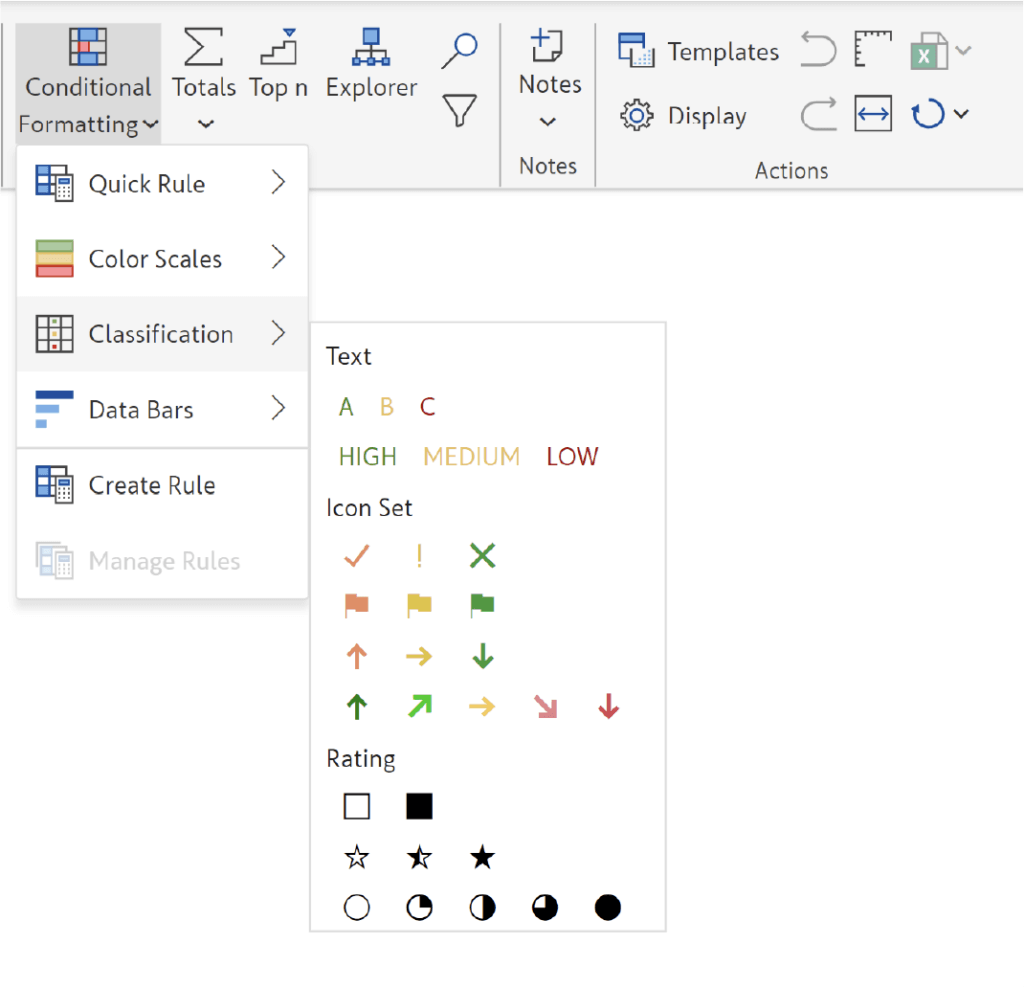
You can also conditionally format the data with icons based on where they fall in a range of values (or percentage).
In this template, we've colored the moderate-performing % margin items in gray, allowing the extremes in red and green to stand out.
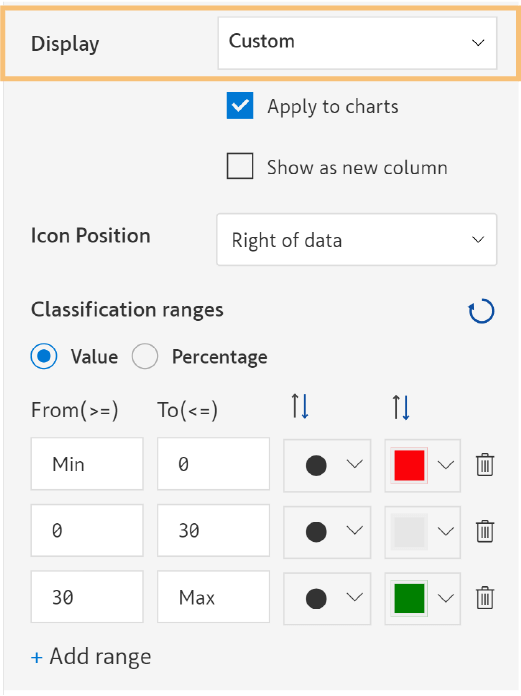
Use the custom display option to implement such formats. You could customize icons and colors as shown below.
This table shows a ‘circle fill’ alert to indicate high-margin categories. Sales is formatted based on the Margin.
To implement this, set the Display field to ‘circle fill’ as shown below. Though the image shows five circles, the ‘Number of ranges’ is set to 1.
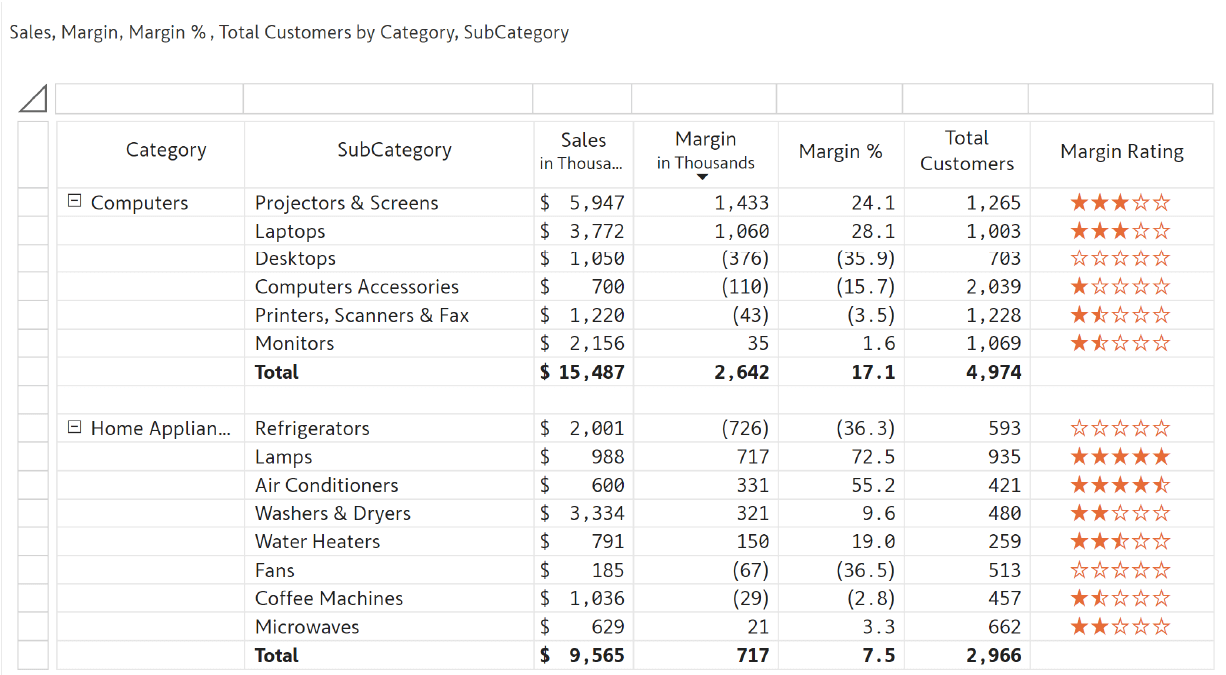
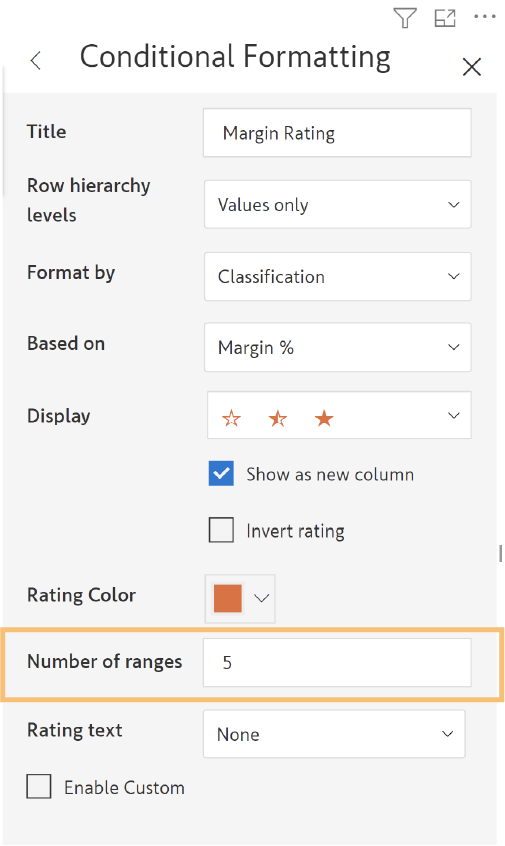
In this report, we are displaying 5-star ratings in a separate column. These star ratings are based on Margin % and are a fantastic way to represent feedback from users or survey respondents. To implement this, choose the appropriate icon, set ‘Number of ranges’ to 5.
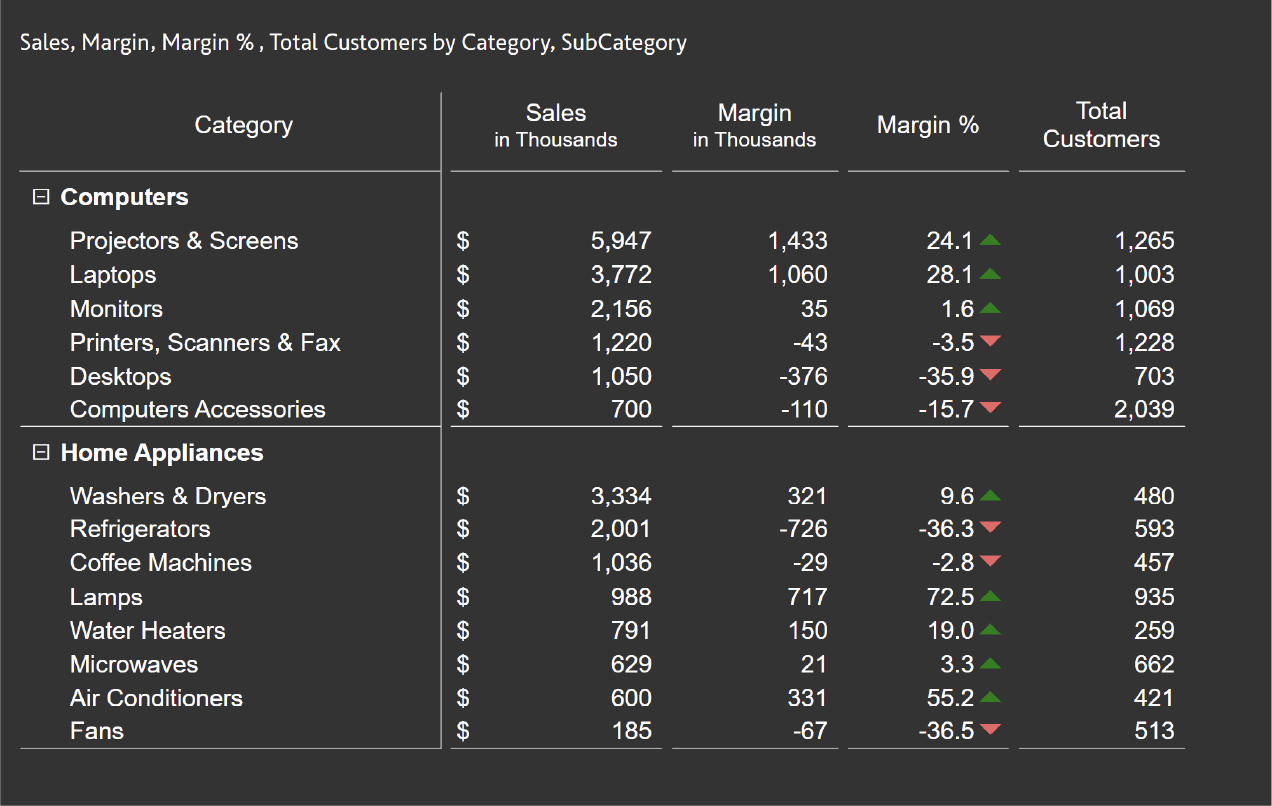
This is very similar to #6, where we’ve used arrows instead of traffic lights.
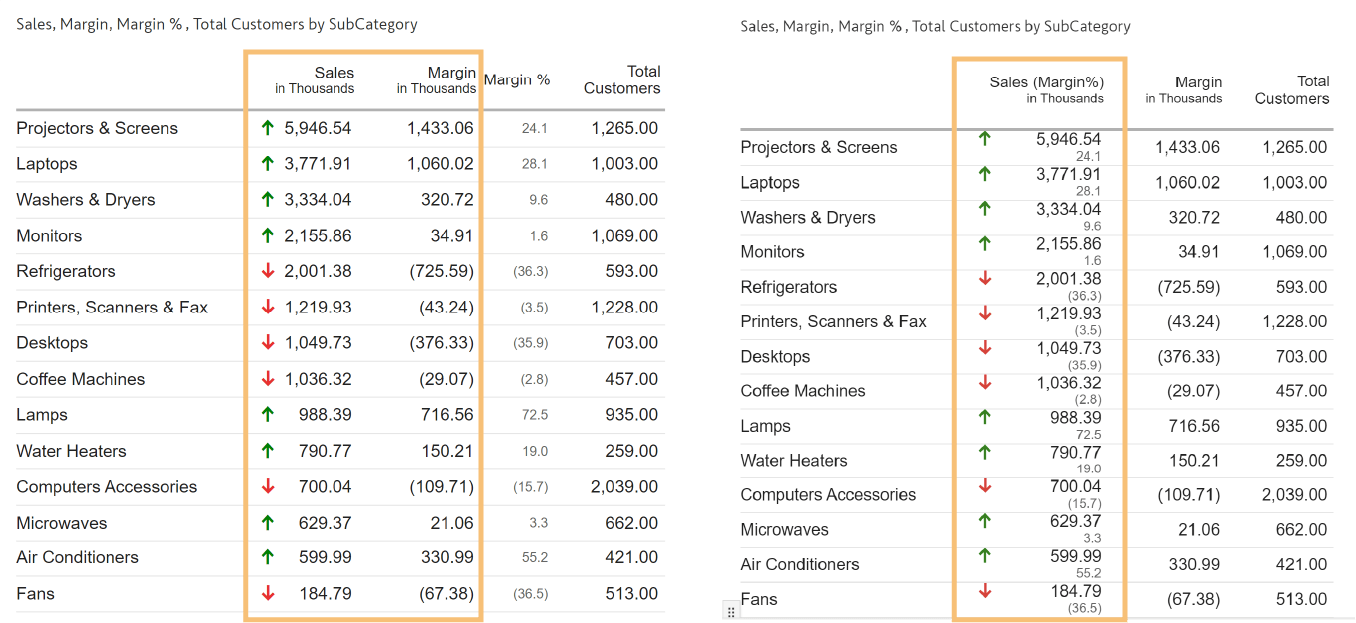
Have you ever encountered the challenge of needing to view margin % in the context of sales, but don't want to clutter your report with additional columns?
In Inforiver, you can use the 'Blend' feature to seamlessly combine any two contextually relevant columns.
To blend columns, go to insert tab and click on Blend.
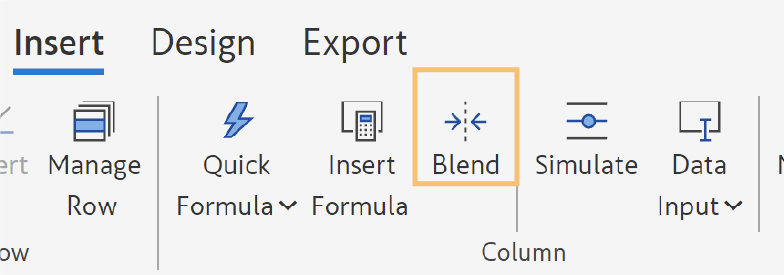
This option will allow you to blend the sales and margin % columns.
Once you blend the columns, you can hide the original columns. The conditional formatting used in the original column(s) carries over to the new blended column.
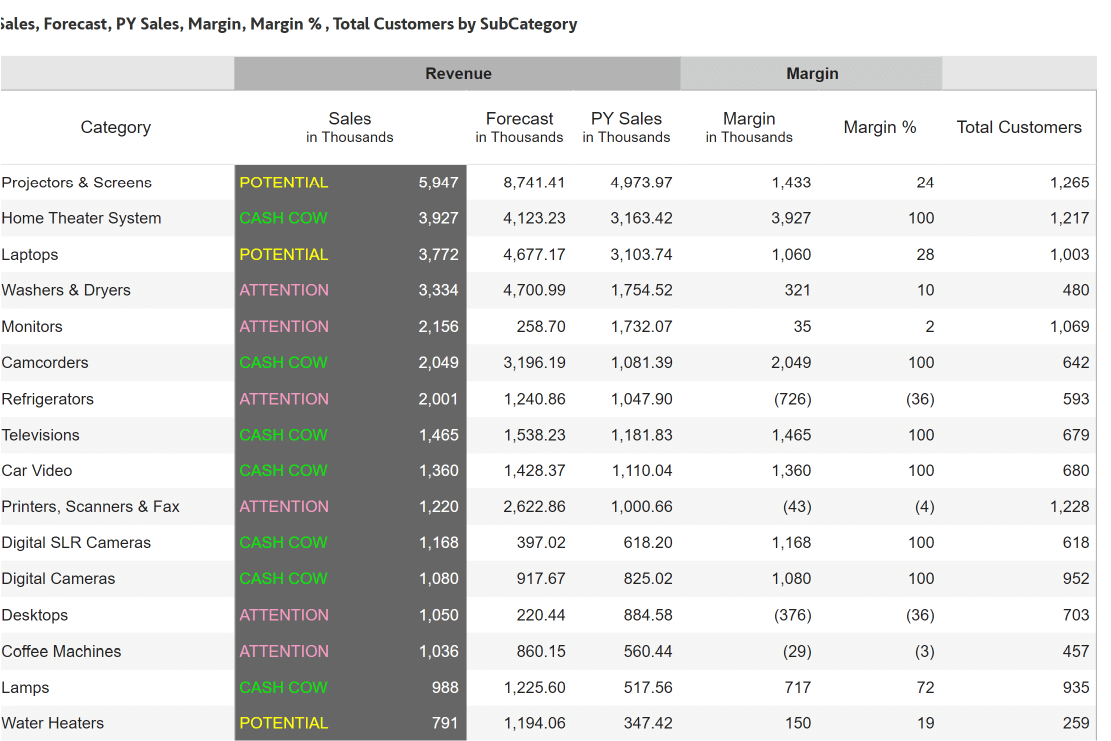
Unlike traditional conditional formatting using icons, you can dynamically segment your data based on classification ranges.
For example, this table creates classification ranges based on margin % and then assigns a customizable label to each bucket, such as 'Attention', 'Potential', and 'Cash cow'.
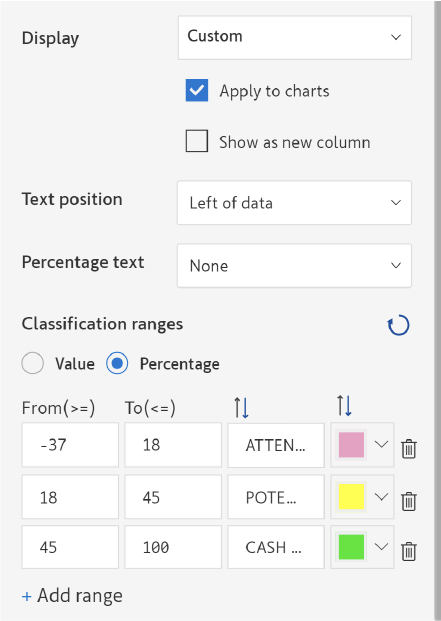
To segment your data, you can easily create custom classification ranges as shown below.
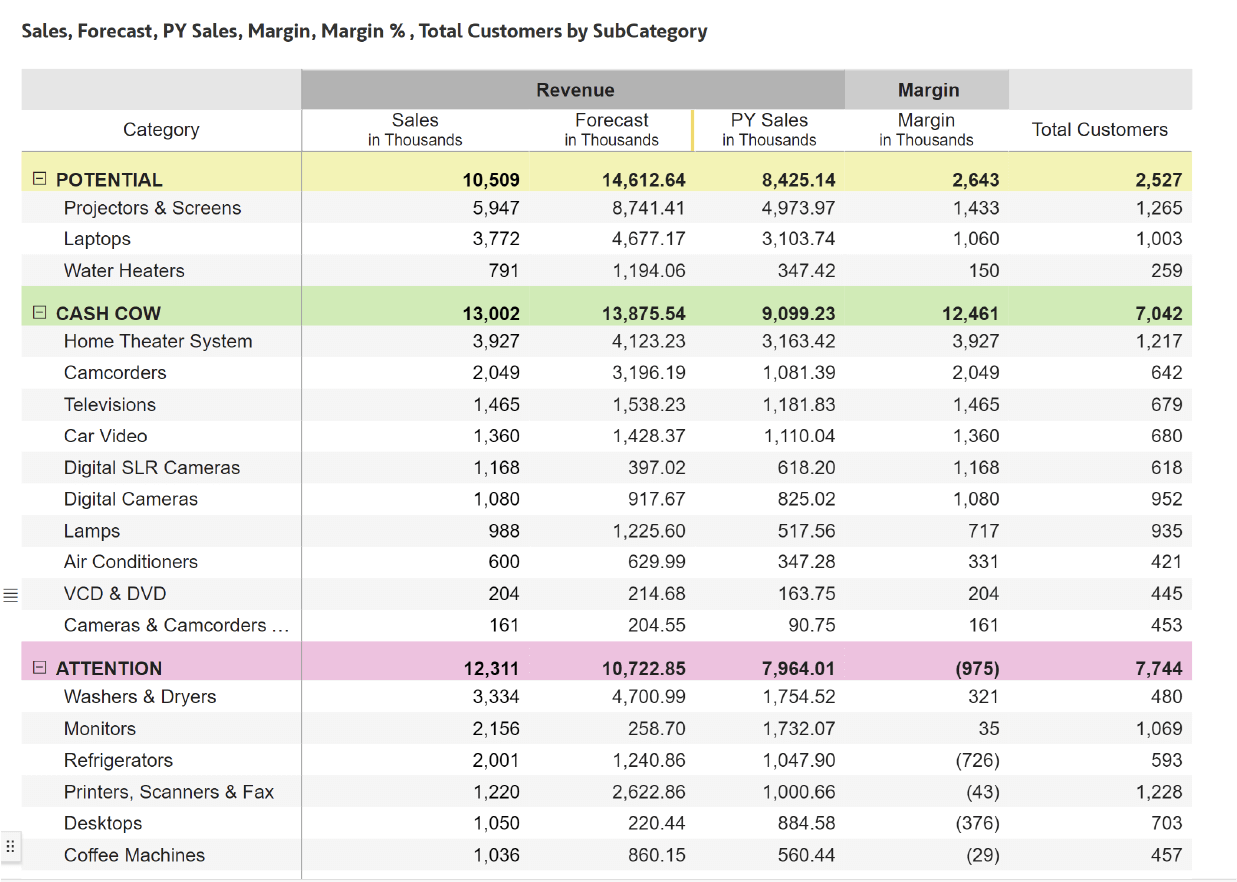
This example builds on top of the previous example and it groups the segments (Potential, Cash cow & Attention) into an expand-collapse enabled hierarchy.
To group such segments, go to the Insert tab click on Group, and select the name of the conditional formatting rule (in our case, ‘ABC Segment’).

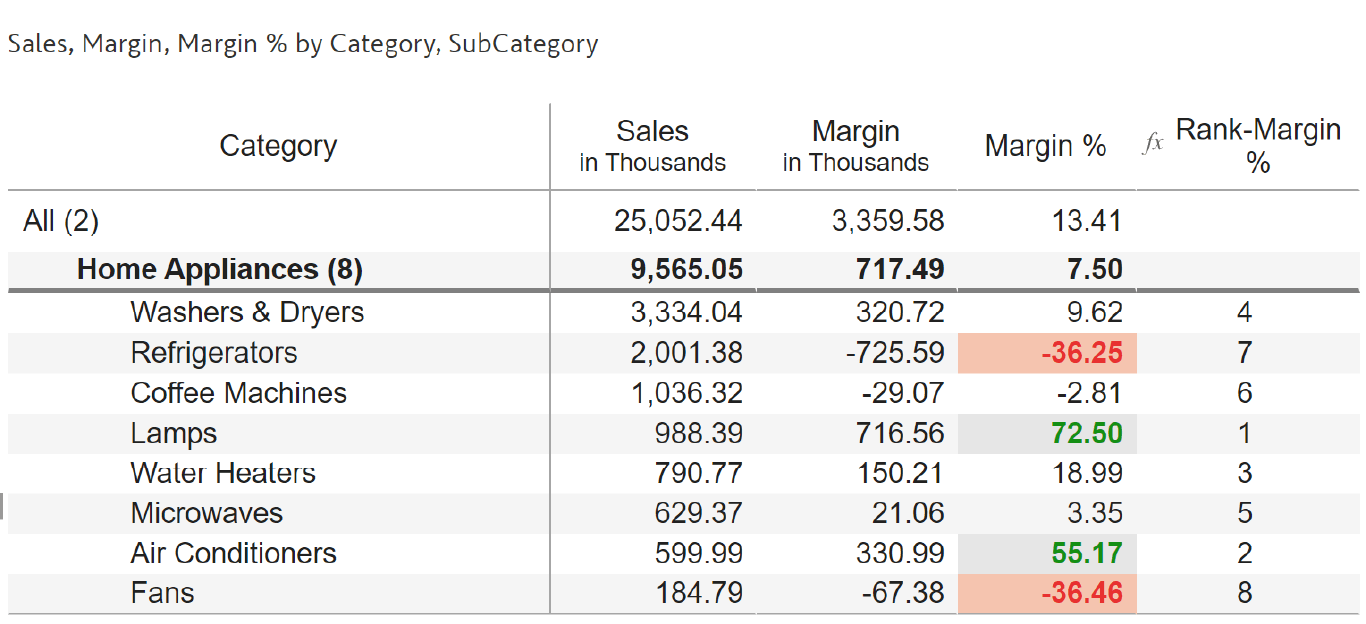
Have you ever needed to highlight only the top N/bottom N performing items in your report?
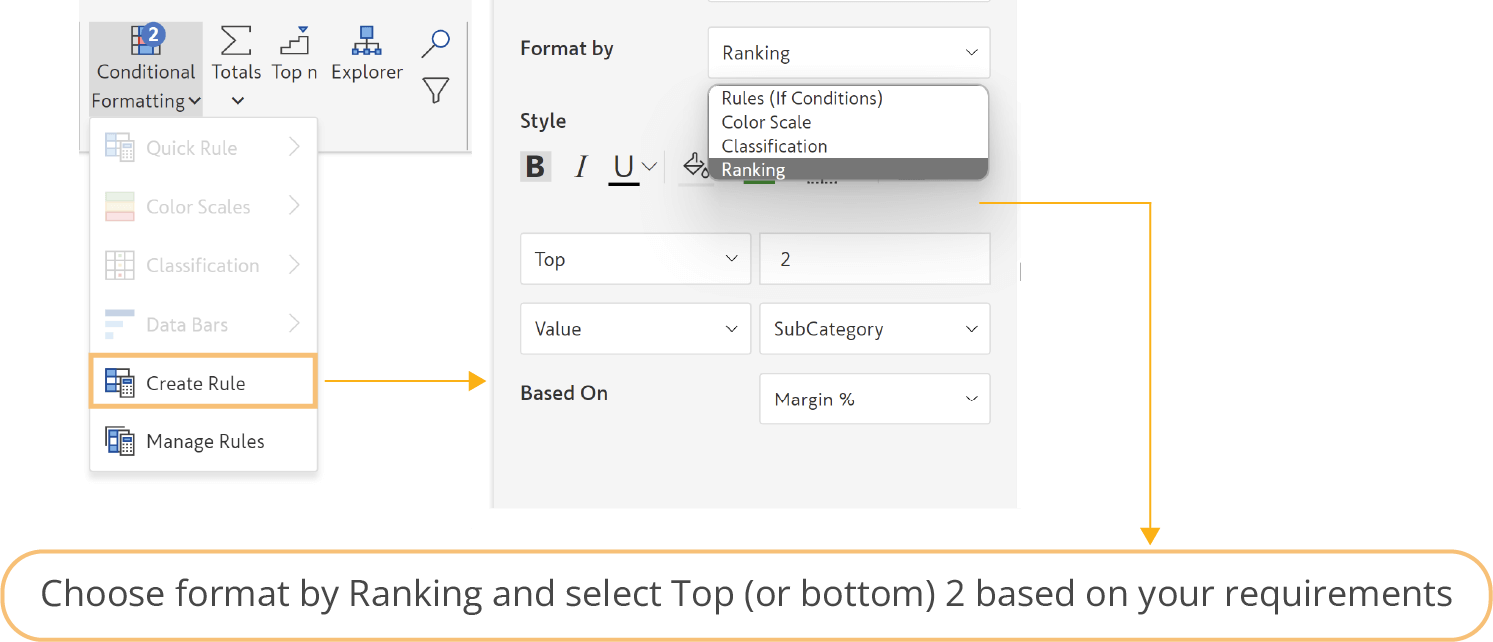
Inforiver makes it easy to rank and identify those values, even at the category and sub-category level! You can even customize the value and background colors to make the top N/bottom N performers visually stand out.
In this example, we are highlighting the top 2 and bottom 2 sub-categories in greenand red respectively.
To apply this formatting, Go to conditional formatting --> create a rule.
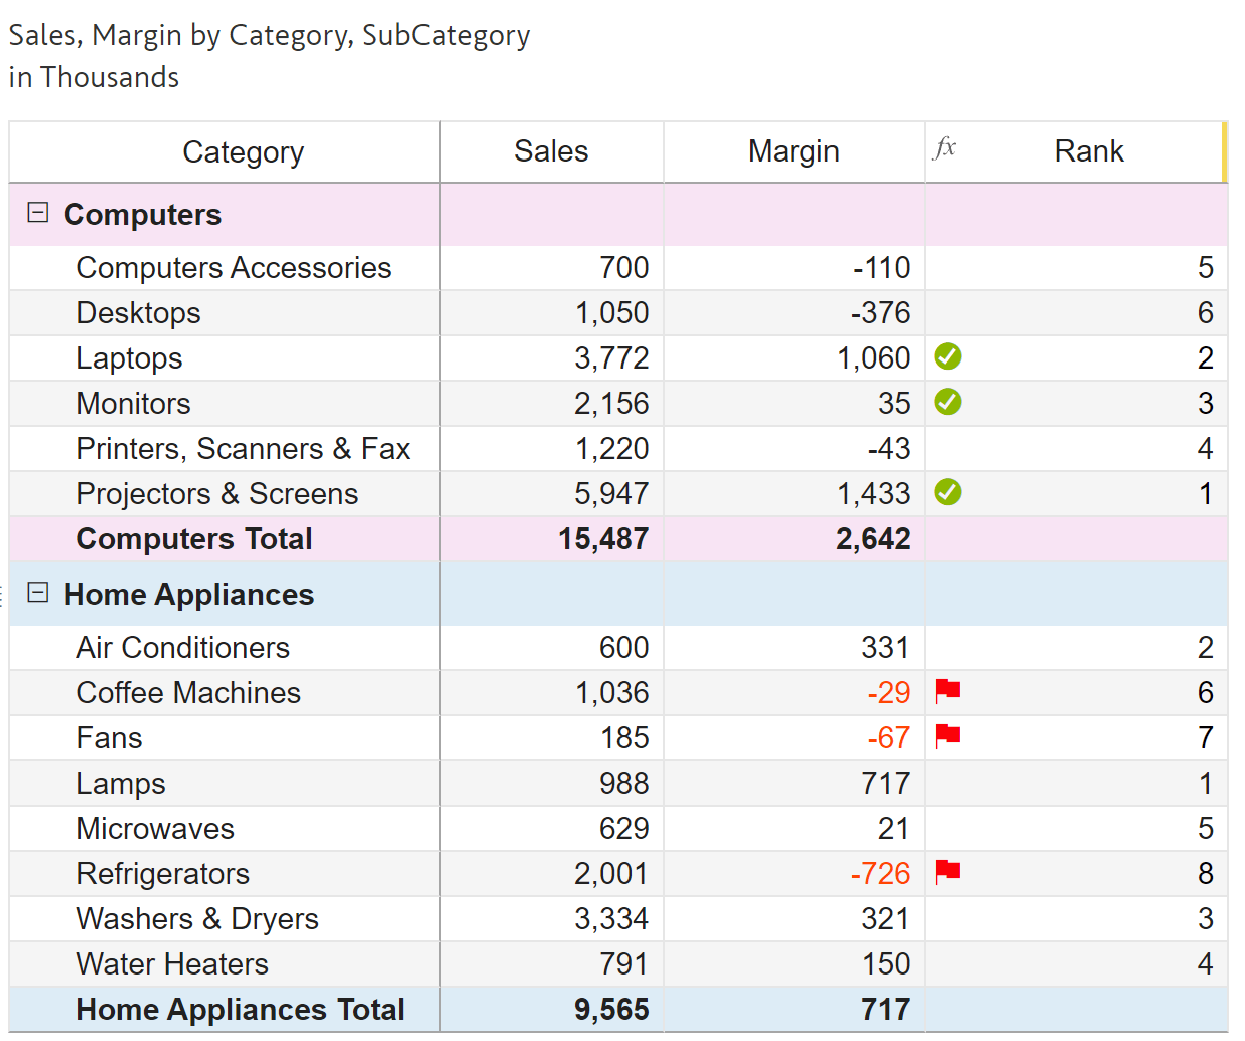
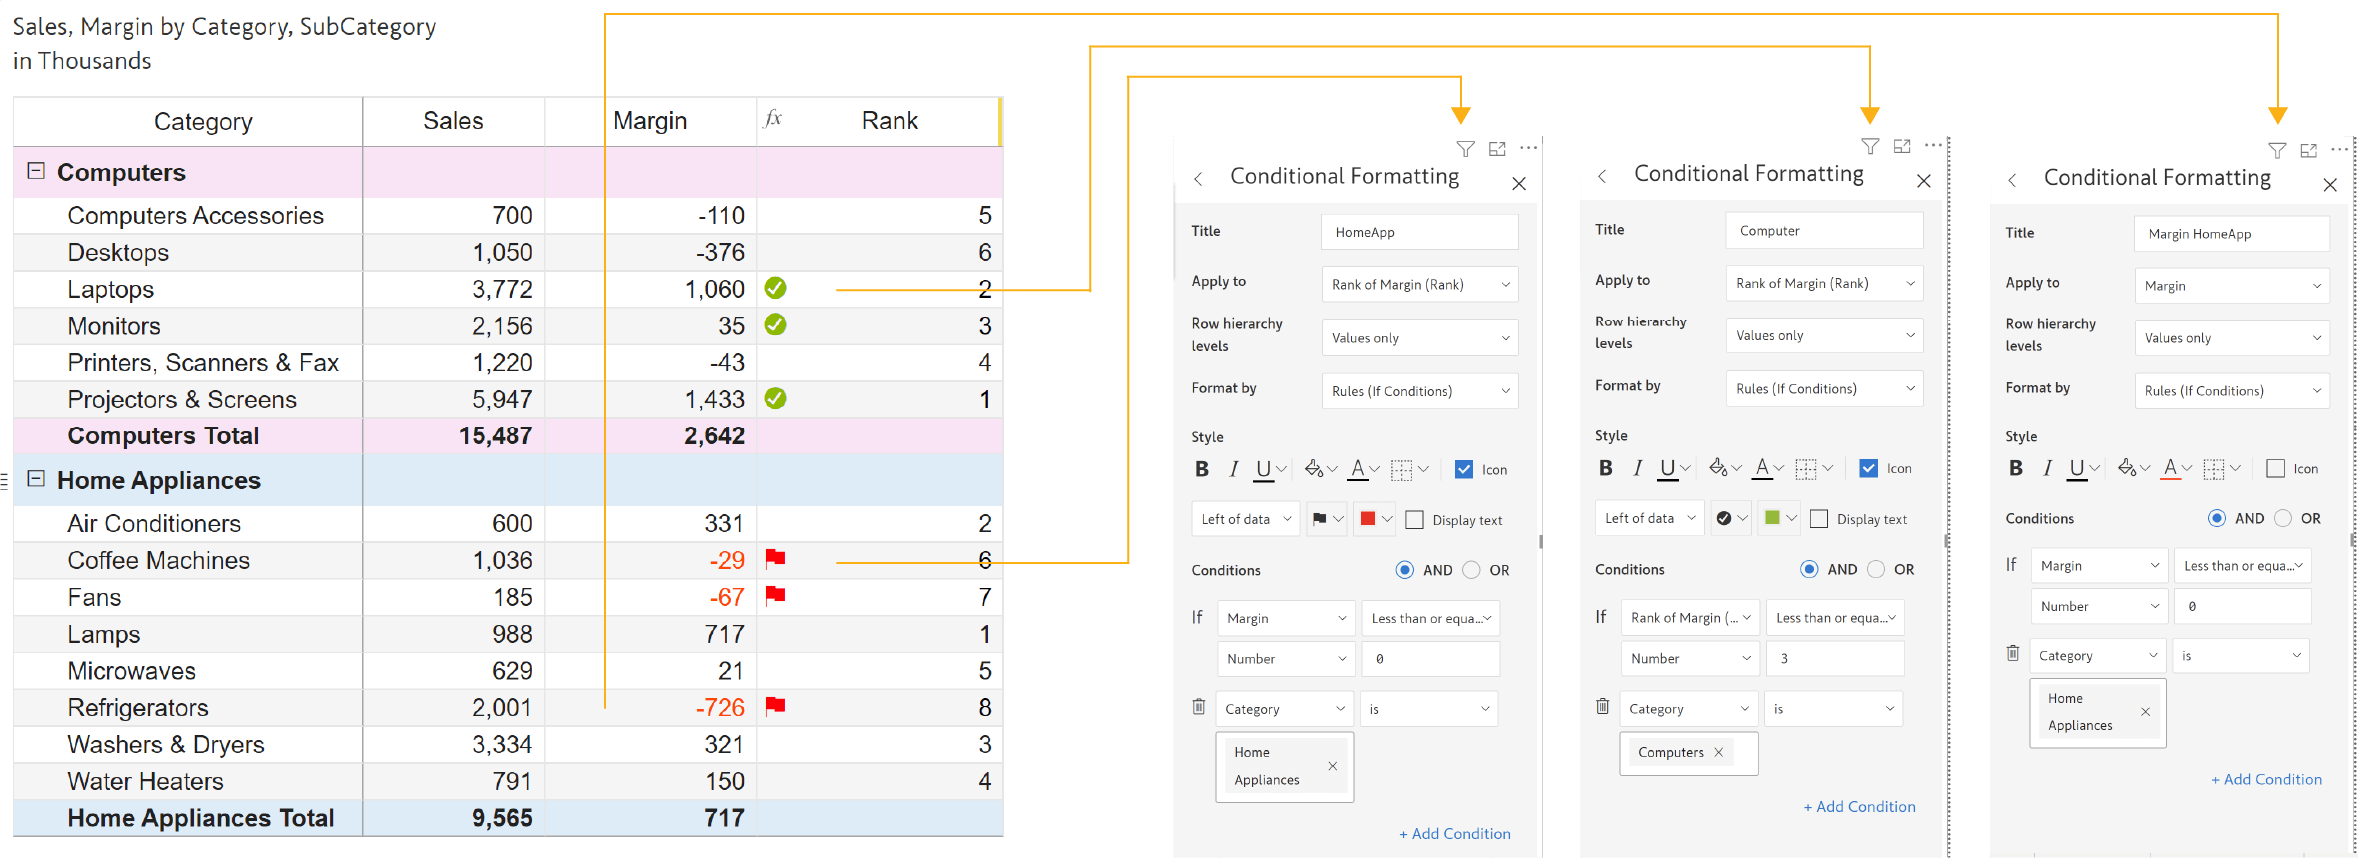
In this example, we've taken things a few notches up by implementing conditional formatting at a branch level.
Notice how the computers category highlights the top three performers in green, while the Home Appliances category paints the negative margins in red, while also adding a red flag in the last column.
You need three separate rules for this table (with one just used to highlight negative numbers). All rules will have an AND condition that states Category = ‘Home Appliances’ or Category =’Computers’.
Here's how its implemented:
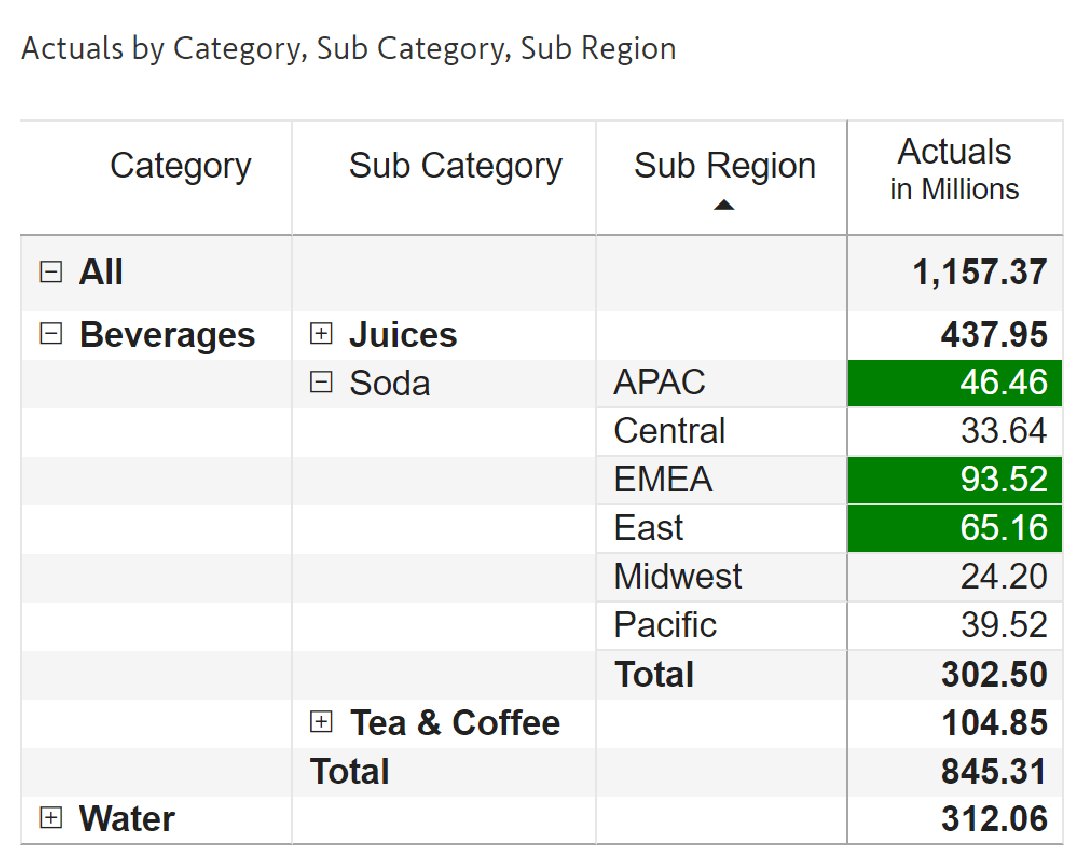
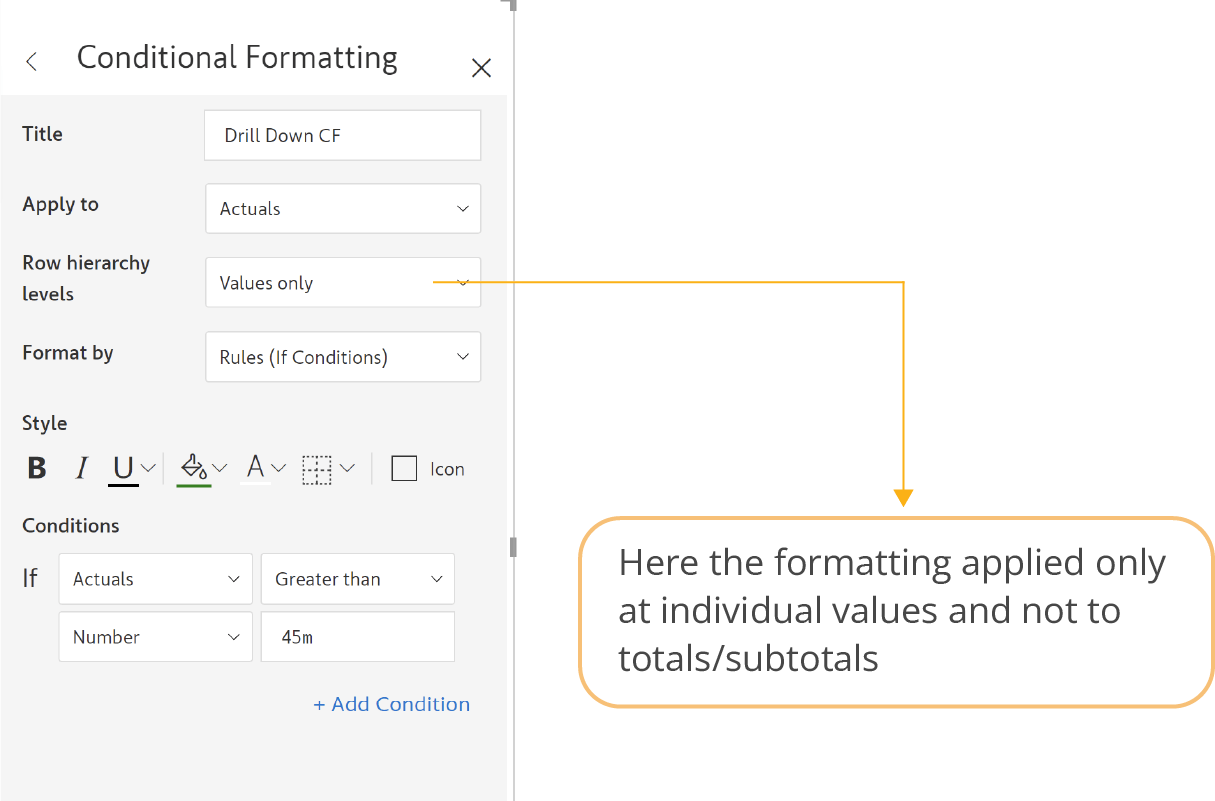
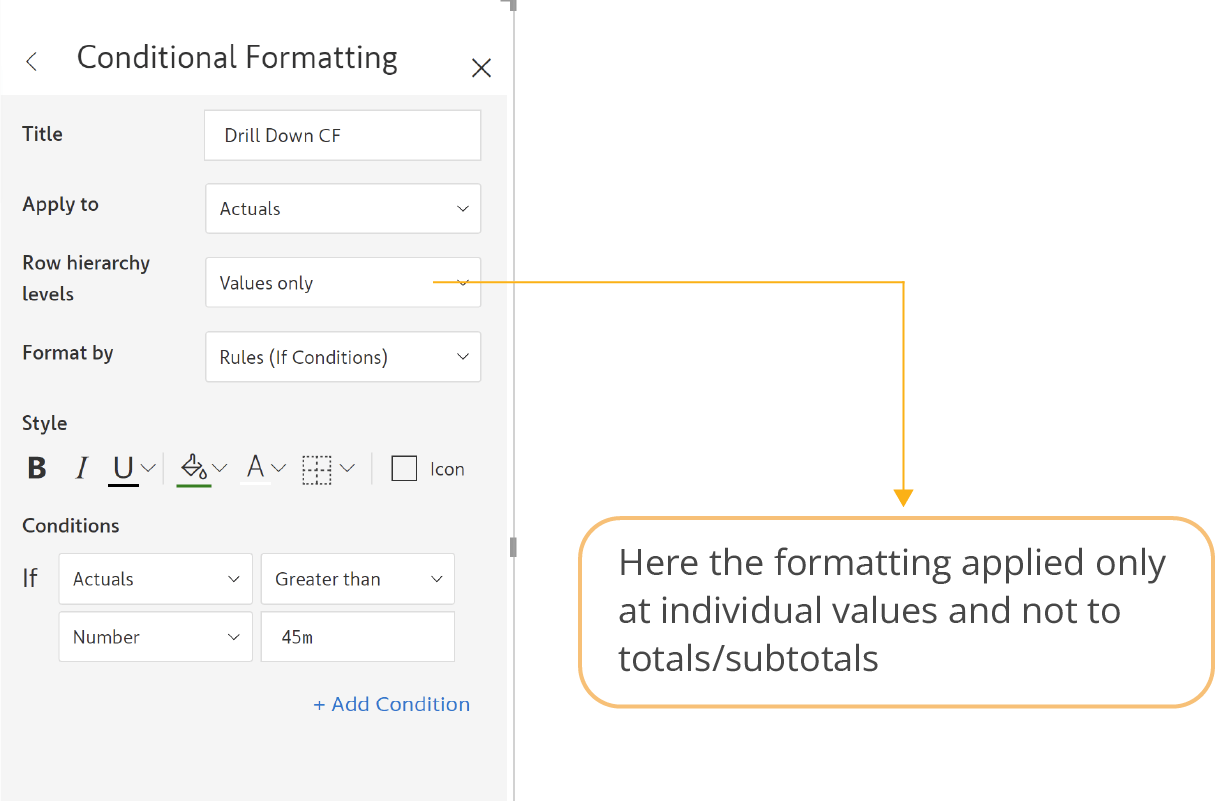
You can also apply conditional formatting in a granular level. This example shows a leaf level sub-category value highlighted for the condition where sales is more than 45m.
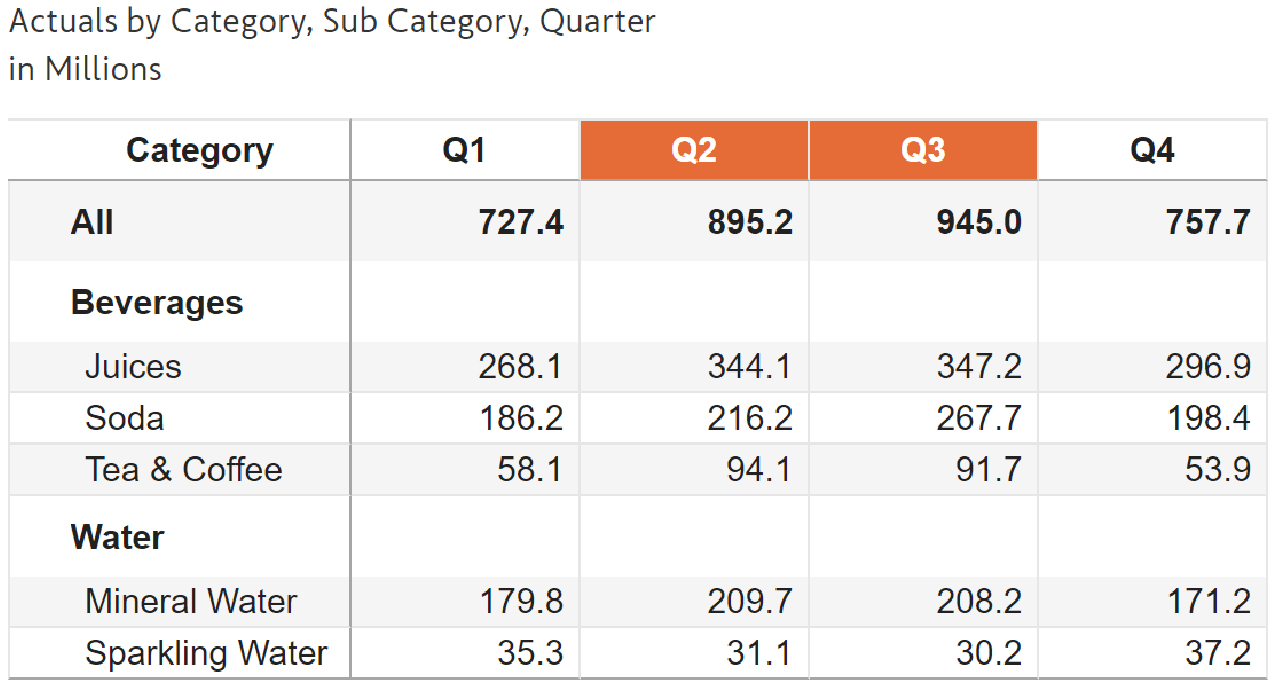
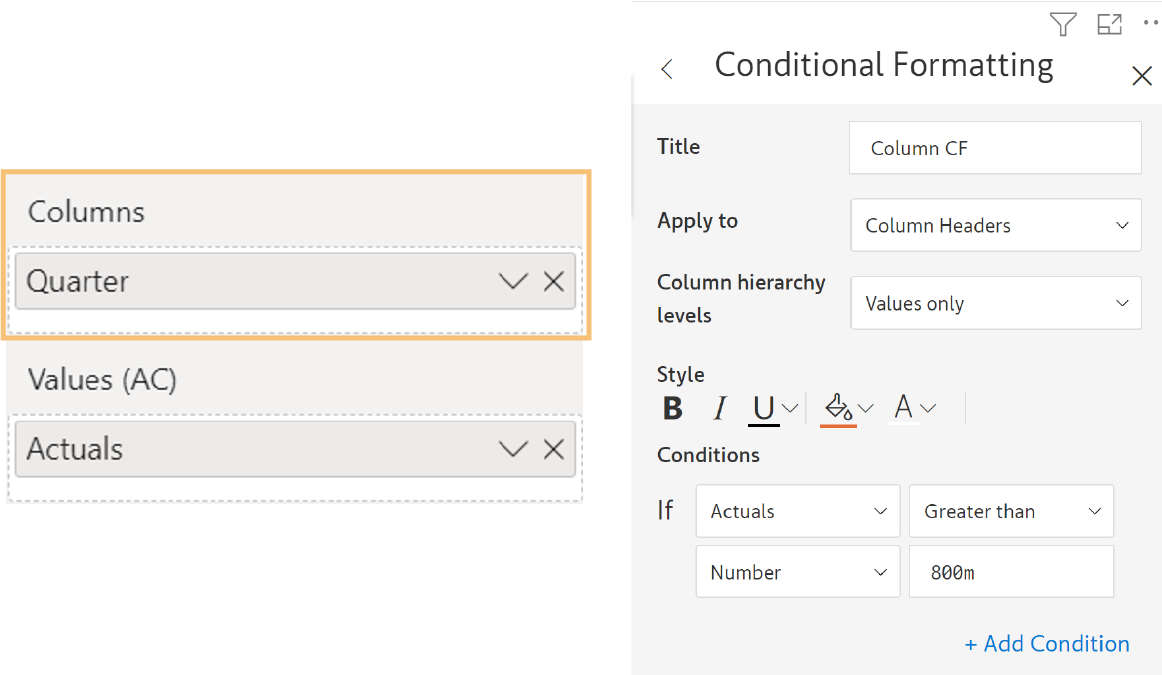
Like #5, you can easily highlight column headers in Inforiver when a specific condition is met.
However, it's important to note that this can only be achieved when there is a distinct measure or dimension specified for column headers.
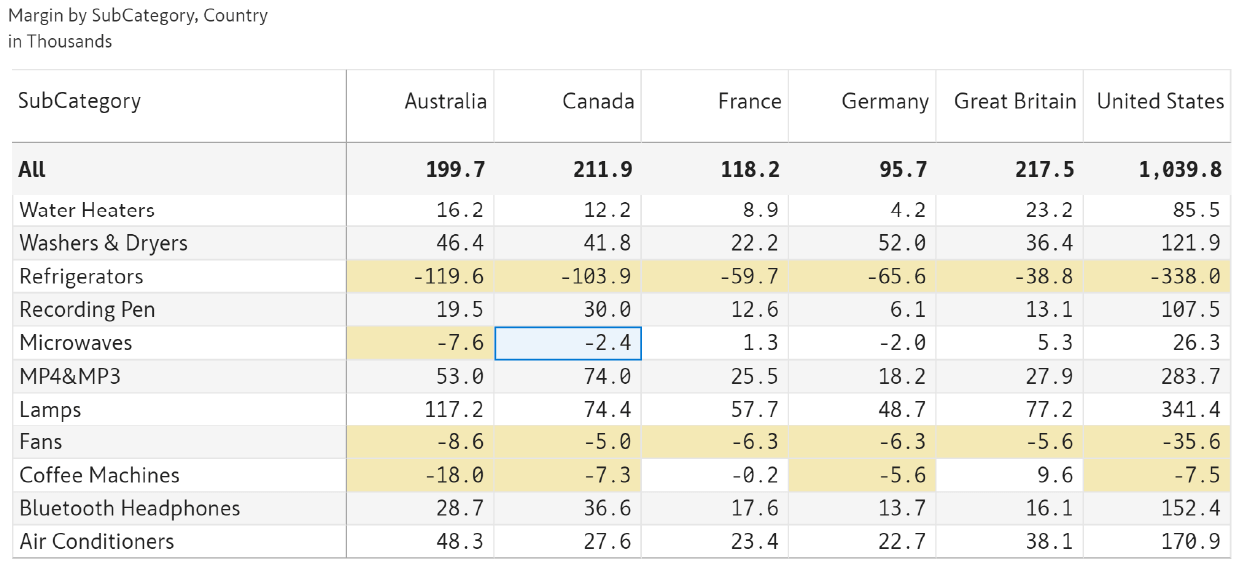
An interesting conditional formatting feature in Inforiver.
Select any cell in the report. All other cells that are < the value of the current cell get highlighted.
In this example, -2.4 is selected and all other cells that are < -2.4 is highlighted in yellow color.
To use Dynamic Formatting, use the ‘User selection’ option in the conditions section.
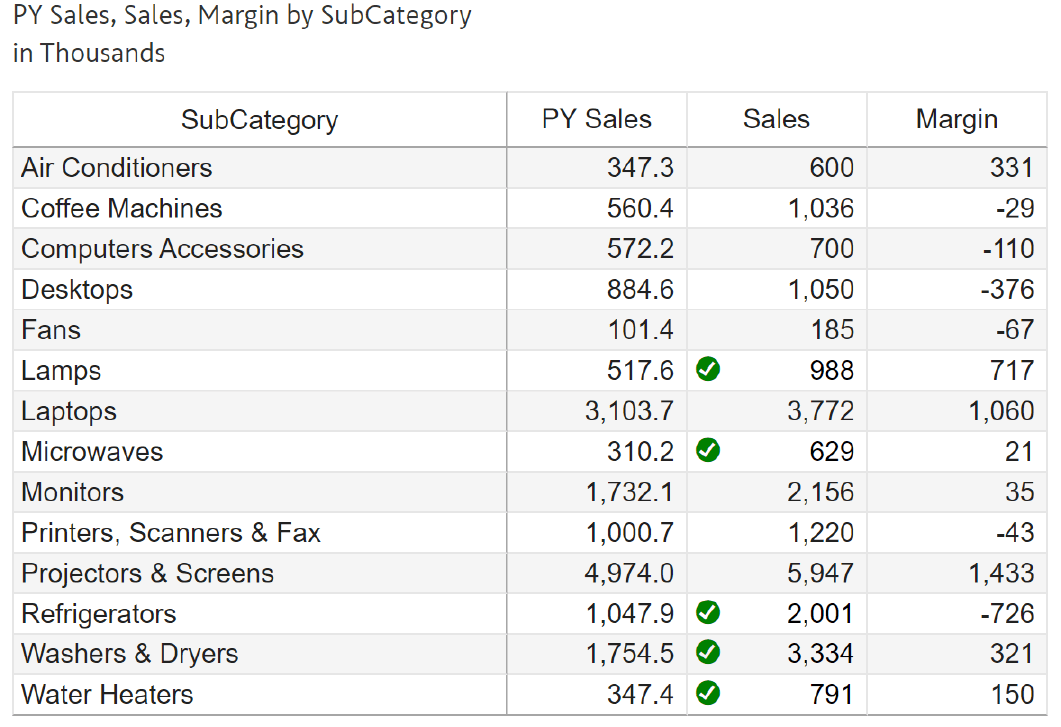
Have you ever struggled with creating complex rules and conditions using DAX in your reports? With Inforiver, you can simplify the process by easily creating conditions based on simple formulas!
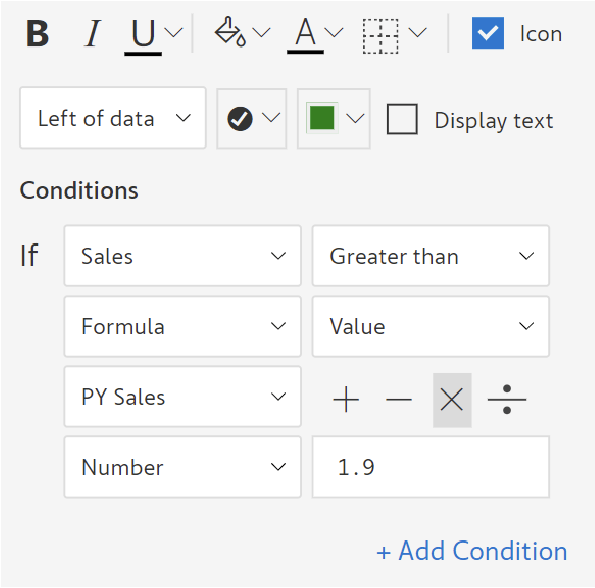
For instance, this report showcases sales values highlighted based on a specific condition stating that current sales should be greater than the previous year's sales by 190%.
To create a formula/calculation, you need not use any DAX. This template uses simple mathematical functions powered by your own measures.
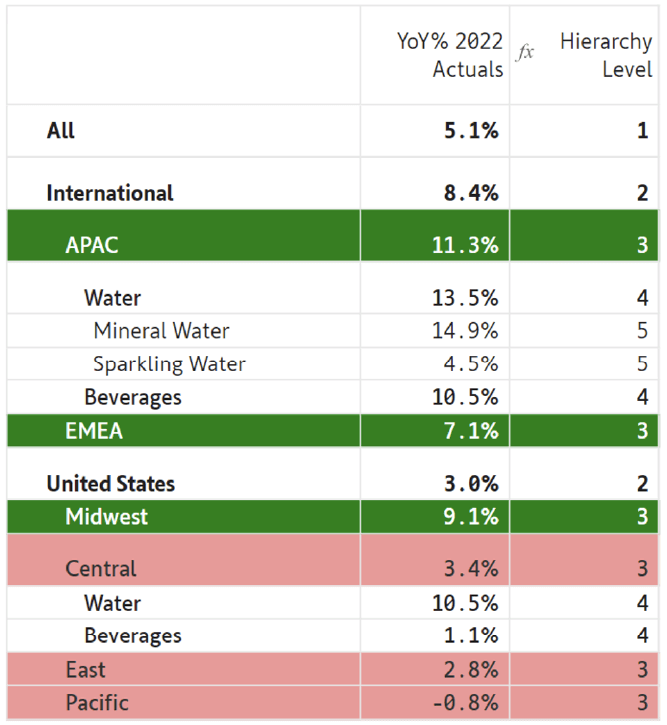
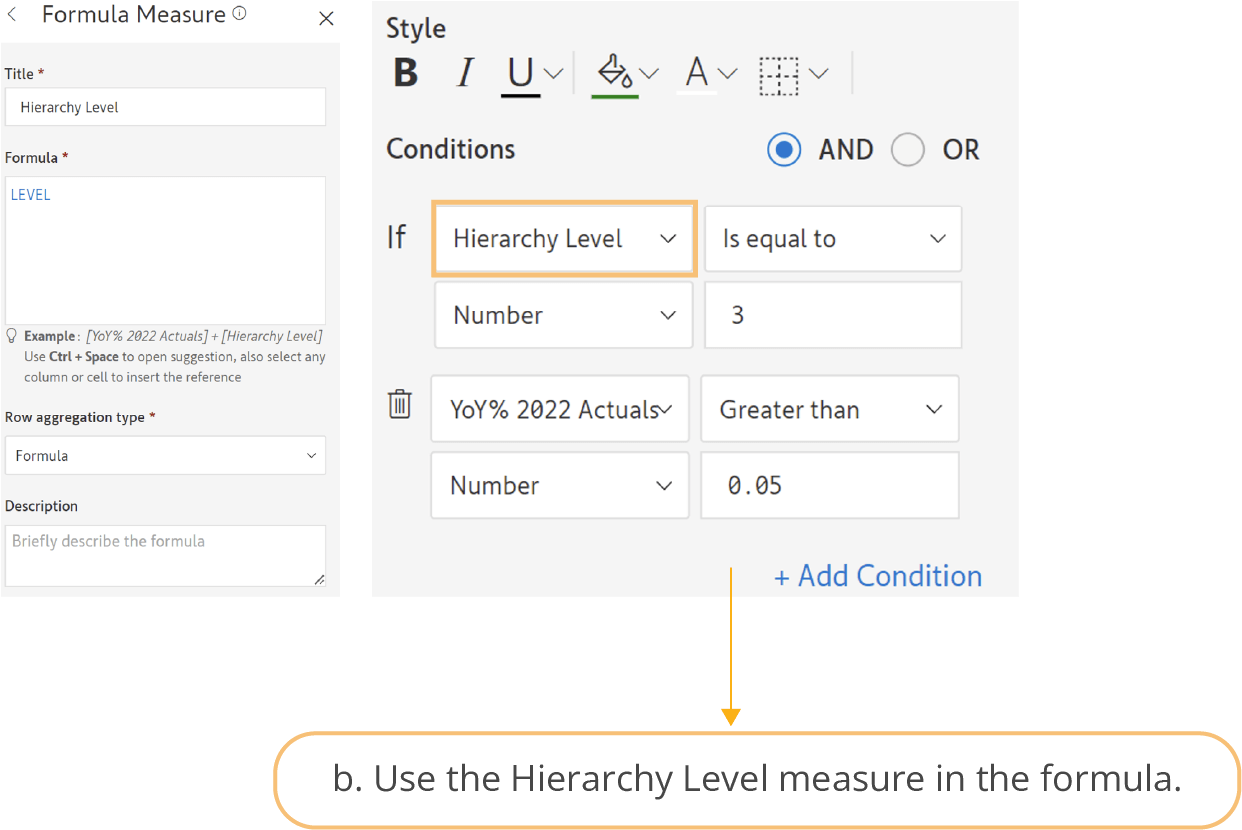
Similar to #18, you can easily create conditions based on formula to specific levels in a hierarchy. In this example, only specific levels are highlighted for a condition where hierarchy level is 3. To Highlight specific rows.
a. Insert a formula measure using the LEVEL keyword; Name it Hierarchy Level.
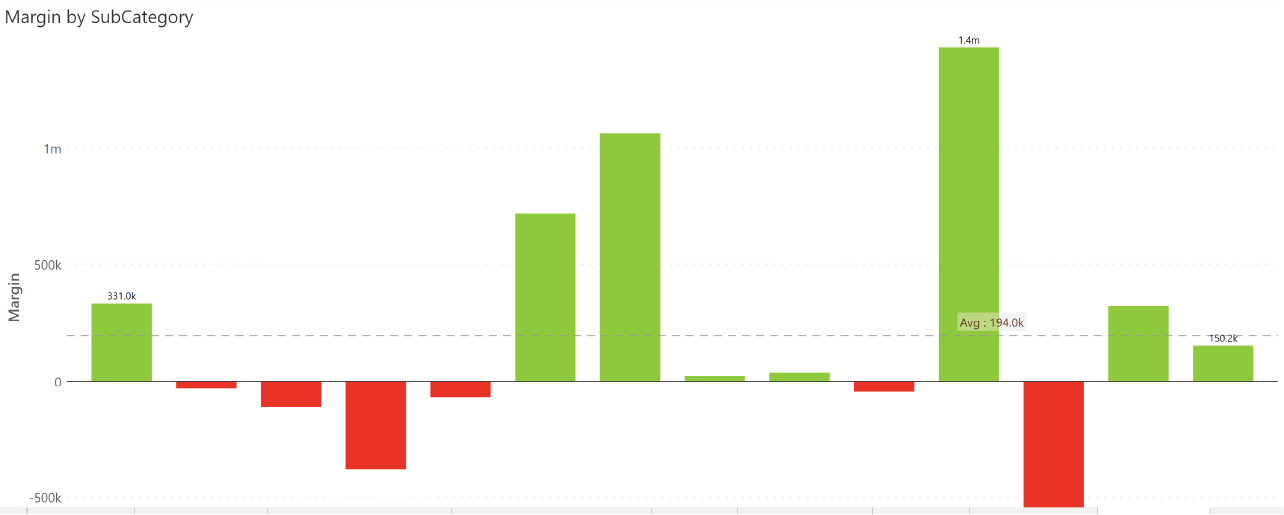
Conditional formatting is not limited to tables and matrices in Inforiver. Charts can also be formatted based on conditions.
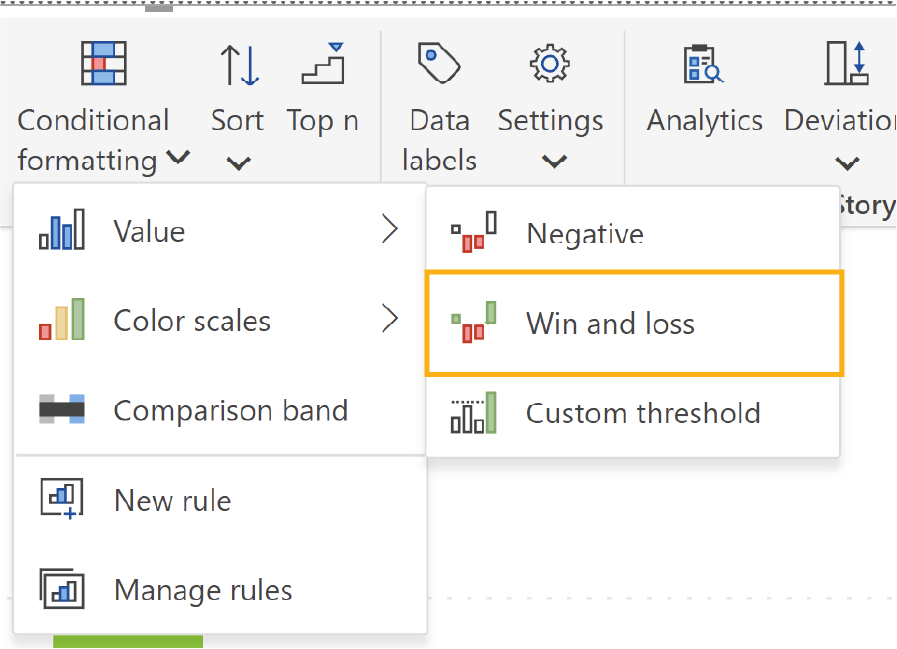
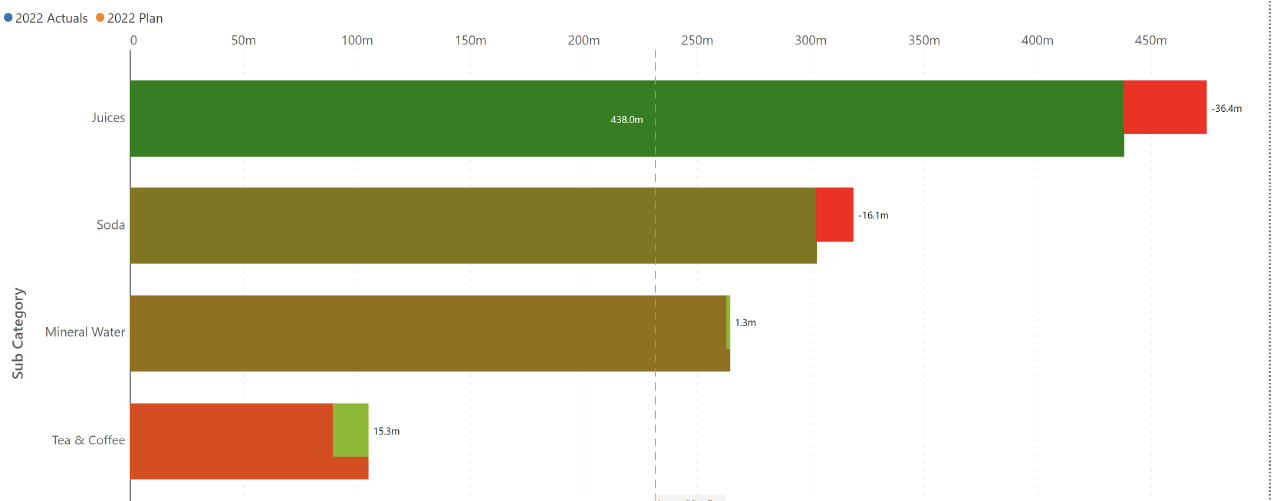
In this example, a simple conditional formatting is applied to Inforiver charts. All positive values greater than zero are highlighted in green, while negative values are highlighted in red.
To see win/loss, Go to Conditional Formatting --> Value --> click “Win and loss”.
In addition to basic conditional formatting, Inforiver also offers pre-set color scale options that can be applied to charts.
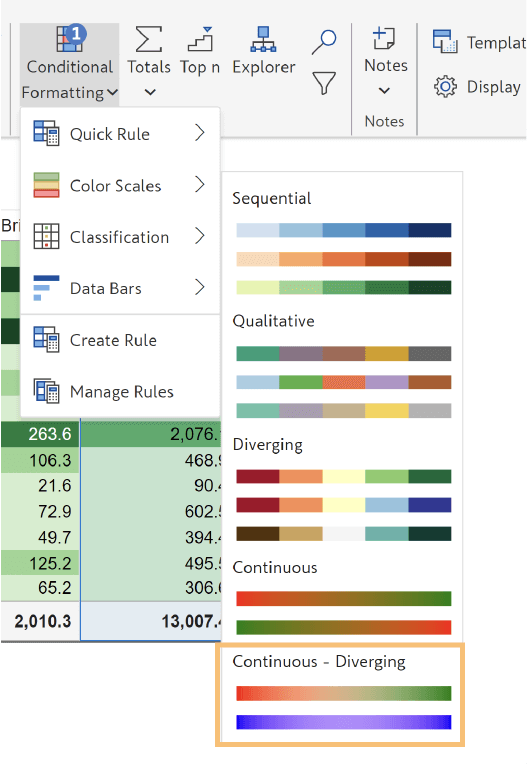
For instance, in this example, the color scale ranges from red to green as the value increases, with the minimum value highlighted in red.
To apply this type of formatting, Go to Color scales --> click Continuous Diverging and edit with your desired values.
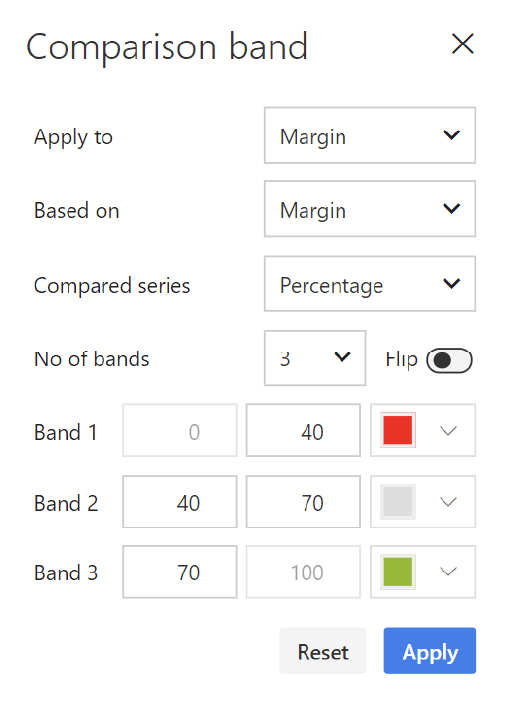
In Inforiver, you can take conditional formatting in charts to the next level with the ability to create custom bands based on your desired values.
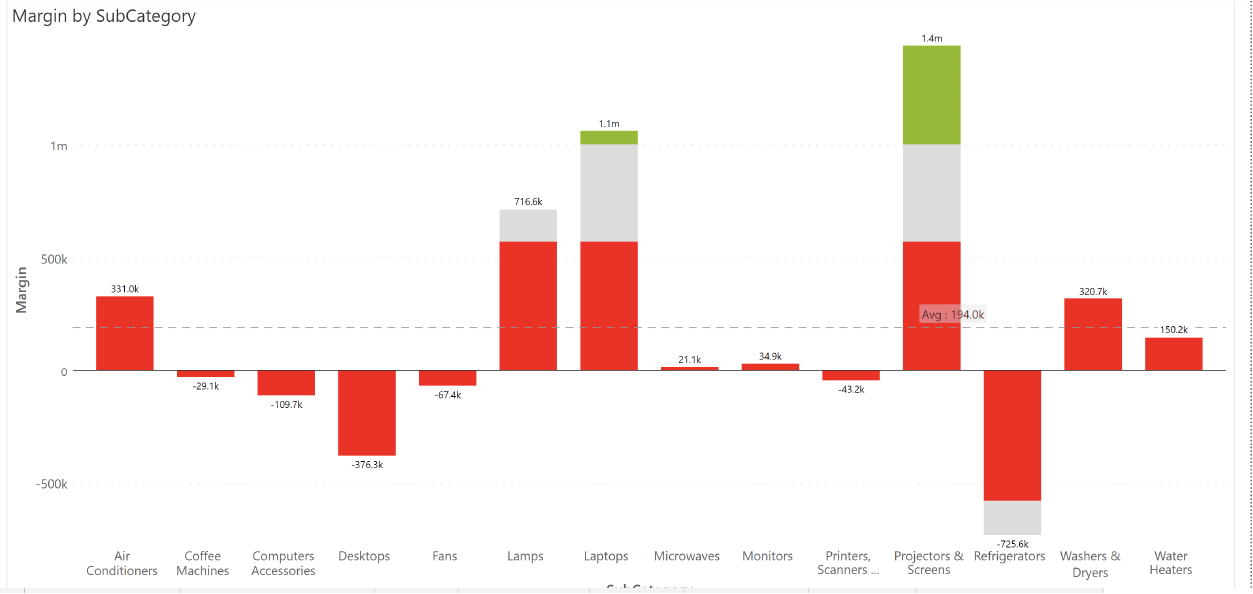
Look at this example where the chart has been formatted with three bands, each representing a different range of values. The band from 0 to 40 is highlighted in red, 40 to 70 in gray, and 70 to 100 in green.
You can create comparison/custom bands by choosing comparison band from Conditional formatting menu.
All of this advanced formatting has been achieved using Inforiver. With Inforiver, you can perform highly customized formatting to highlight performance and draw attention to specific data points in your table.
Watch the Conditional Formatting in Power BI Webinar replay here.
Click here to learn more about Conditional Formatting in Power BI.