
Upcoming webinar on 'Inforiver Charts : The fastest way to deliver stories in Power BI', Aug 29th , Monday, 10.30 AM CST. Register Now
Upcoming webinar on 'Inforiver Charts : The fastest way to deliver stories in Power BI', Aug 29th , Monday, 10.30 AM CST. Register Now
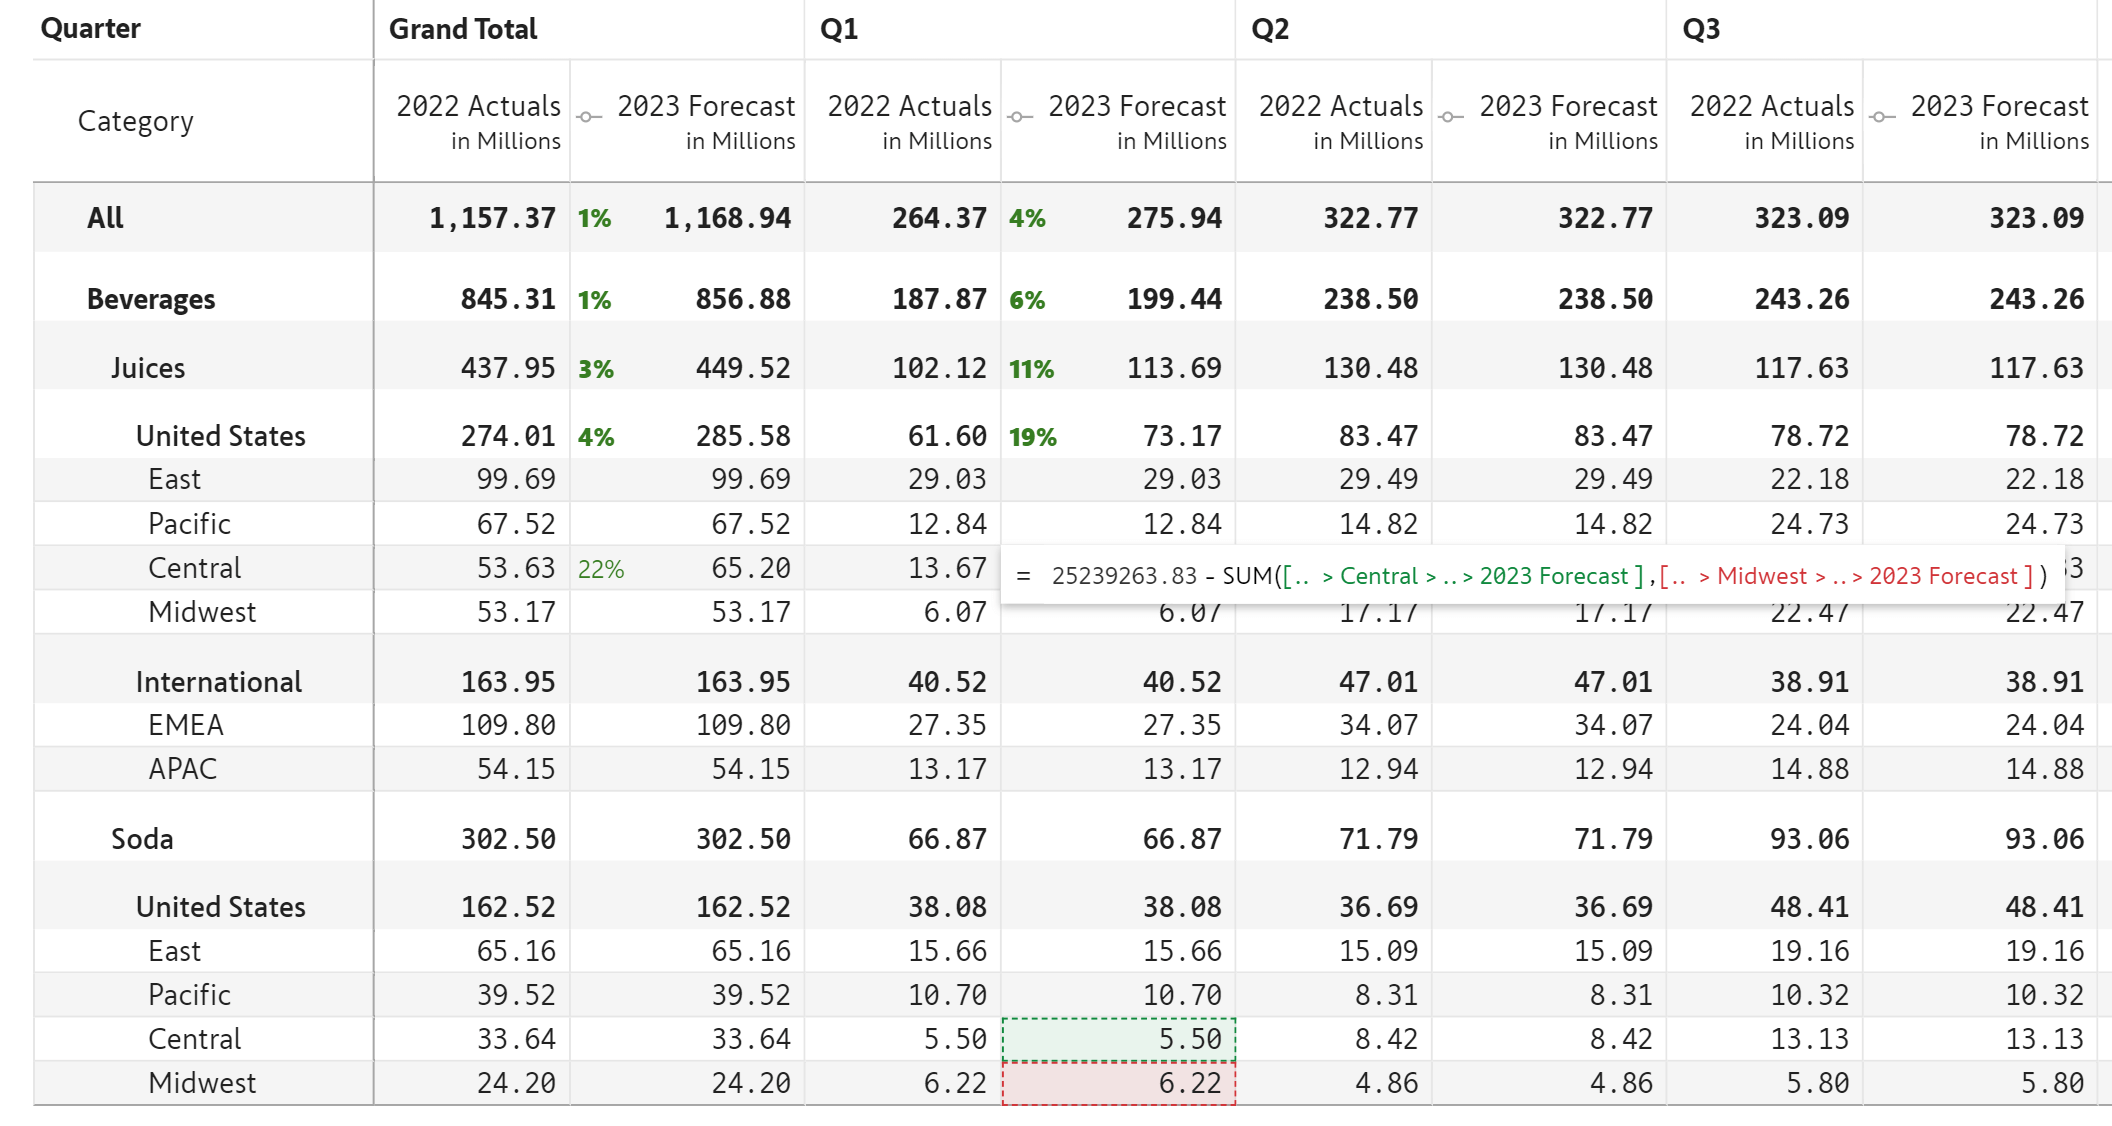
Double-click on a cell and start typing in the value; supports references to other cells and functions
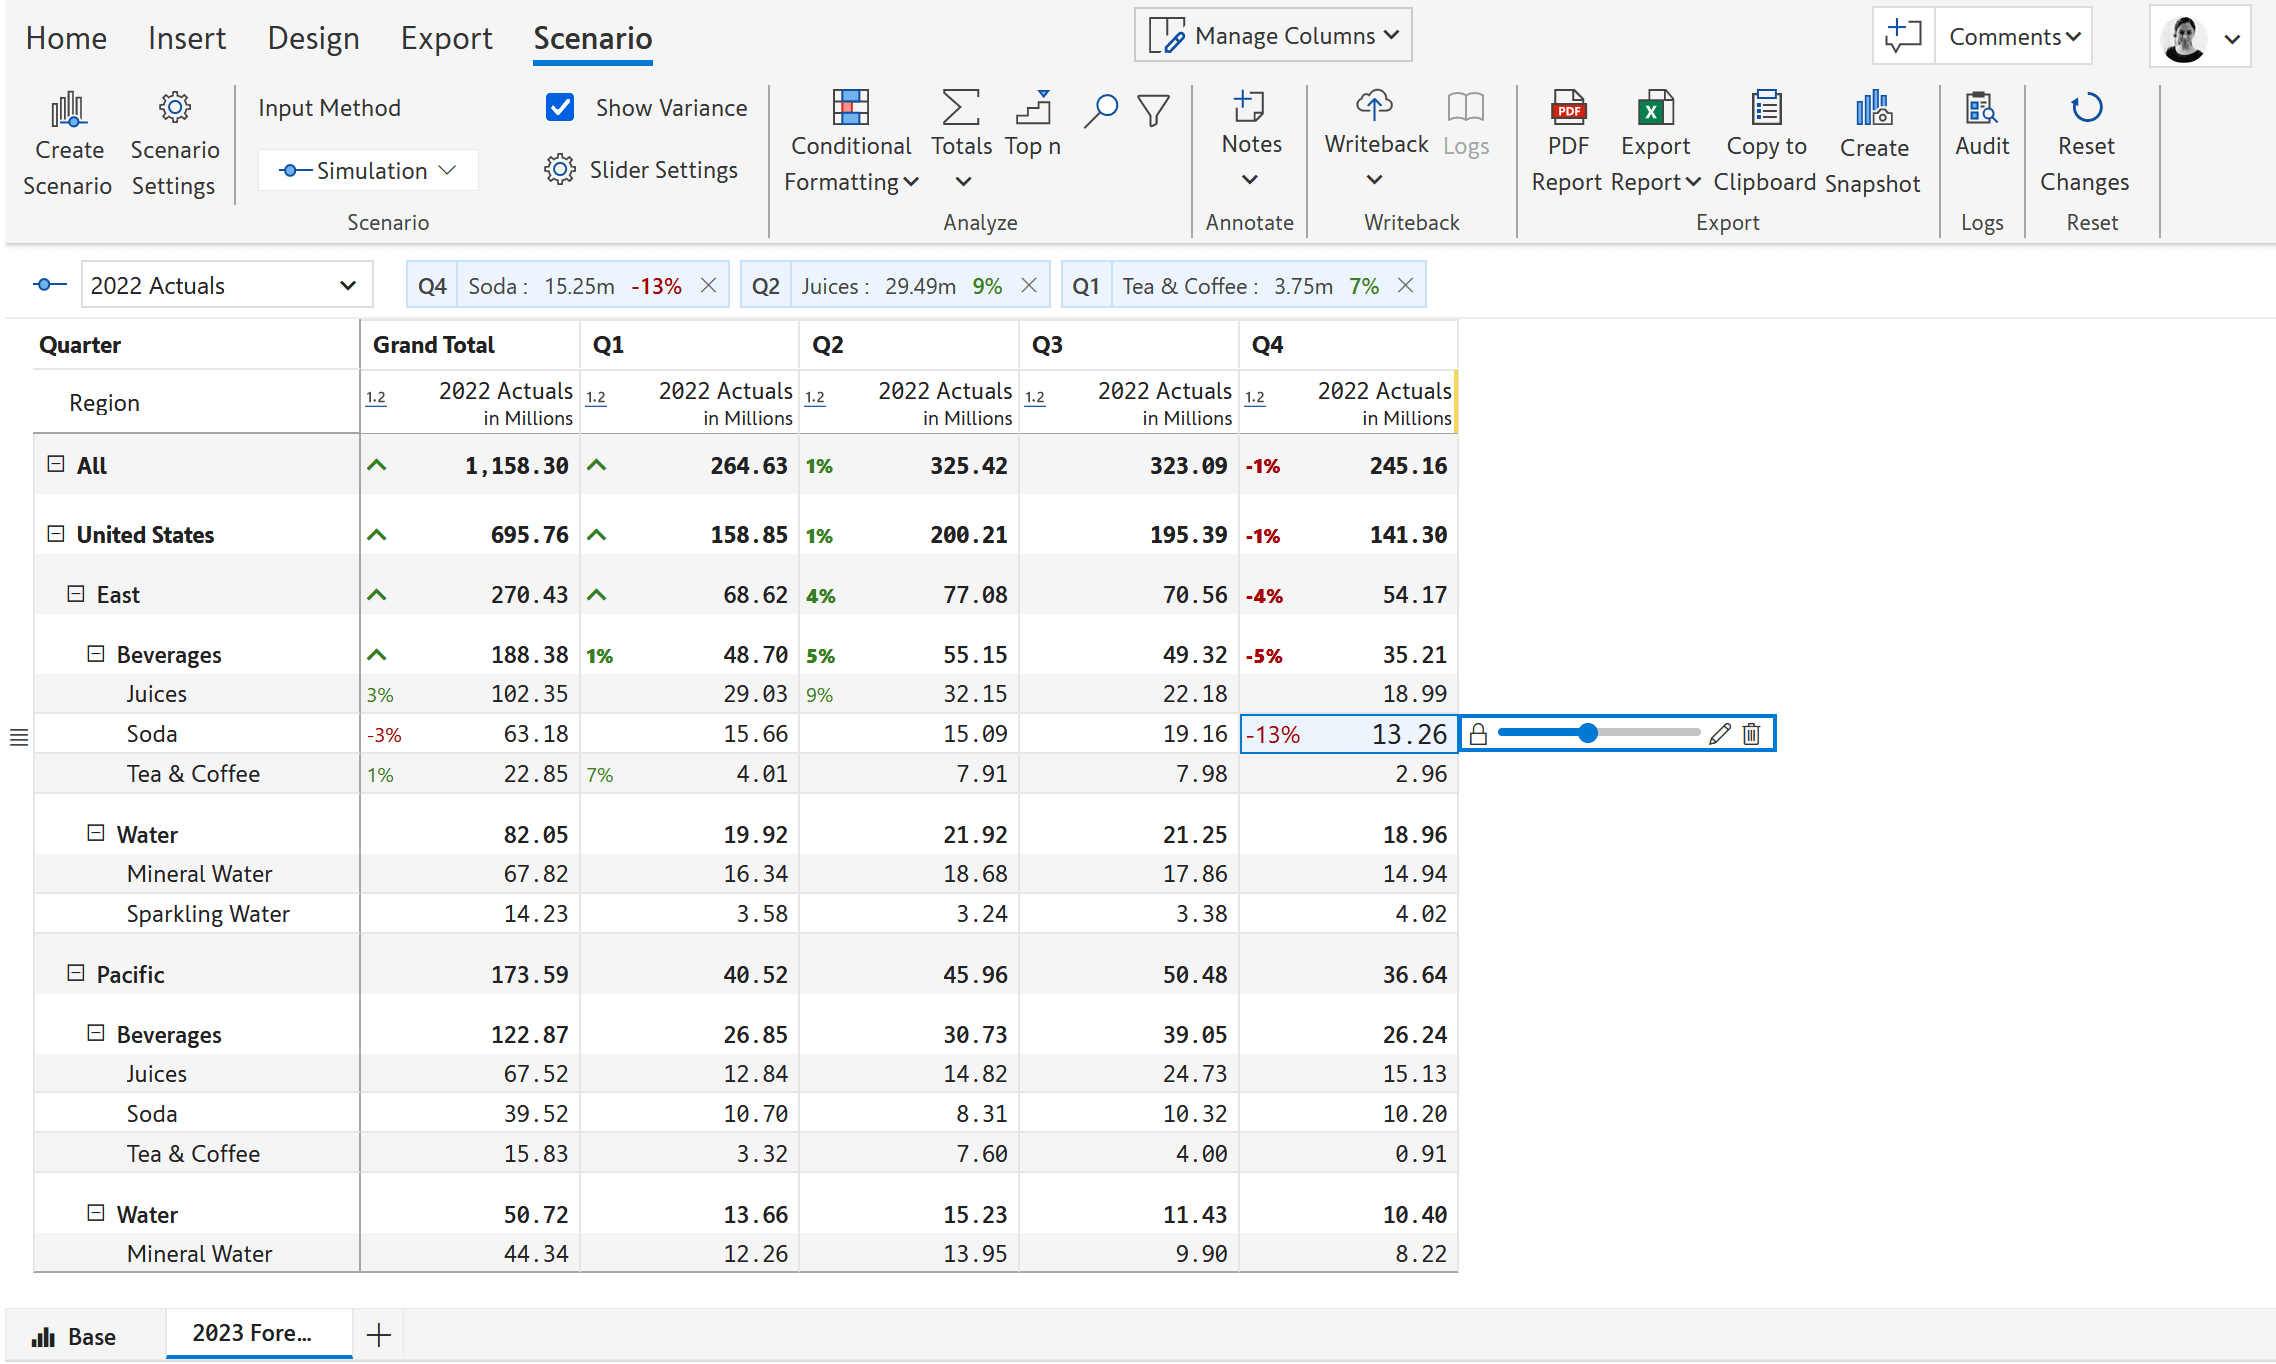
Create simulation-enabled columns and measures and change values using a slider;

Create business forecasts and projections using top-down (parent to children spreading) and bottom-up (children to parent roll-up) simulations

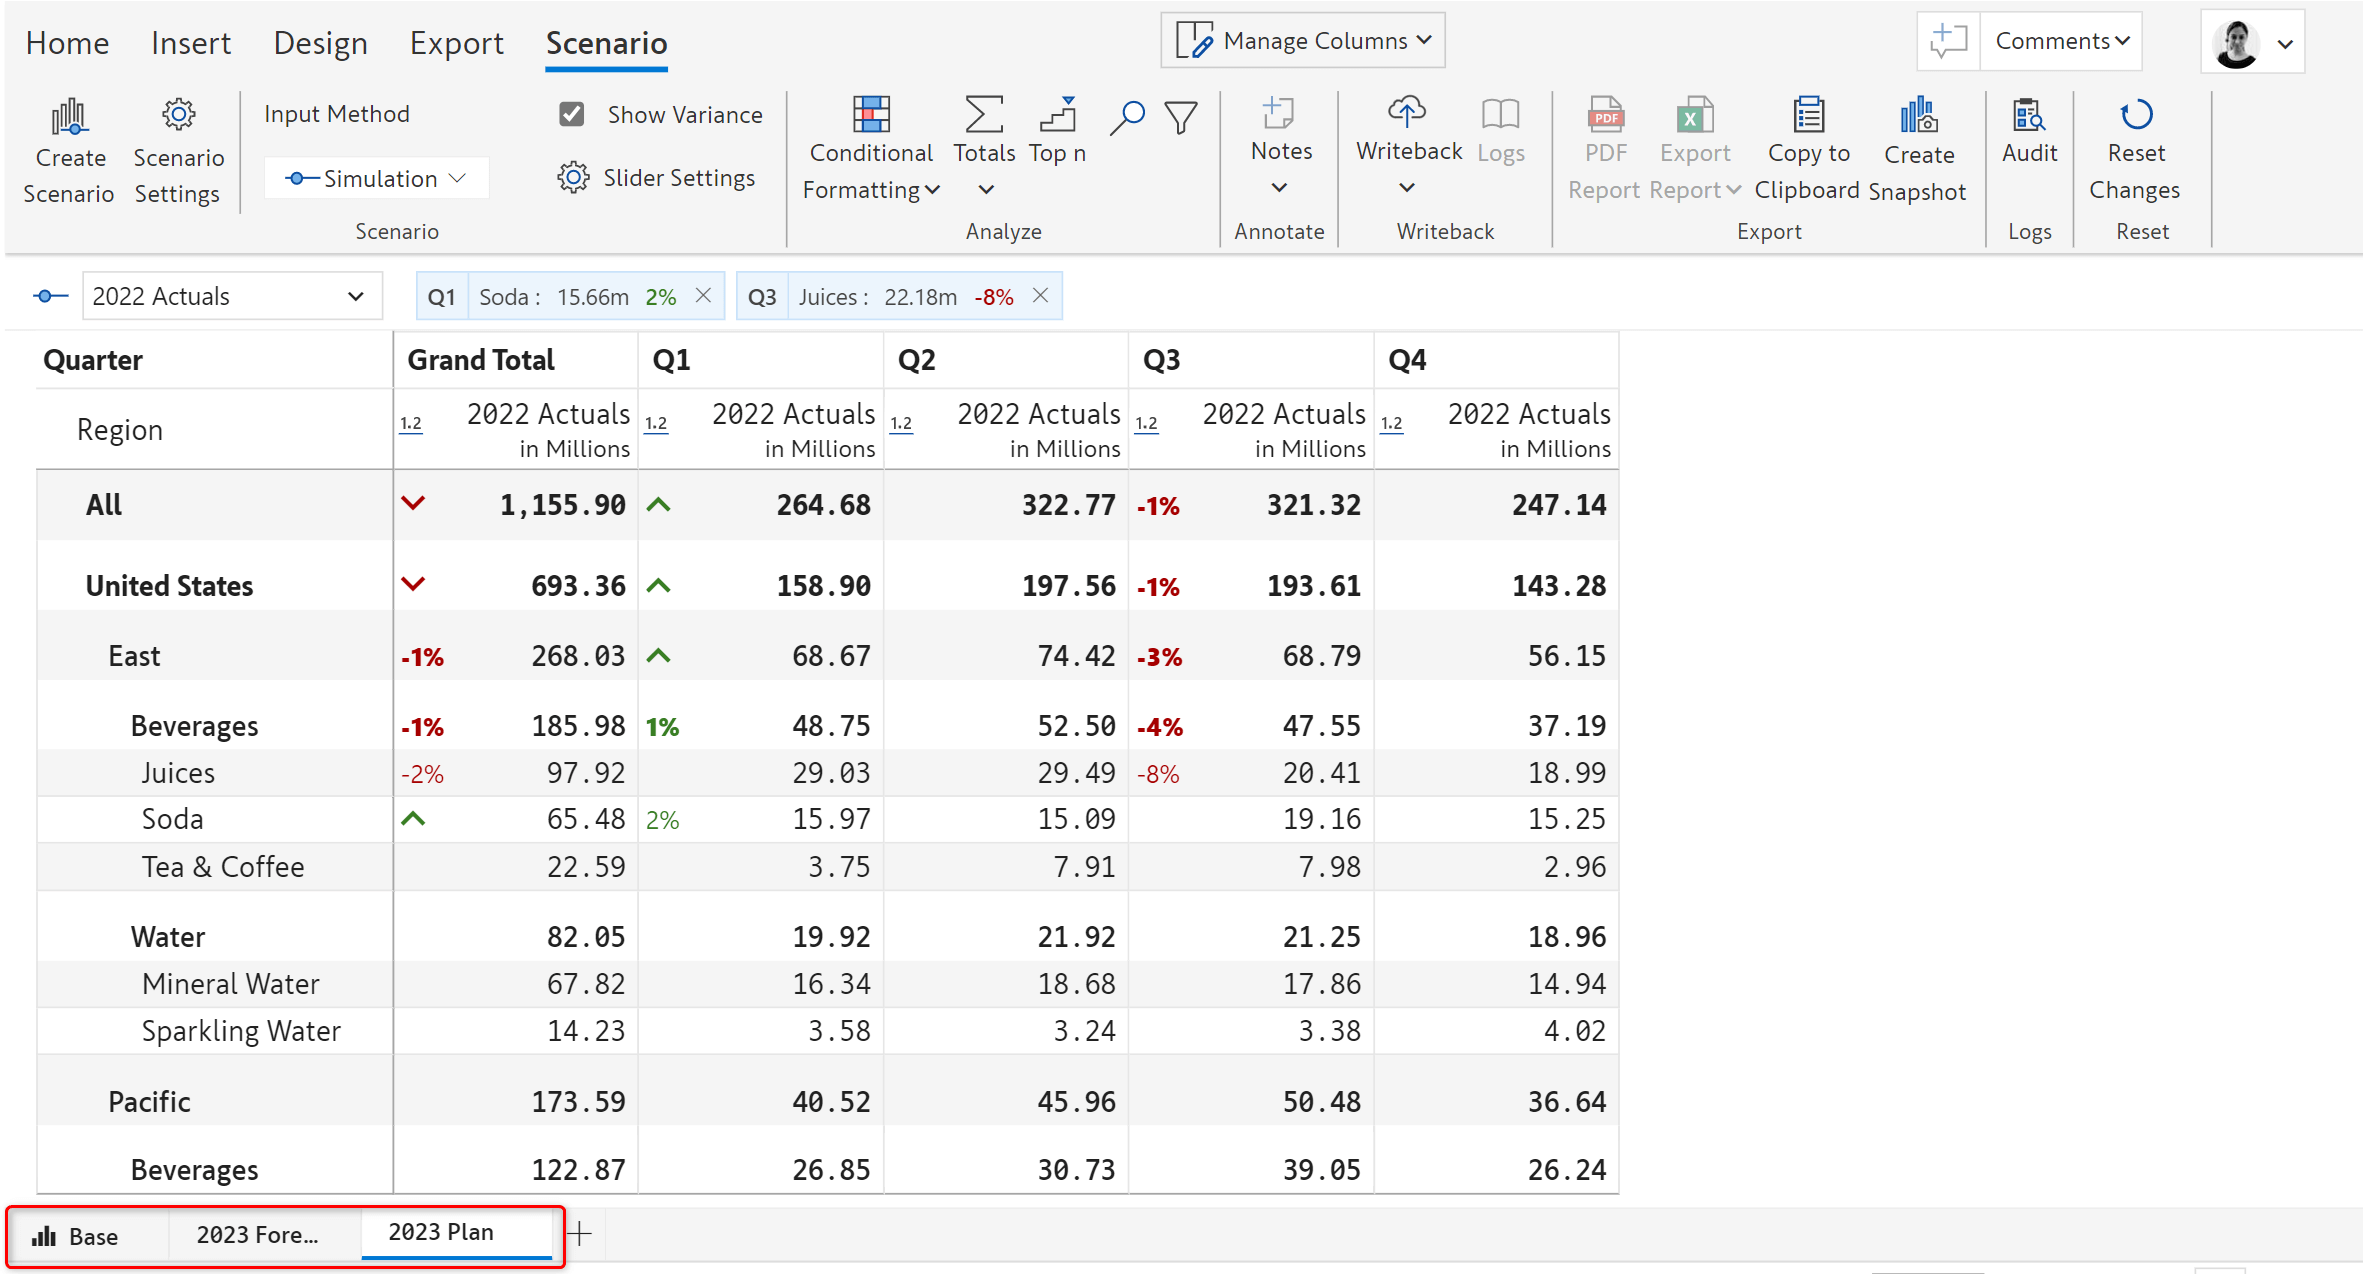
Simulate in reading view; analyze resulting variances in a single click, add notes, export simulation data and more

Create new scenarios in editing and reading modes for ad-hoc analysis (only in Inforiver Enterprise)
Share scenarios with specific users in the organization

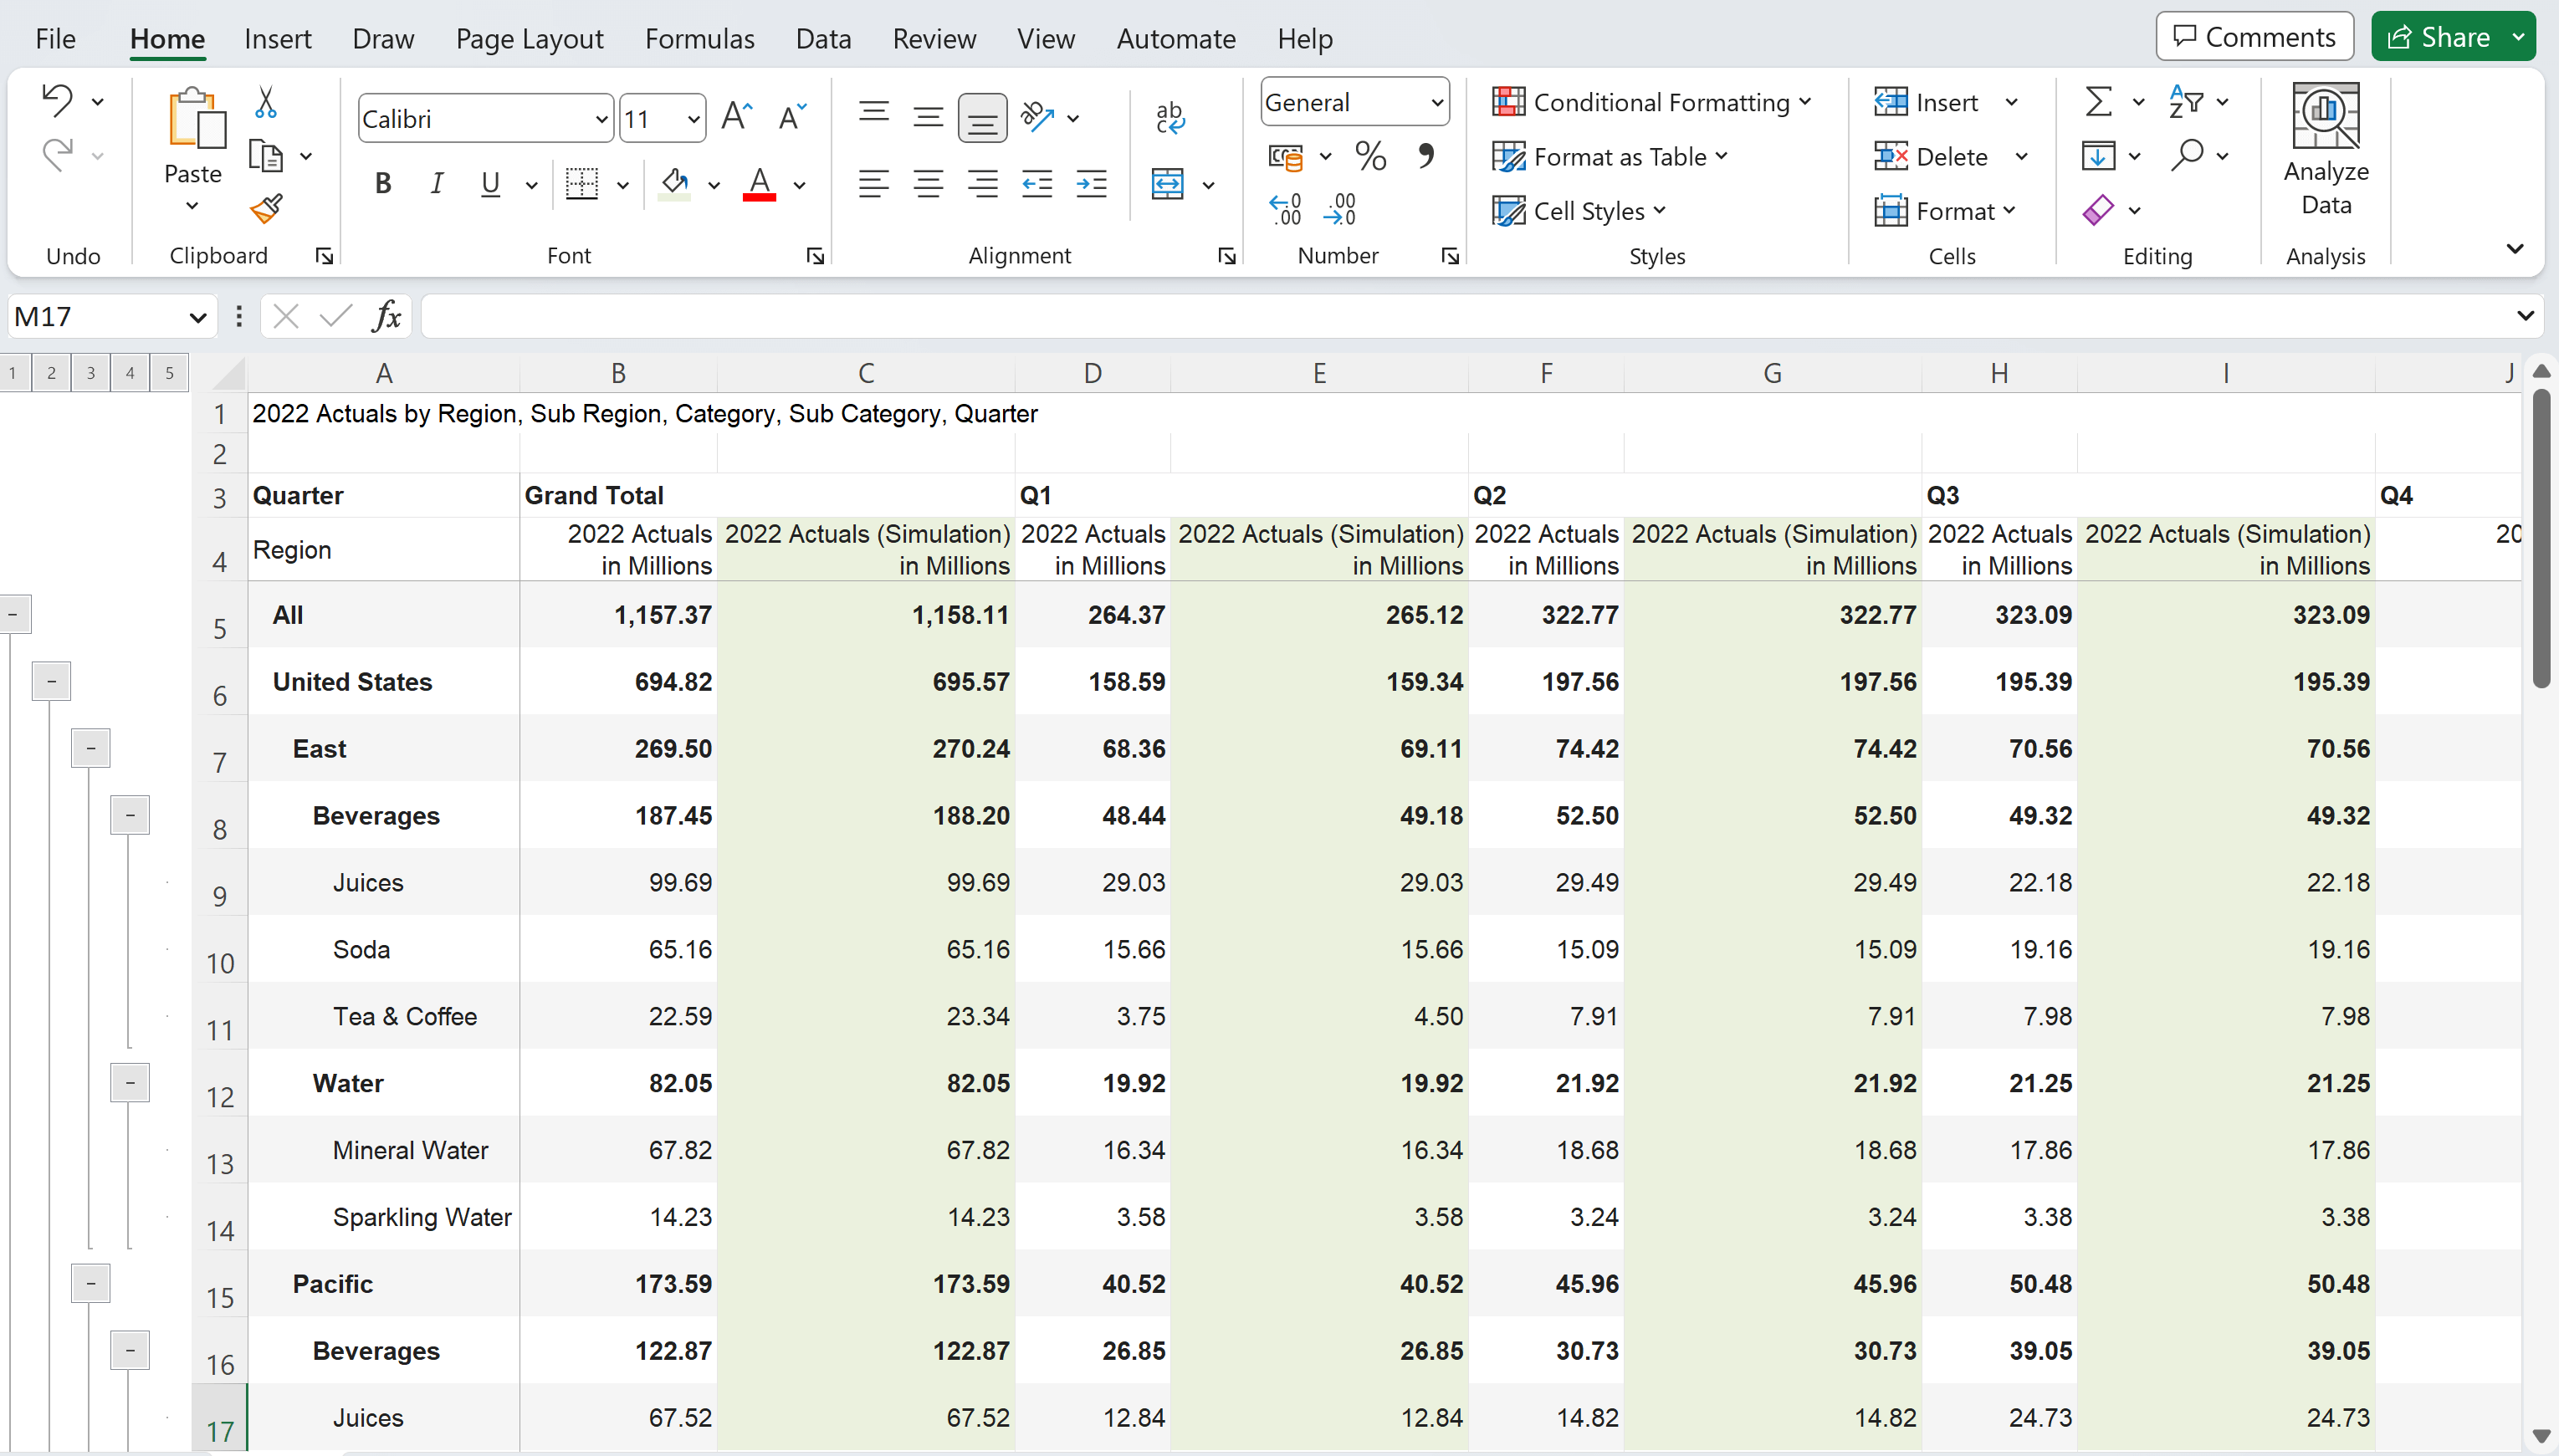
Download simulation results to Excel or PDF for further analysis and presentation
Writeback simulation outcomes to spreadsheet, database and cloud destinations


Inforiver helps enterprises consolidate planning, reporting & analytics on a single platform (Power BI). The no-code, self-service award-winning platform has been recognized as the industry’s best and is adopted by many Fortune 100 firms.
Inforiver is a product of Lumel, the #1 Power BI AppSource Partner. The firm serves over 3,000 customers worldwide through its portfolio of products offered under the brands Inforiver, EDITable, ValQ, and xViz.
