Upcoming webinar on 'Inforiver Charts : The fastest way to deliver stories in Power BI', Aug 29th , Monday, 10.30 AM CST. Register Now
Upcoming webinar on 'Inforiver Charts : The fastest way to deliver stories in Power BI', Aug 29th , Monday, 10.30 AM CST. Register Now
This dashboard visualizes sales and profit across categories using Inforiver Analytics+ and Reporting Matrix
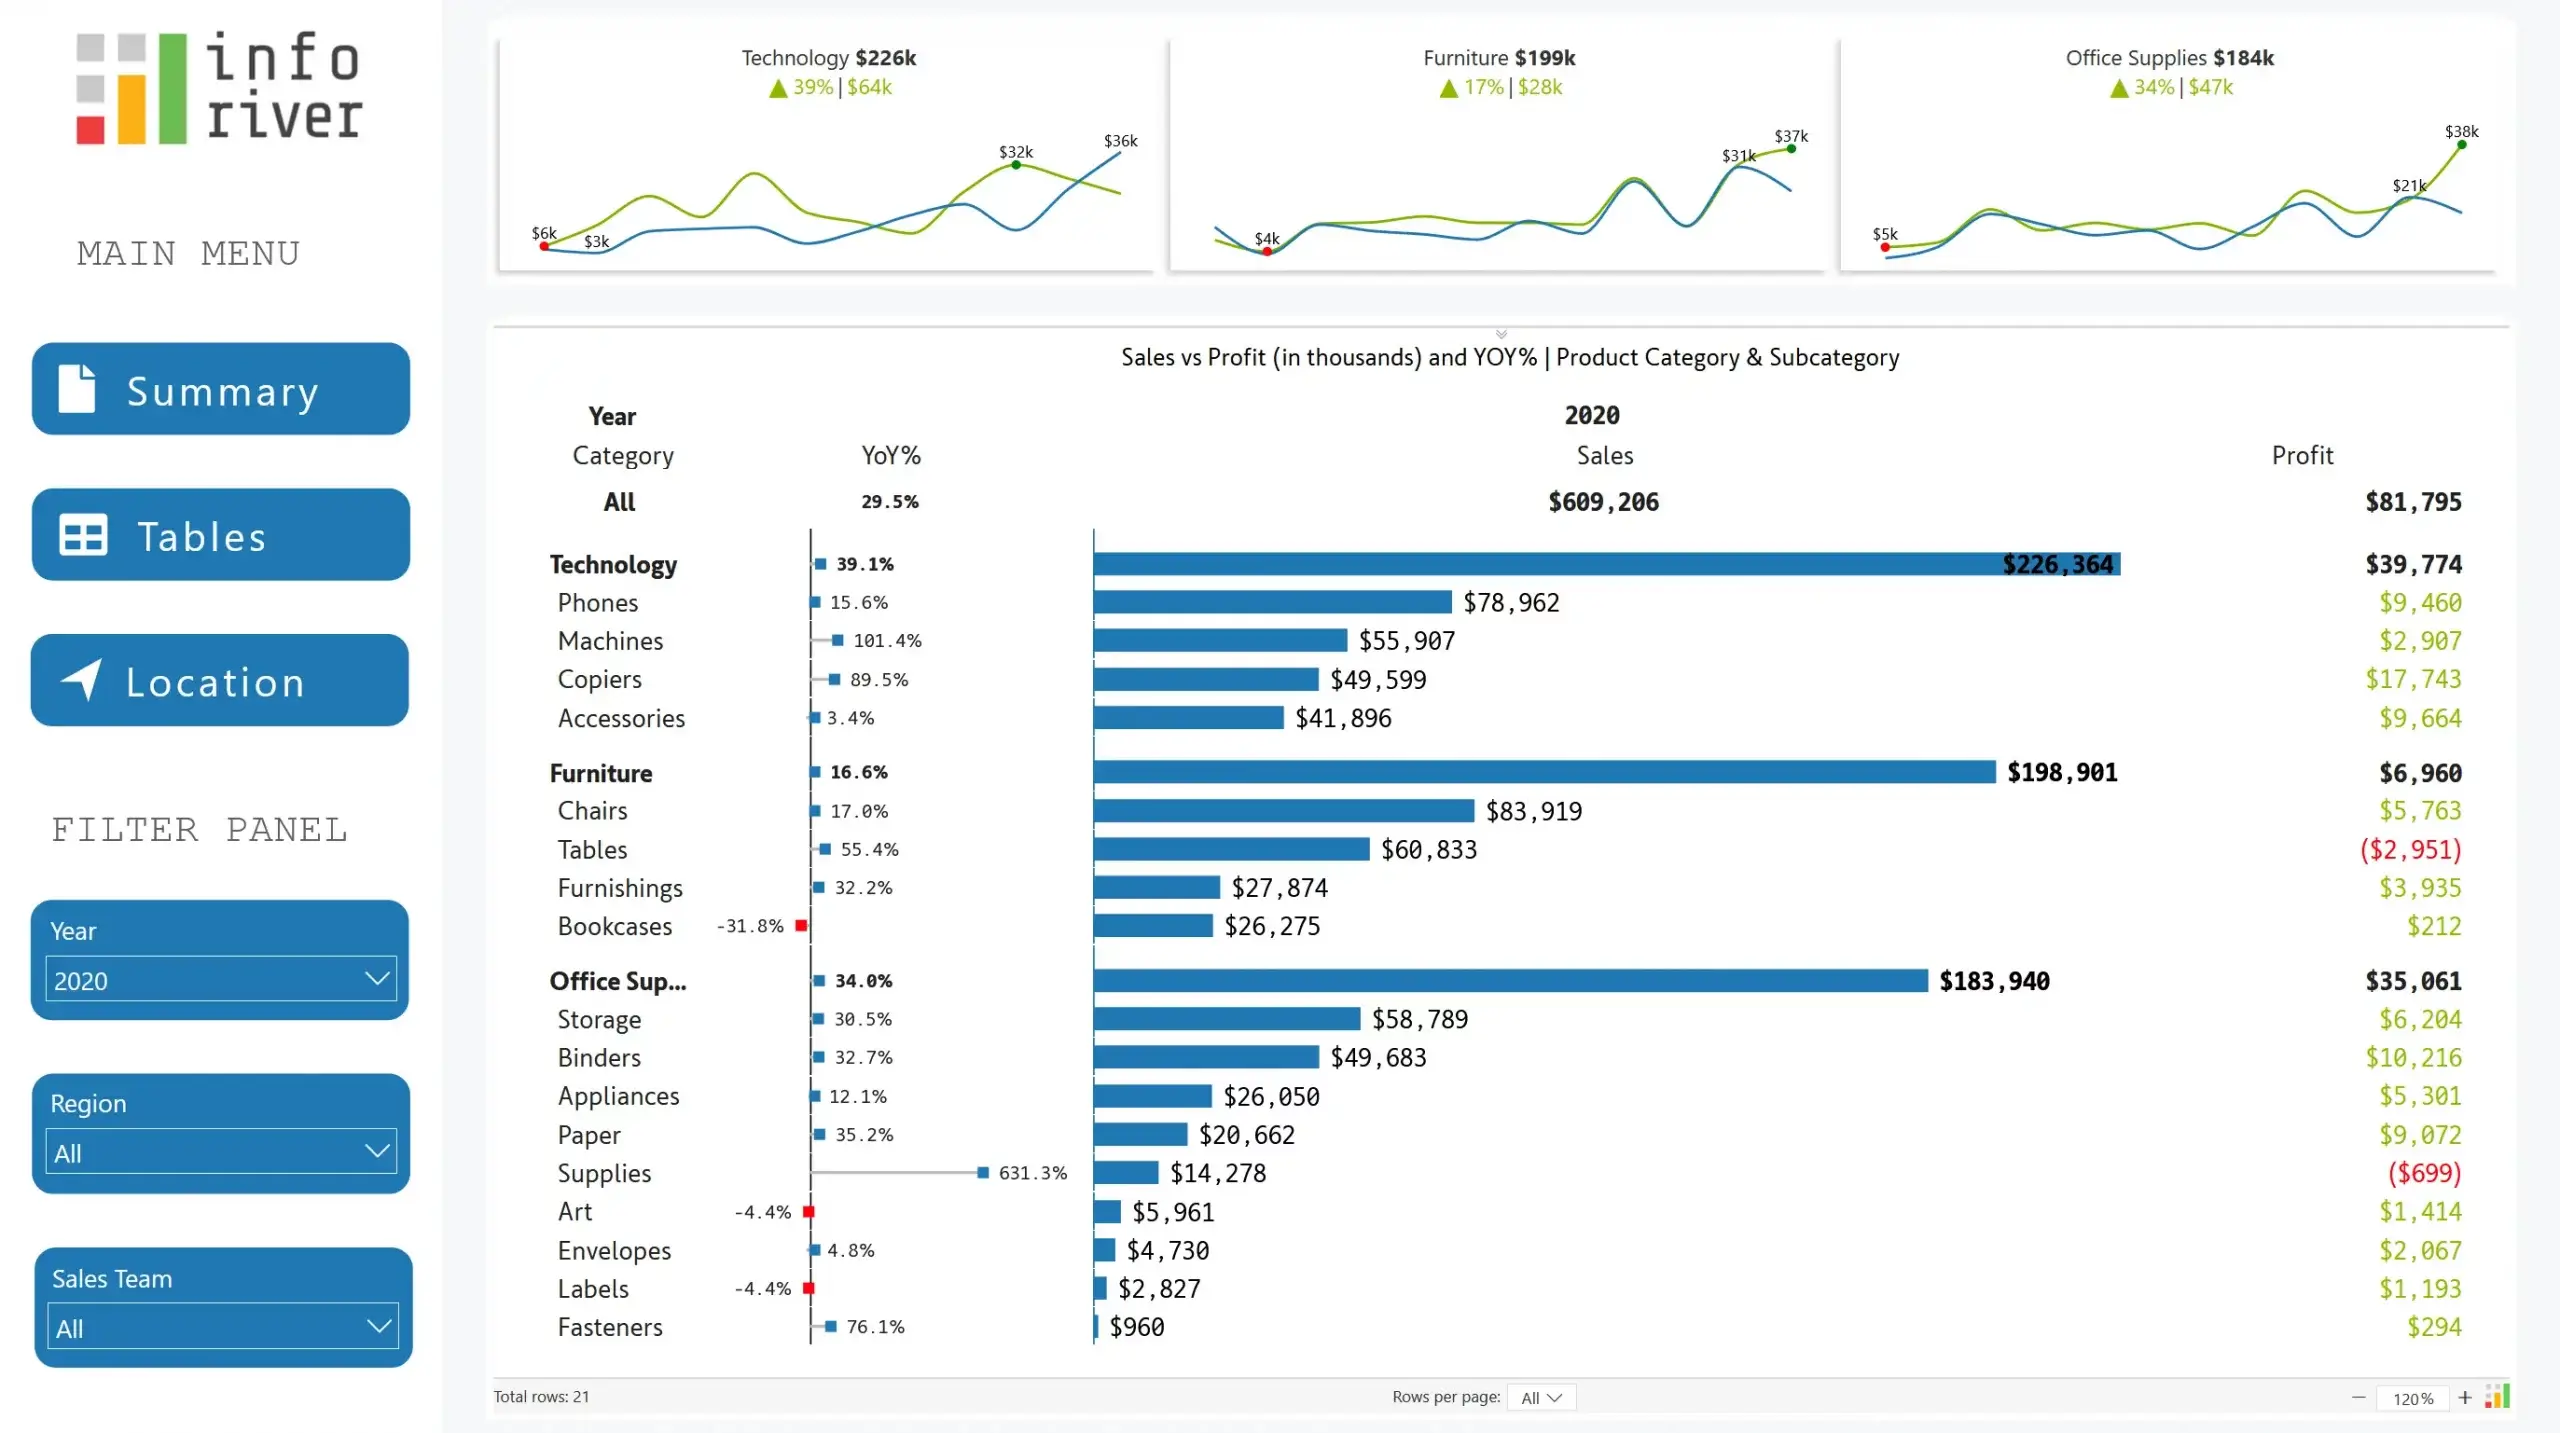
Inforiver Analytics+ is used along with native Power BI visuals and slicers
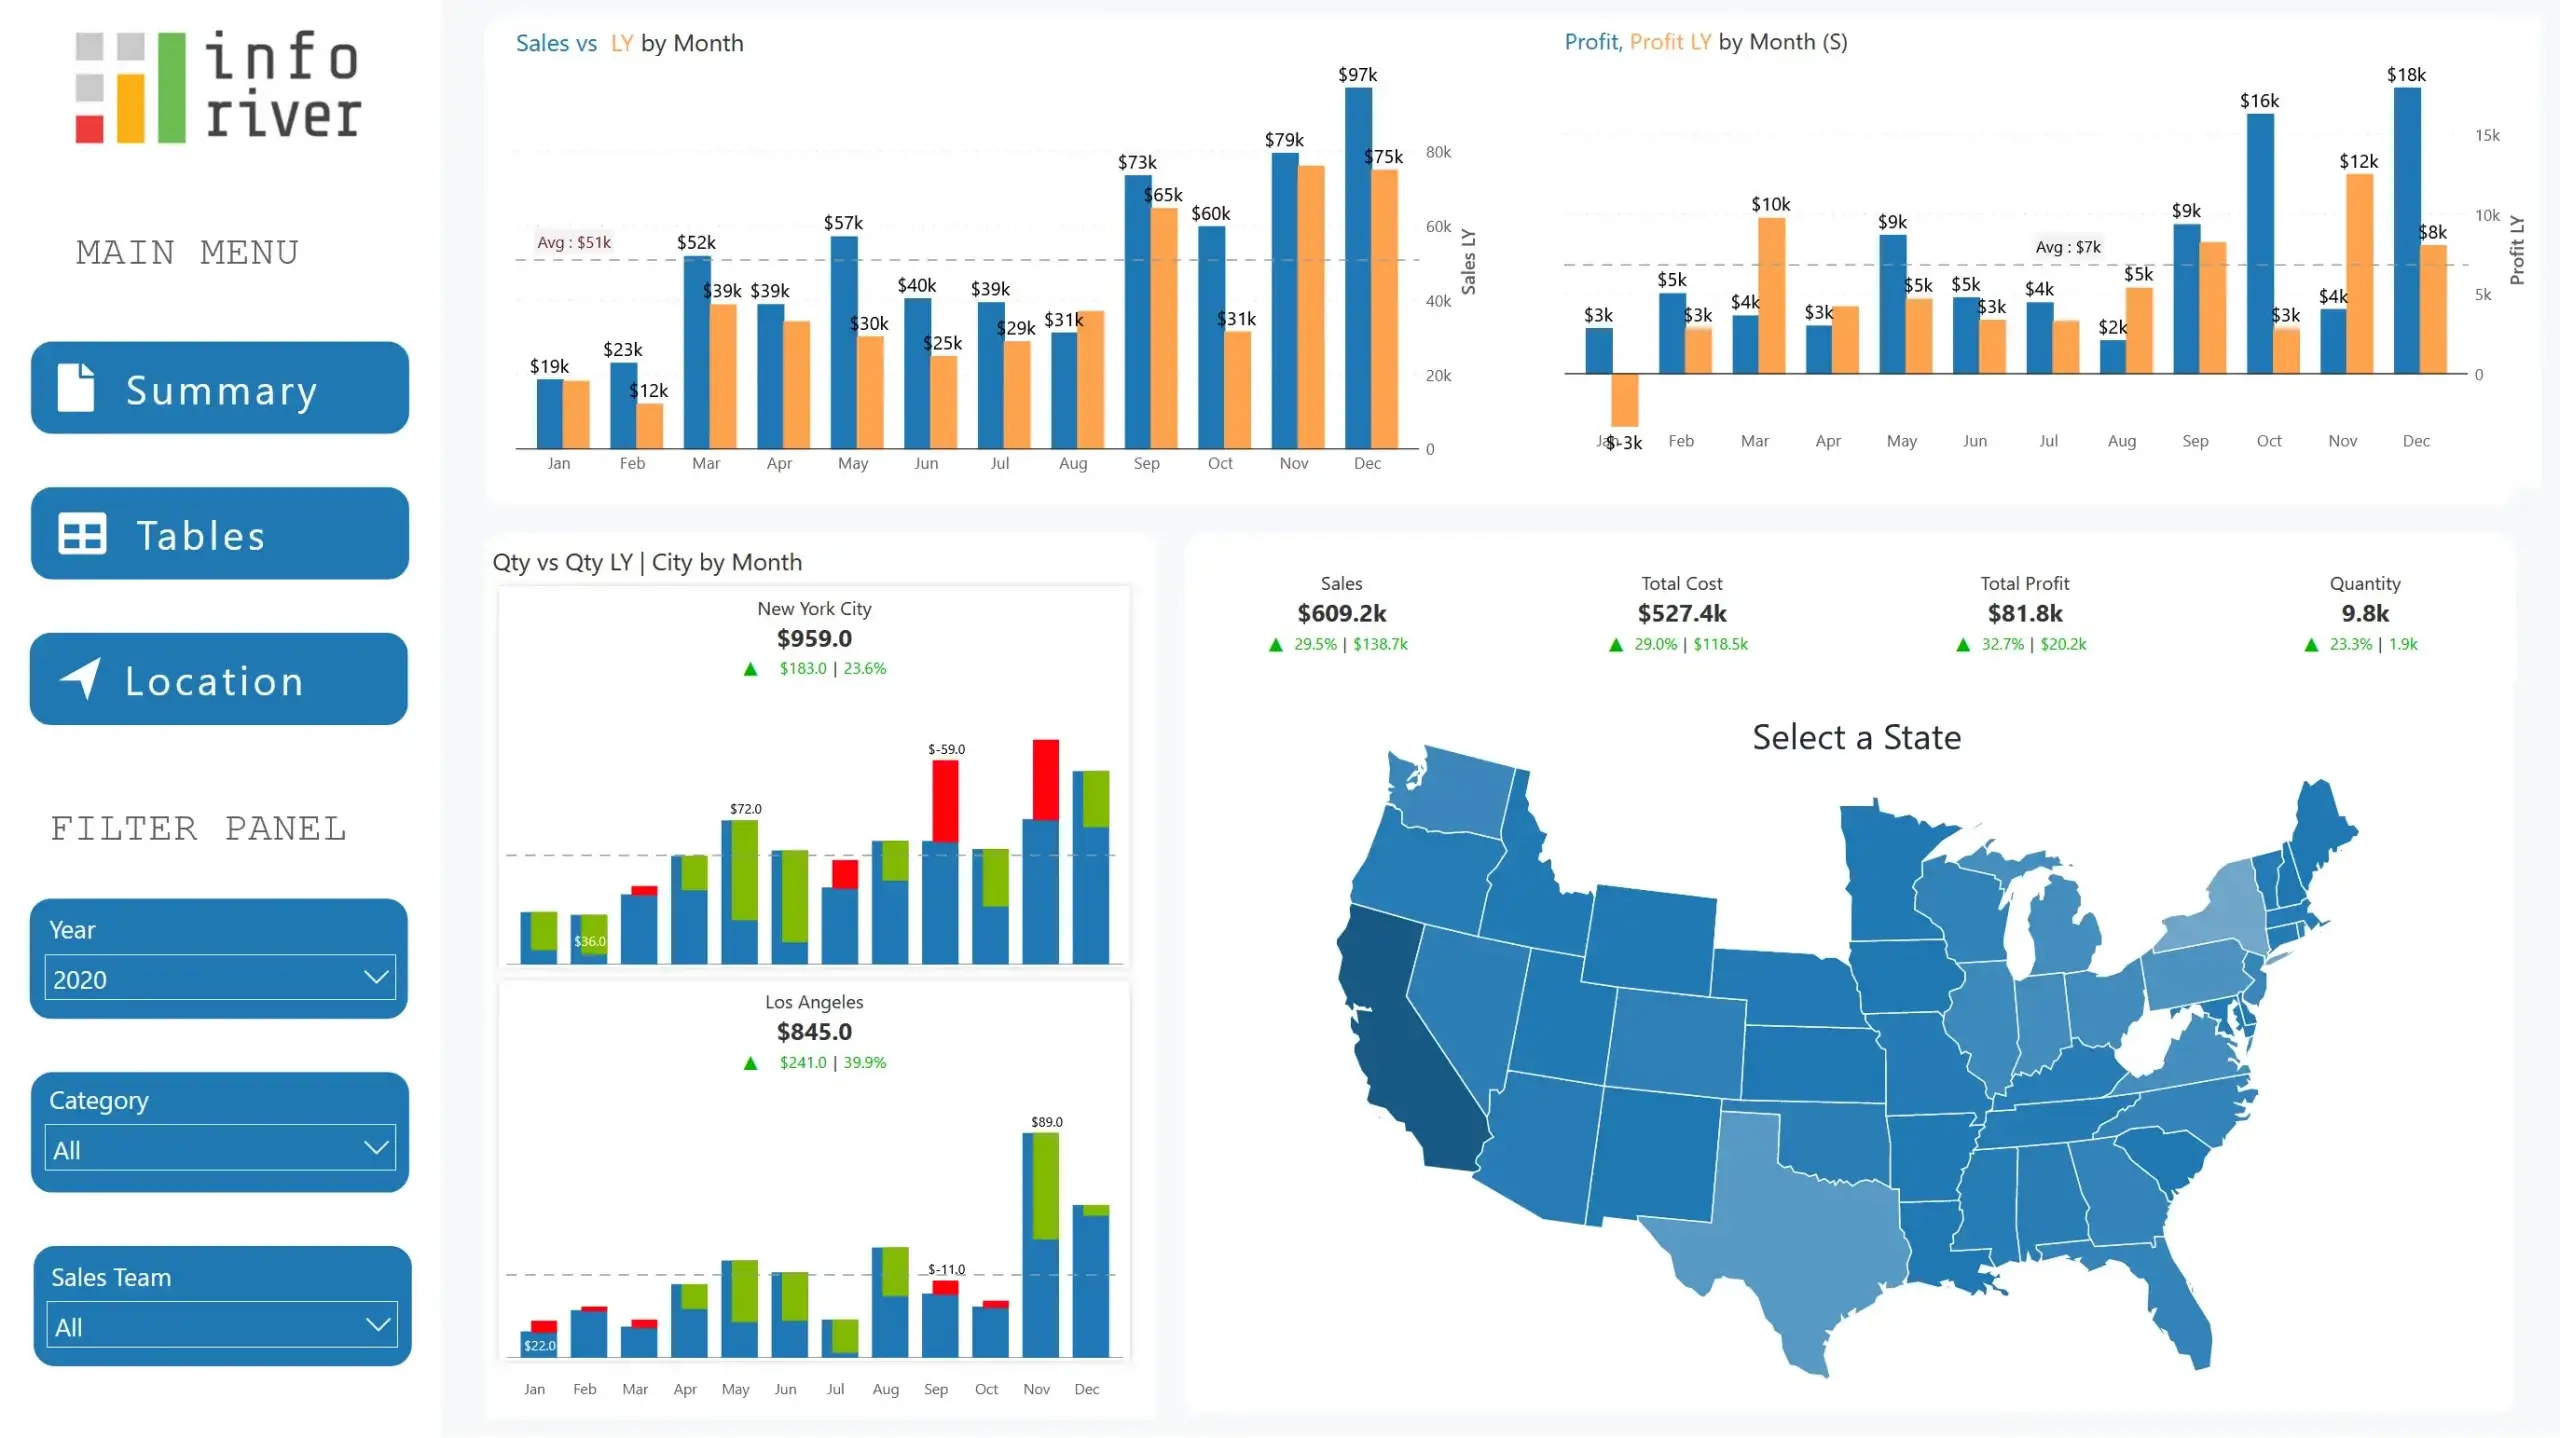
A sample dashboard showing YoY Sales by continents using Integrated Variance charts; also features KPI cards and sparklines
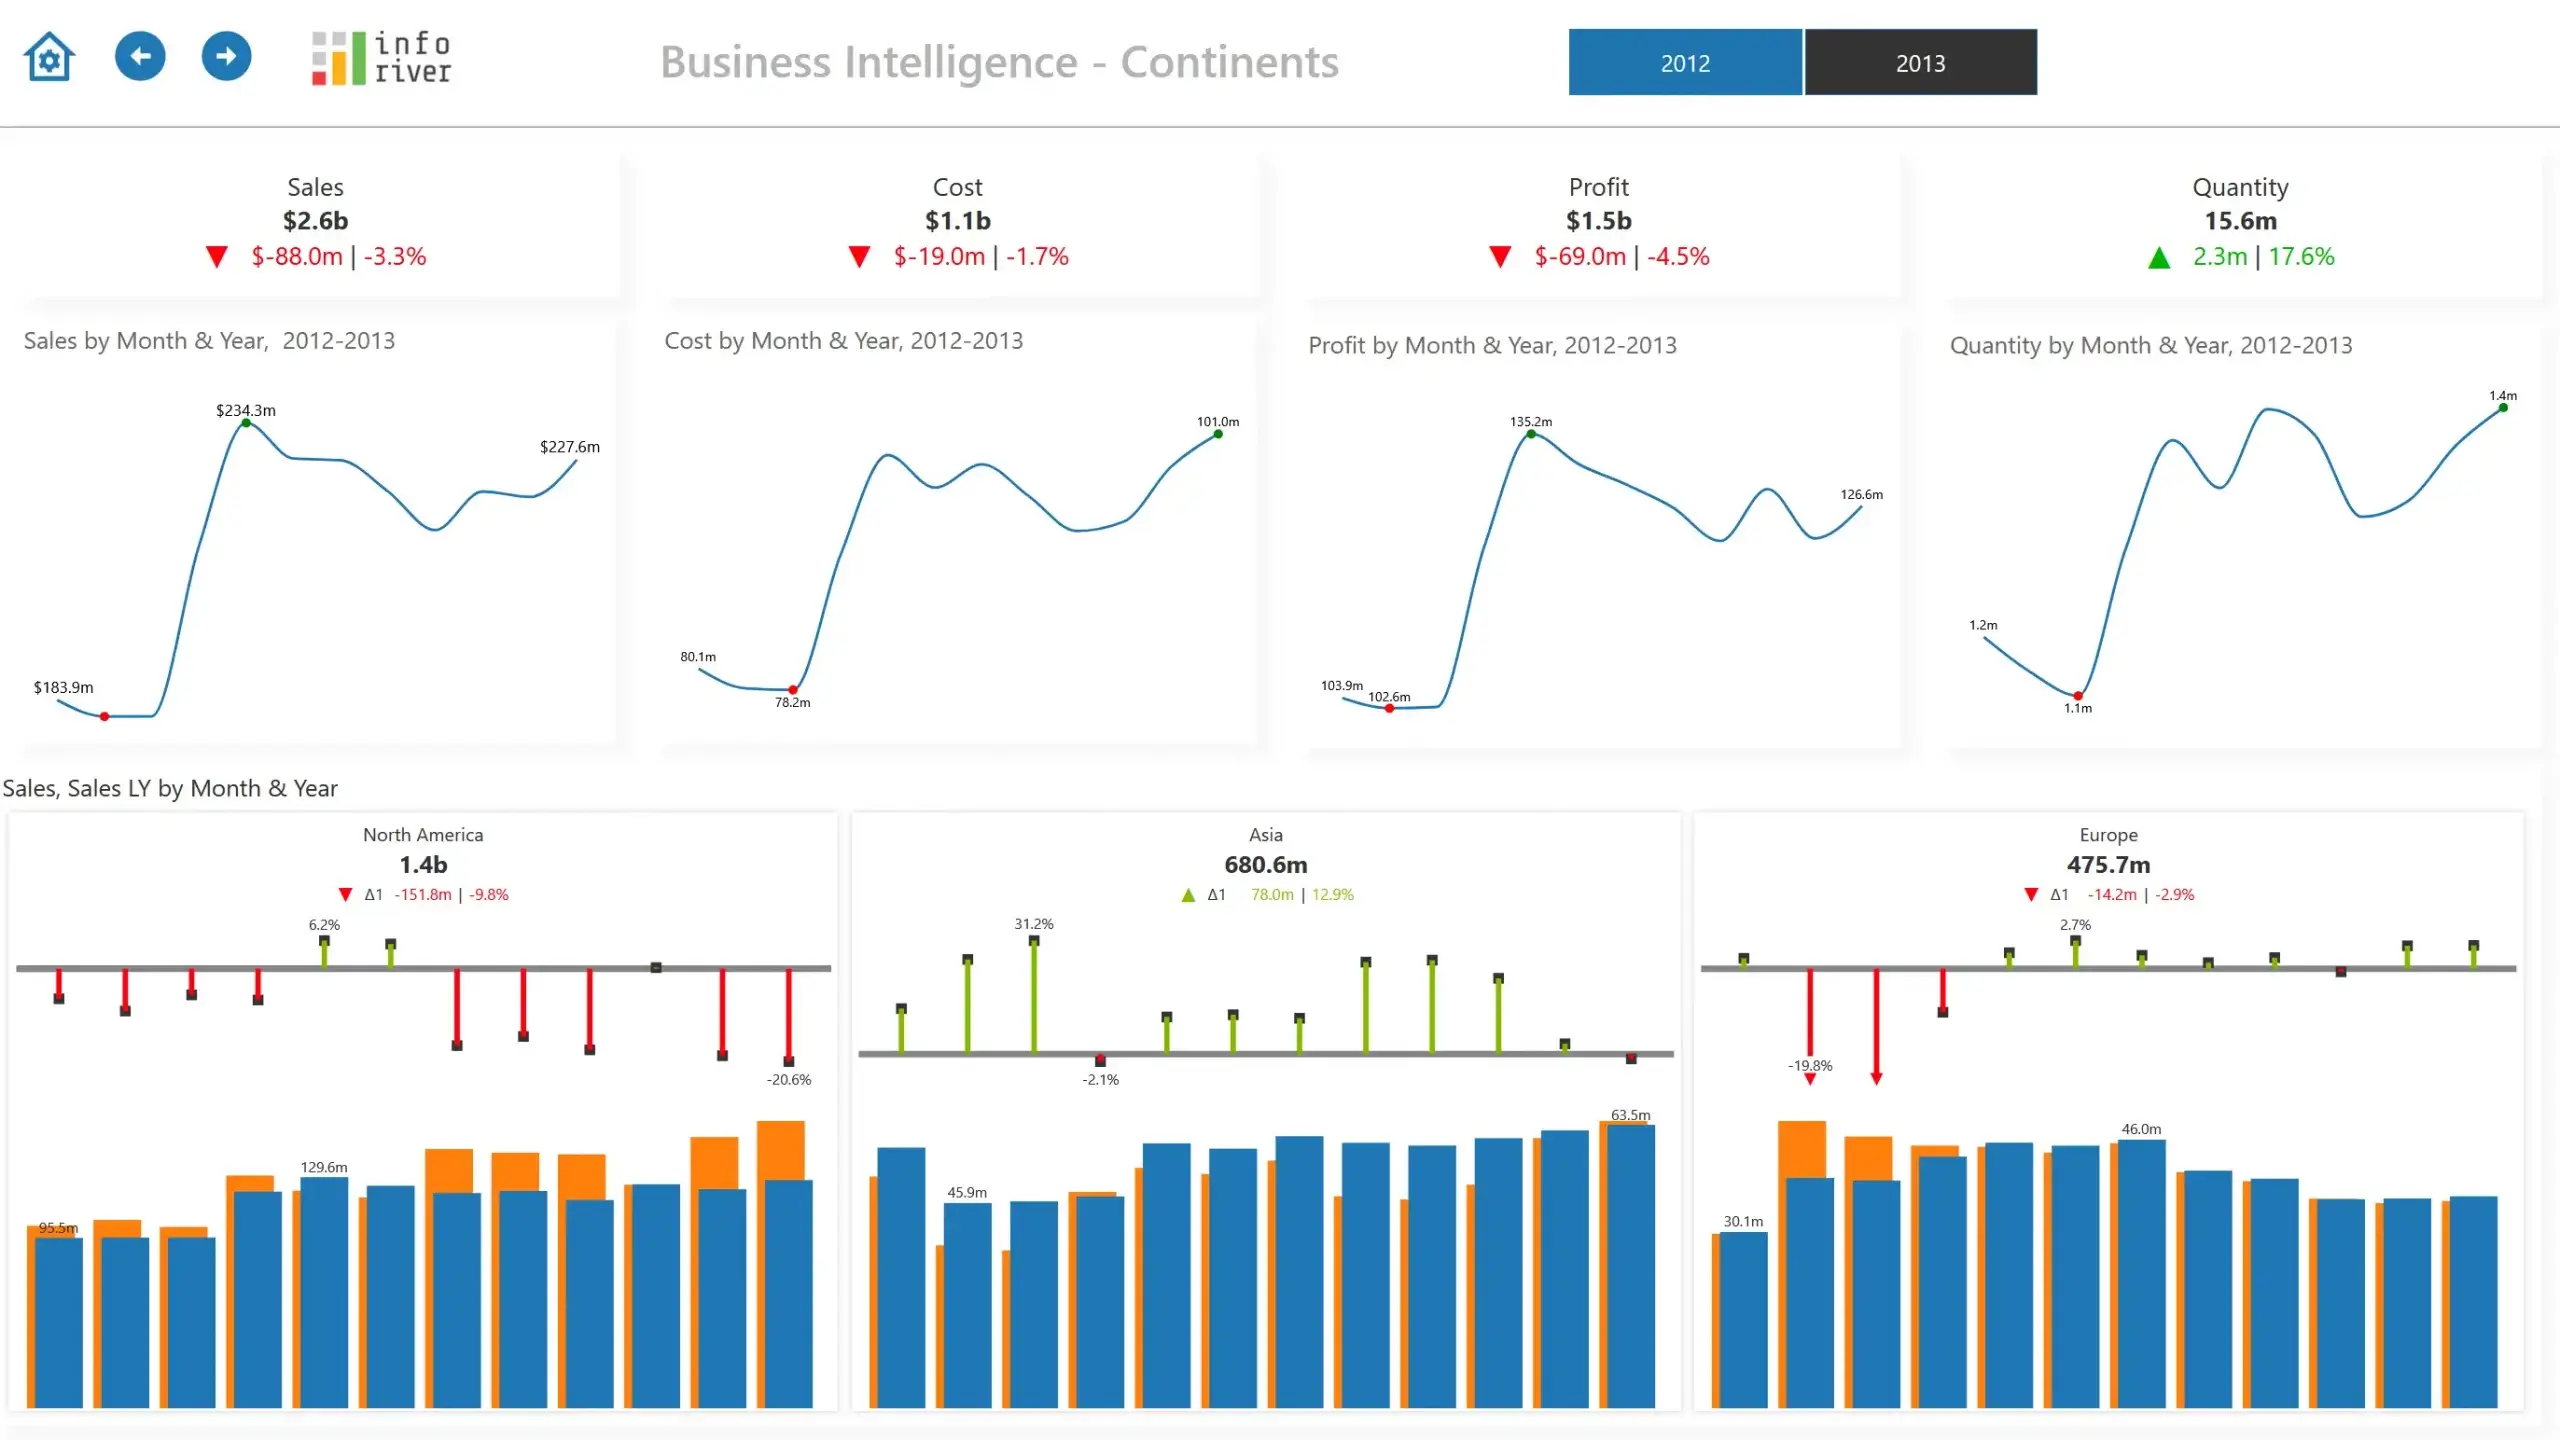
A dashboard showcasing YoY Sales at a quarter level using bar and pin charts in Reporting Matrix
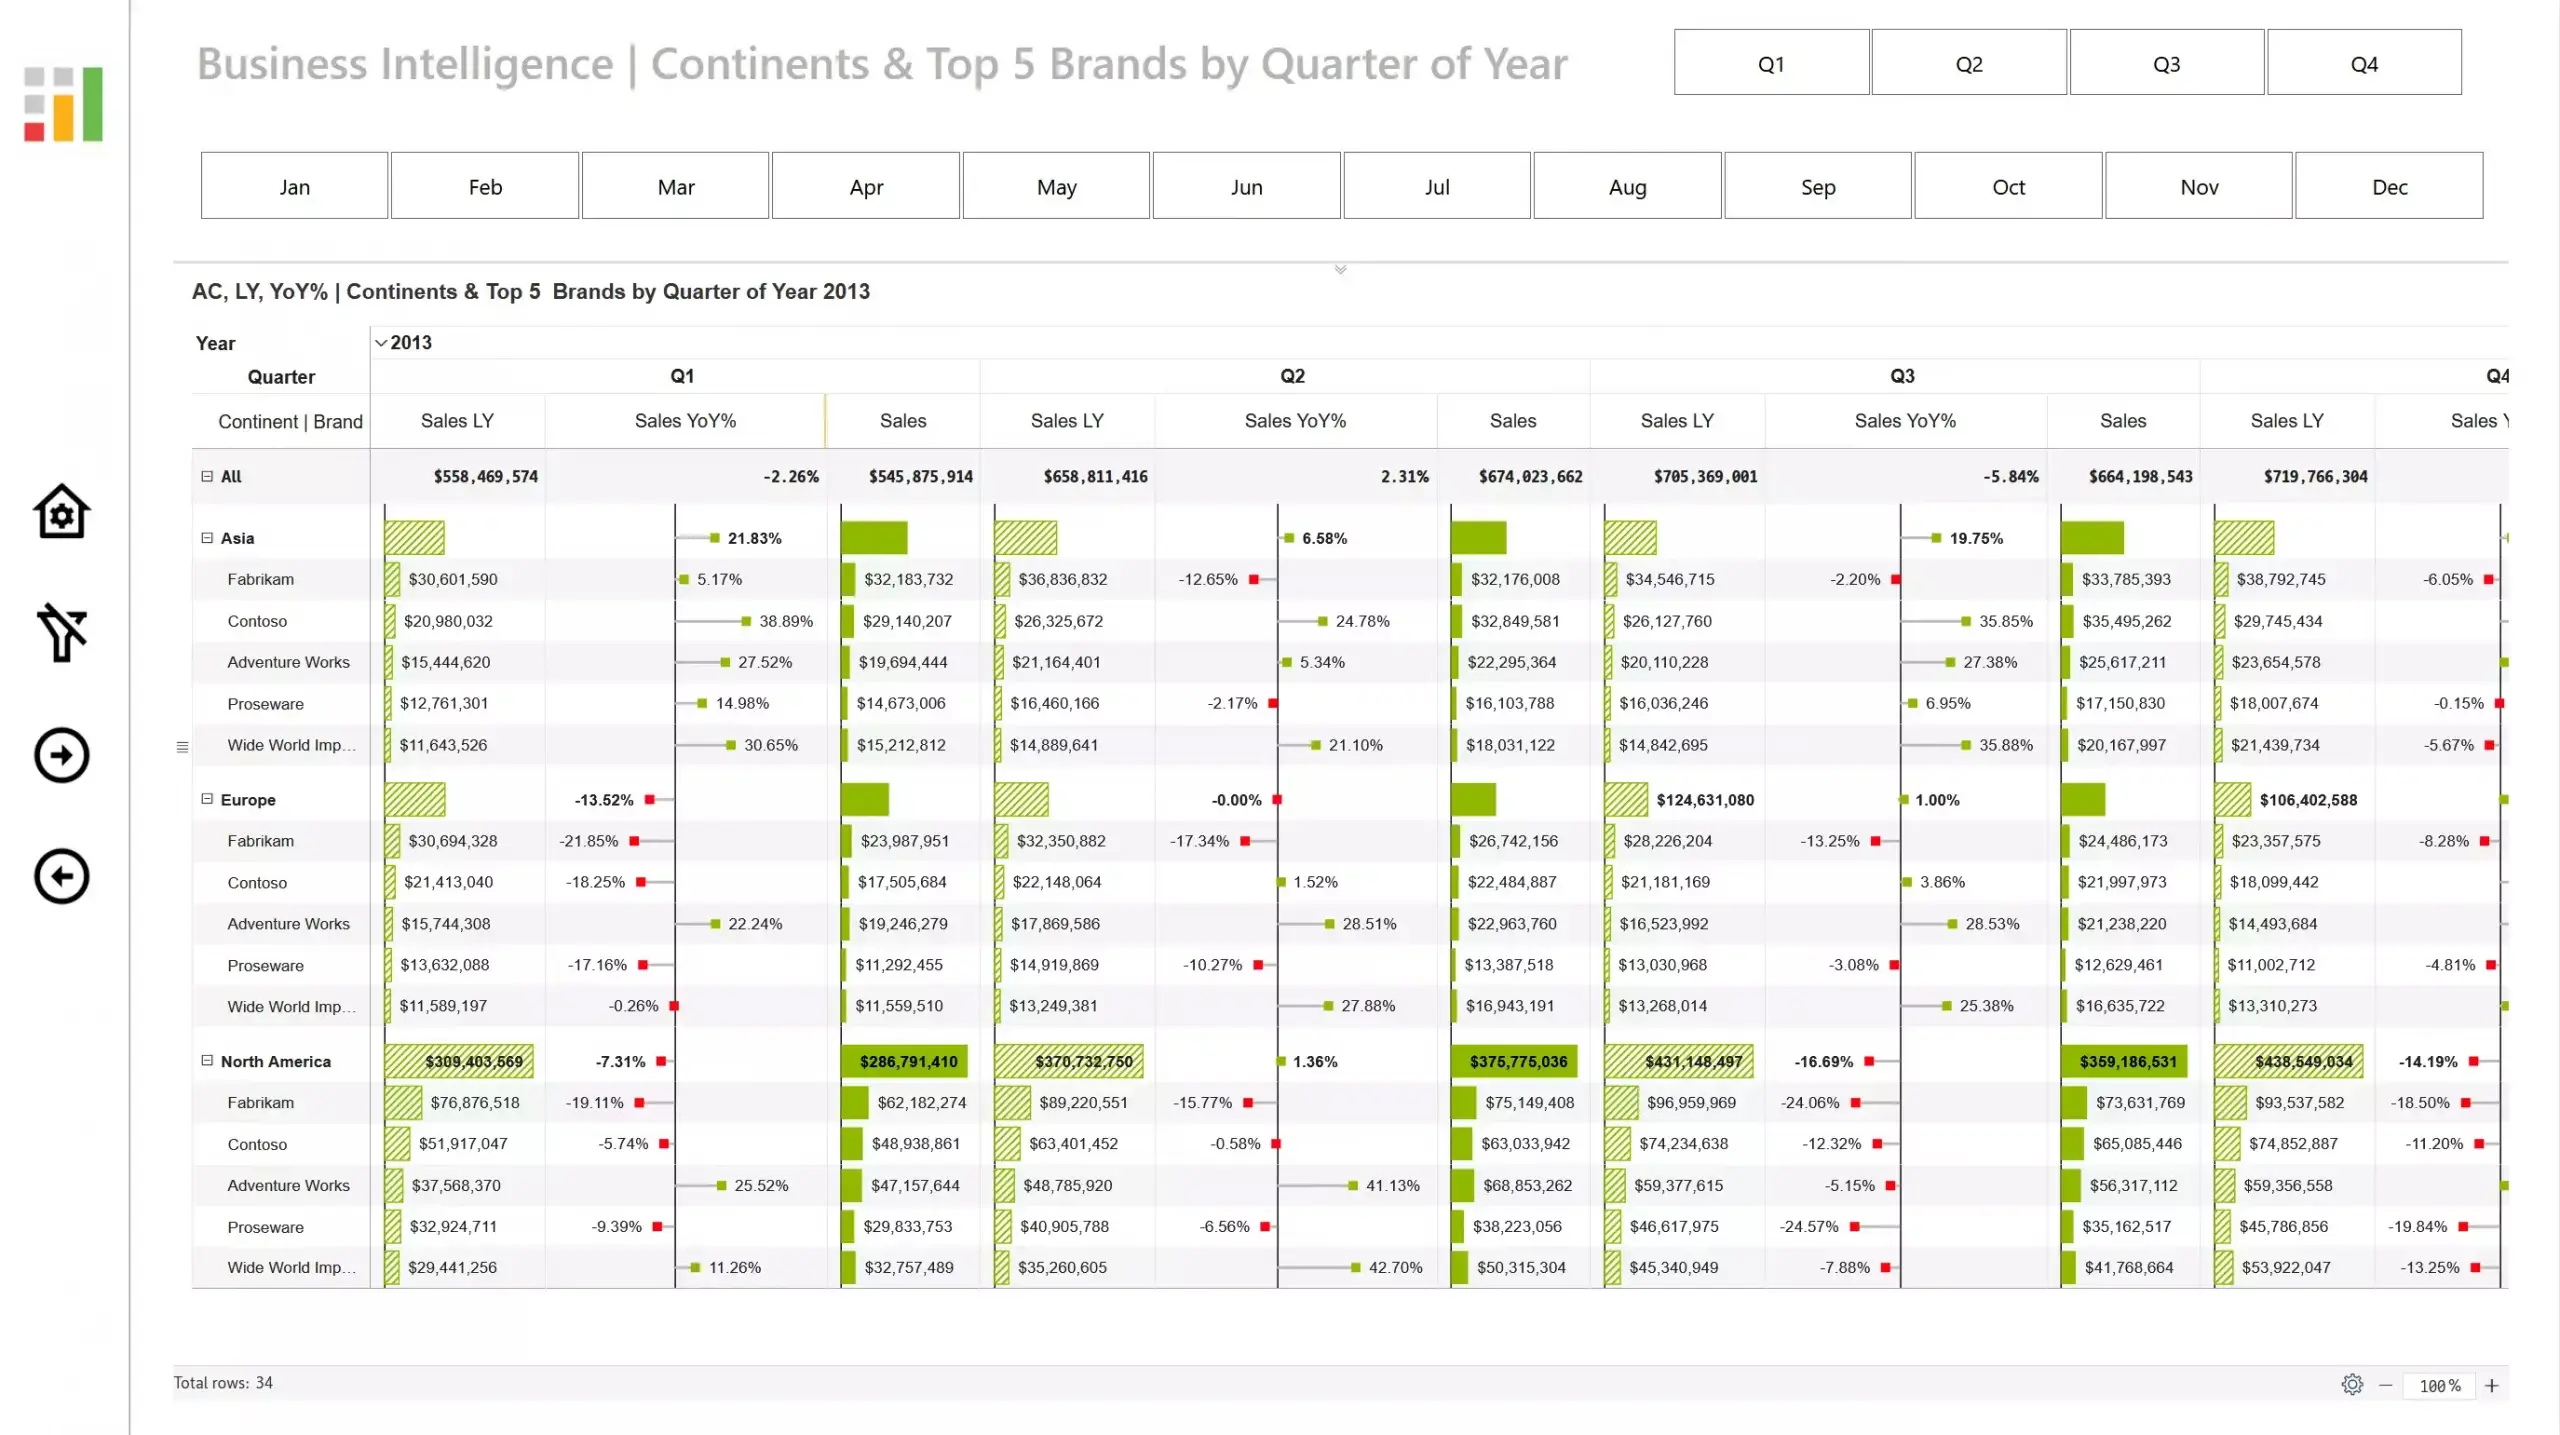
A product analysis dashboard showcasing Horizontal Waterfall + Column charts for monthly sales compared to the prior year
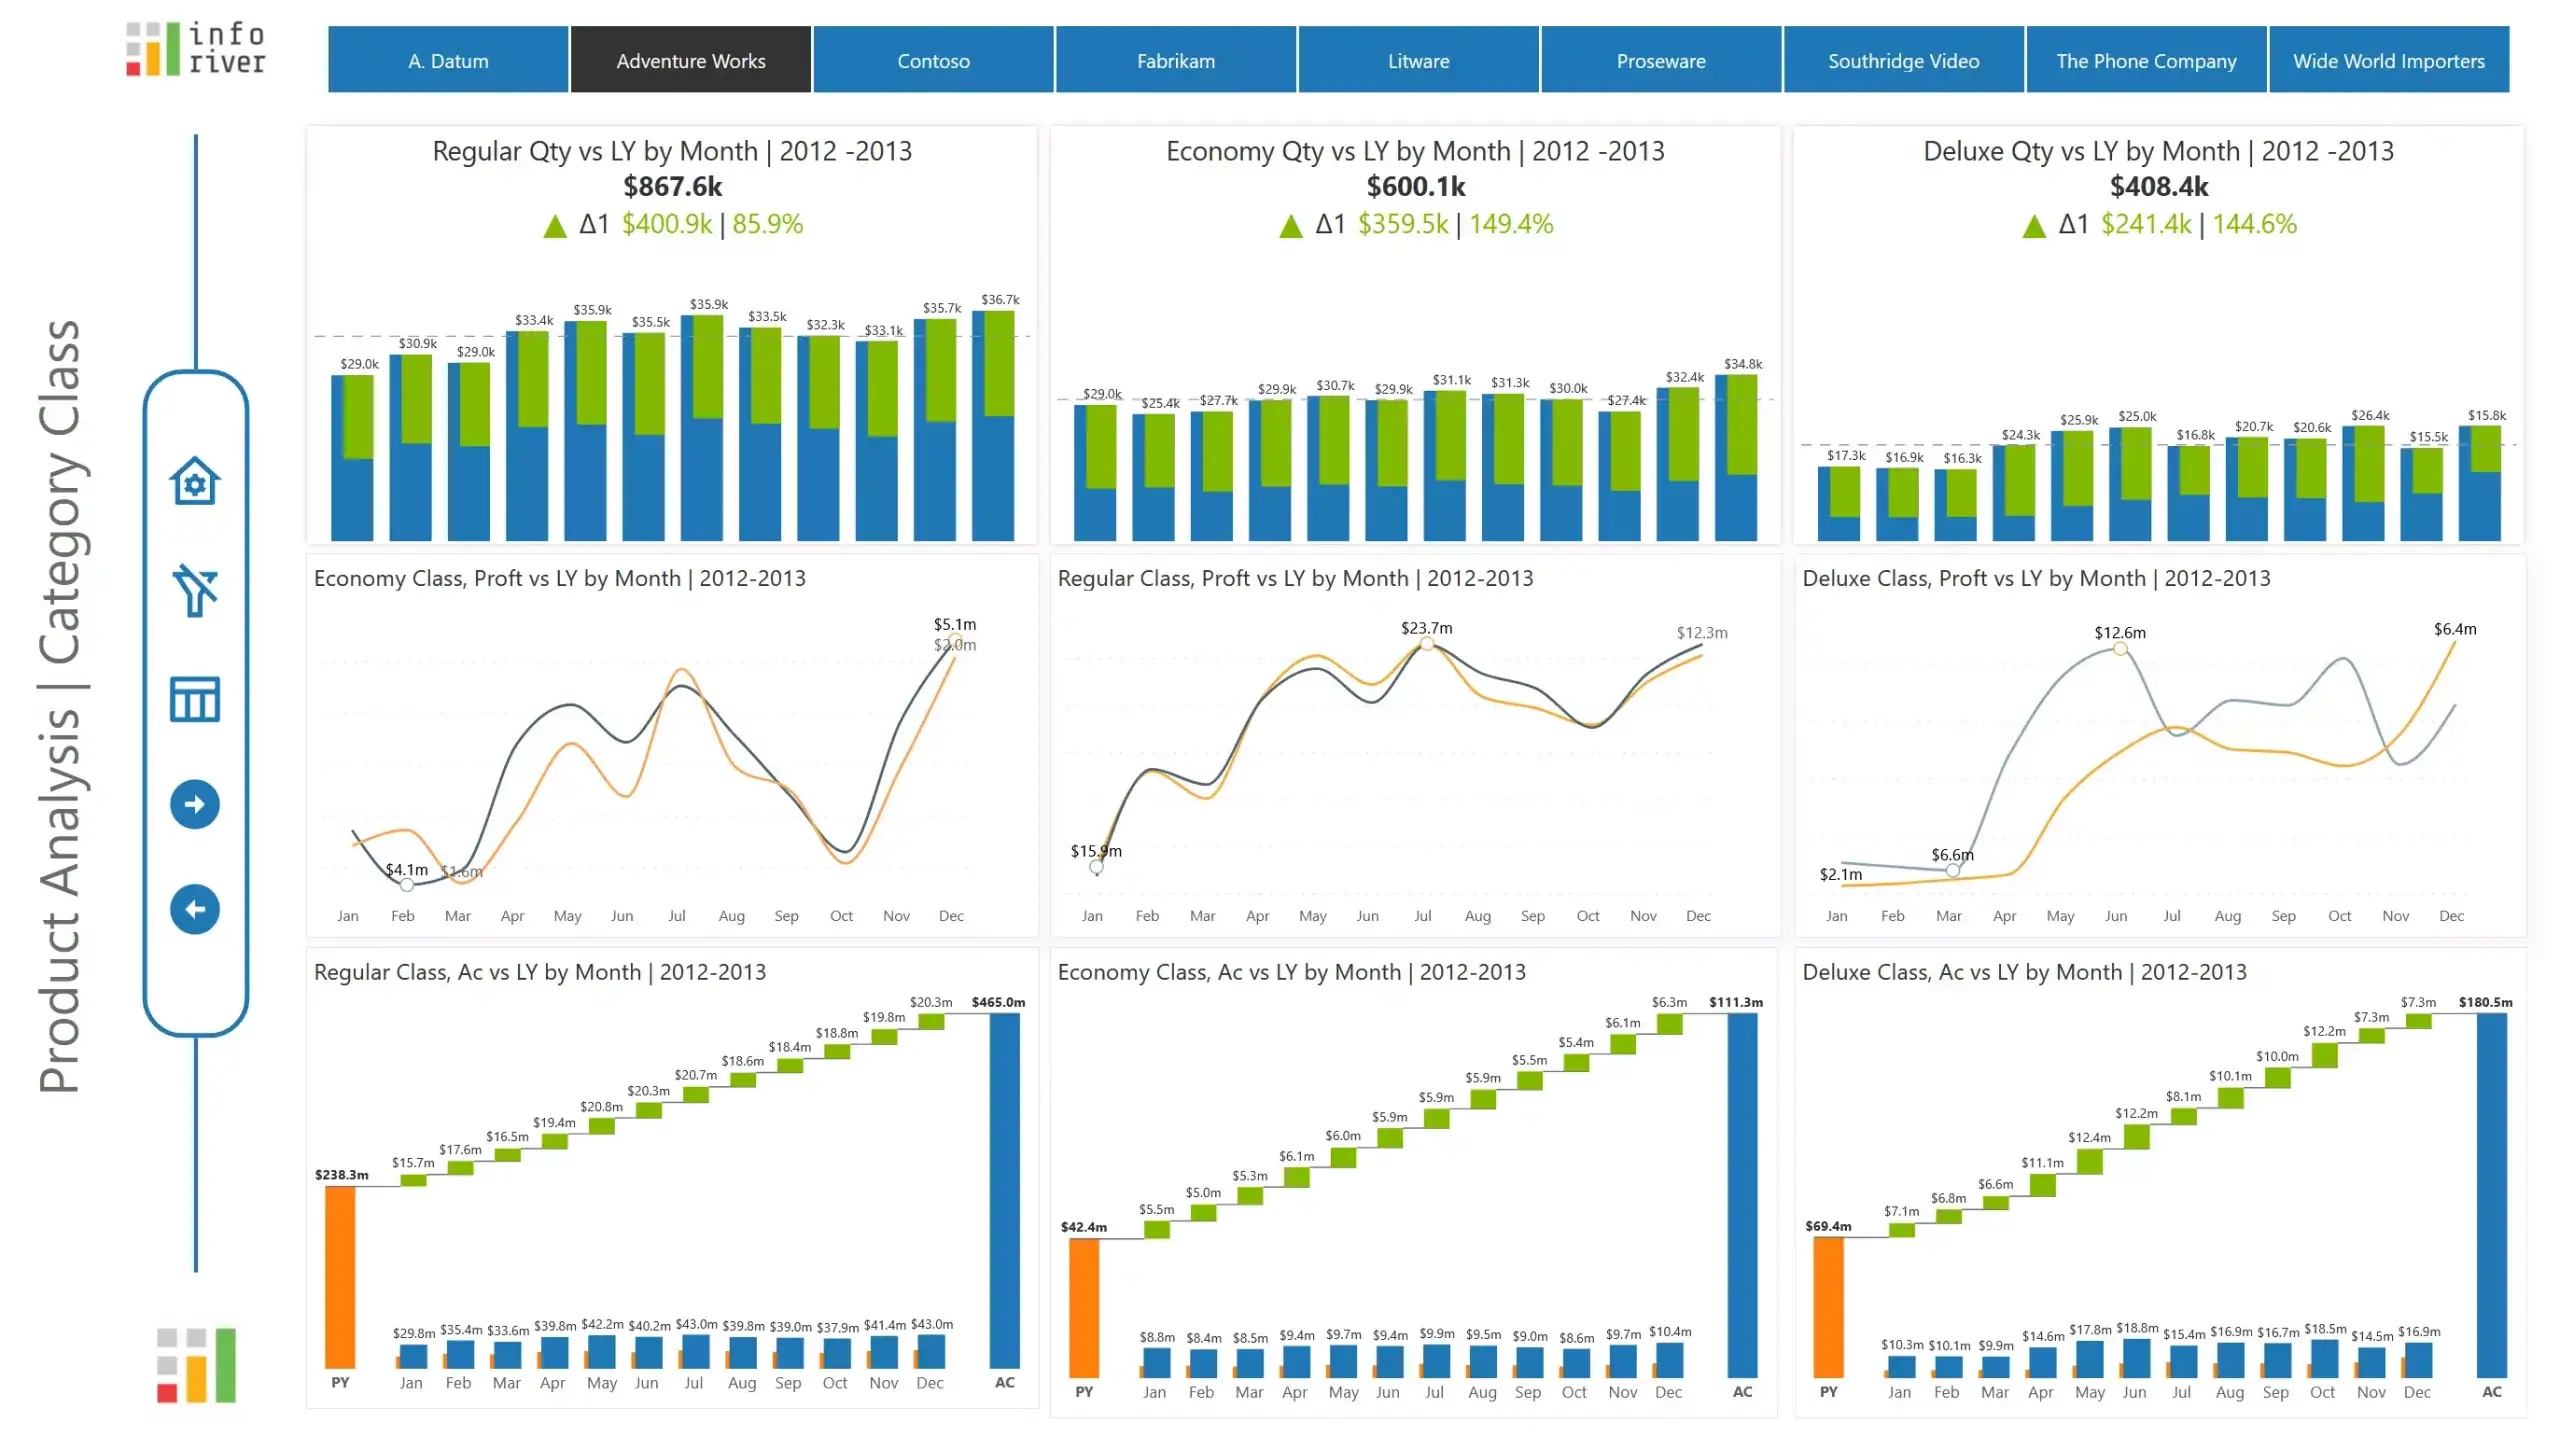
A product analysis dashboard showing a comparison of quantity across quarters; uses Charts and KPI cards in the header
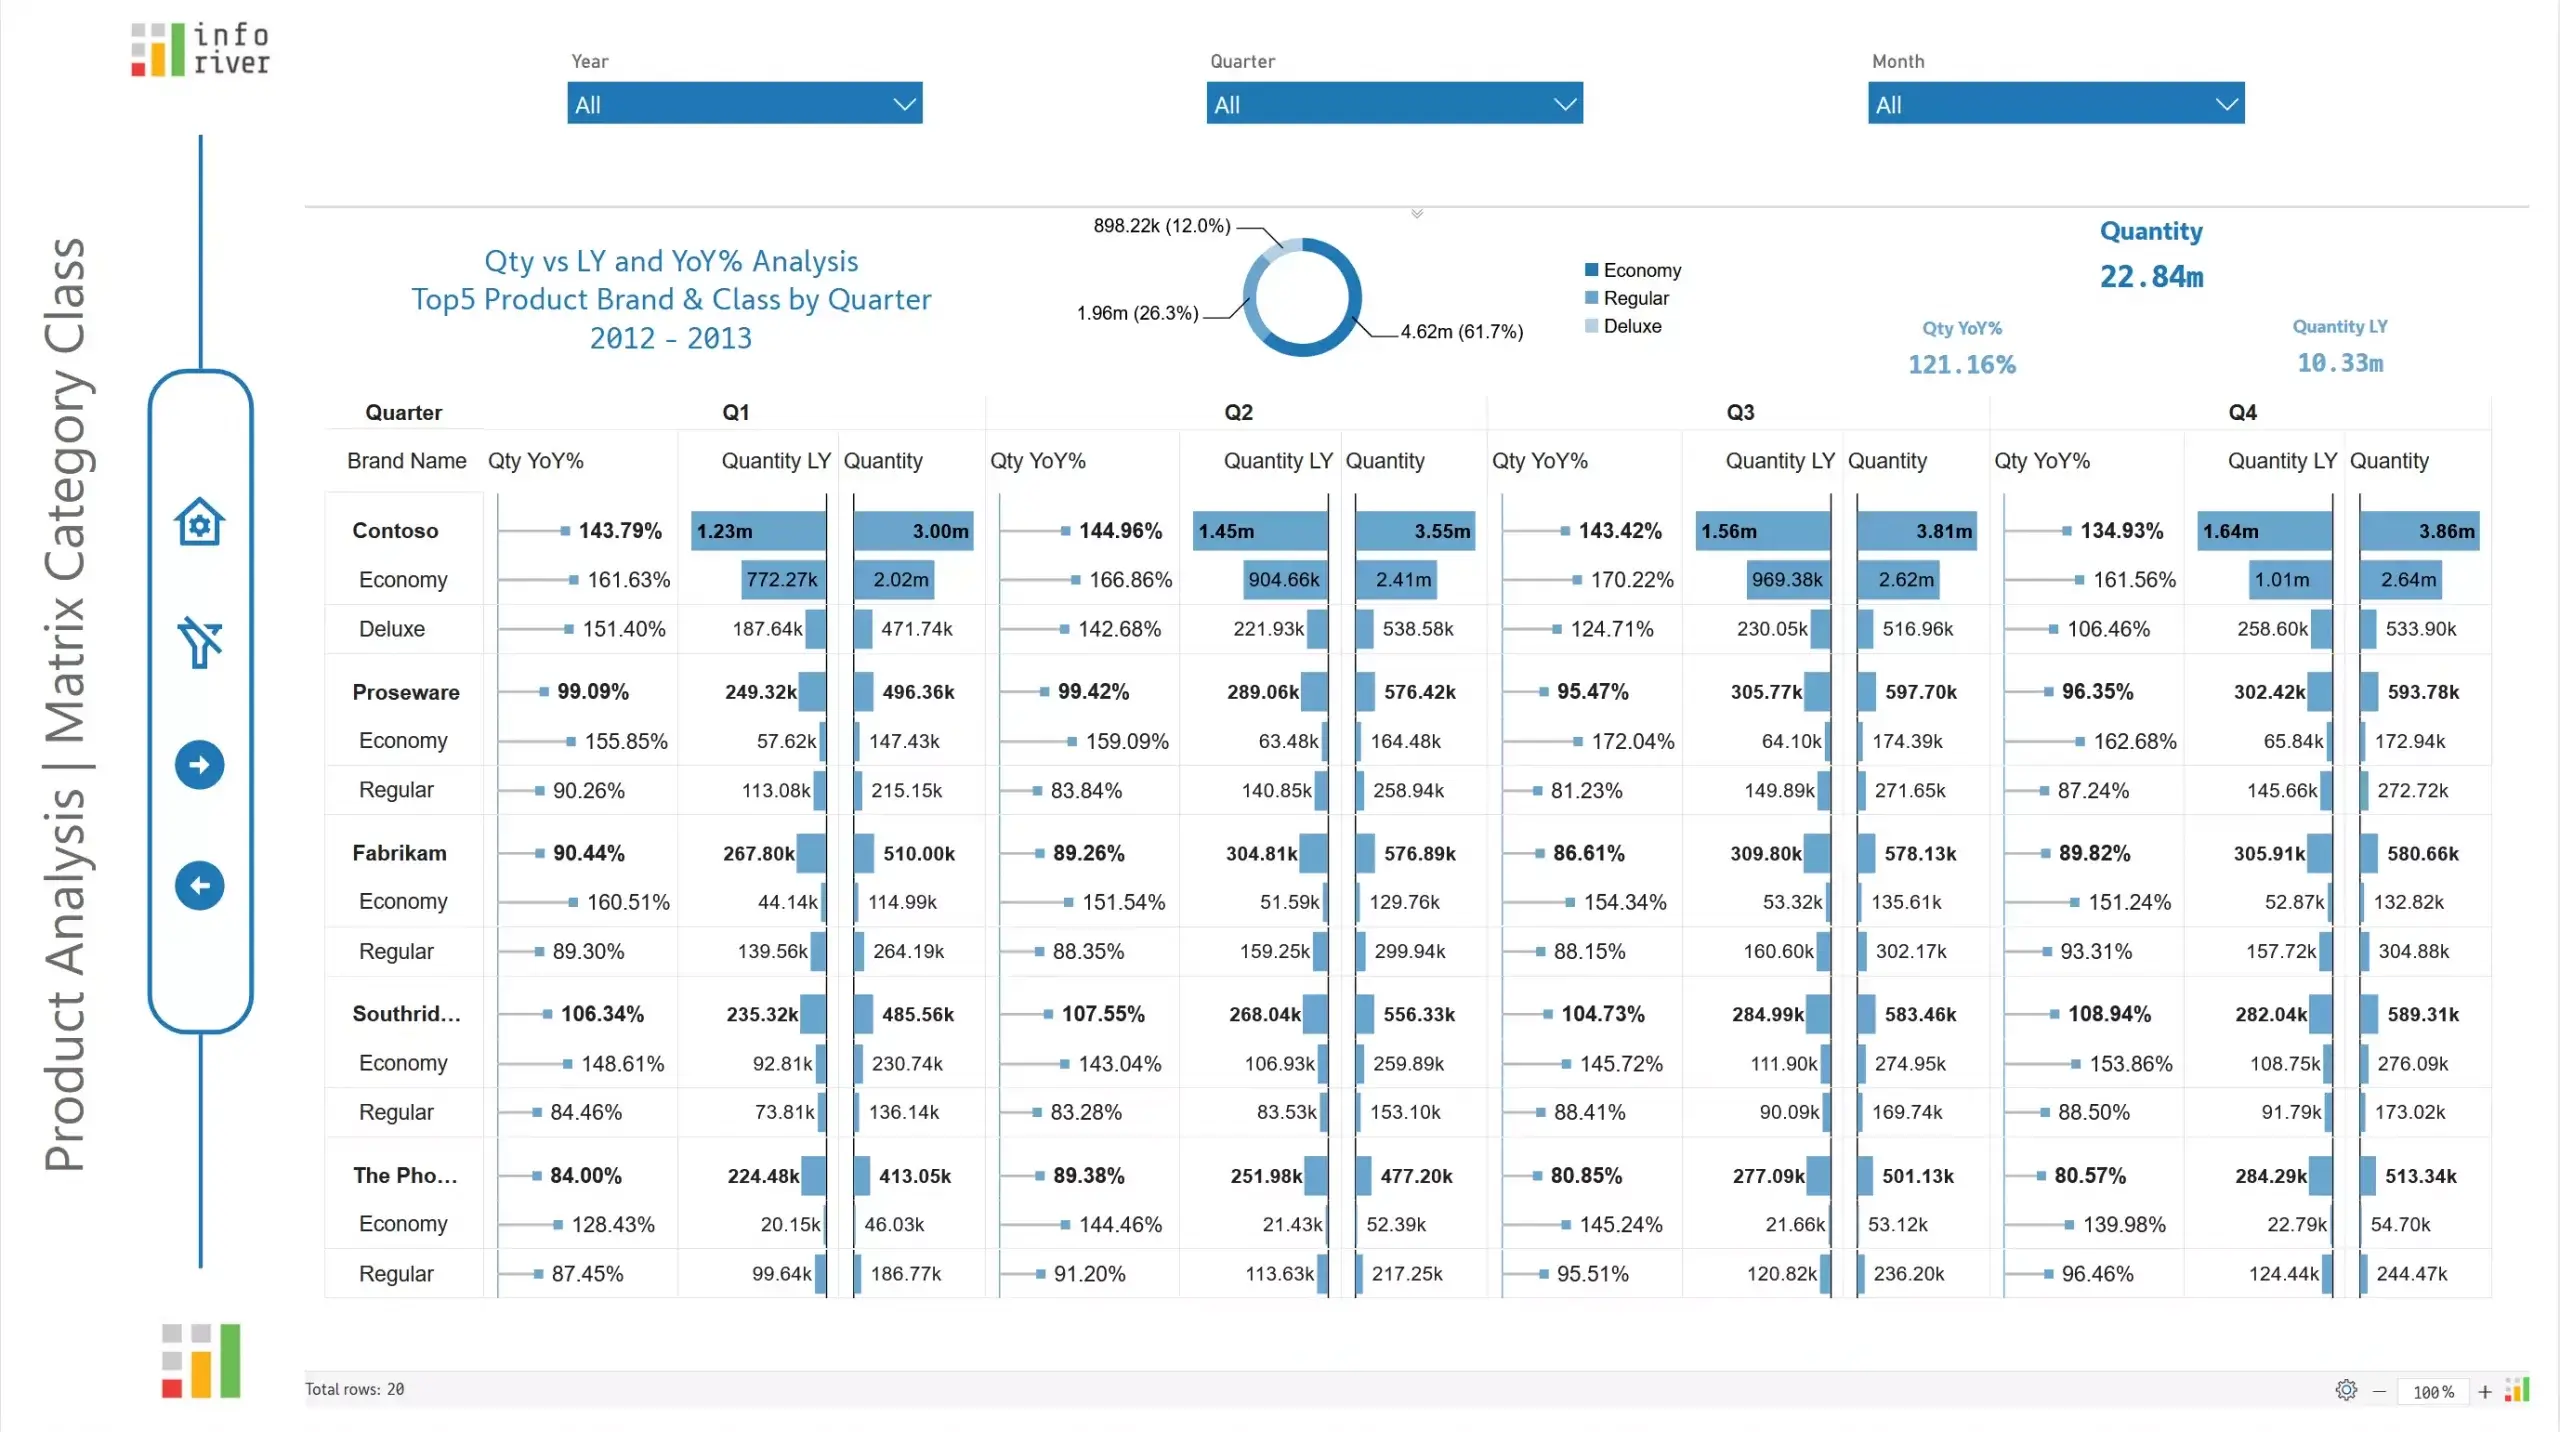
Use Stacked charts to visualize contribution by categories or segments; also showcases bar charts and KPI cards
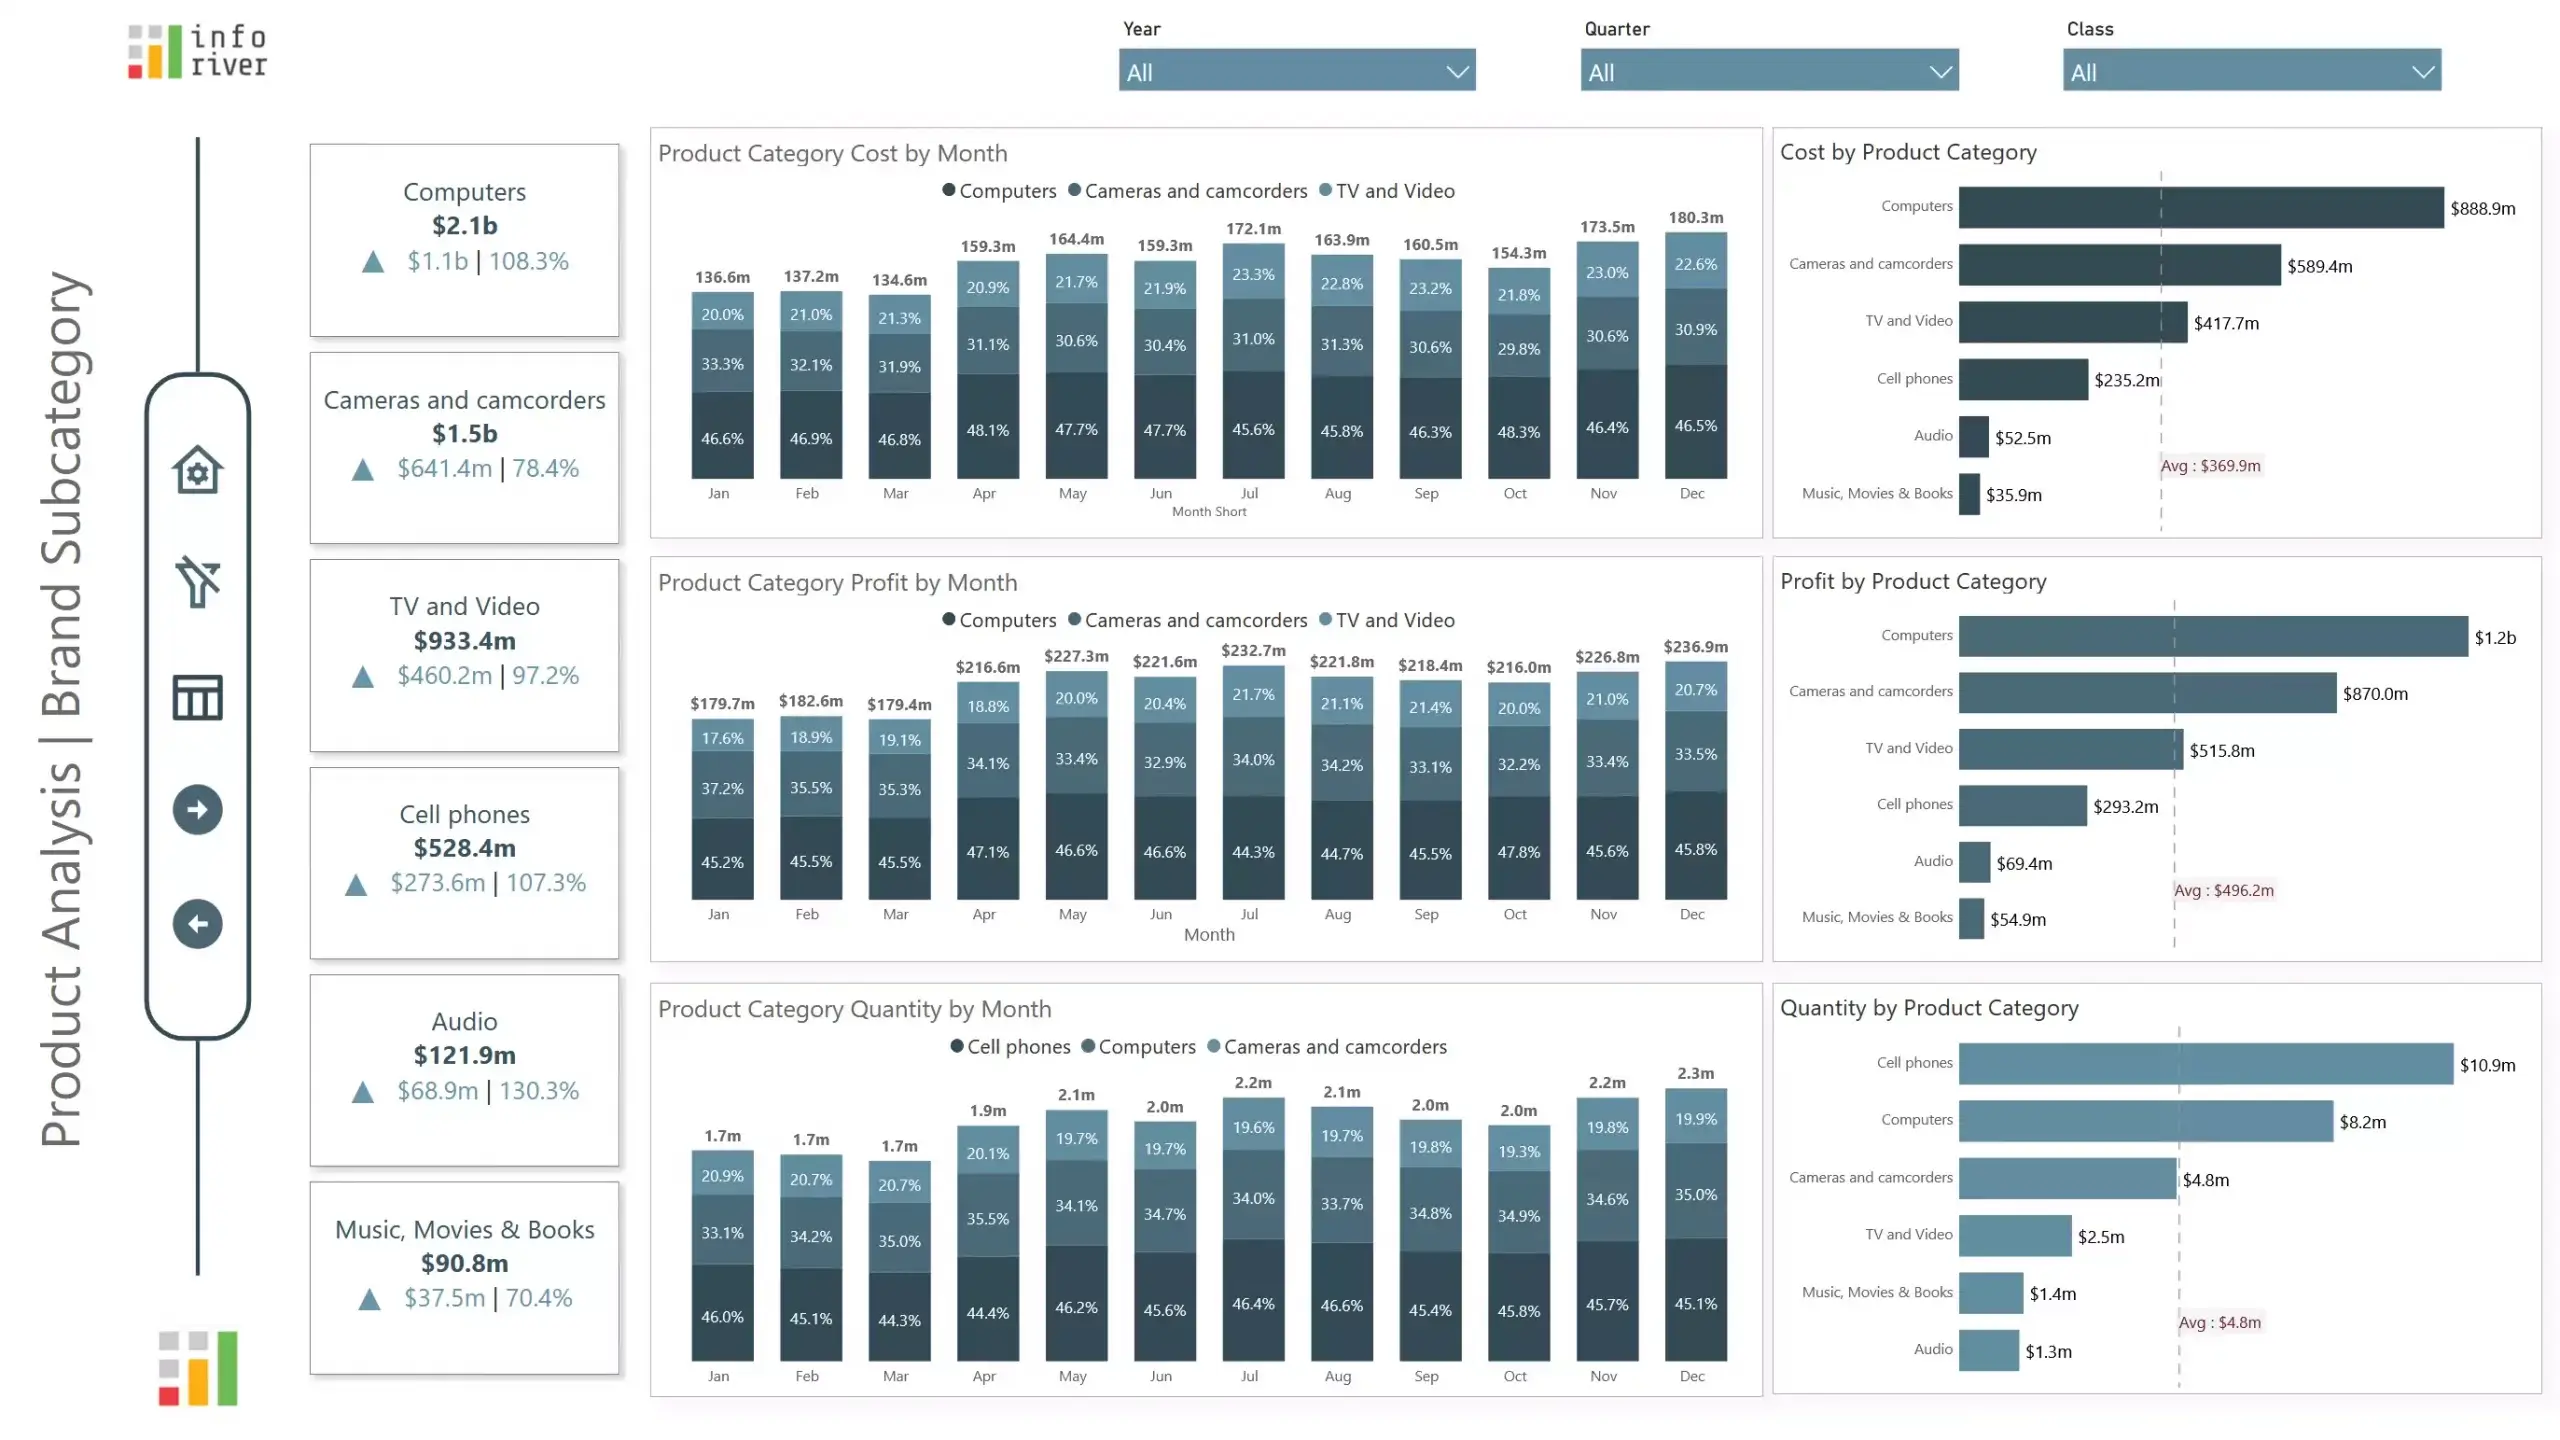
Compare values for two years using Tornado charts; doughnut chart is used to show composition in the header
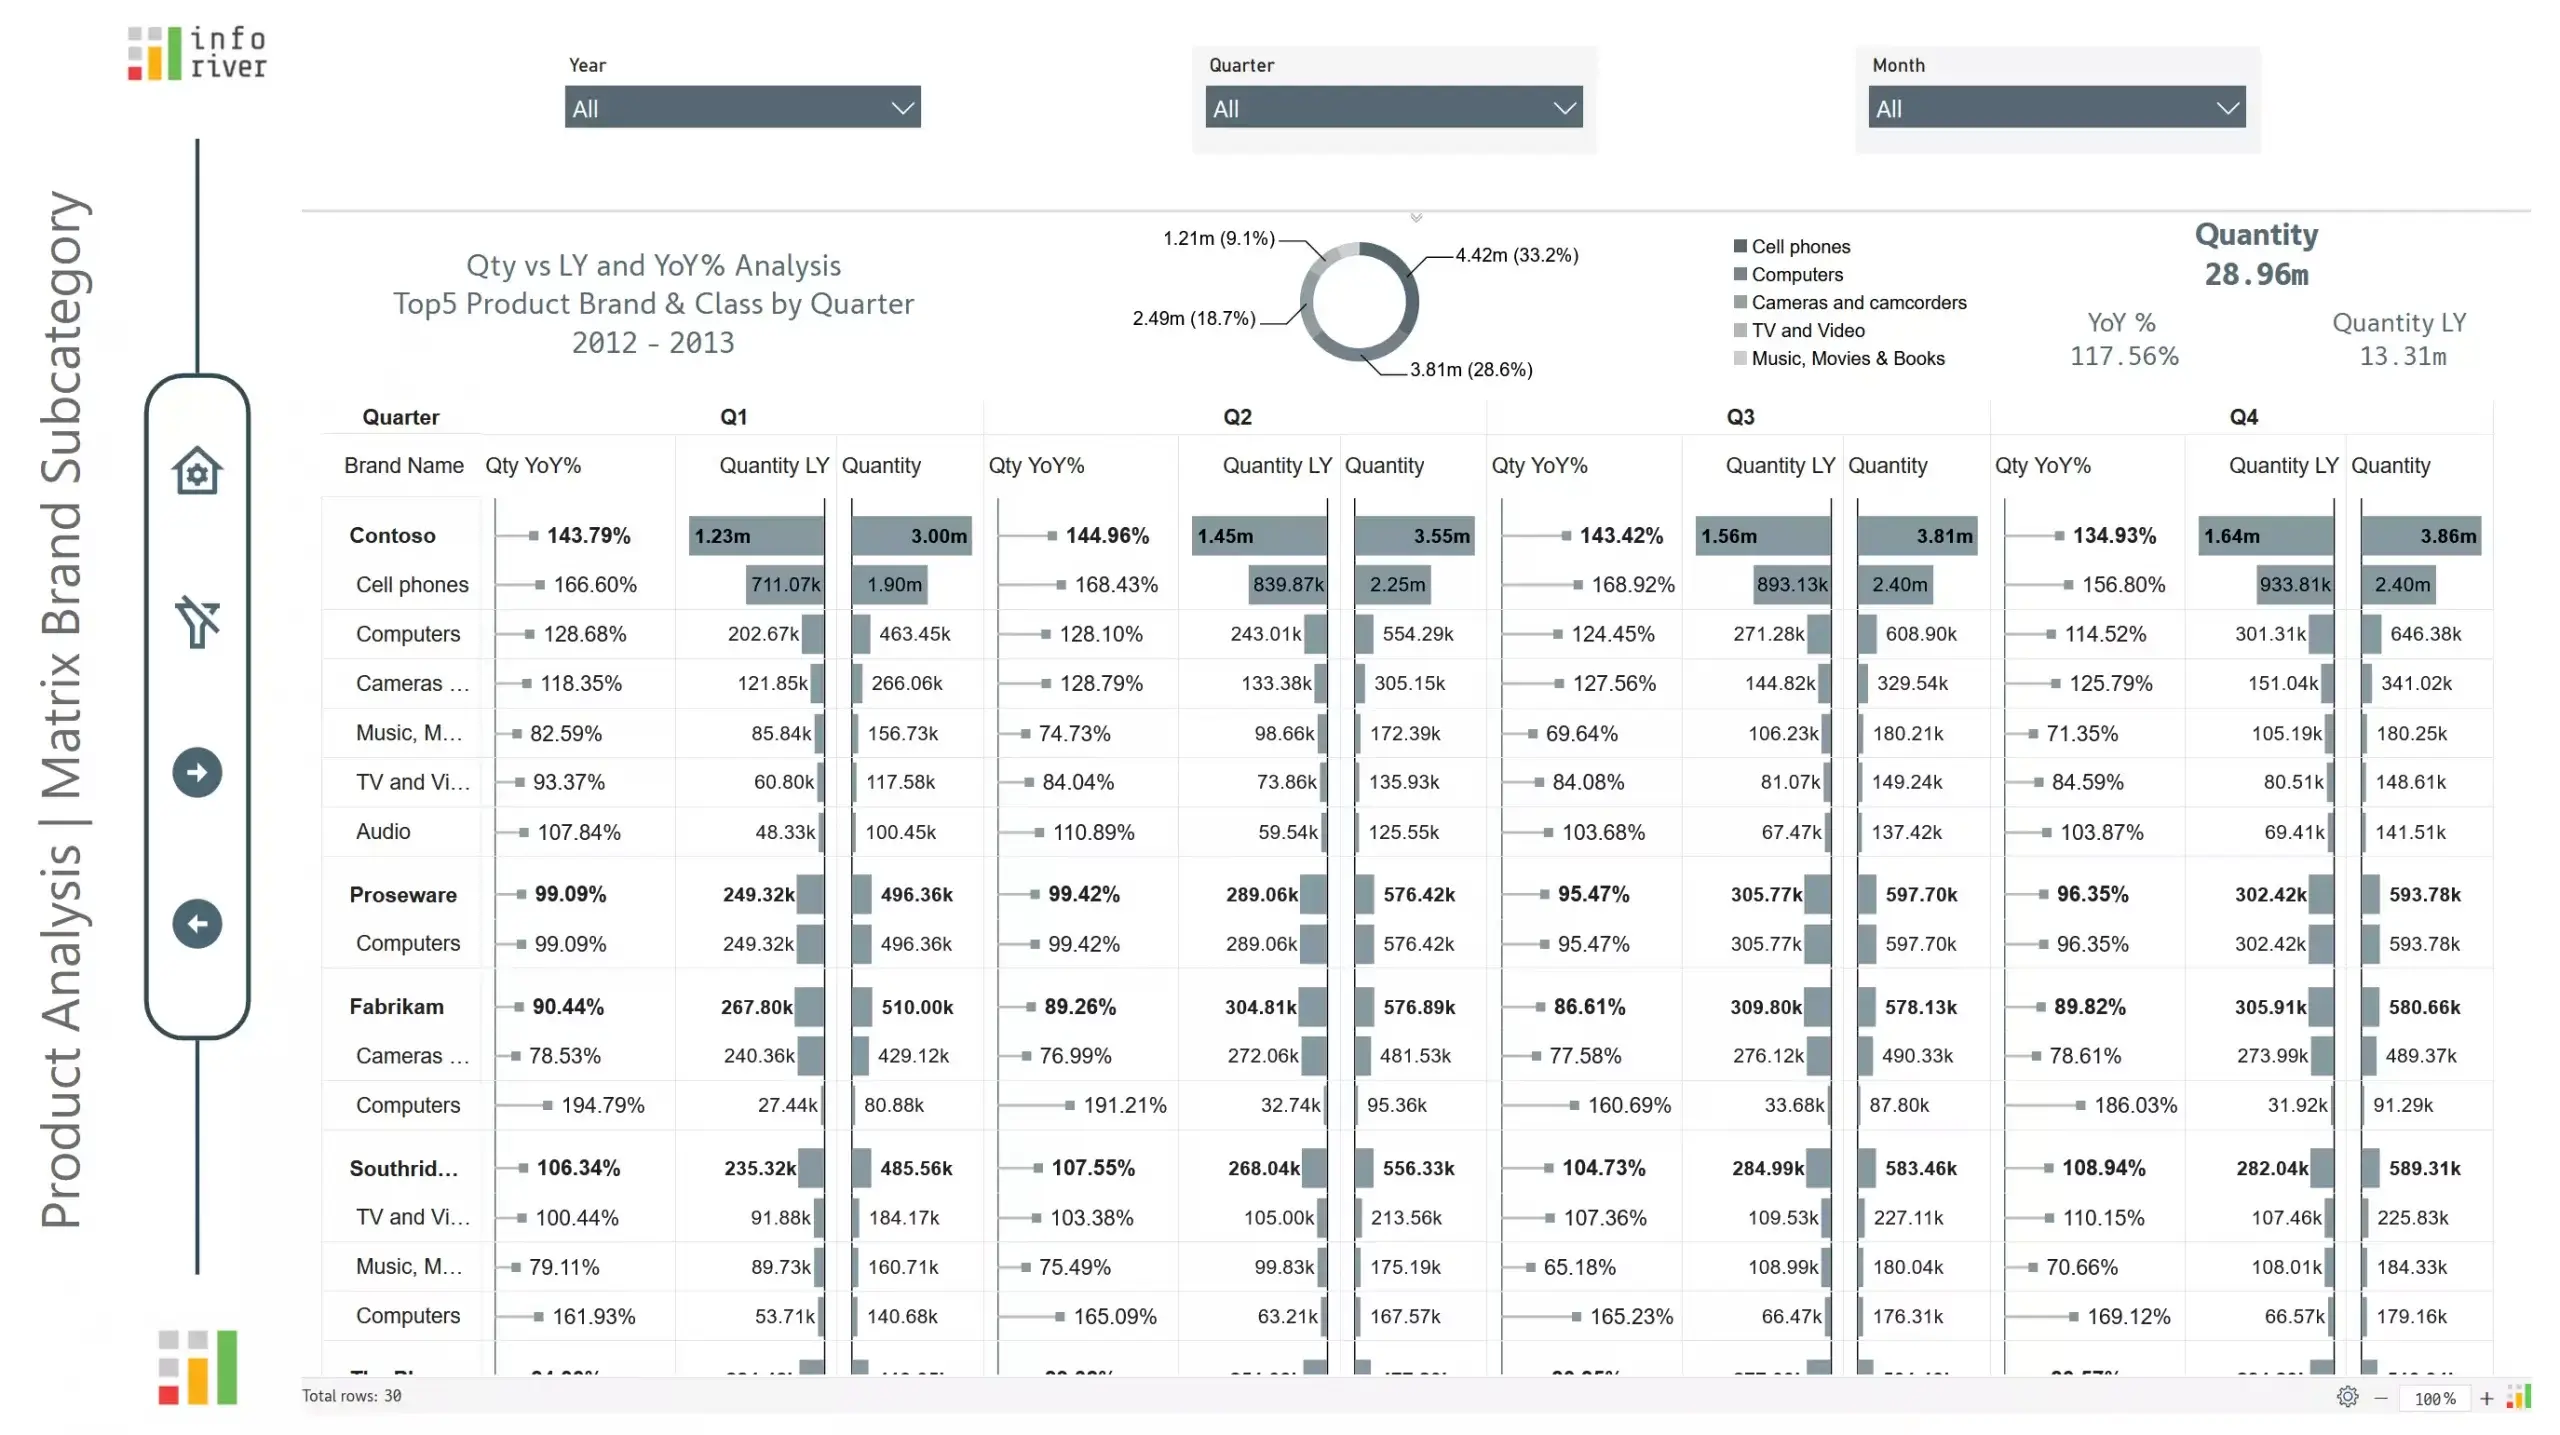
A sales analysis dashboard showing sales, profit & discount using a Variance Column chart
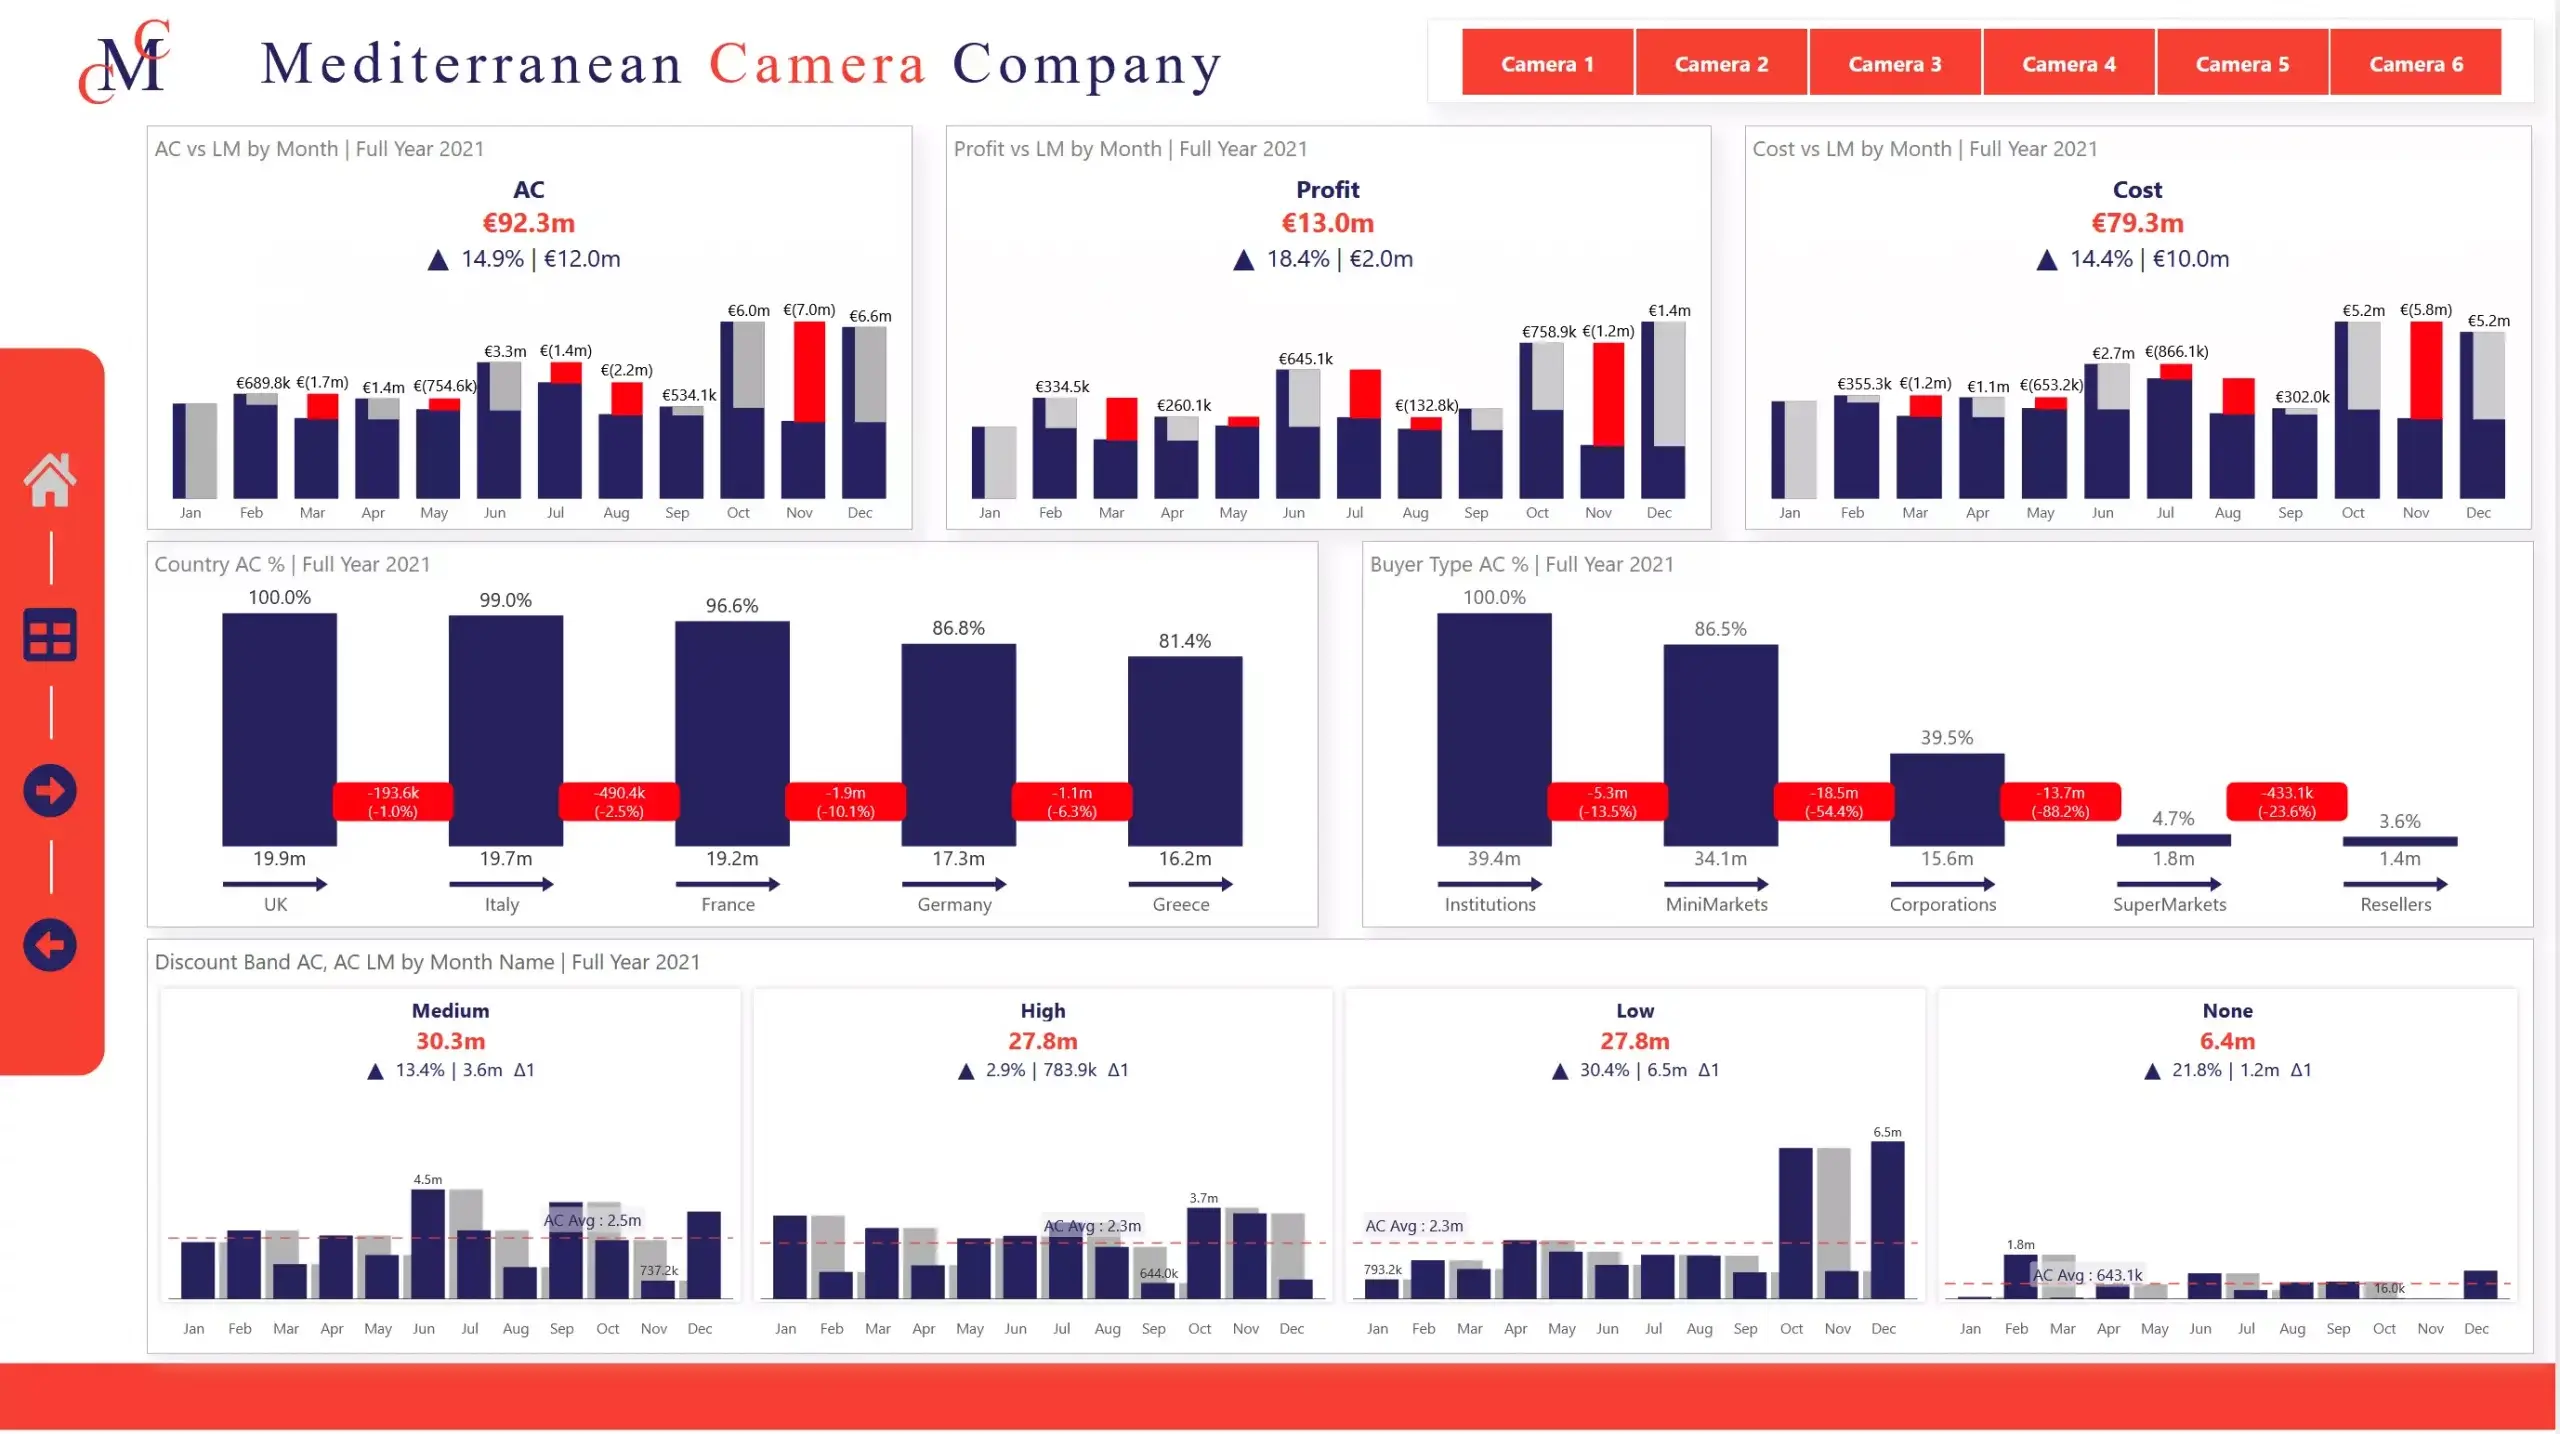
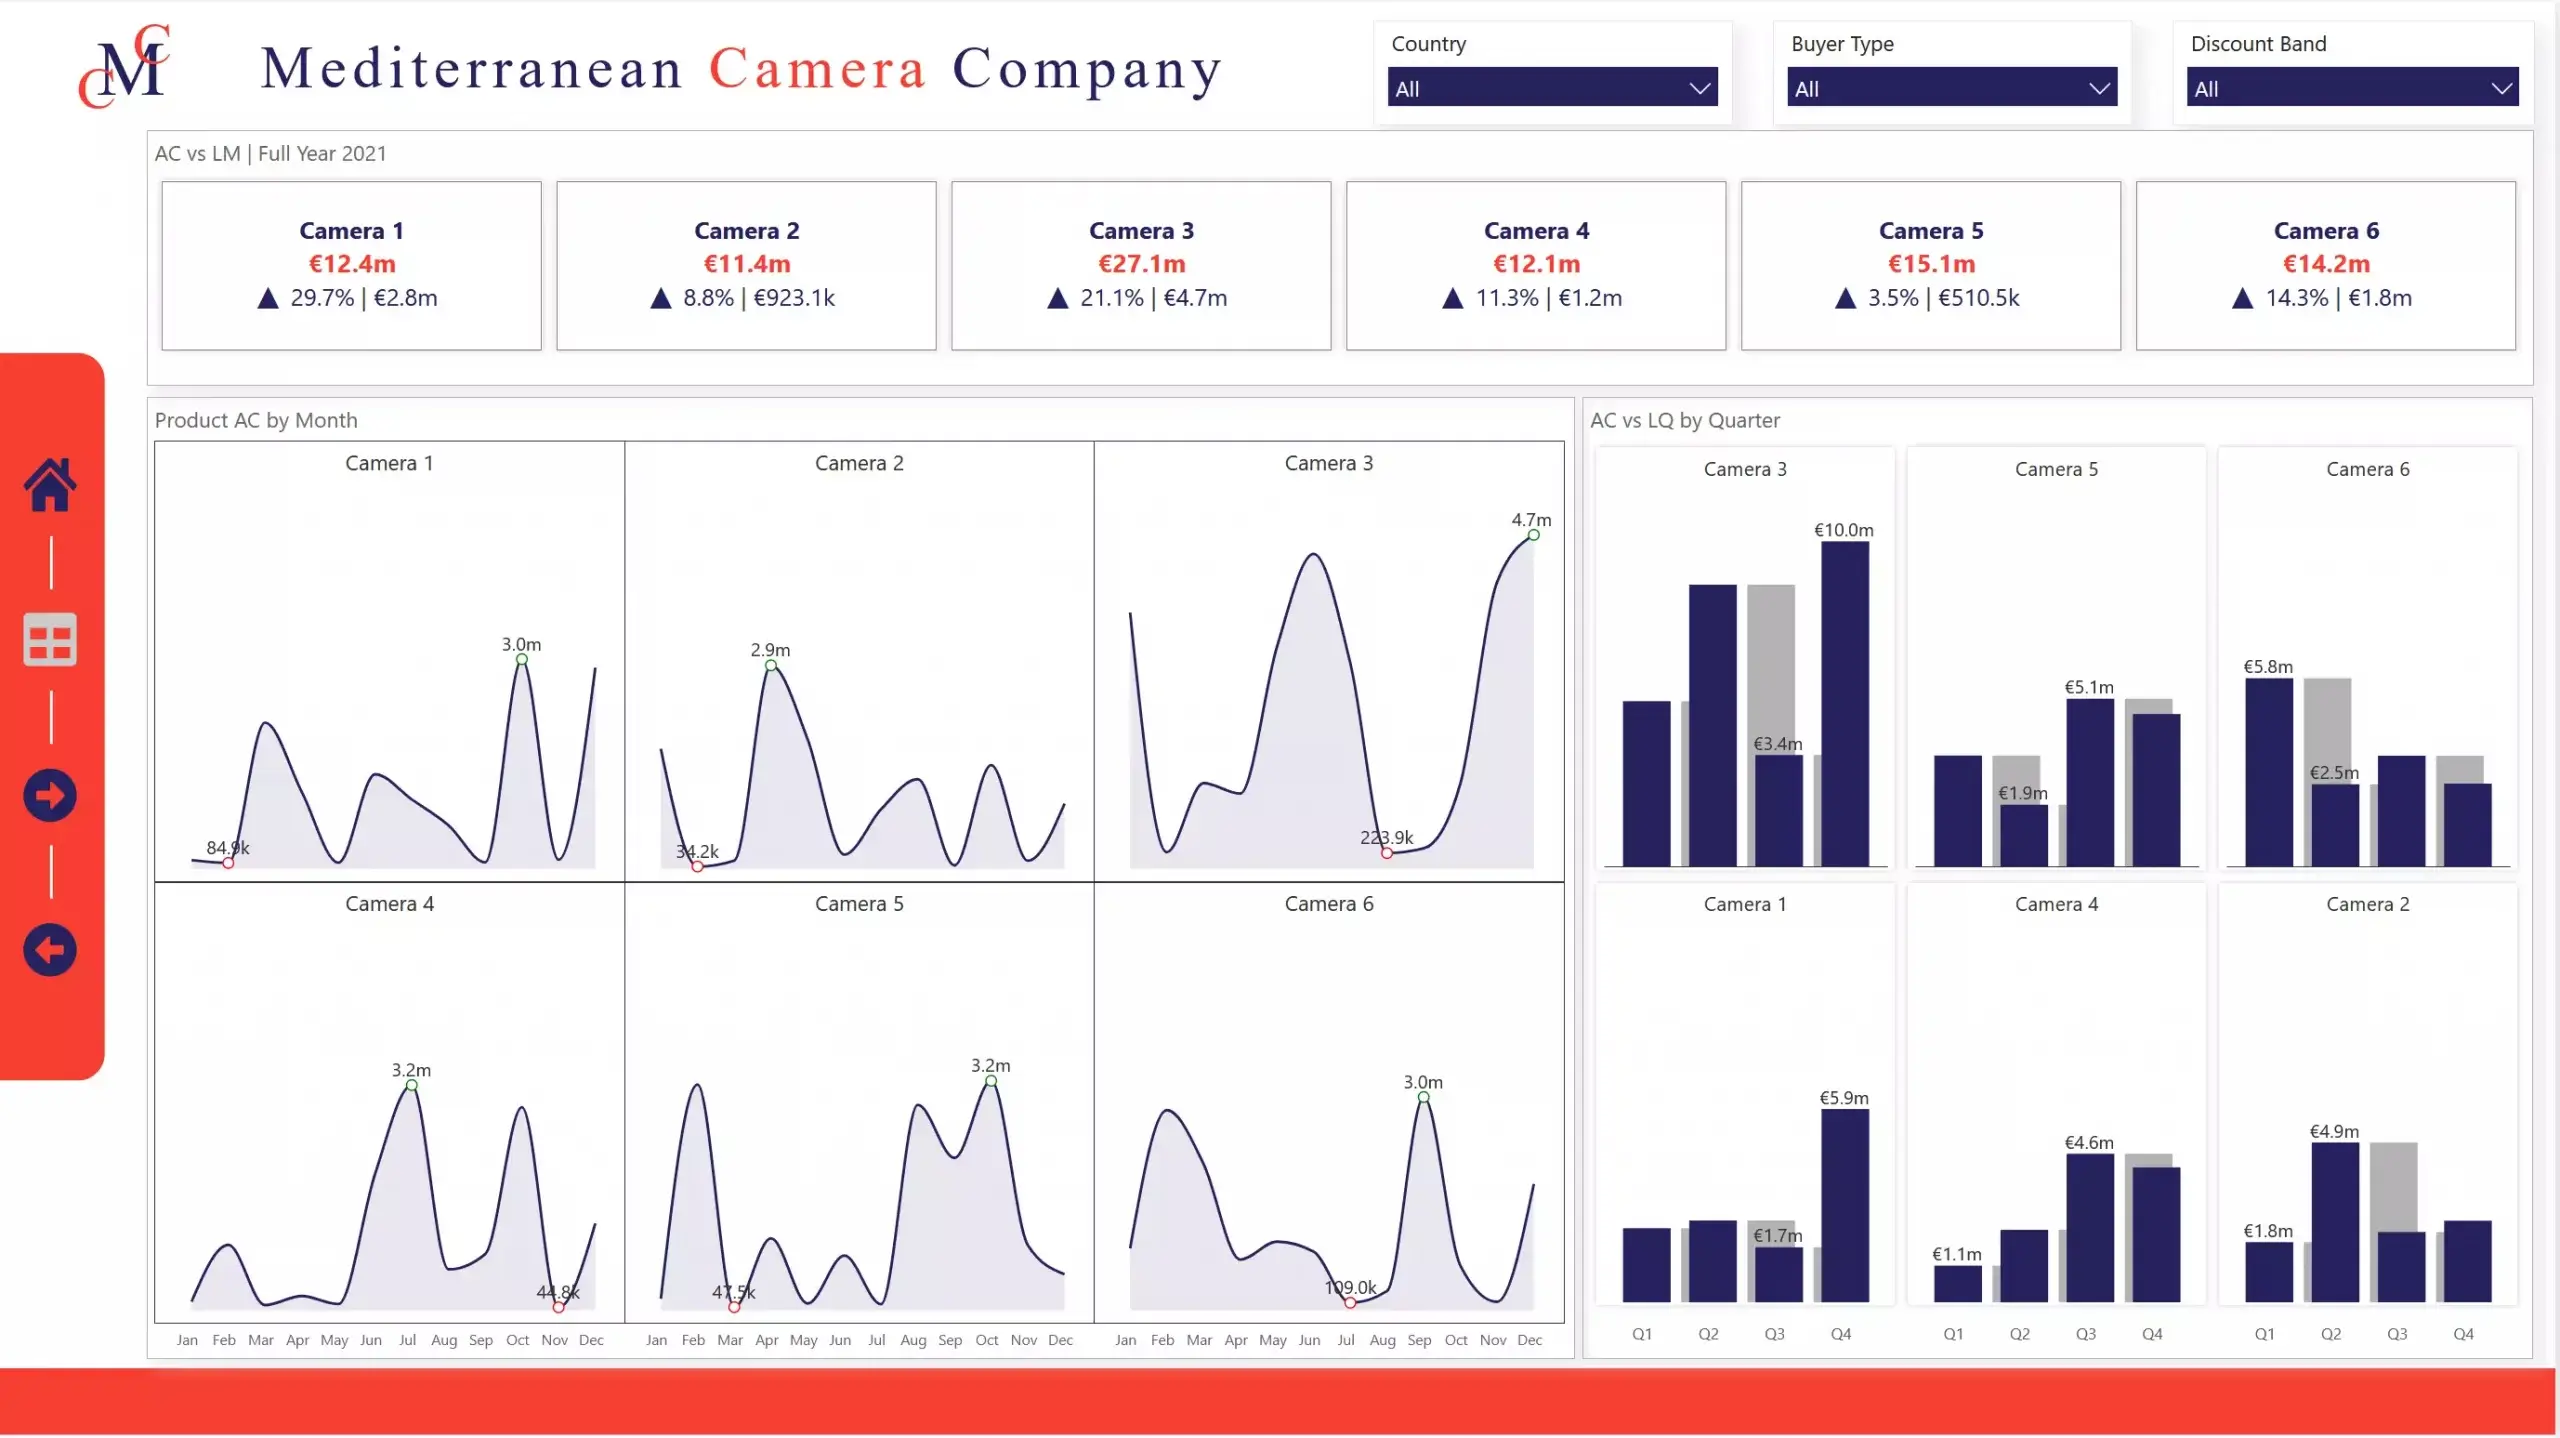
Compare product sales and quarterly performance with KPI Summary, Spline and Variance Column chart
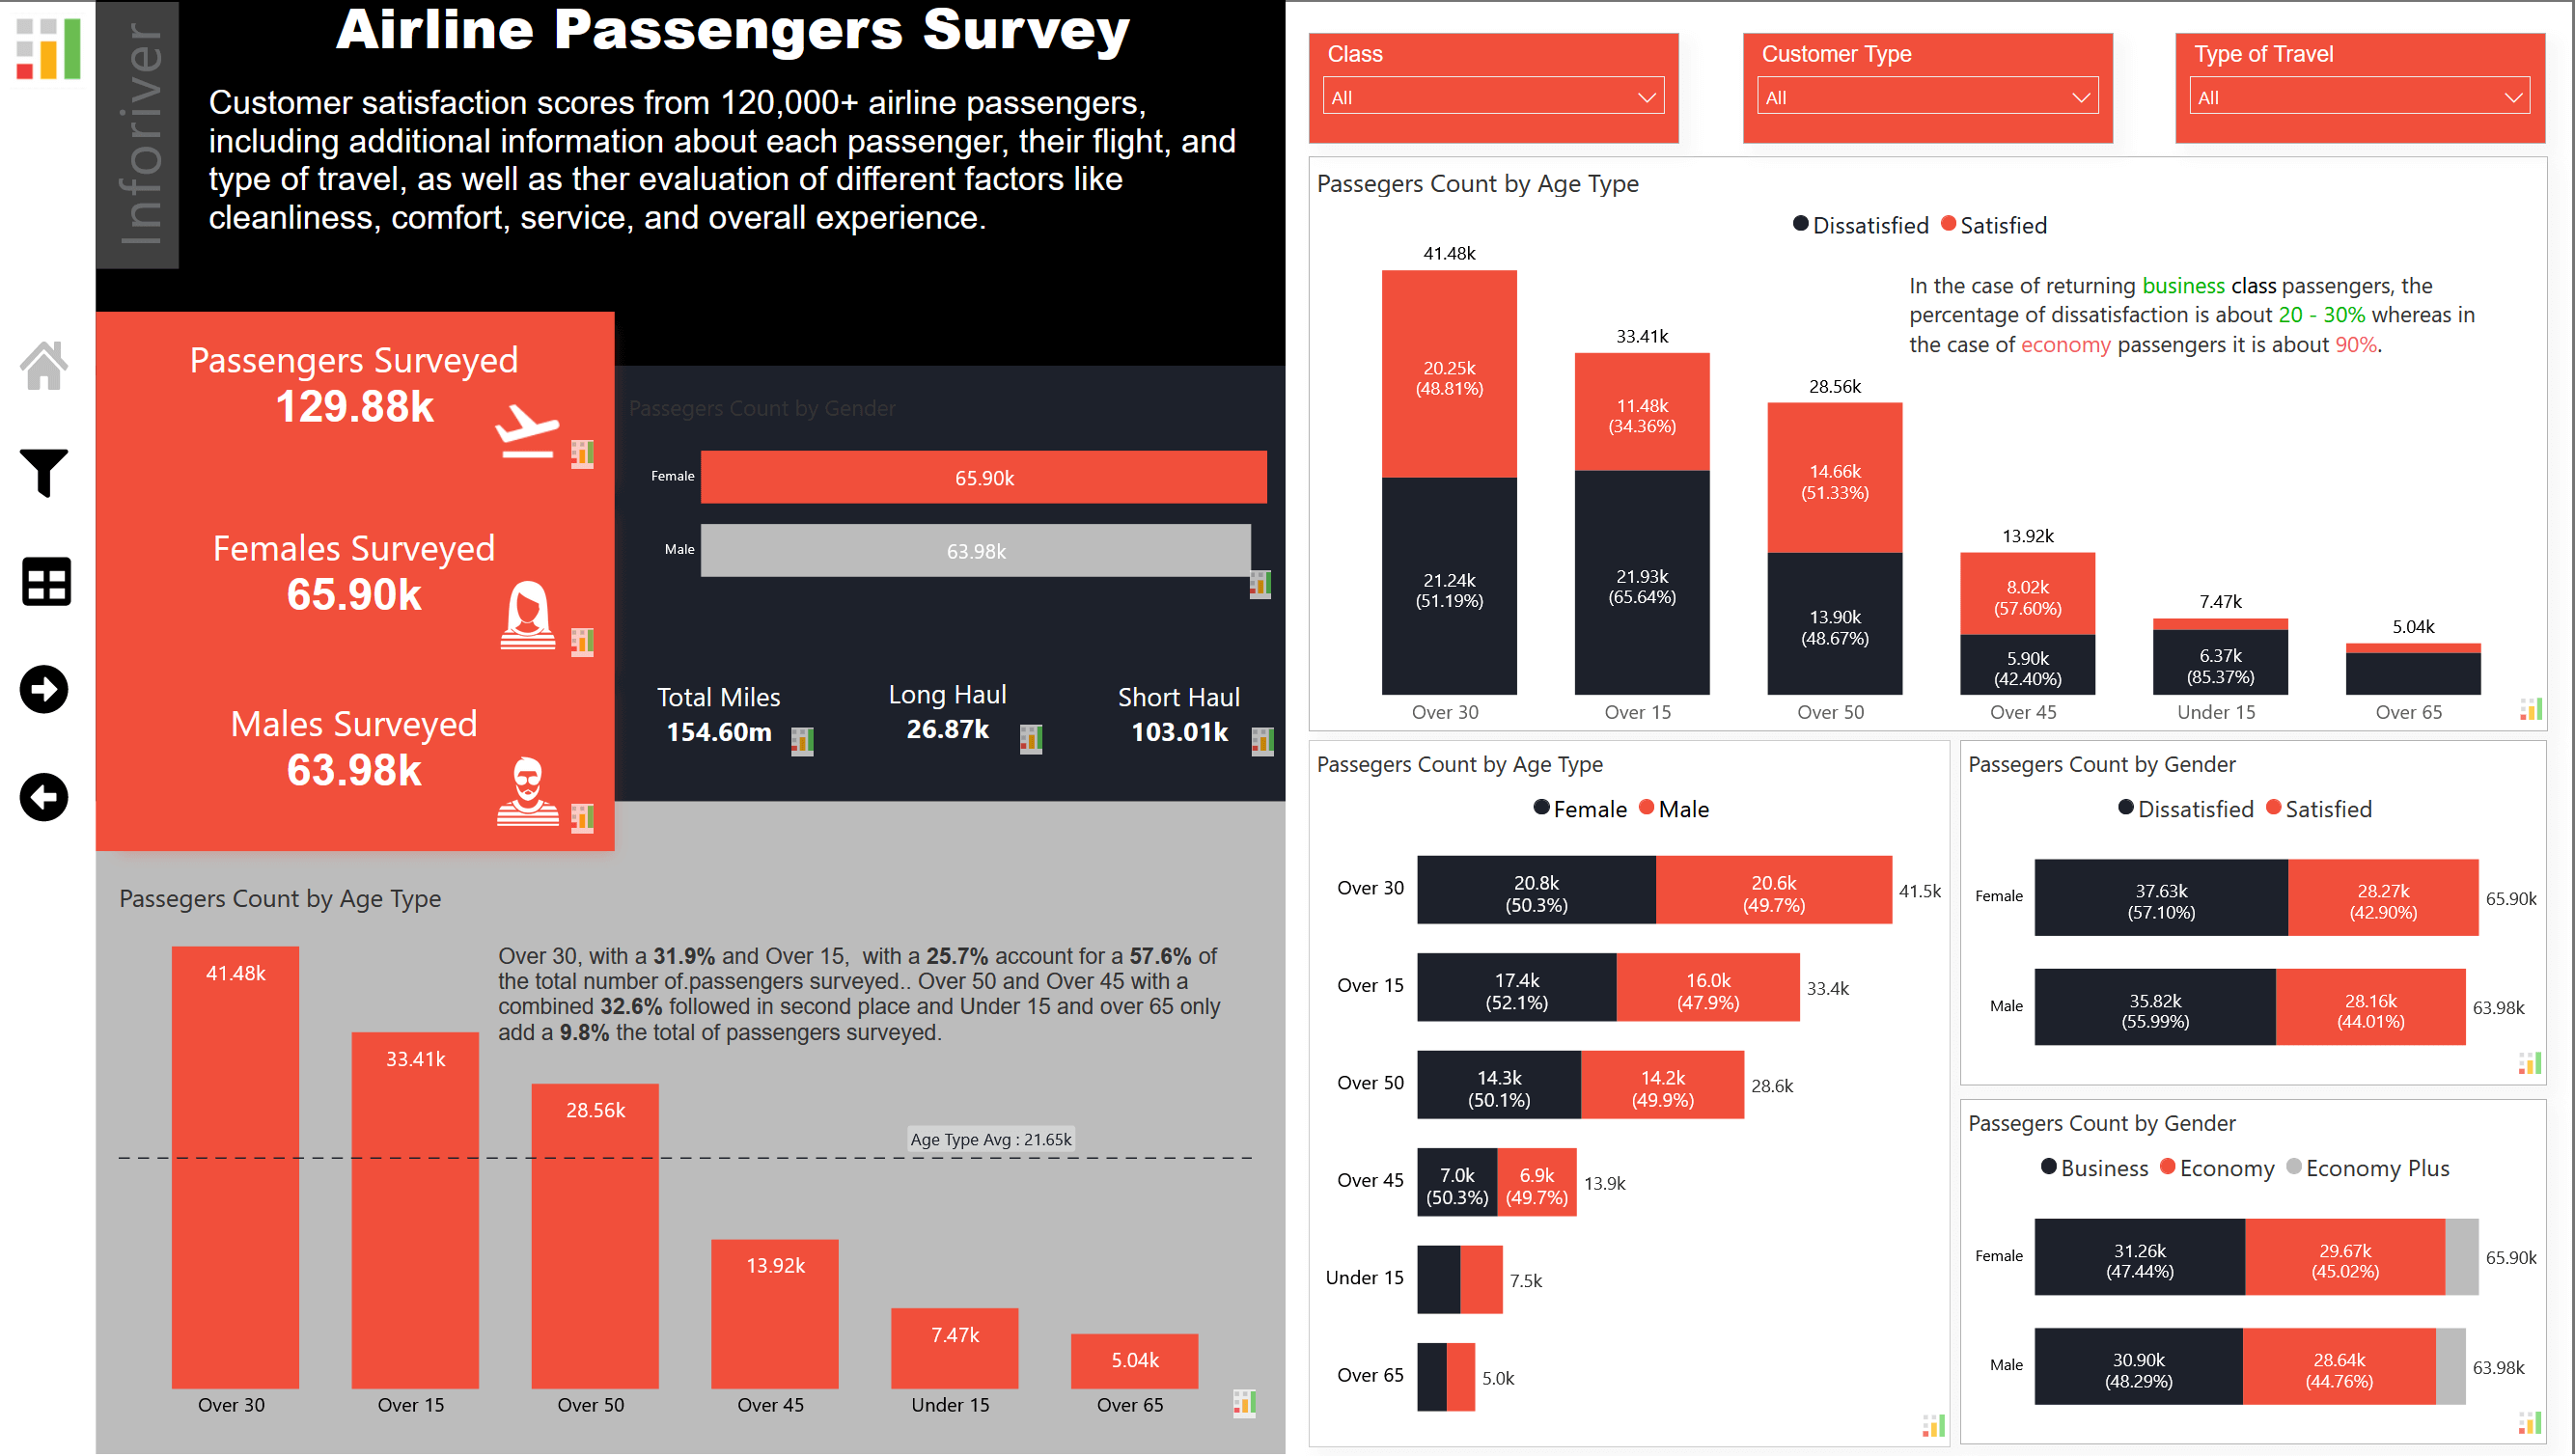
A survey report visualizing the passengers by age, flight class, gender and flight hours.
Passenger rating across airline services is analyzed using a heatmap.

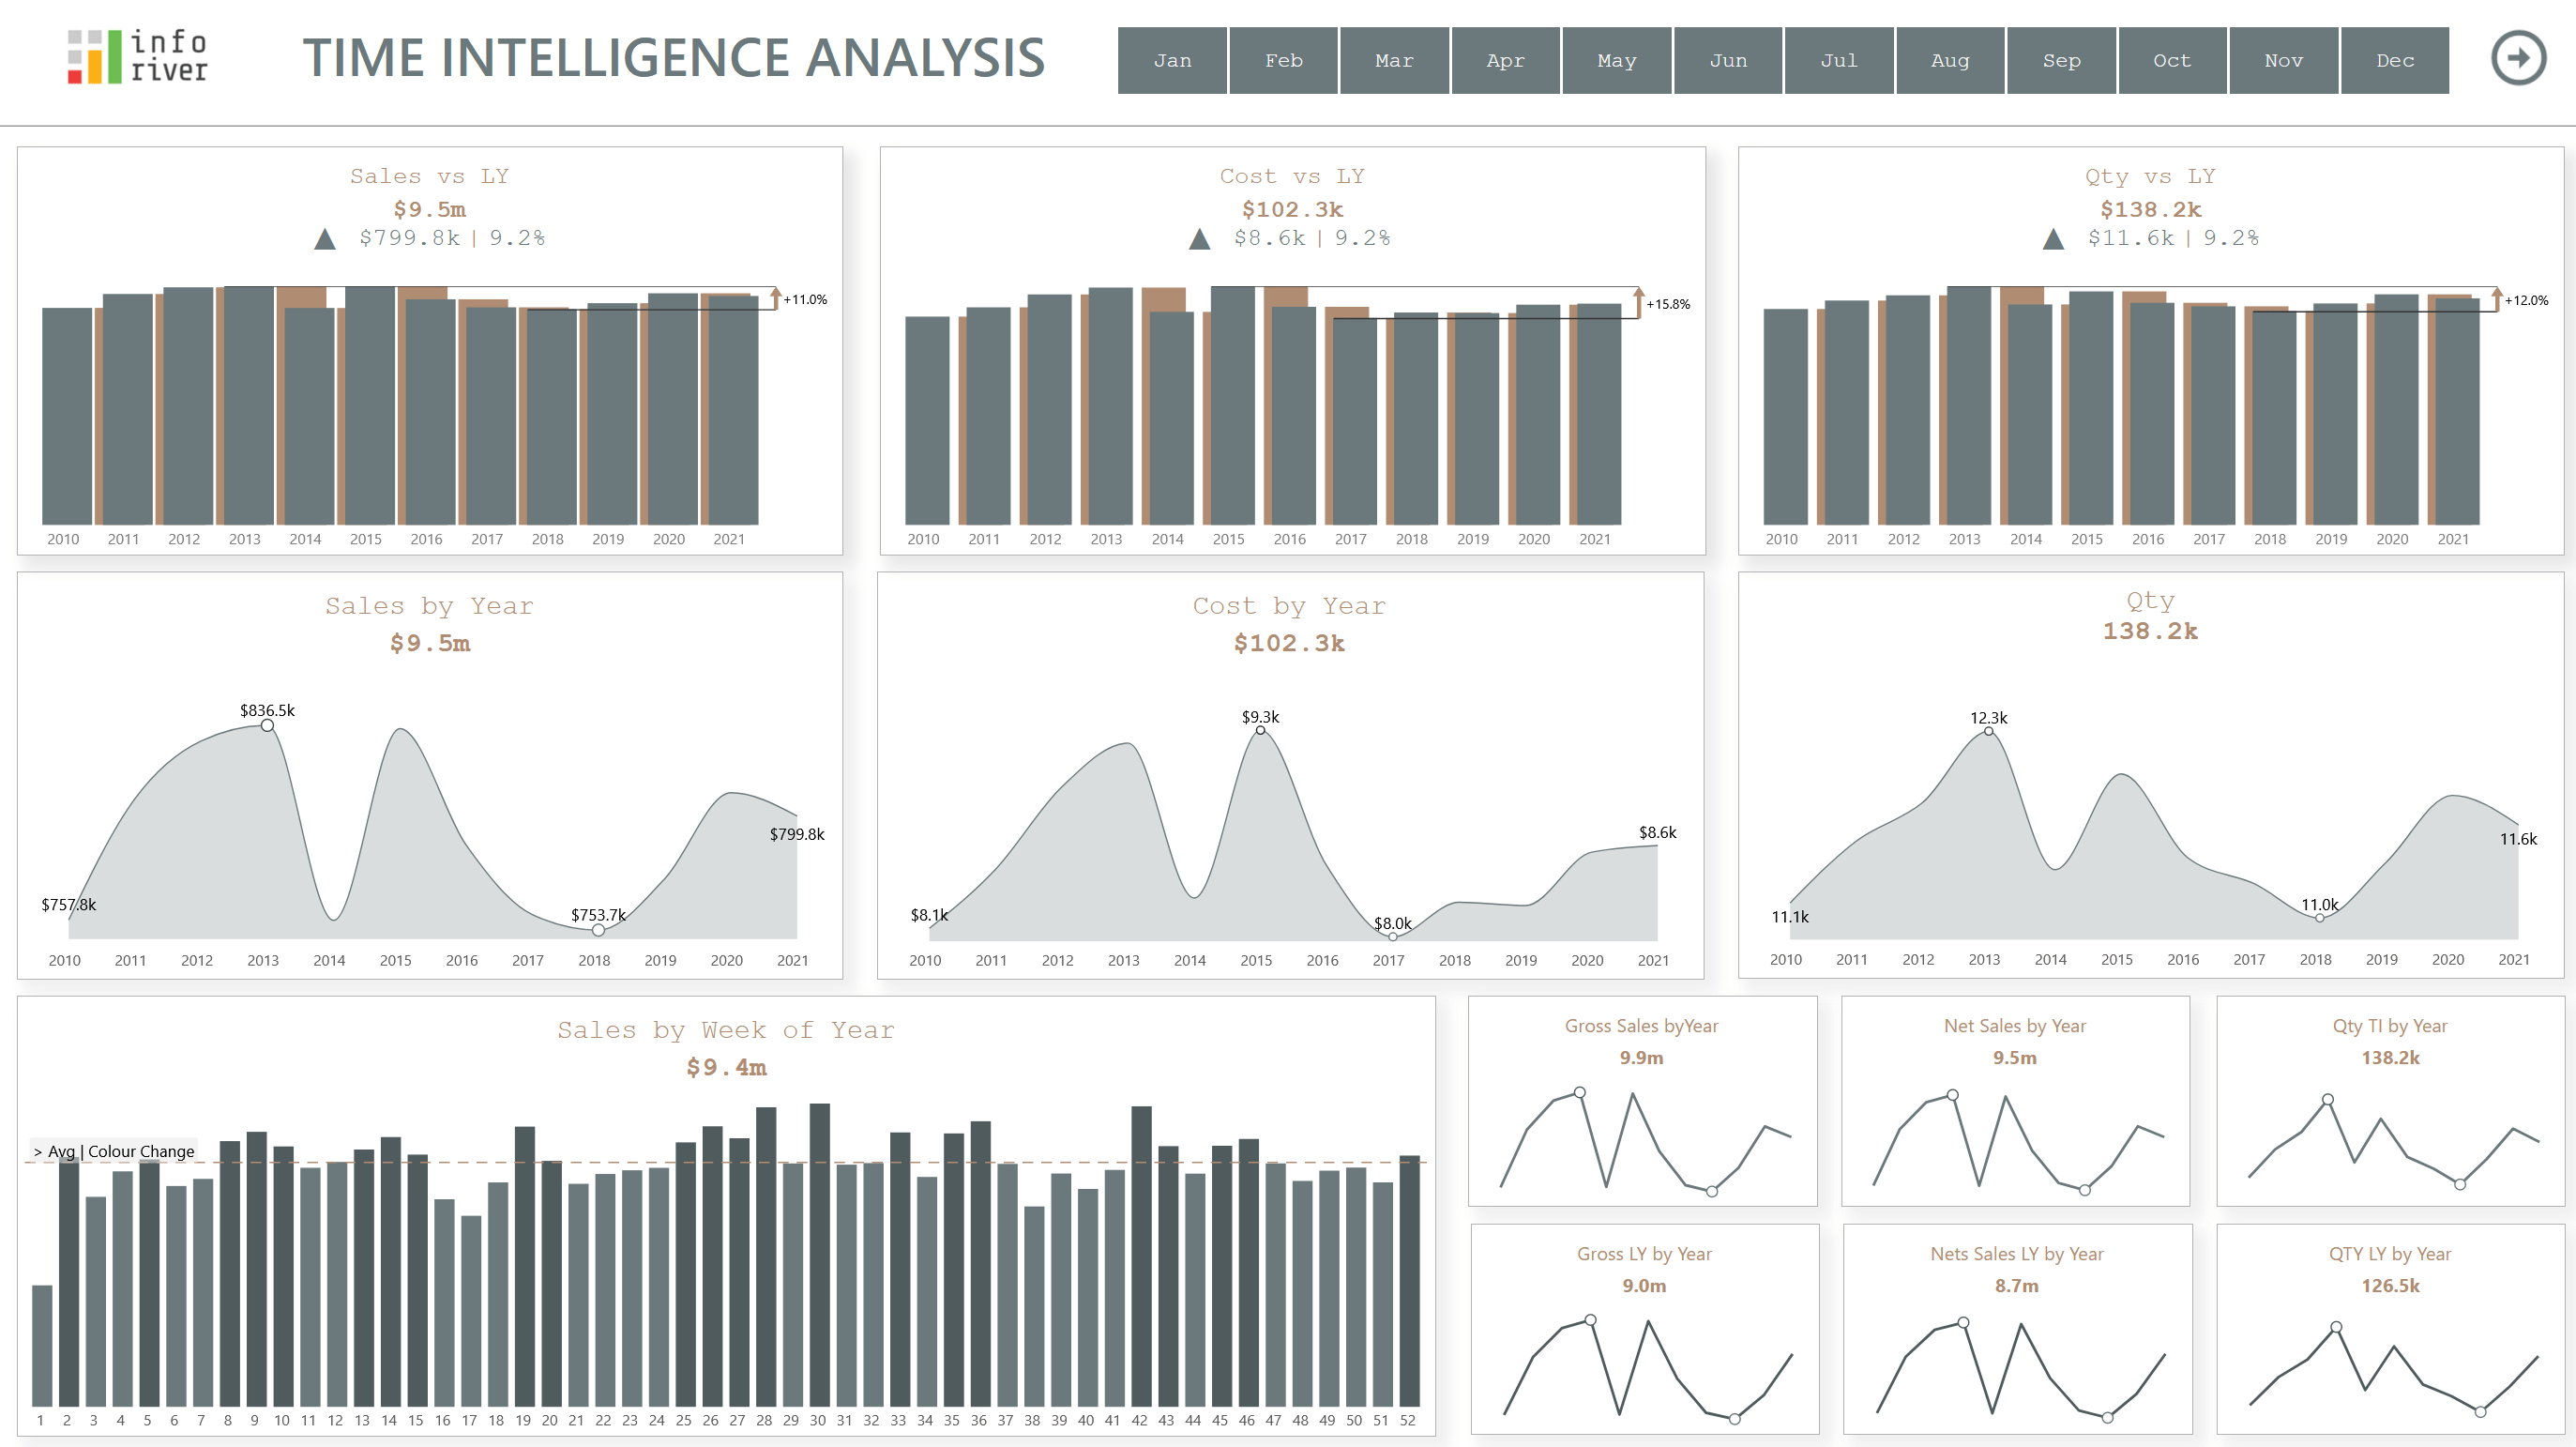
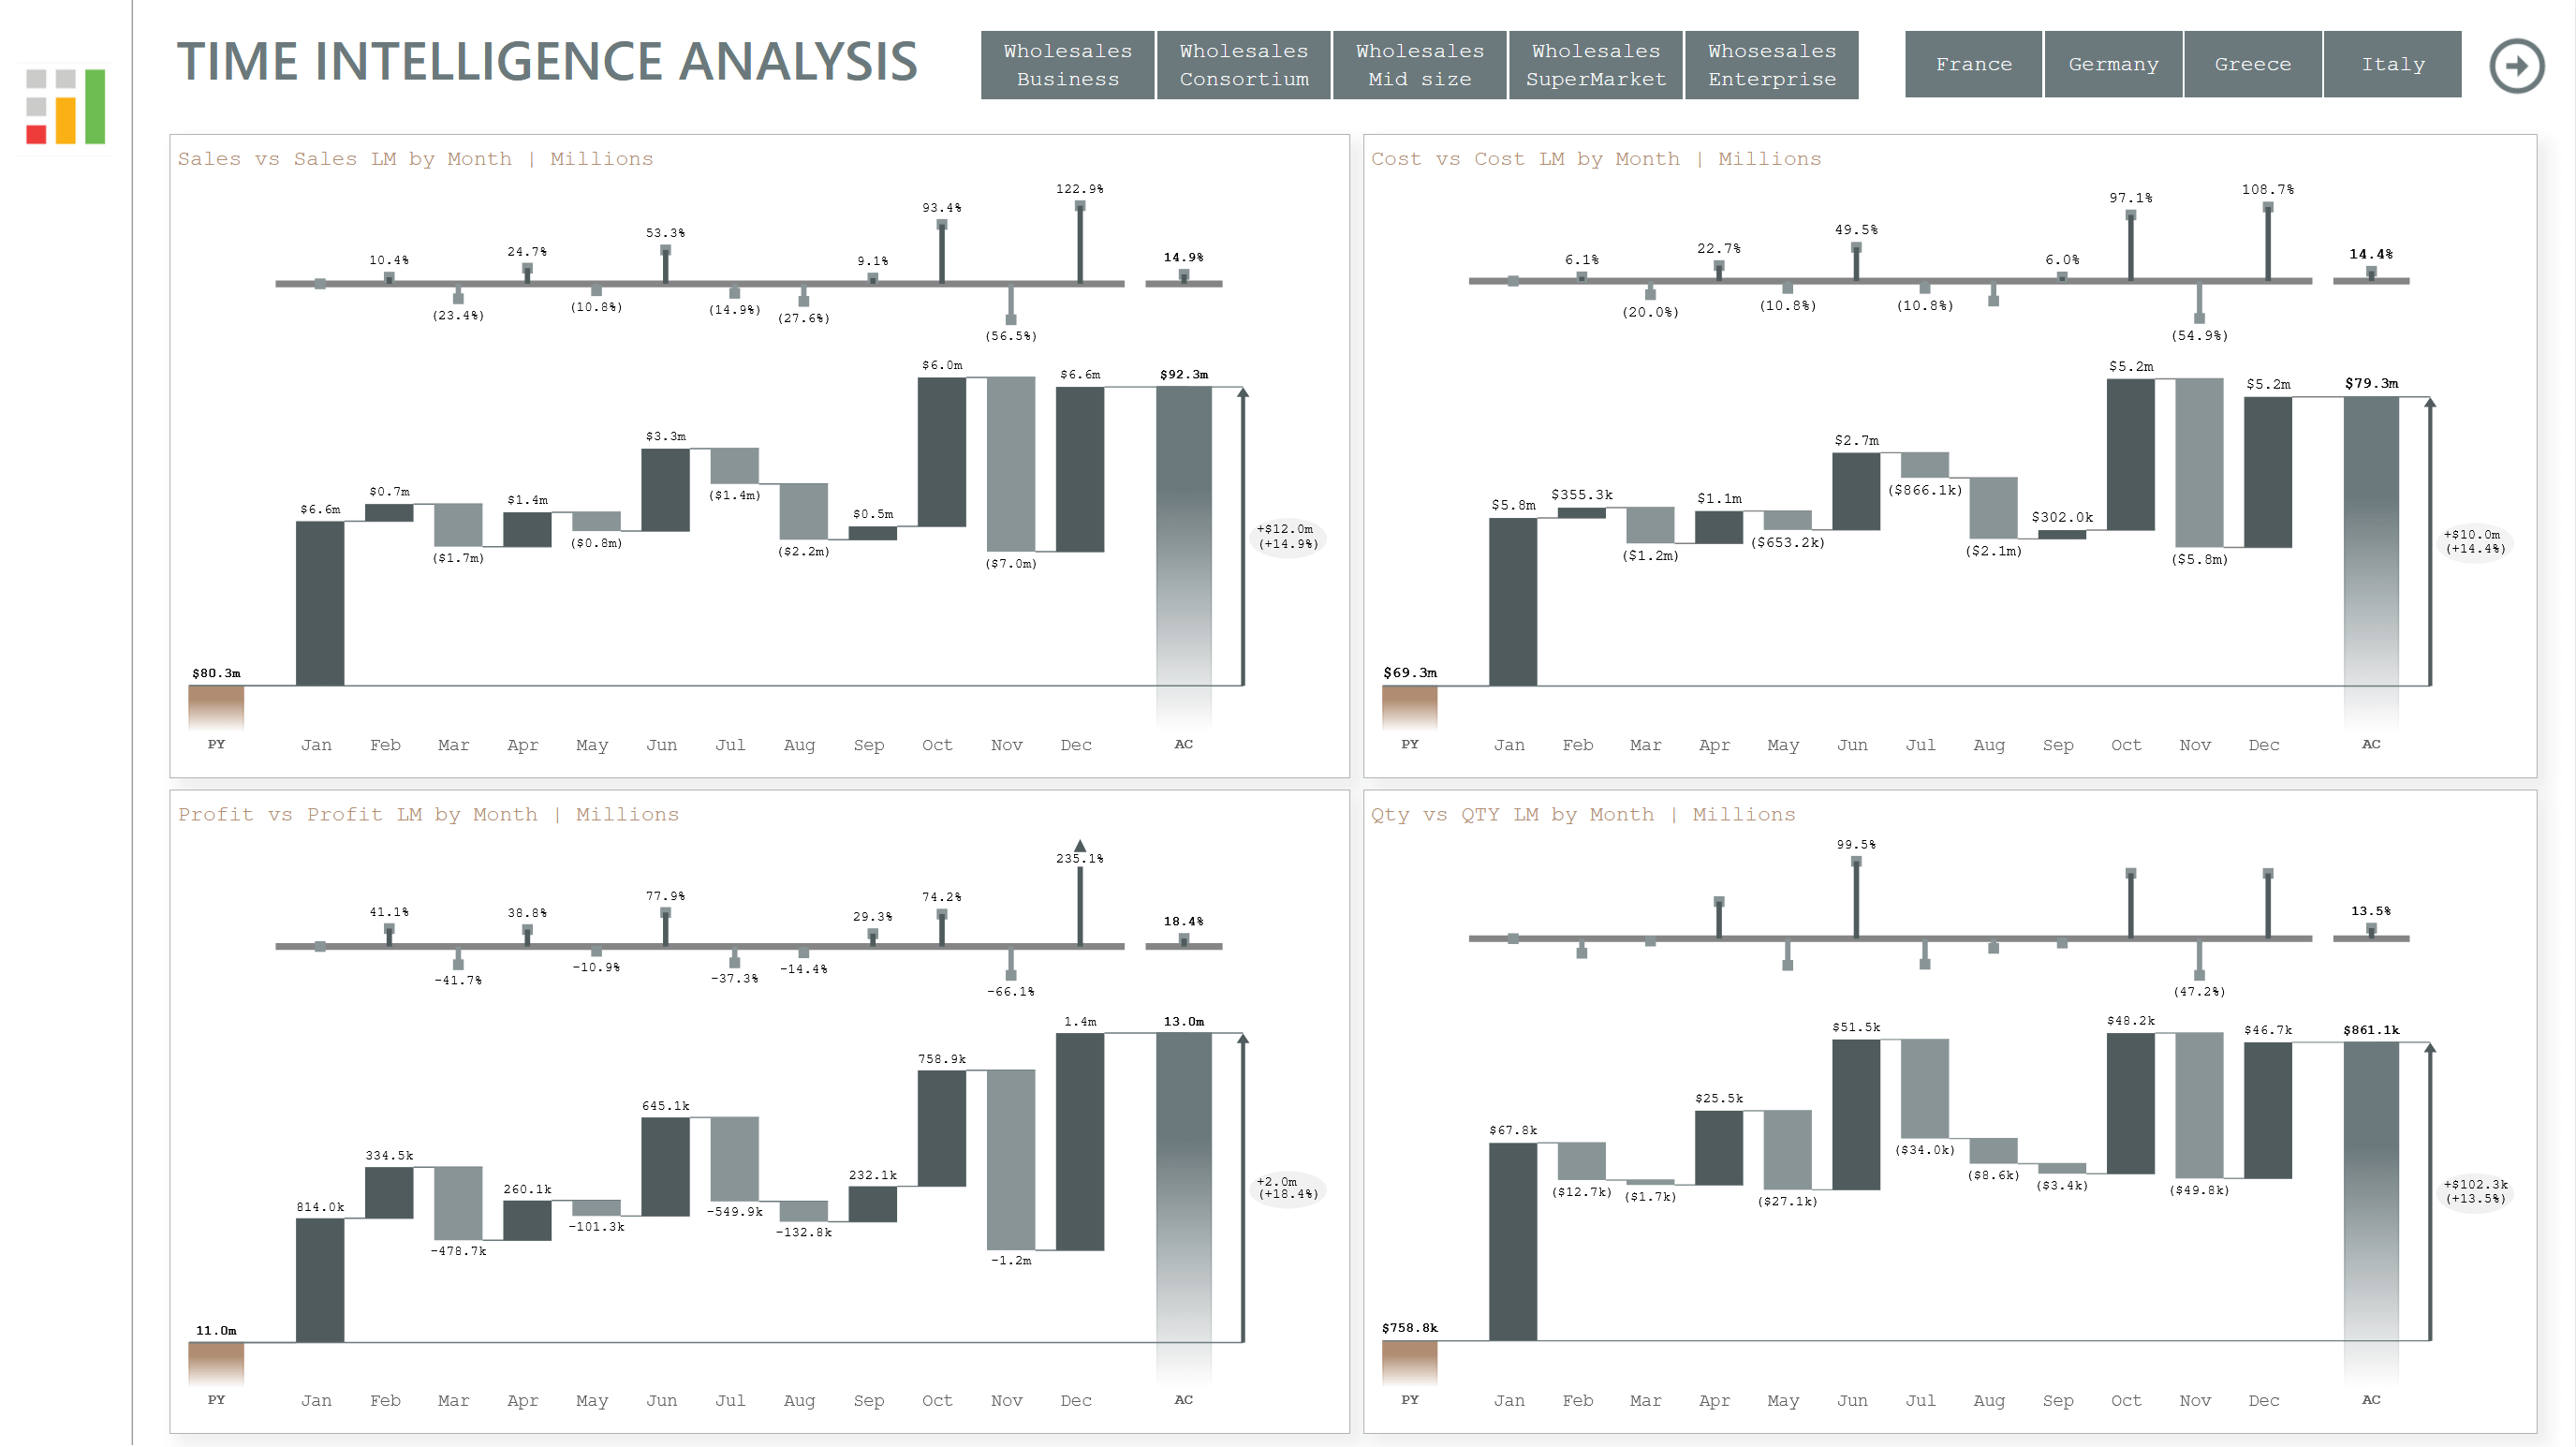
Time Intelligence analysis of sales, cost, and quantity across months, regions, products, and business divisions.
Analyse performance of sales, cost, profit and quanitity with Waterfall and Variance chart.
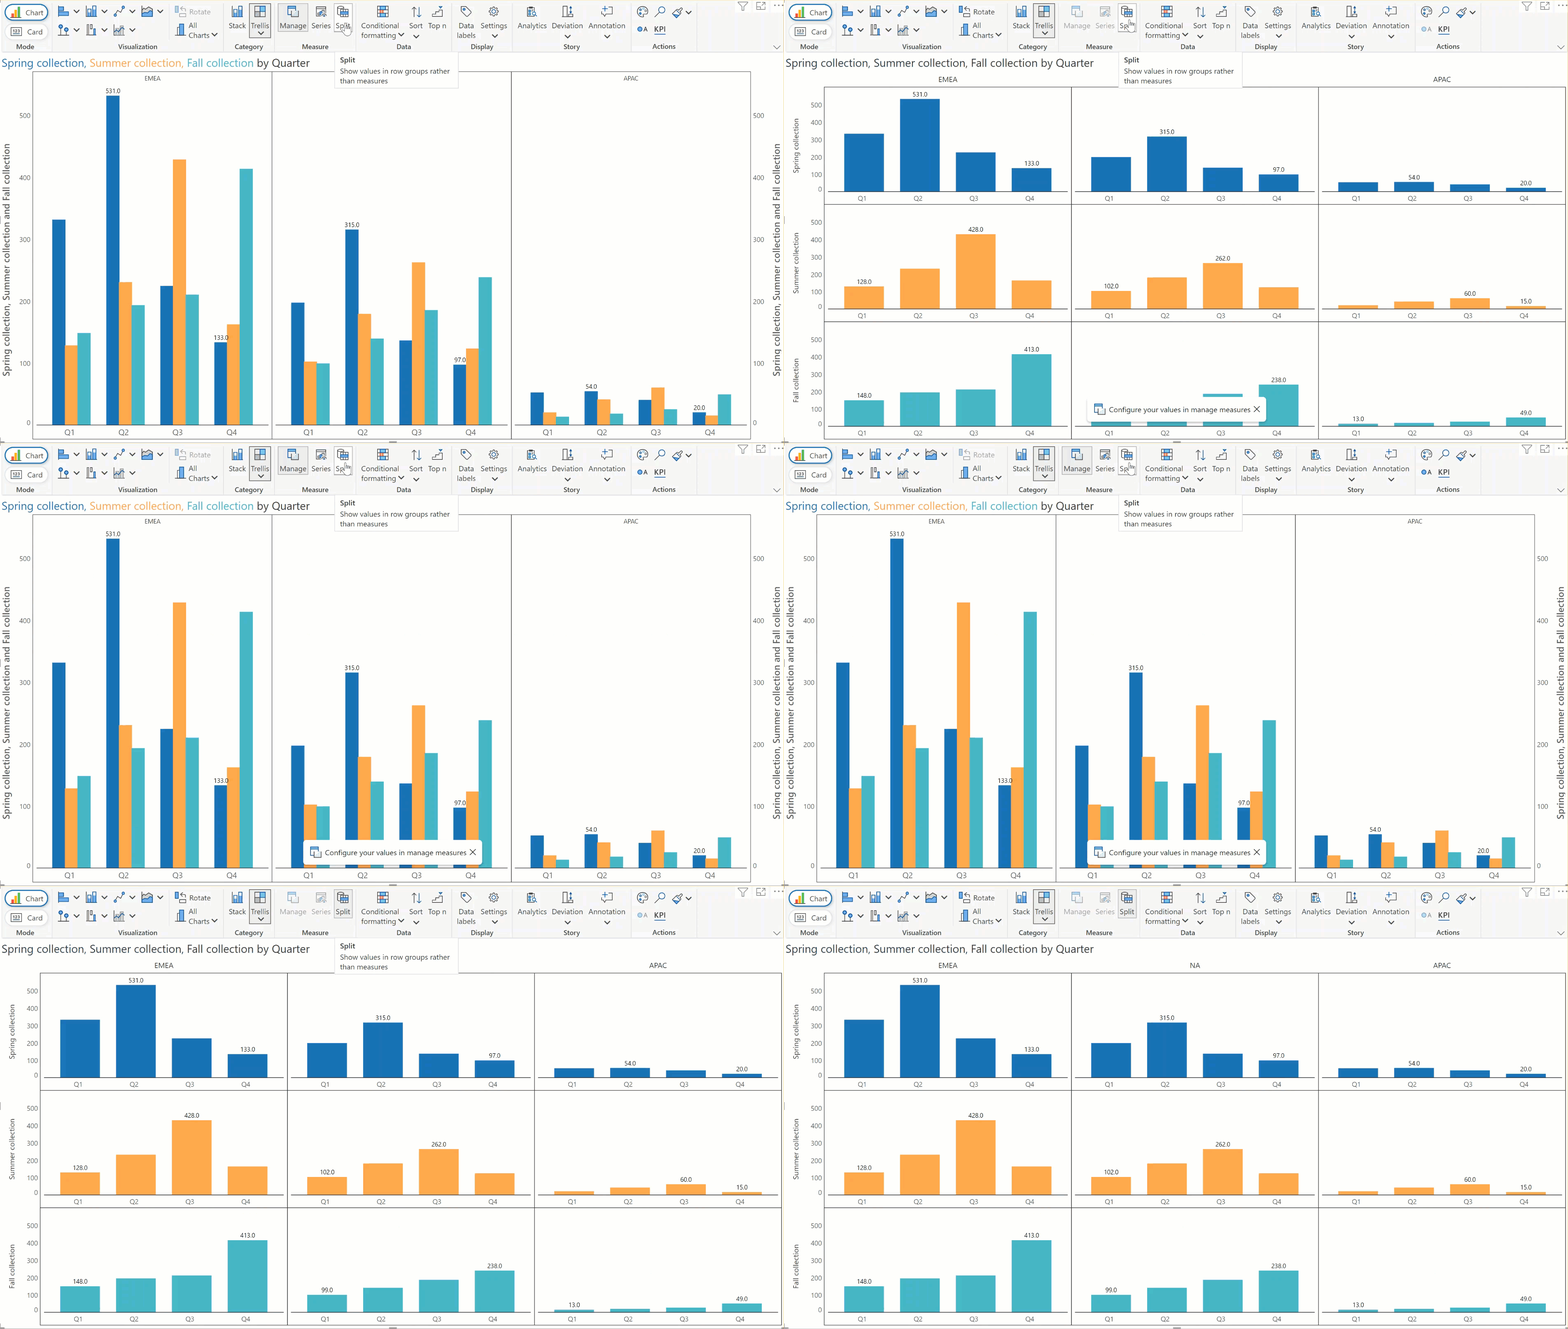
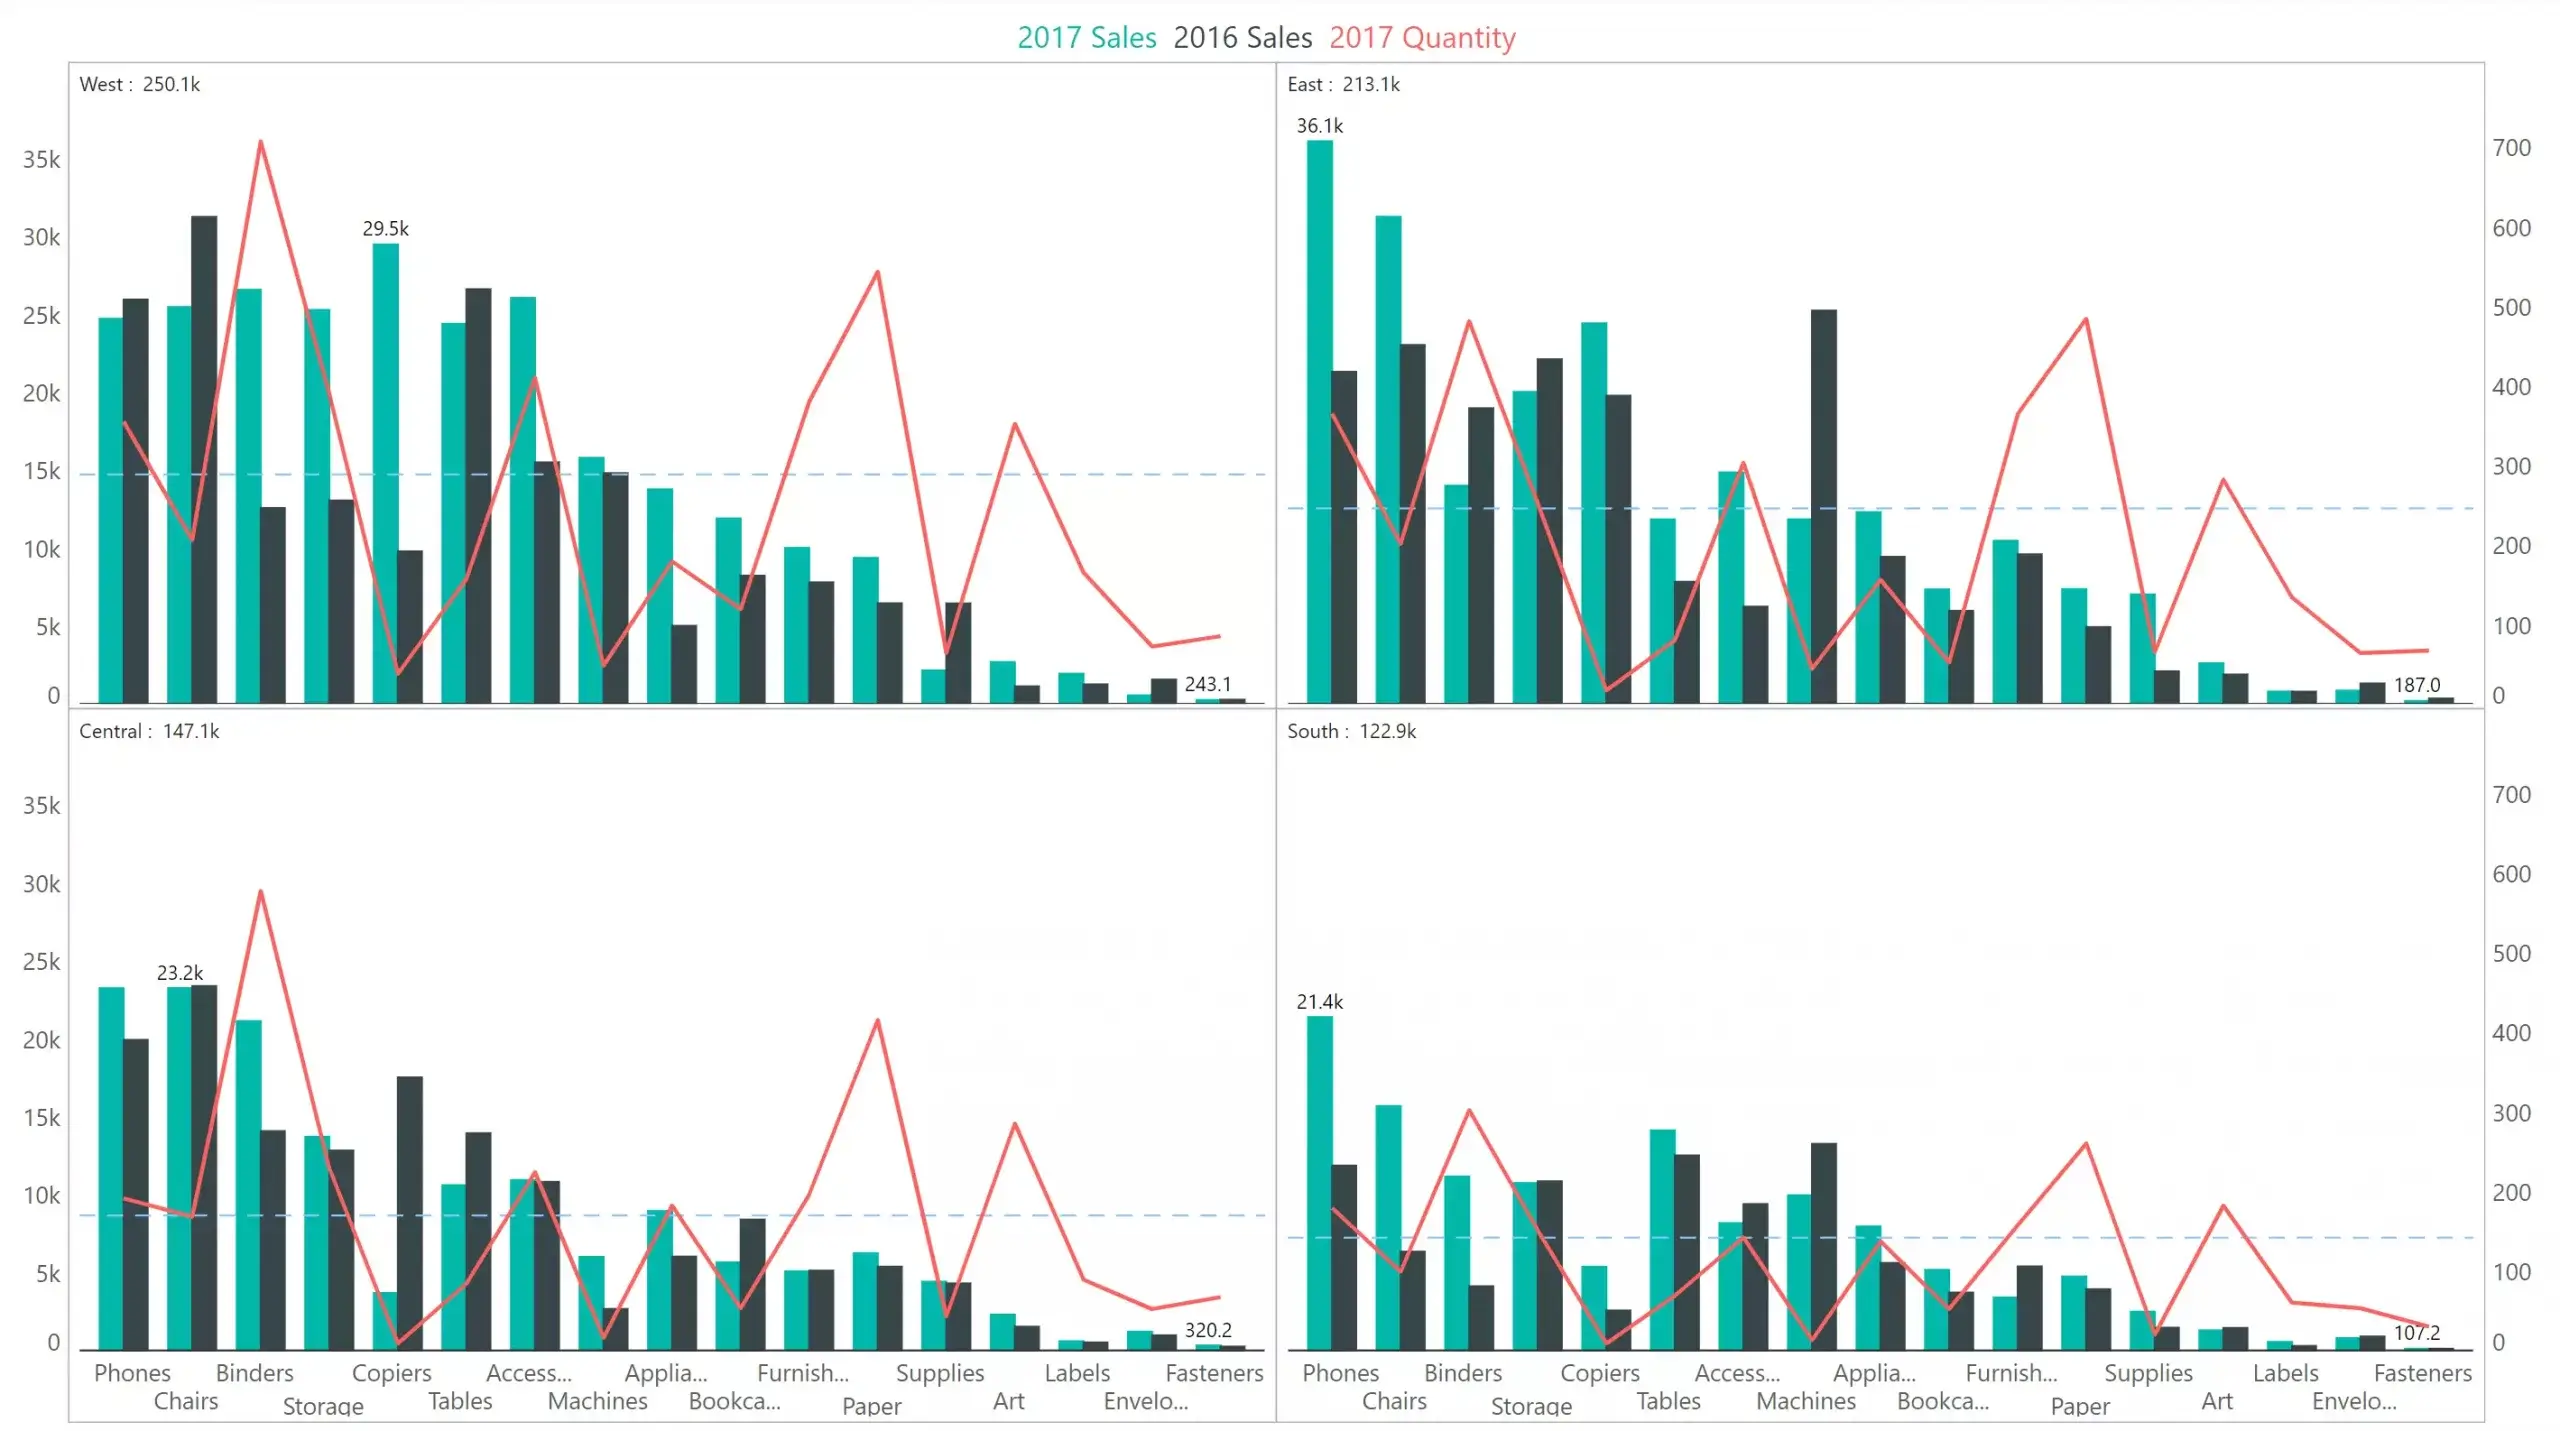
Plot each measure in a separate chart (Measure-based small multiple)
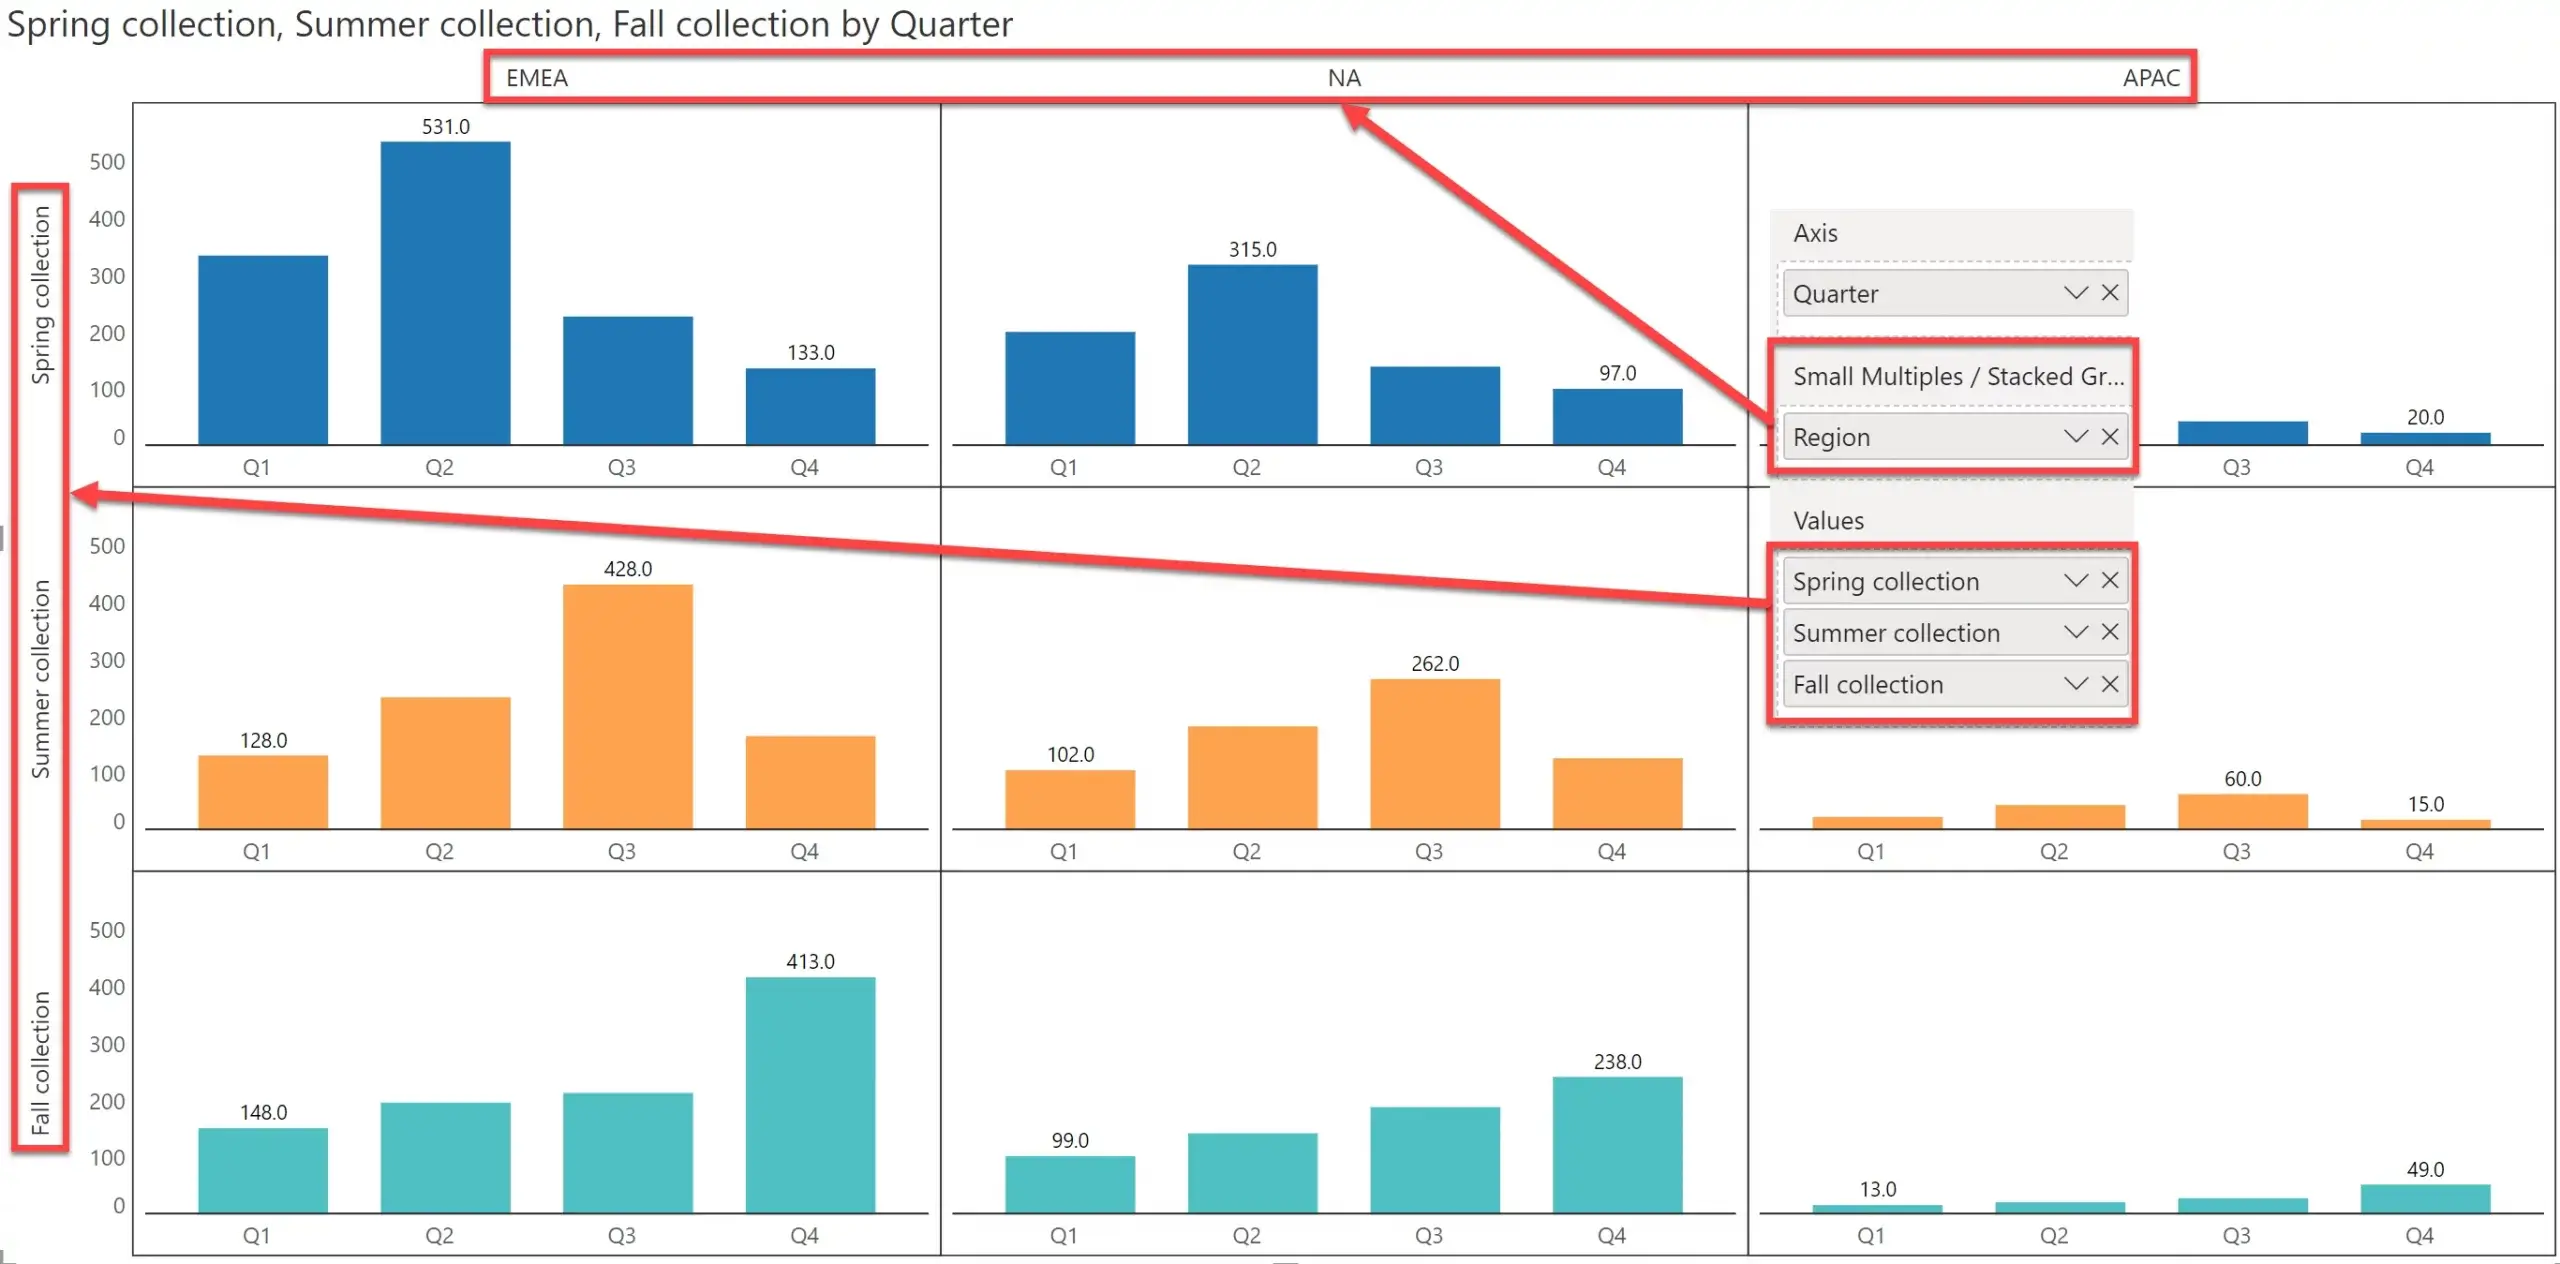
Create two-dimensional small multiples with Measures in rows
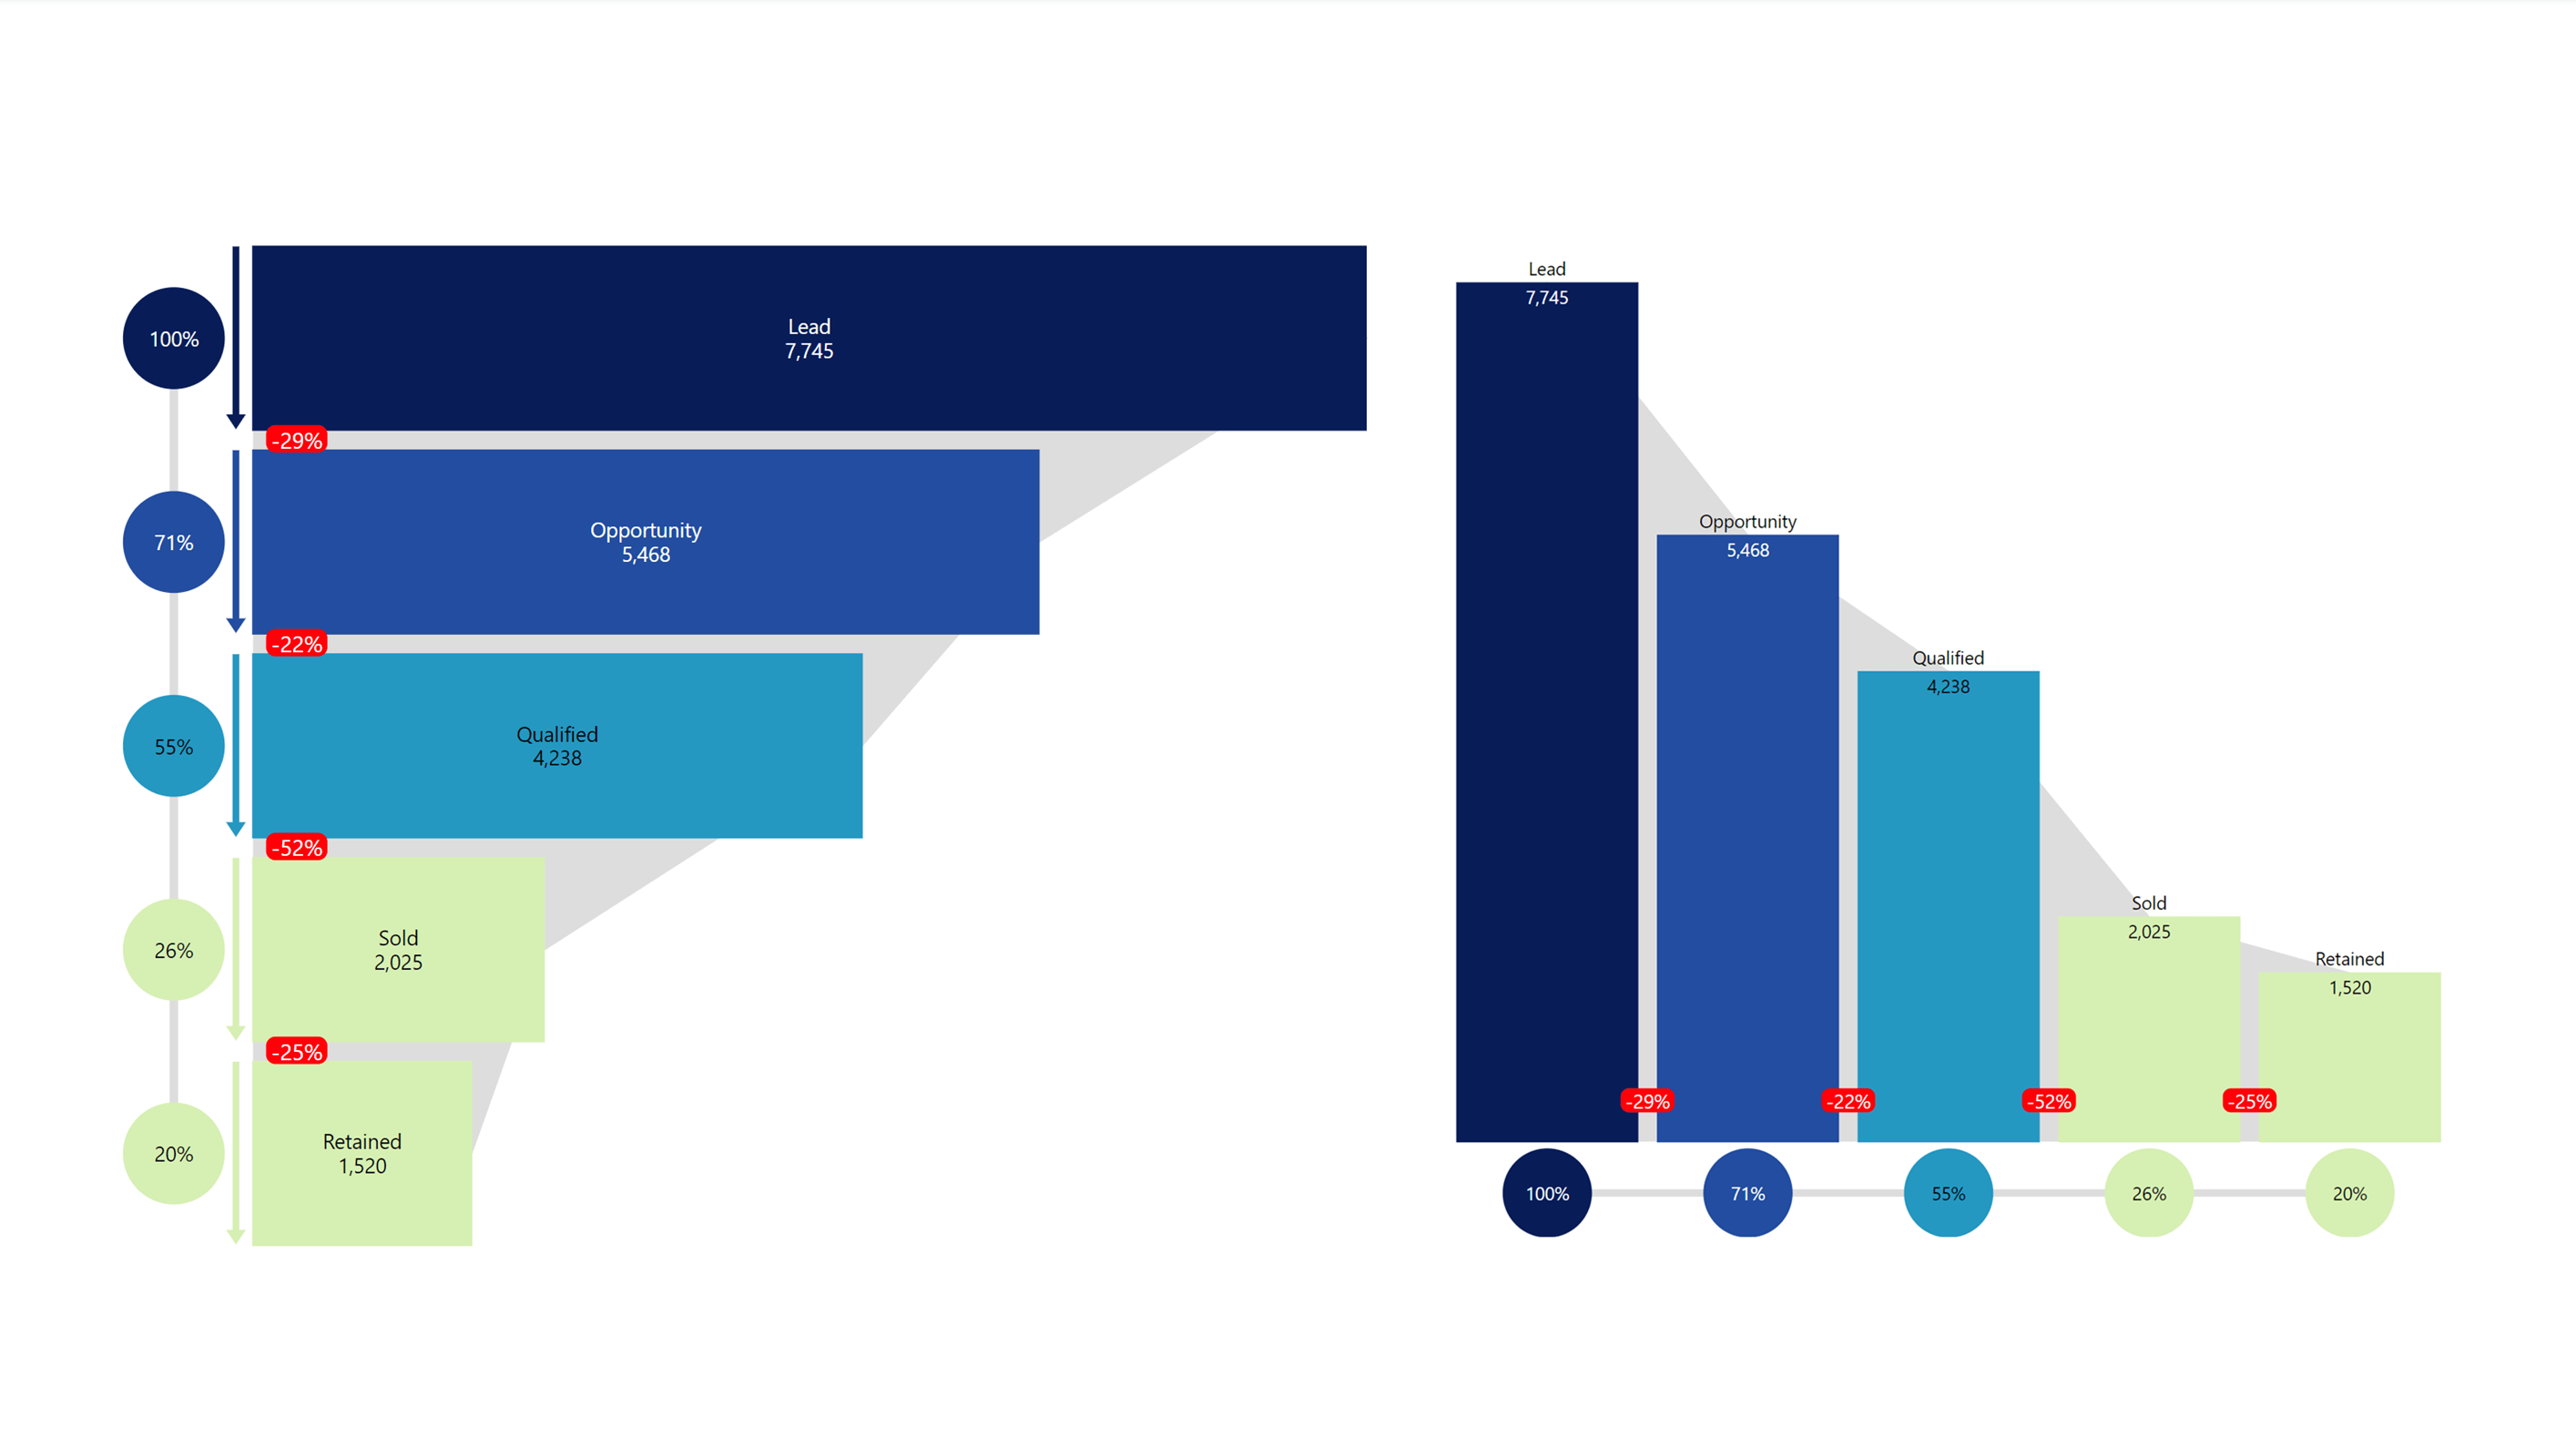
Leverage exclusive visualizations such as the executive funnel chart to track your Sales and Marketing Conversion
Visualize relationships between KPIs of different scales or units of measures (UoM) on a single chart using dual-axis charts
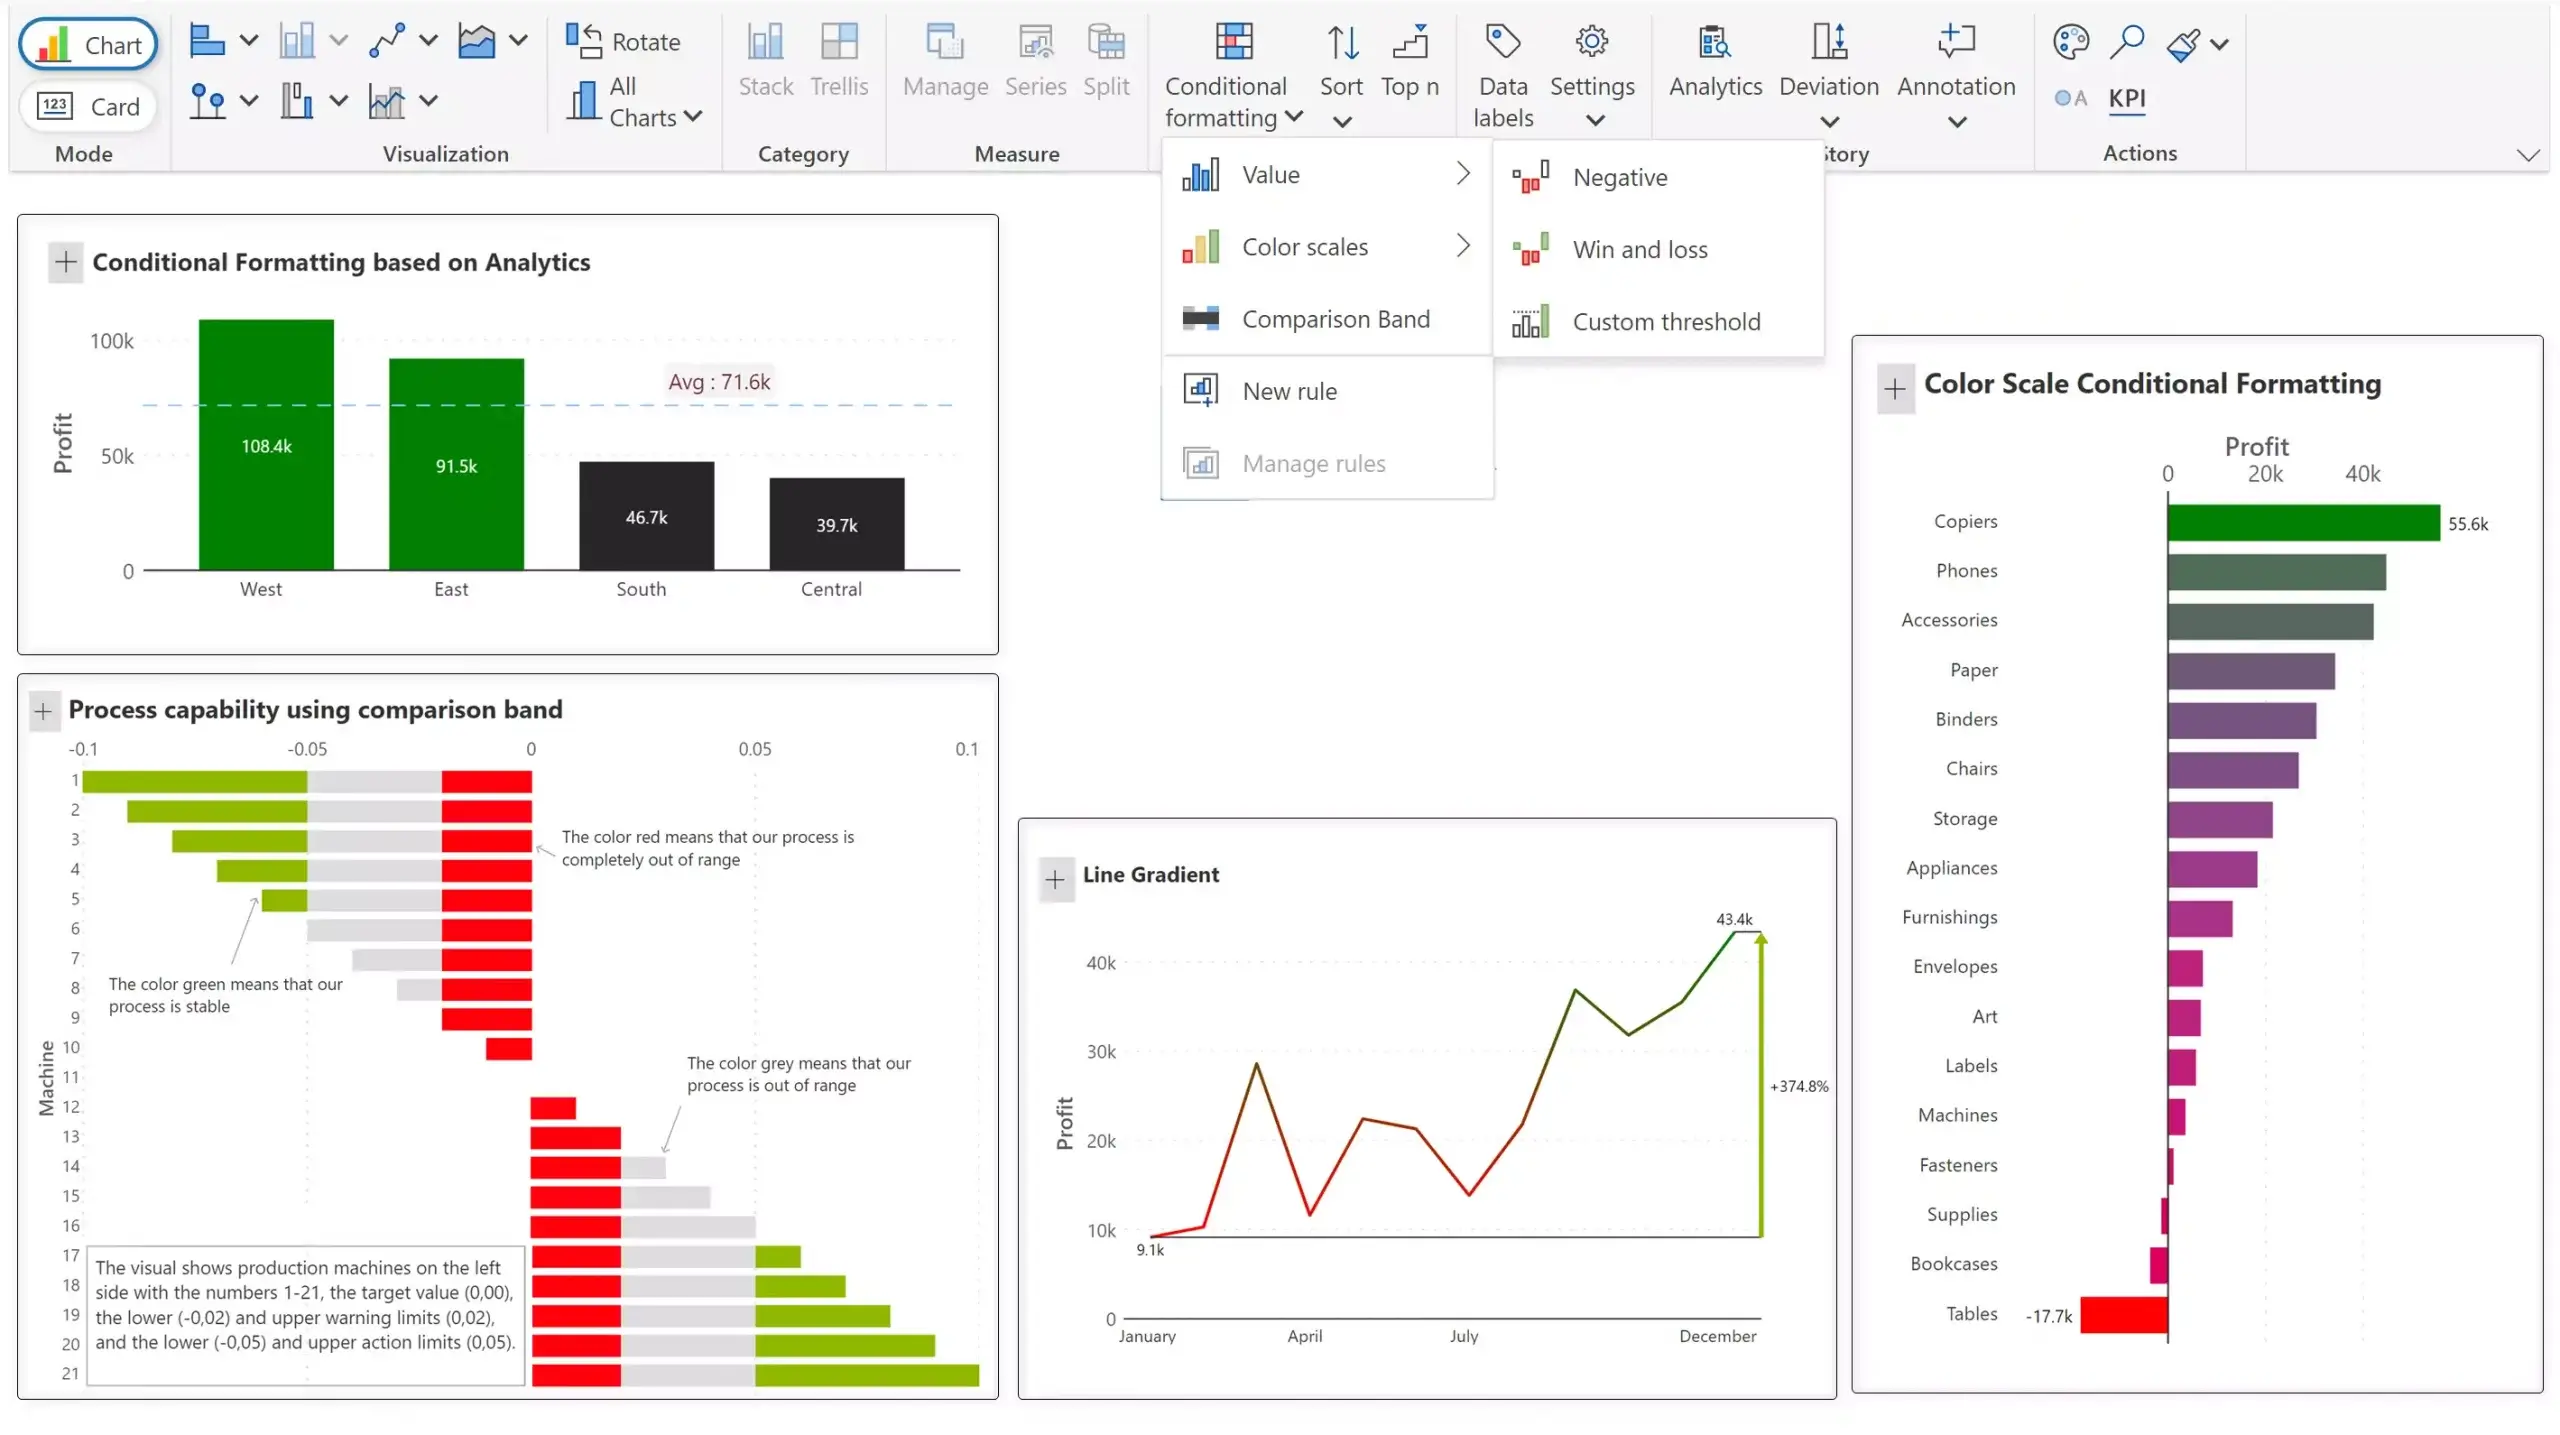
Apply pre-set or custom Conditional Formatting rules; ranges can be configured and set as alerting thresholds using Comparison Band
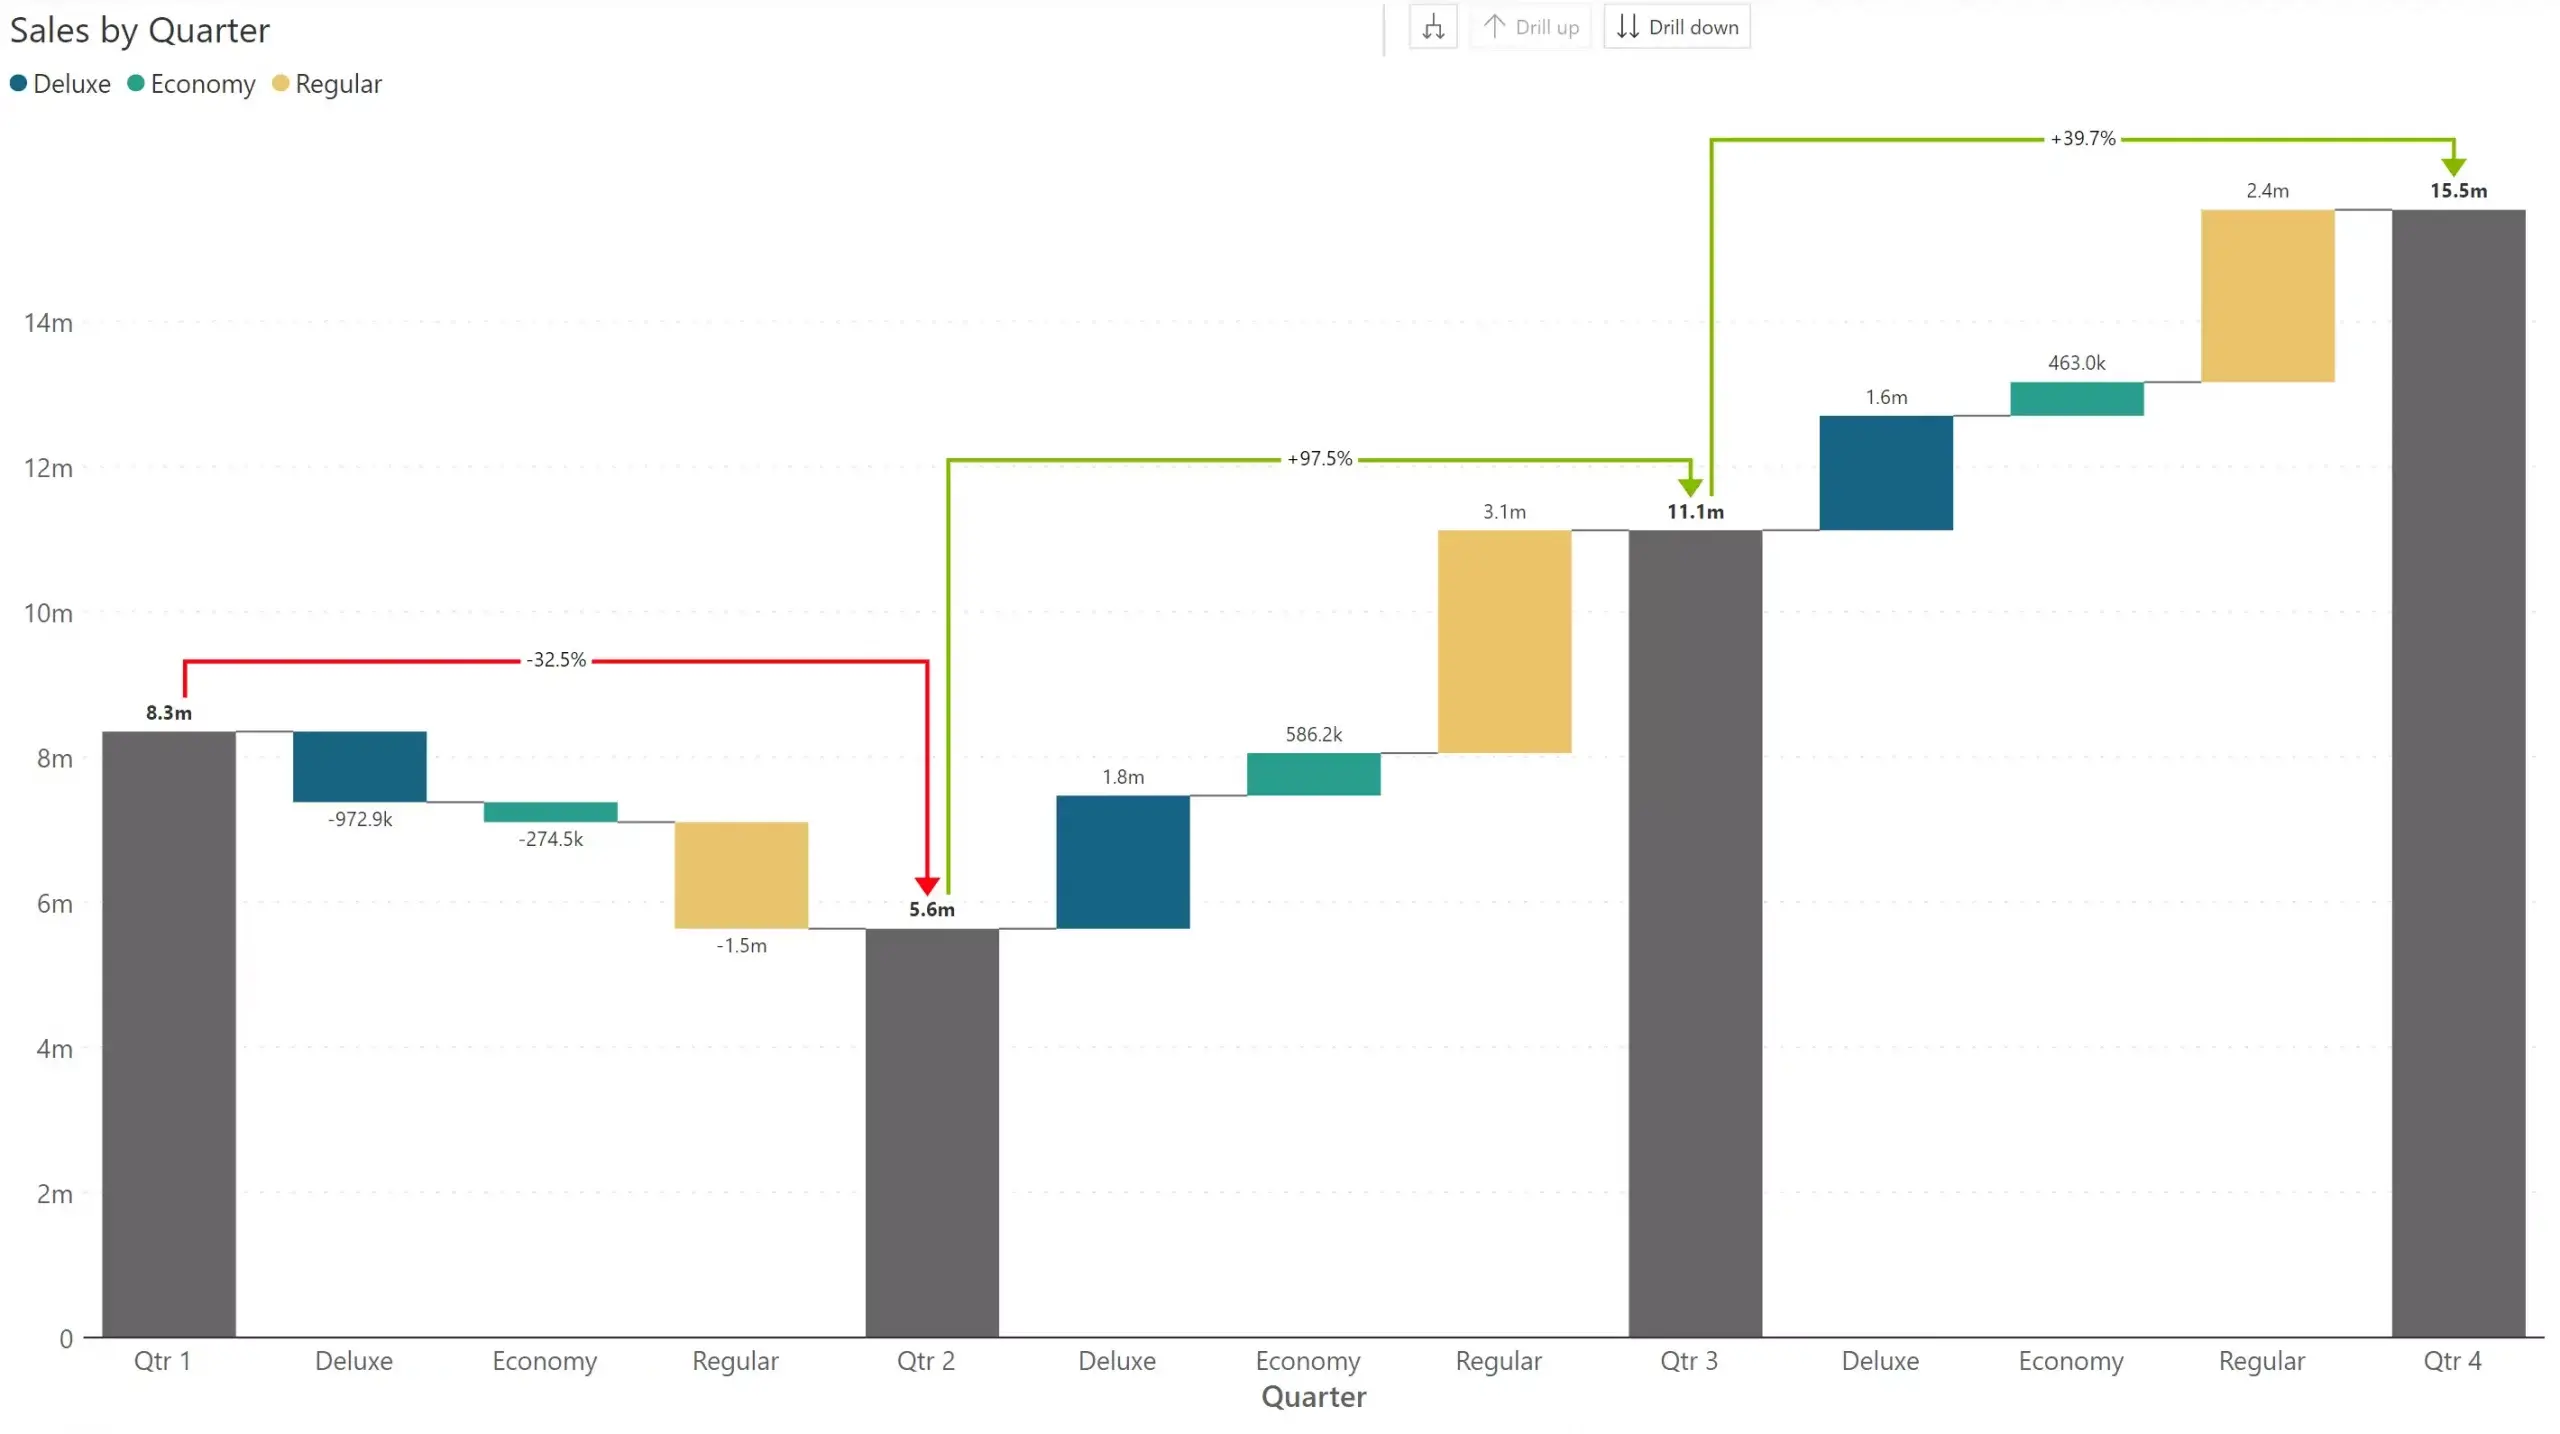
Highlight and configure Multiple Deviations between various quarters or products to make your dashboard more insightful
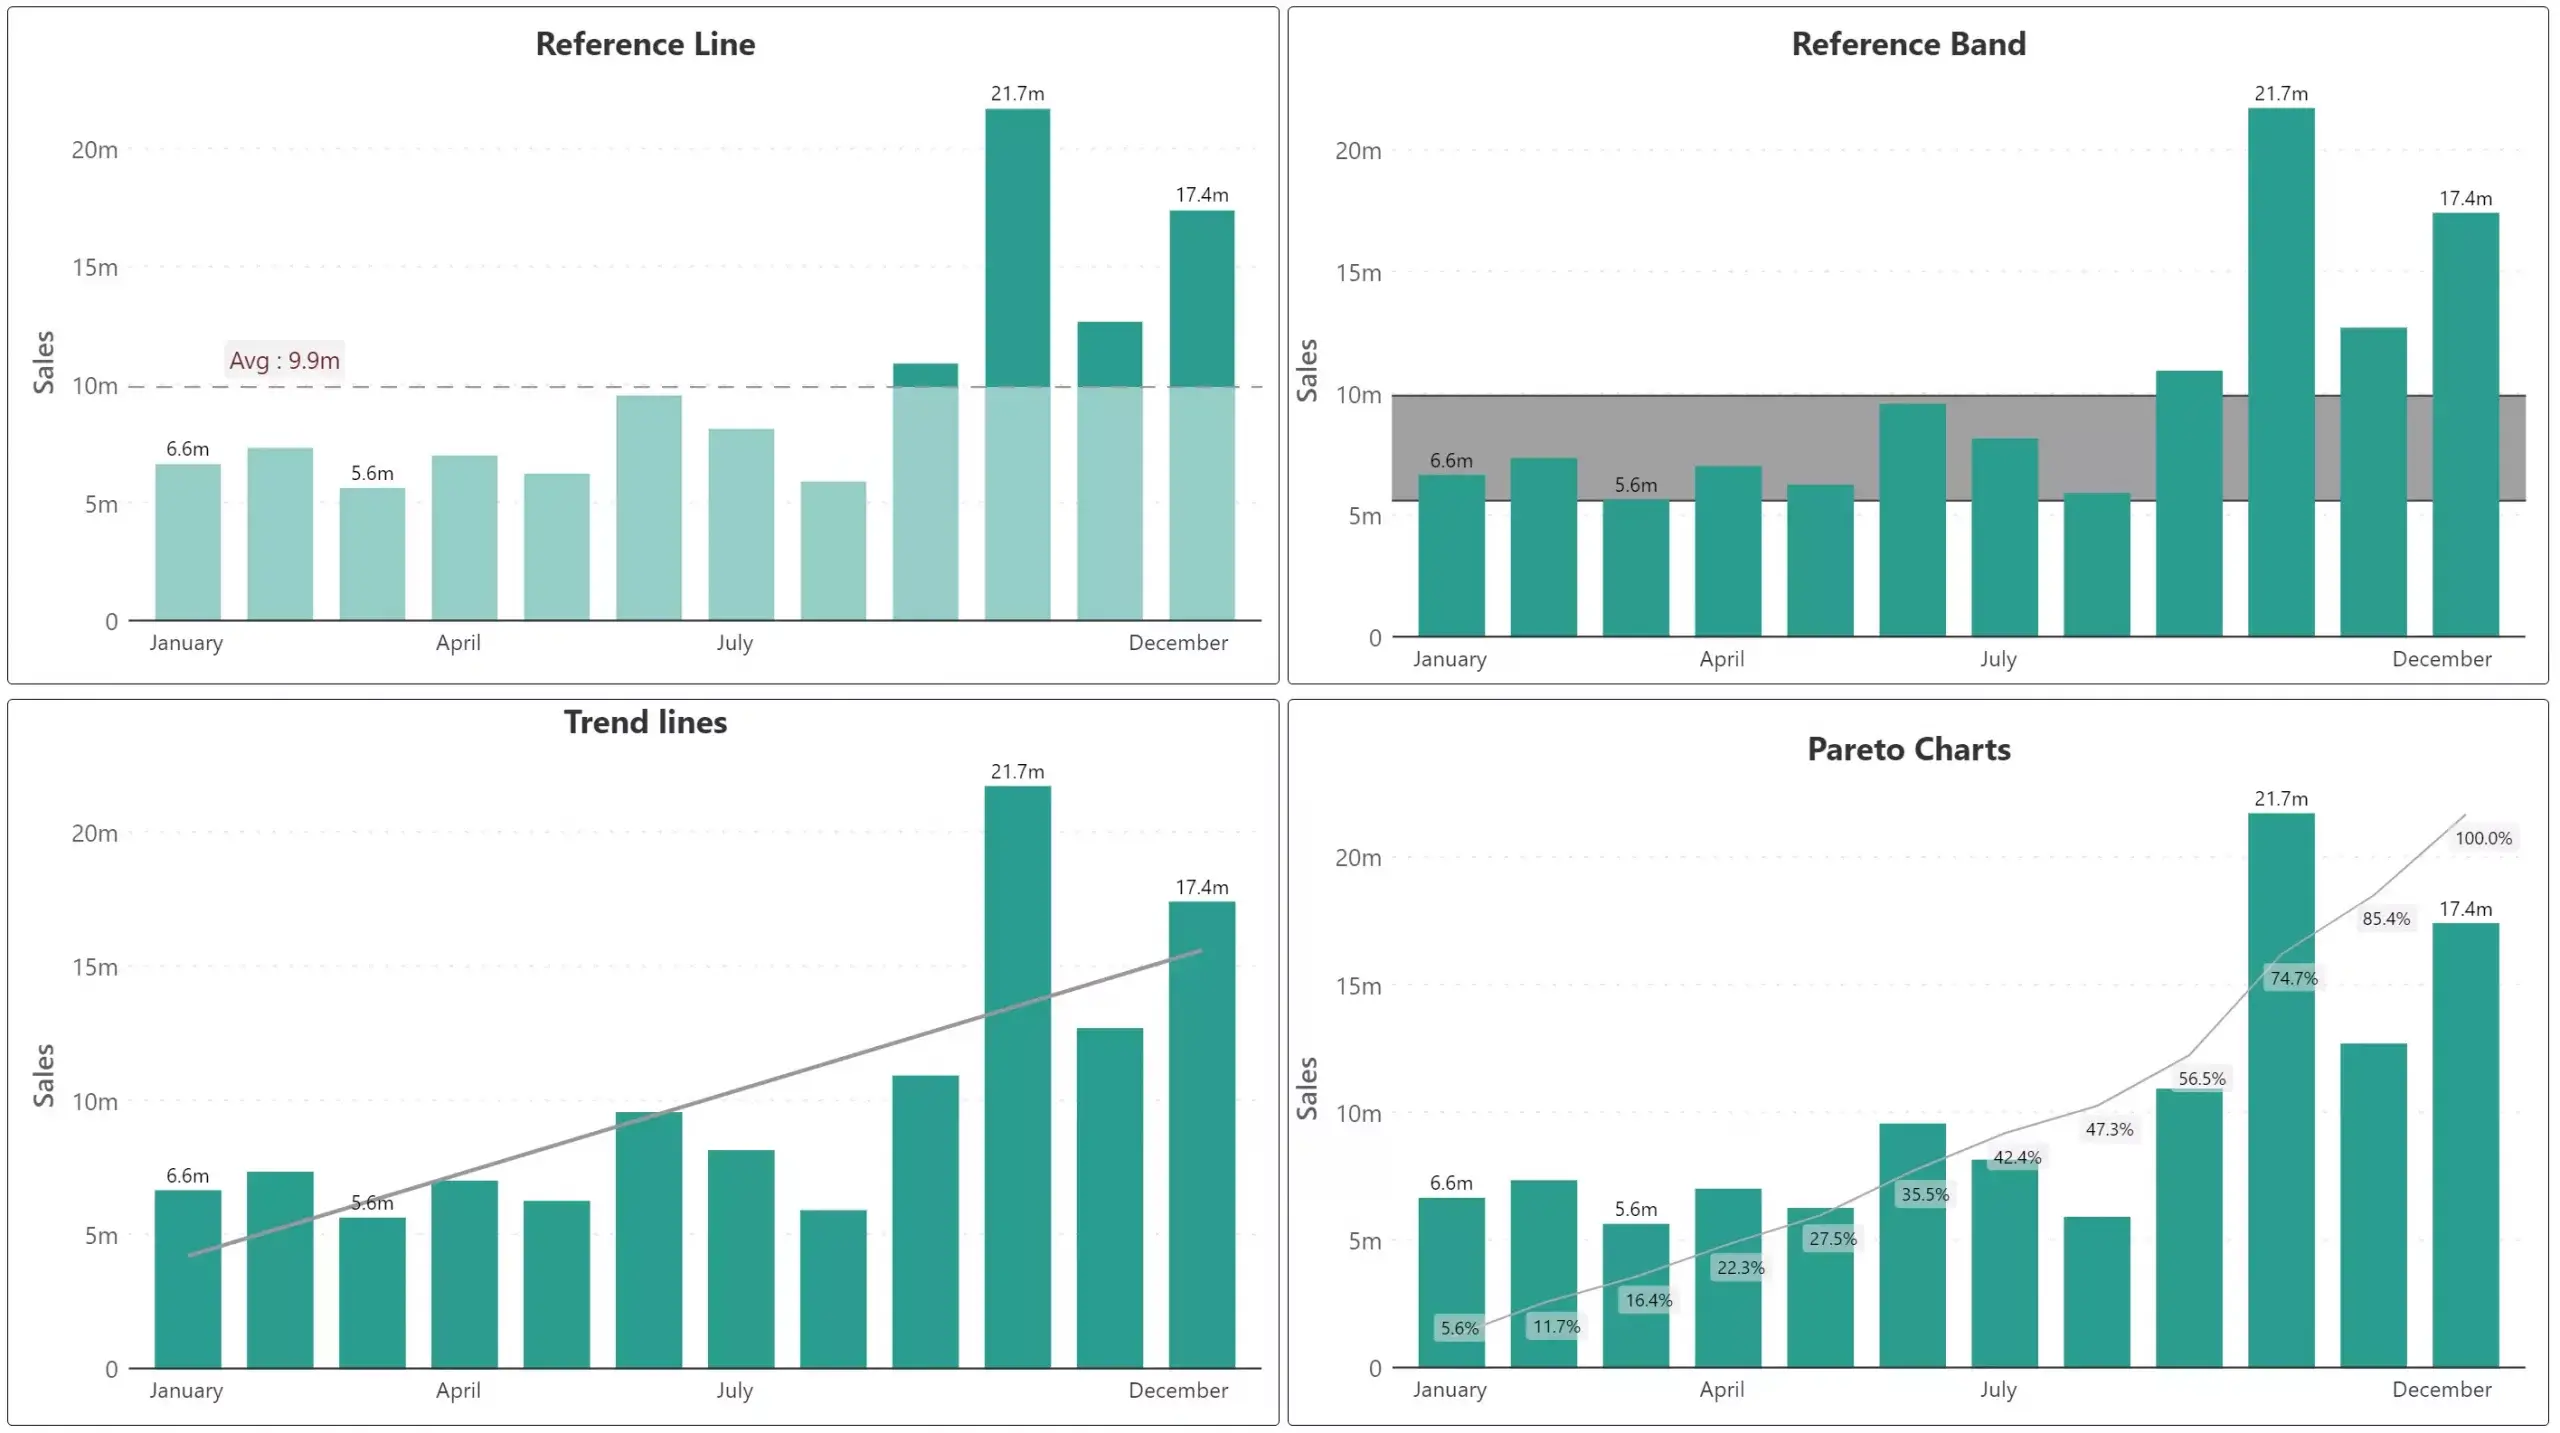
Incorporate Analytical Elements such as reference band and trend lines using a no-code interface
One of the mostly requested features by the Power BI community - Measure driven data labels - is now in Inforiver
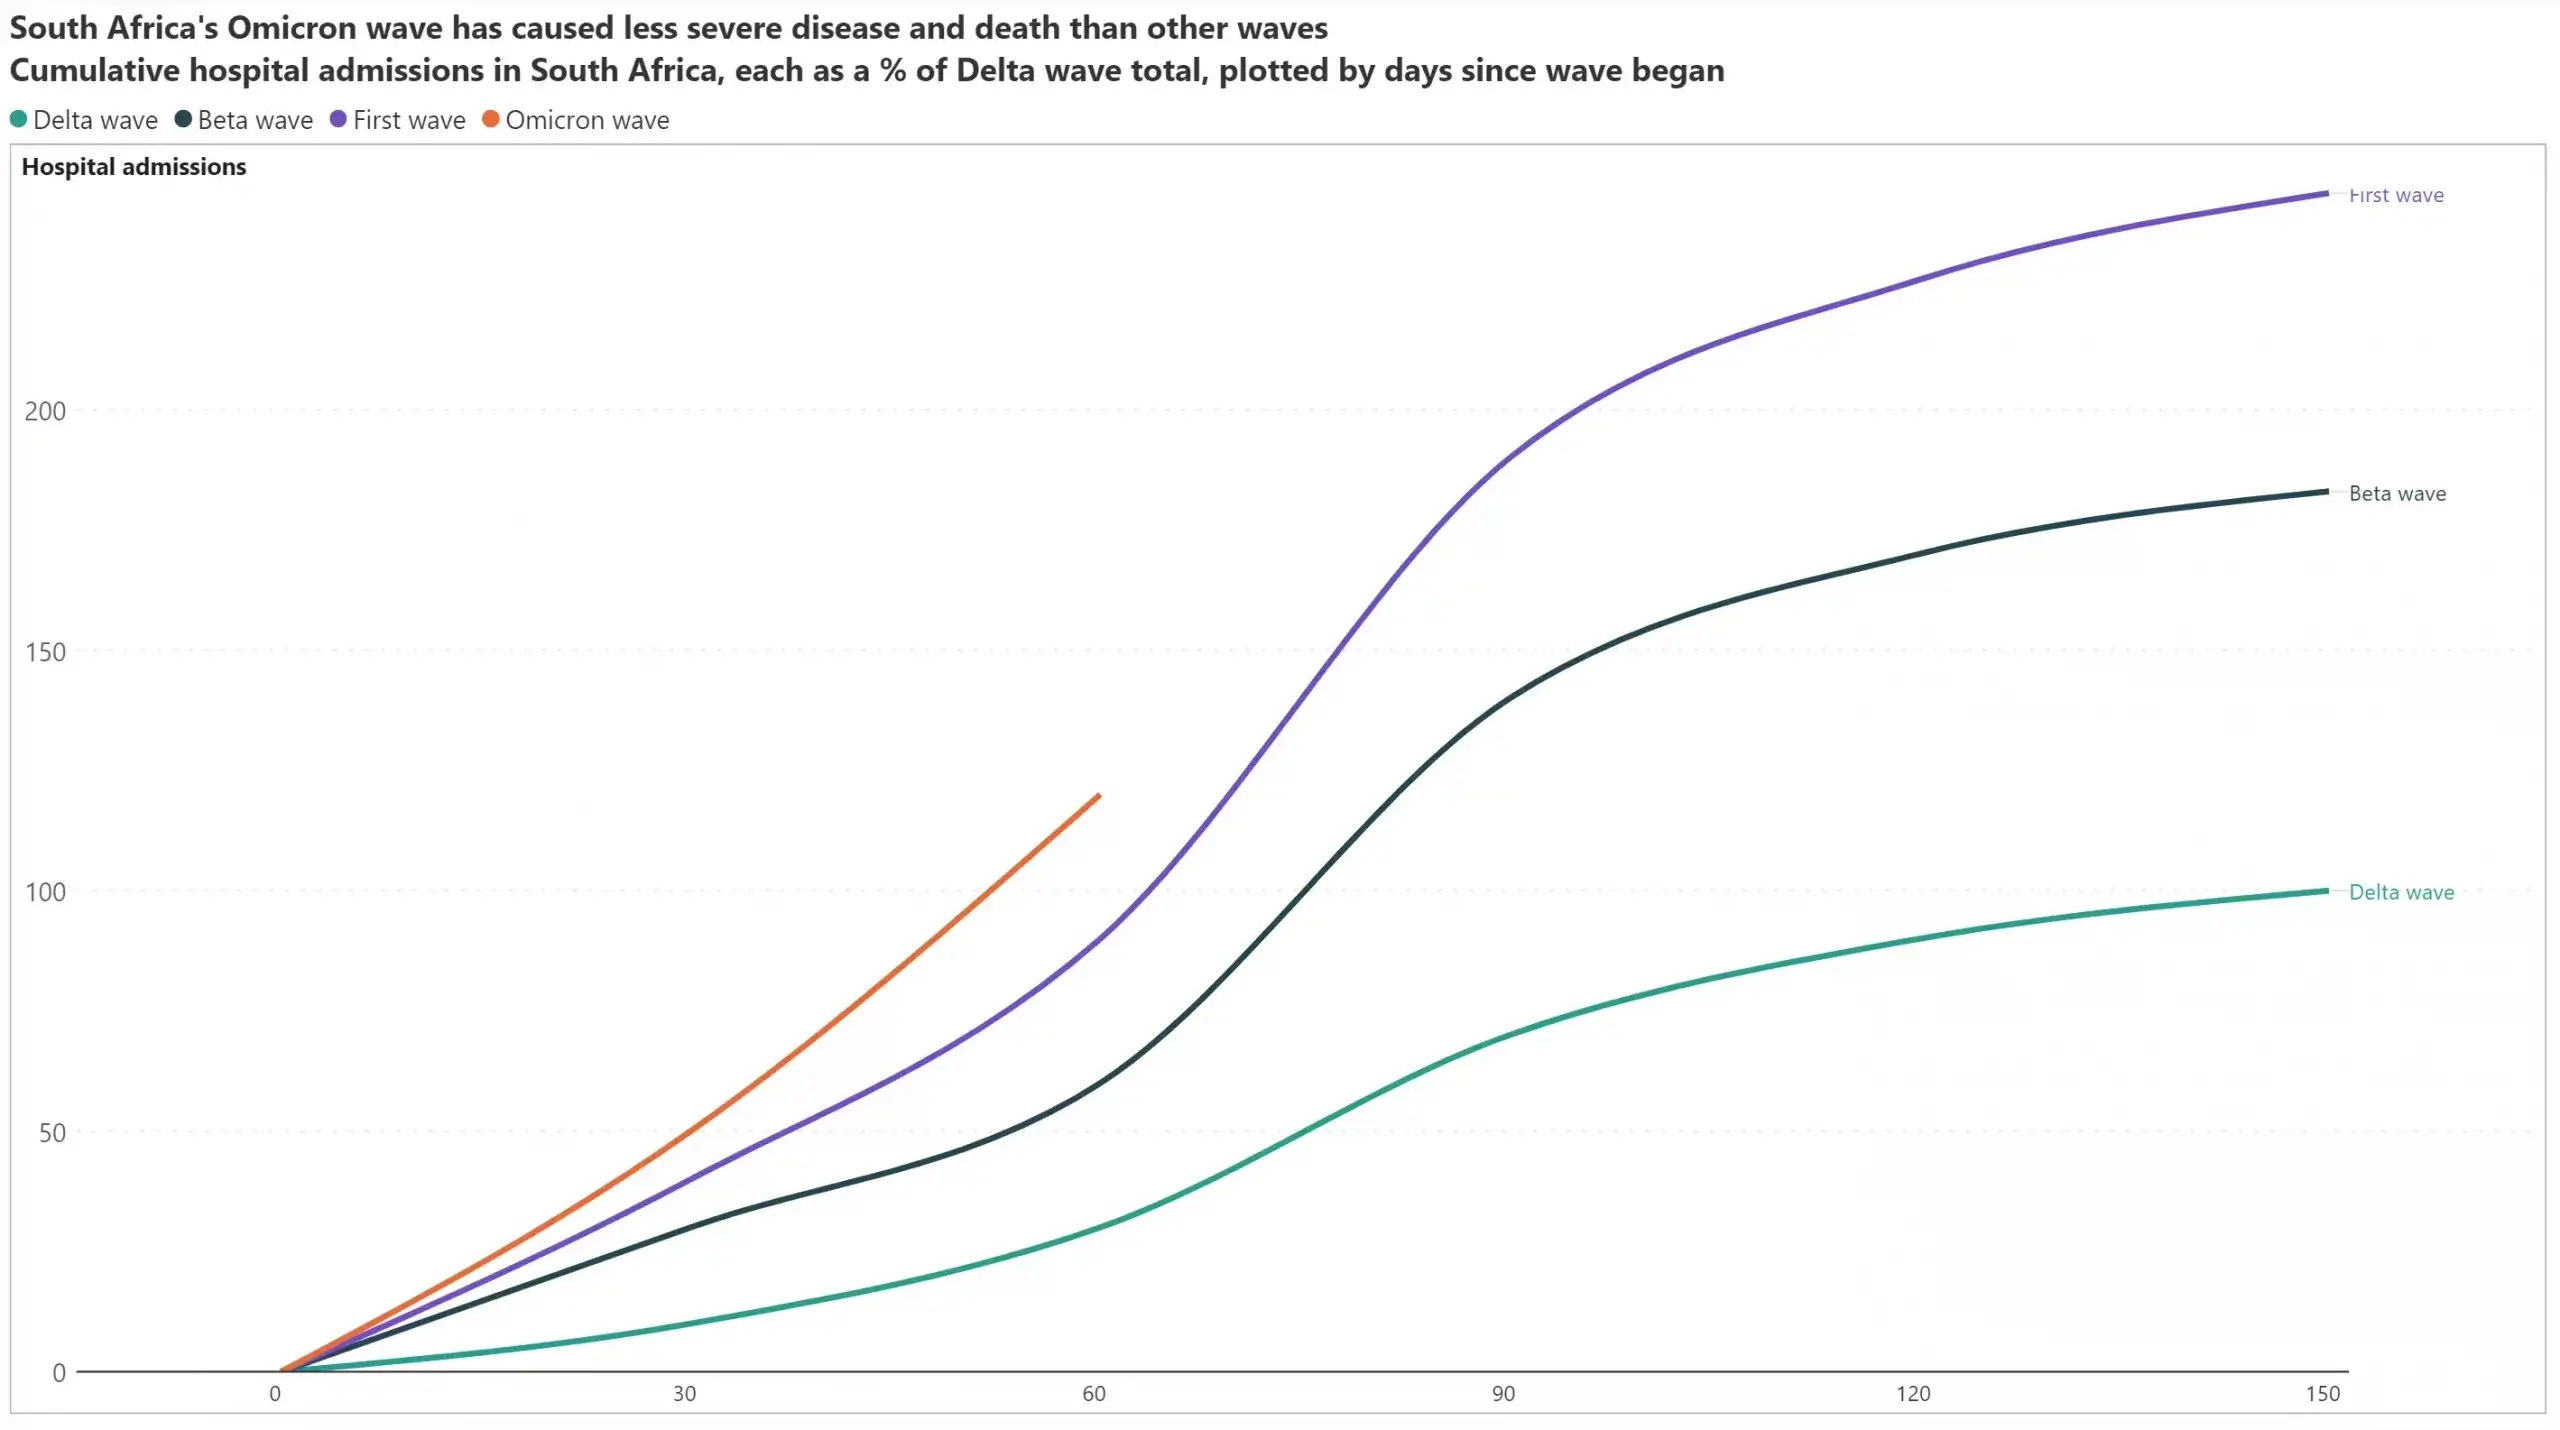
Export your chart visuals as Pixel-perfect PDF reports
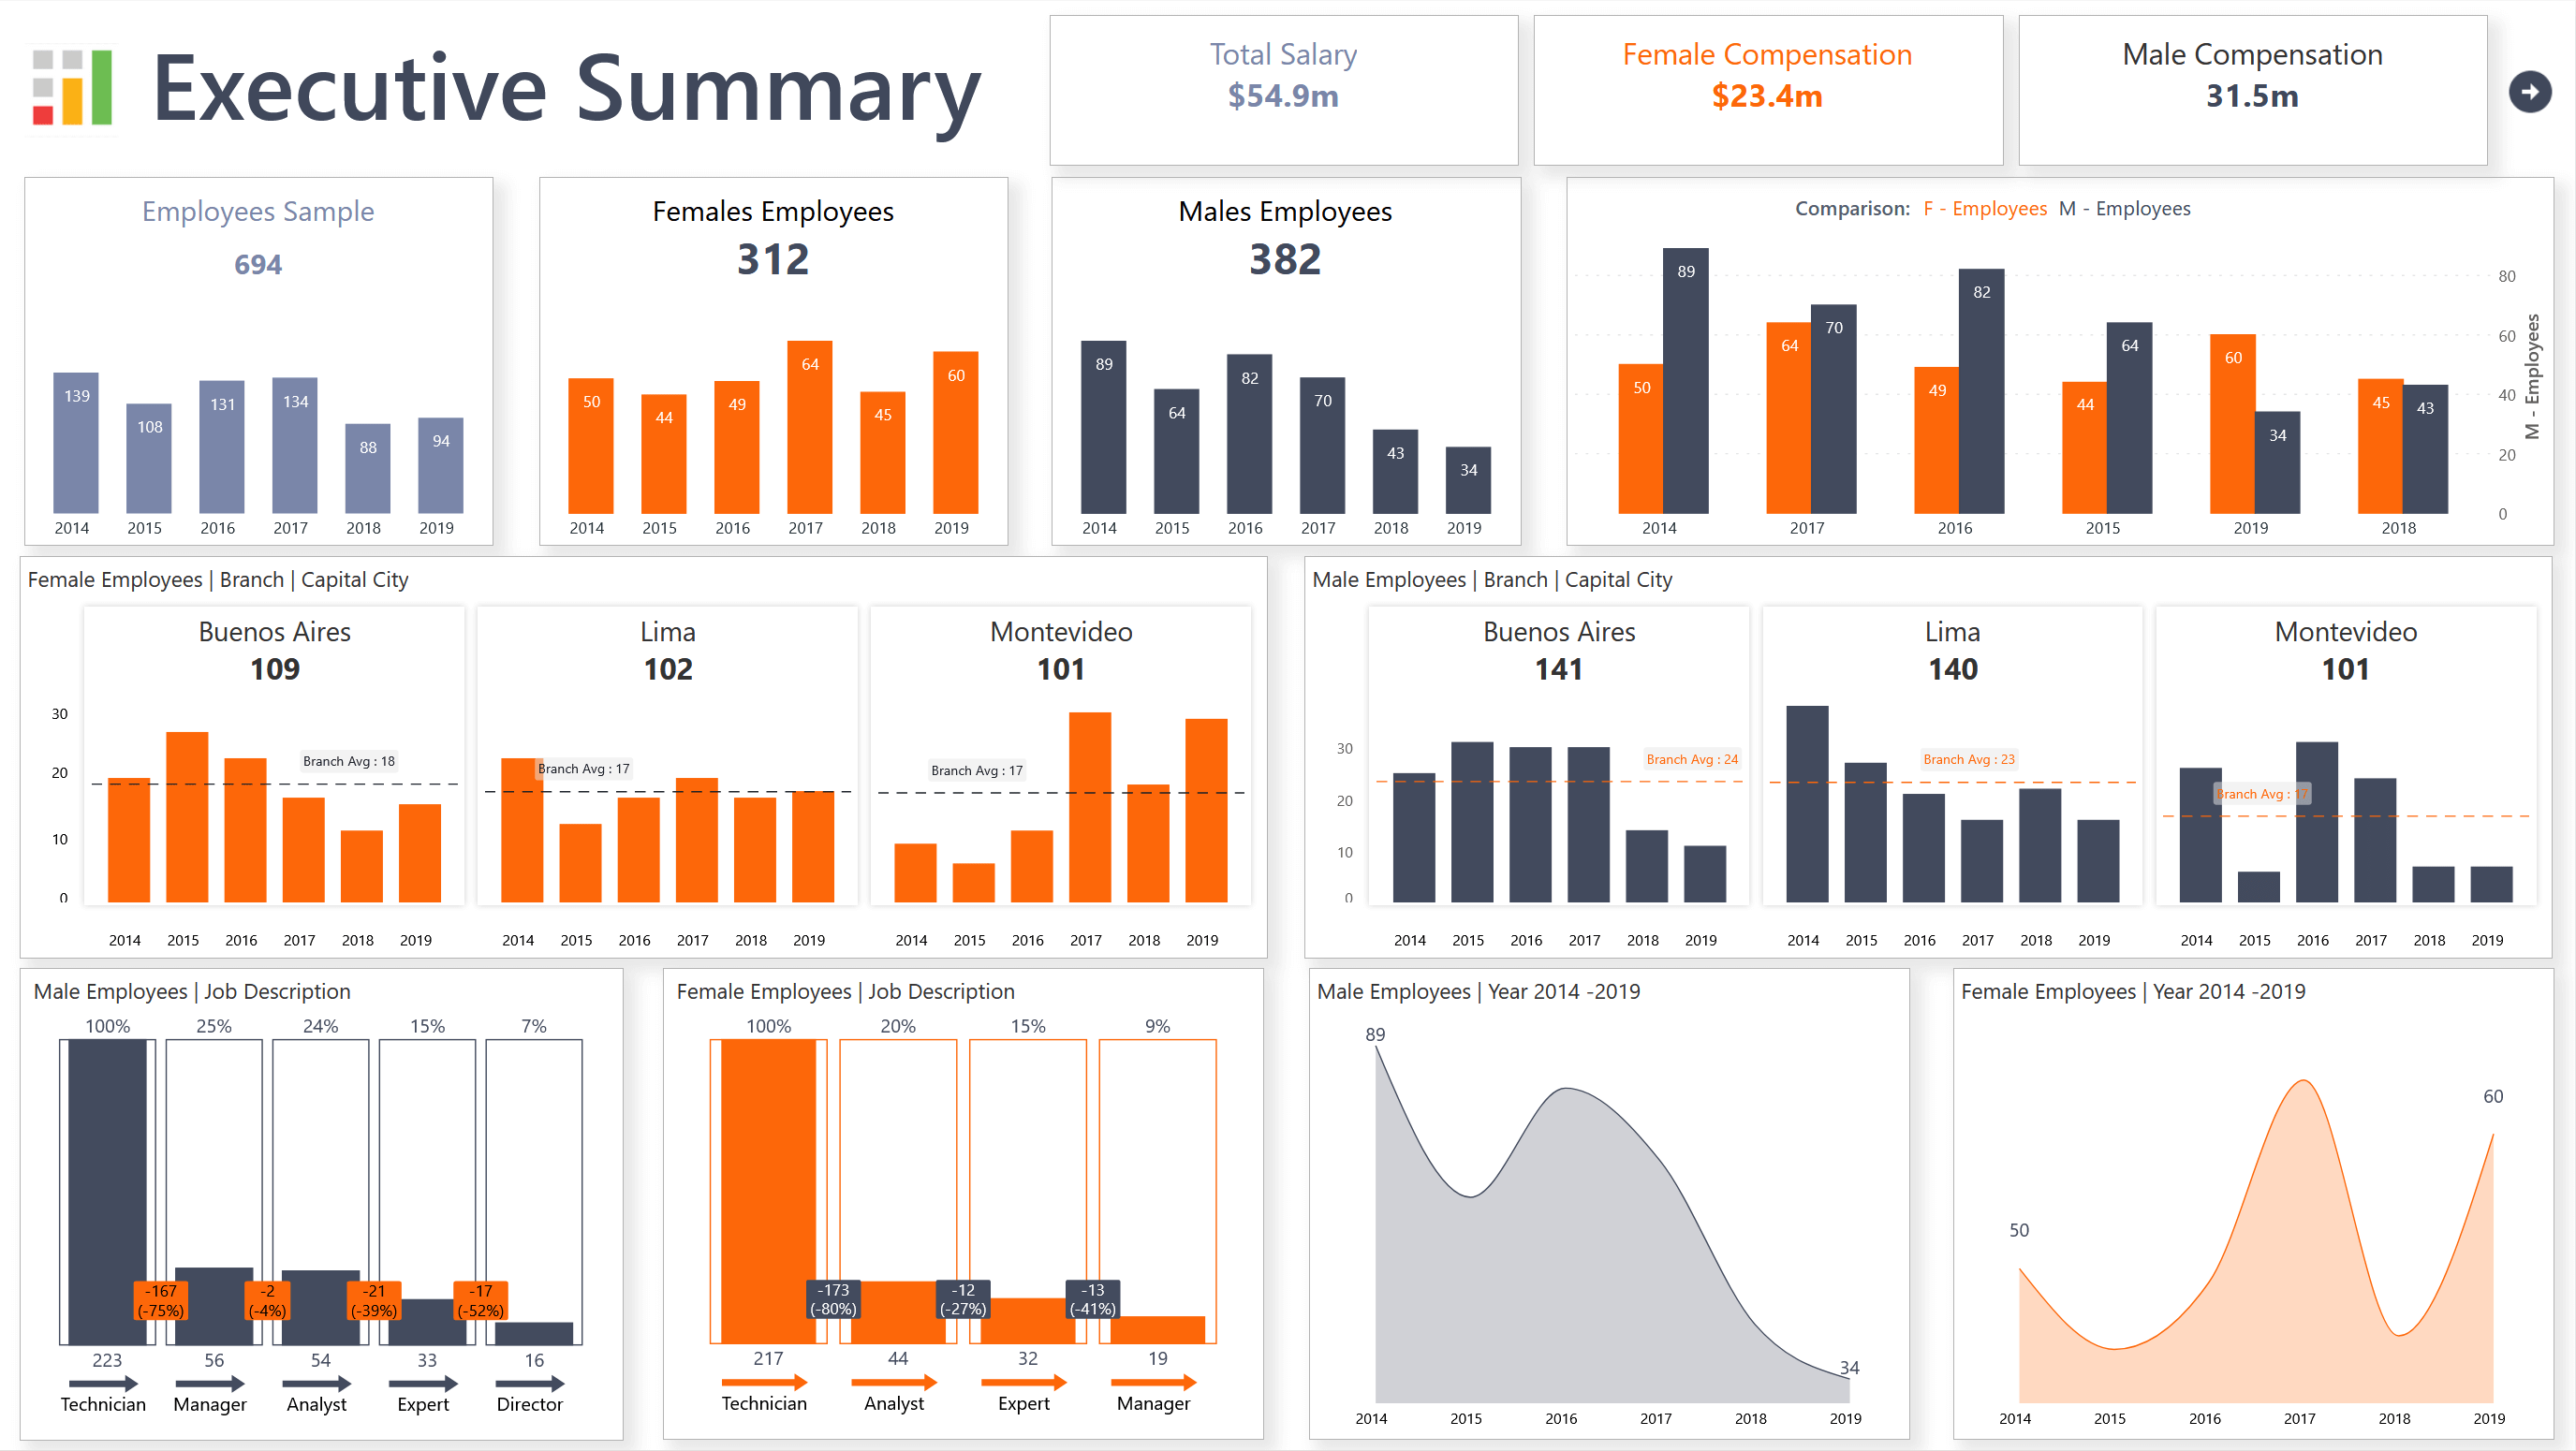
An executive analysis of a company’s HR equality practices based on gender, job role, and region.
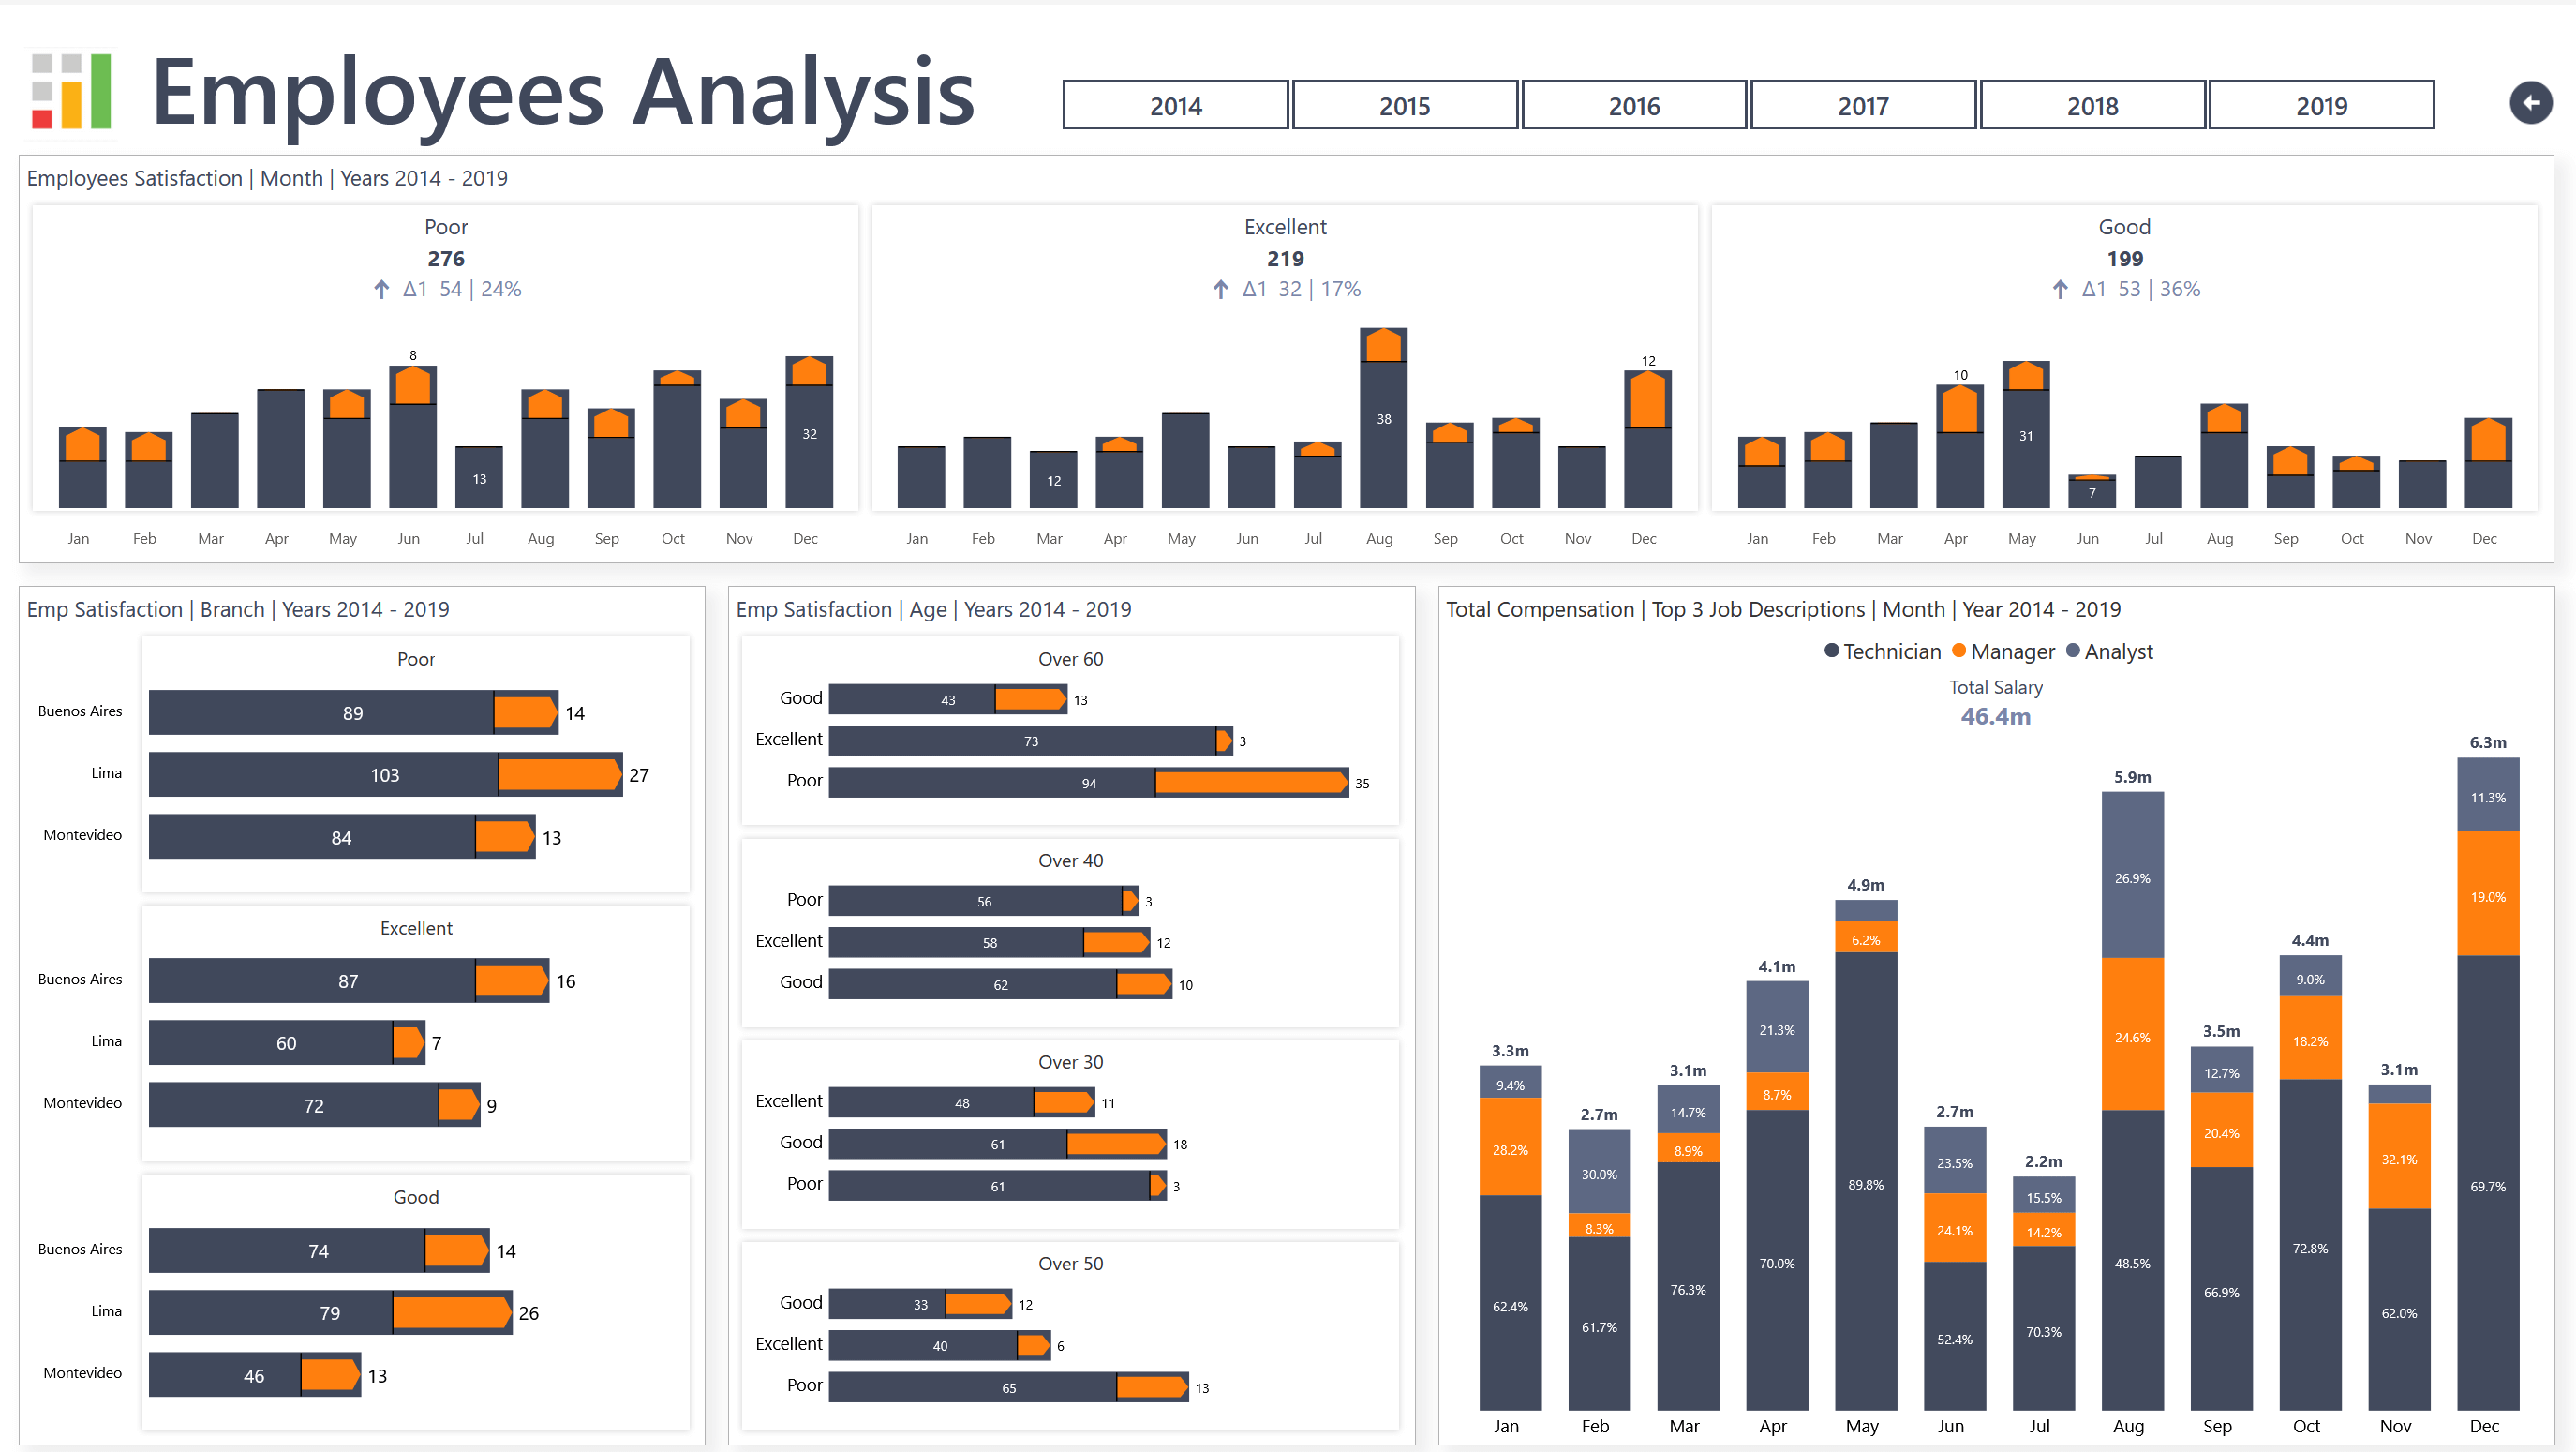
Employee satisfaction analysis across month, branch and age.
Inforiver helps enterprises consolidate planning, reporting & analytics on a single platform (Power BI). The no-code, self-service award-winning platform has been recognized as the industry’s best and is adopted by many Fortune 100 firms.
Inforiver is a product of Lumel, the #1 Power BI AppSource Partner. The firm serves over 3,000 customers worldwide through its portfolio of products offered under the brands Inforiver, EDITable, ValQ, and xViz.