Upcoming webinar on 'Inforiver Charts : The fastest way to deliver stories in Power BI', Aug 29th , Monday, 10.30 AM CST. Register Now
Upcoming webinar on 'Inforiver Charts : The fastest way to deliver stories in Power BI', Aug 29th , Monday, 10.30 AM CST. Register Now
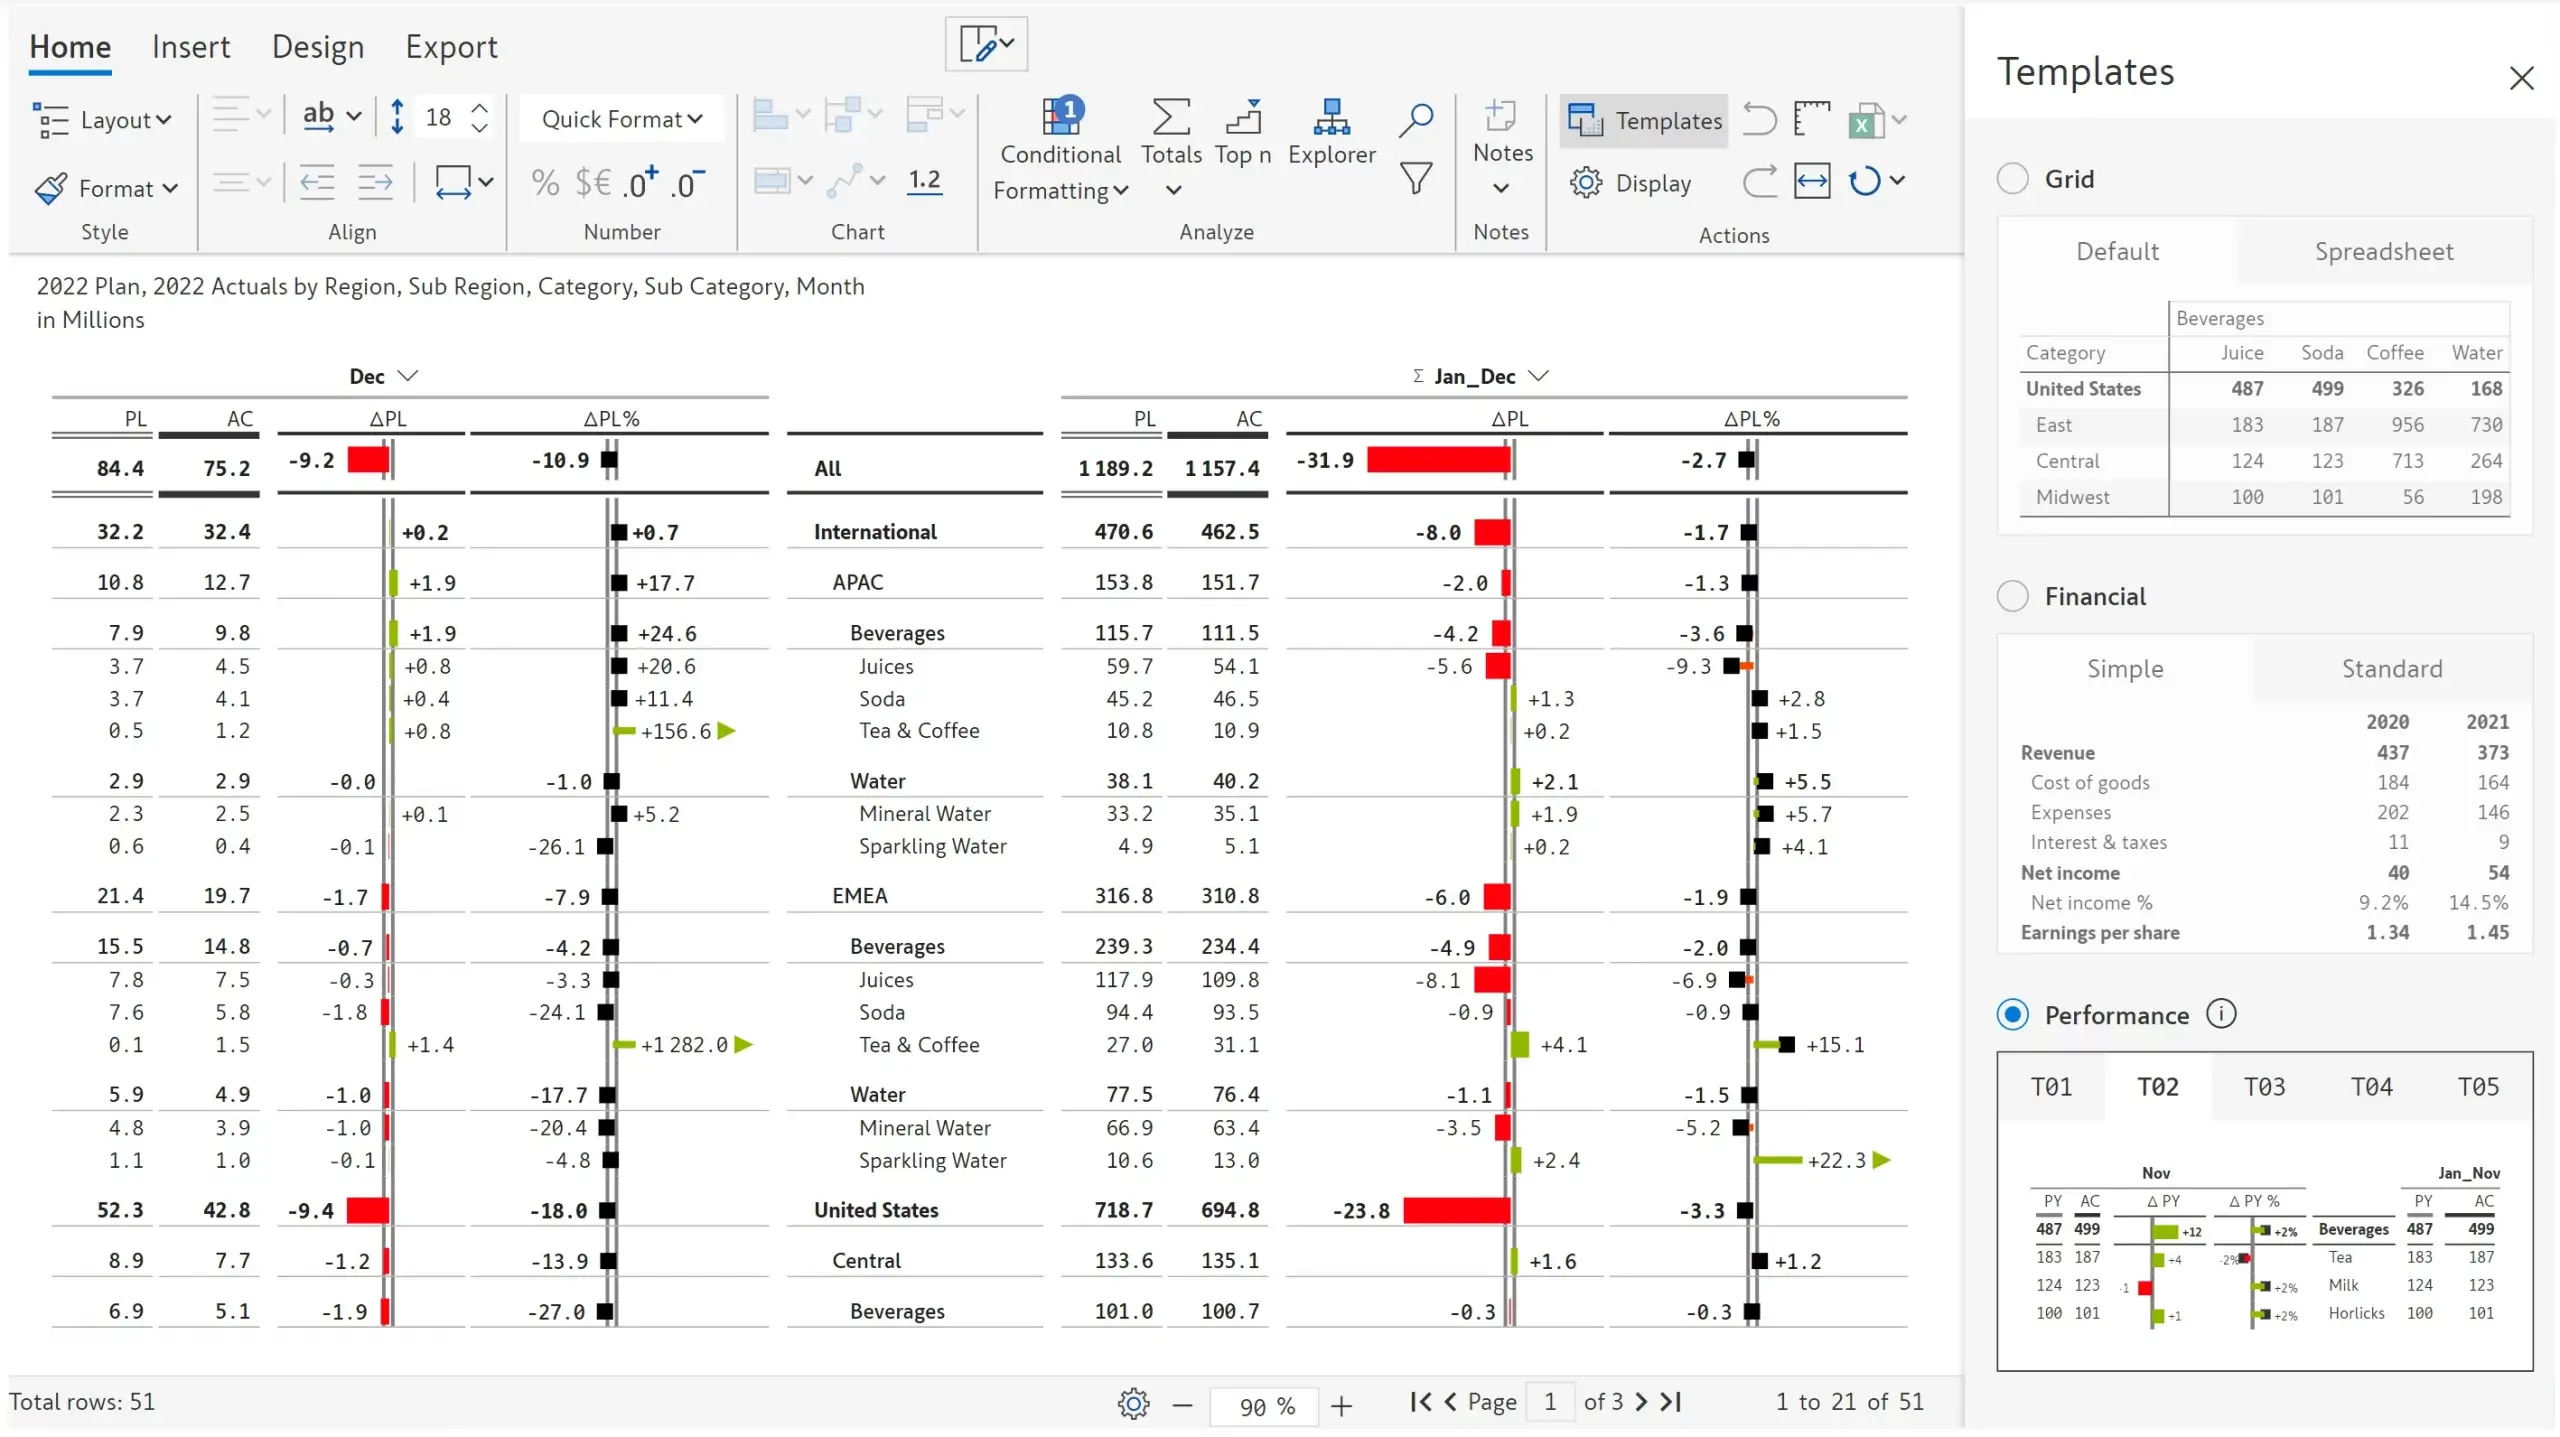
Toggle between any of the nine (9) business templates, in a single click
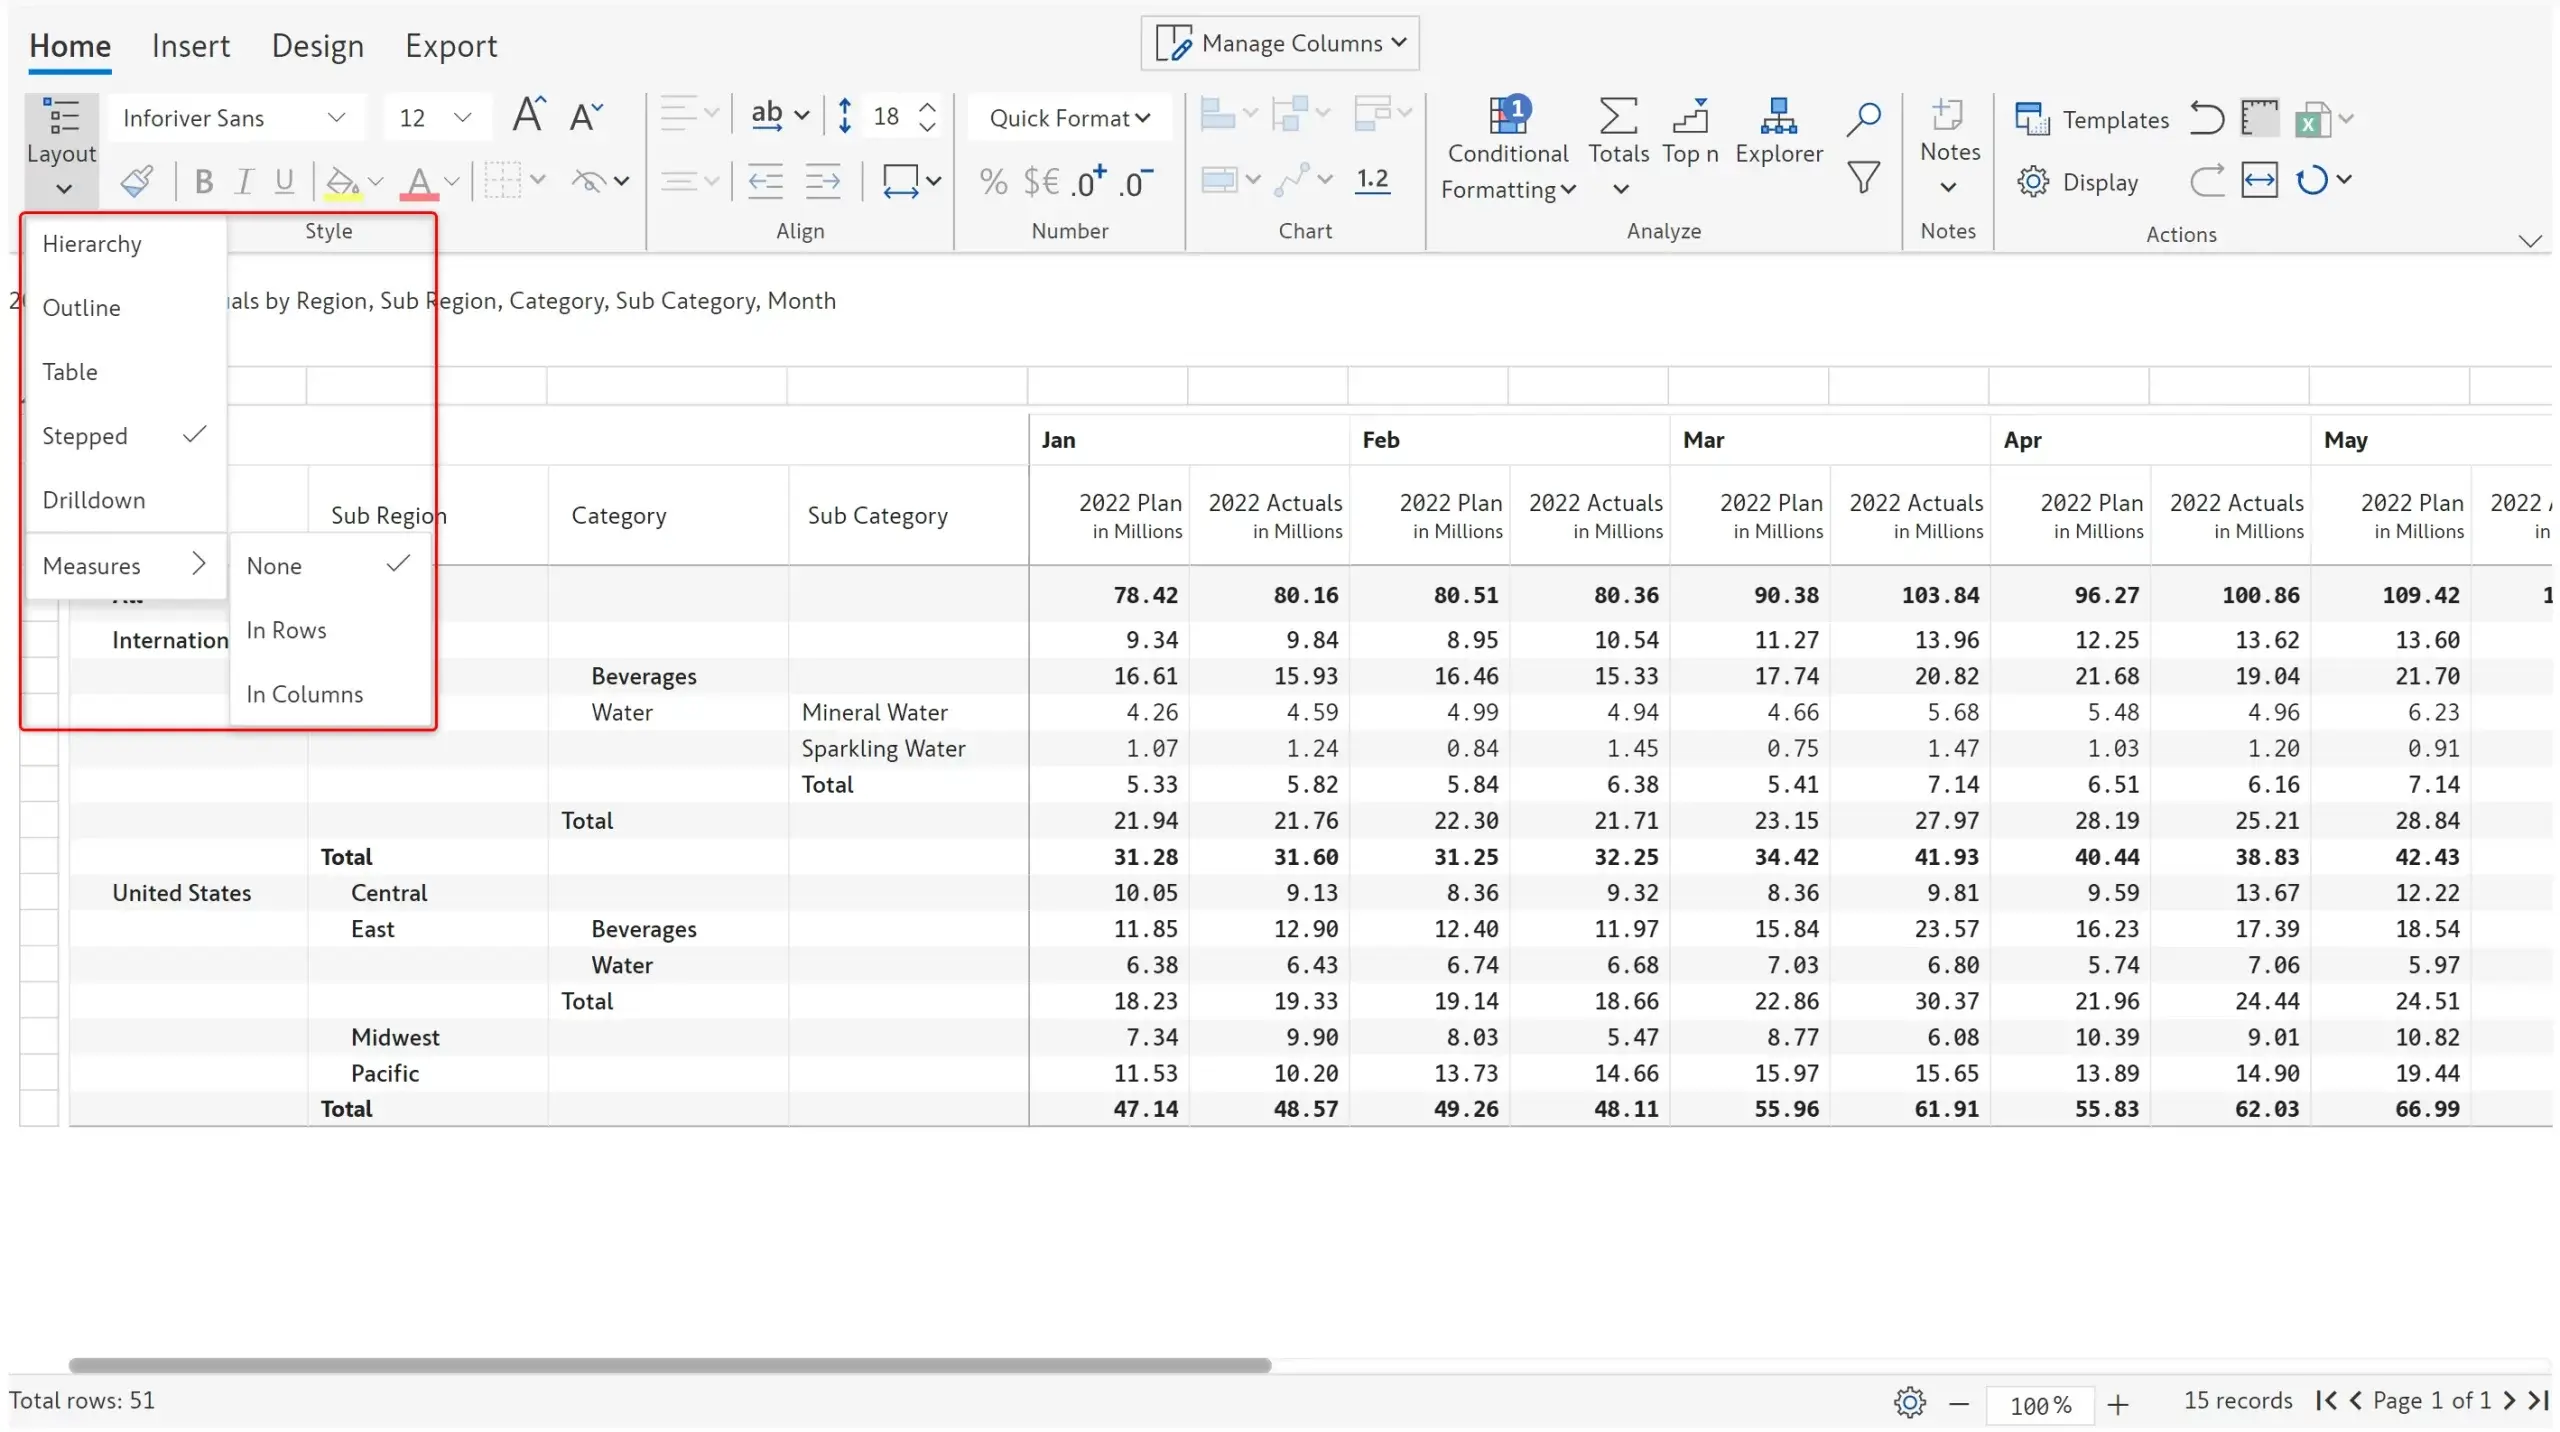
Leverage excel-like layouts such as classic, stepped, outline and more; show measures on rows or columns using the pivot mode
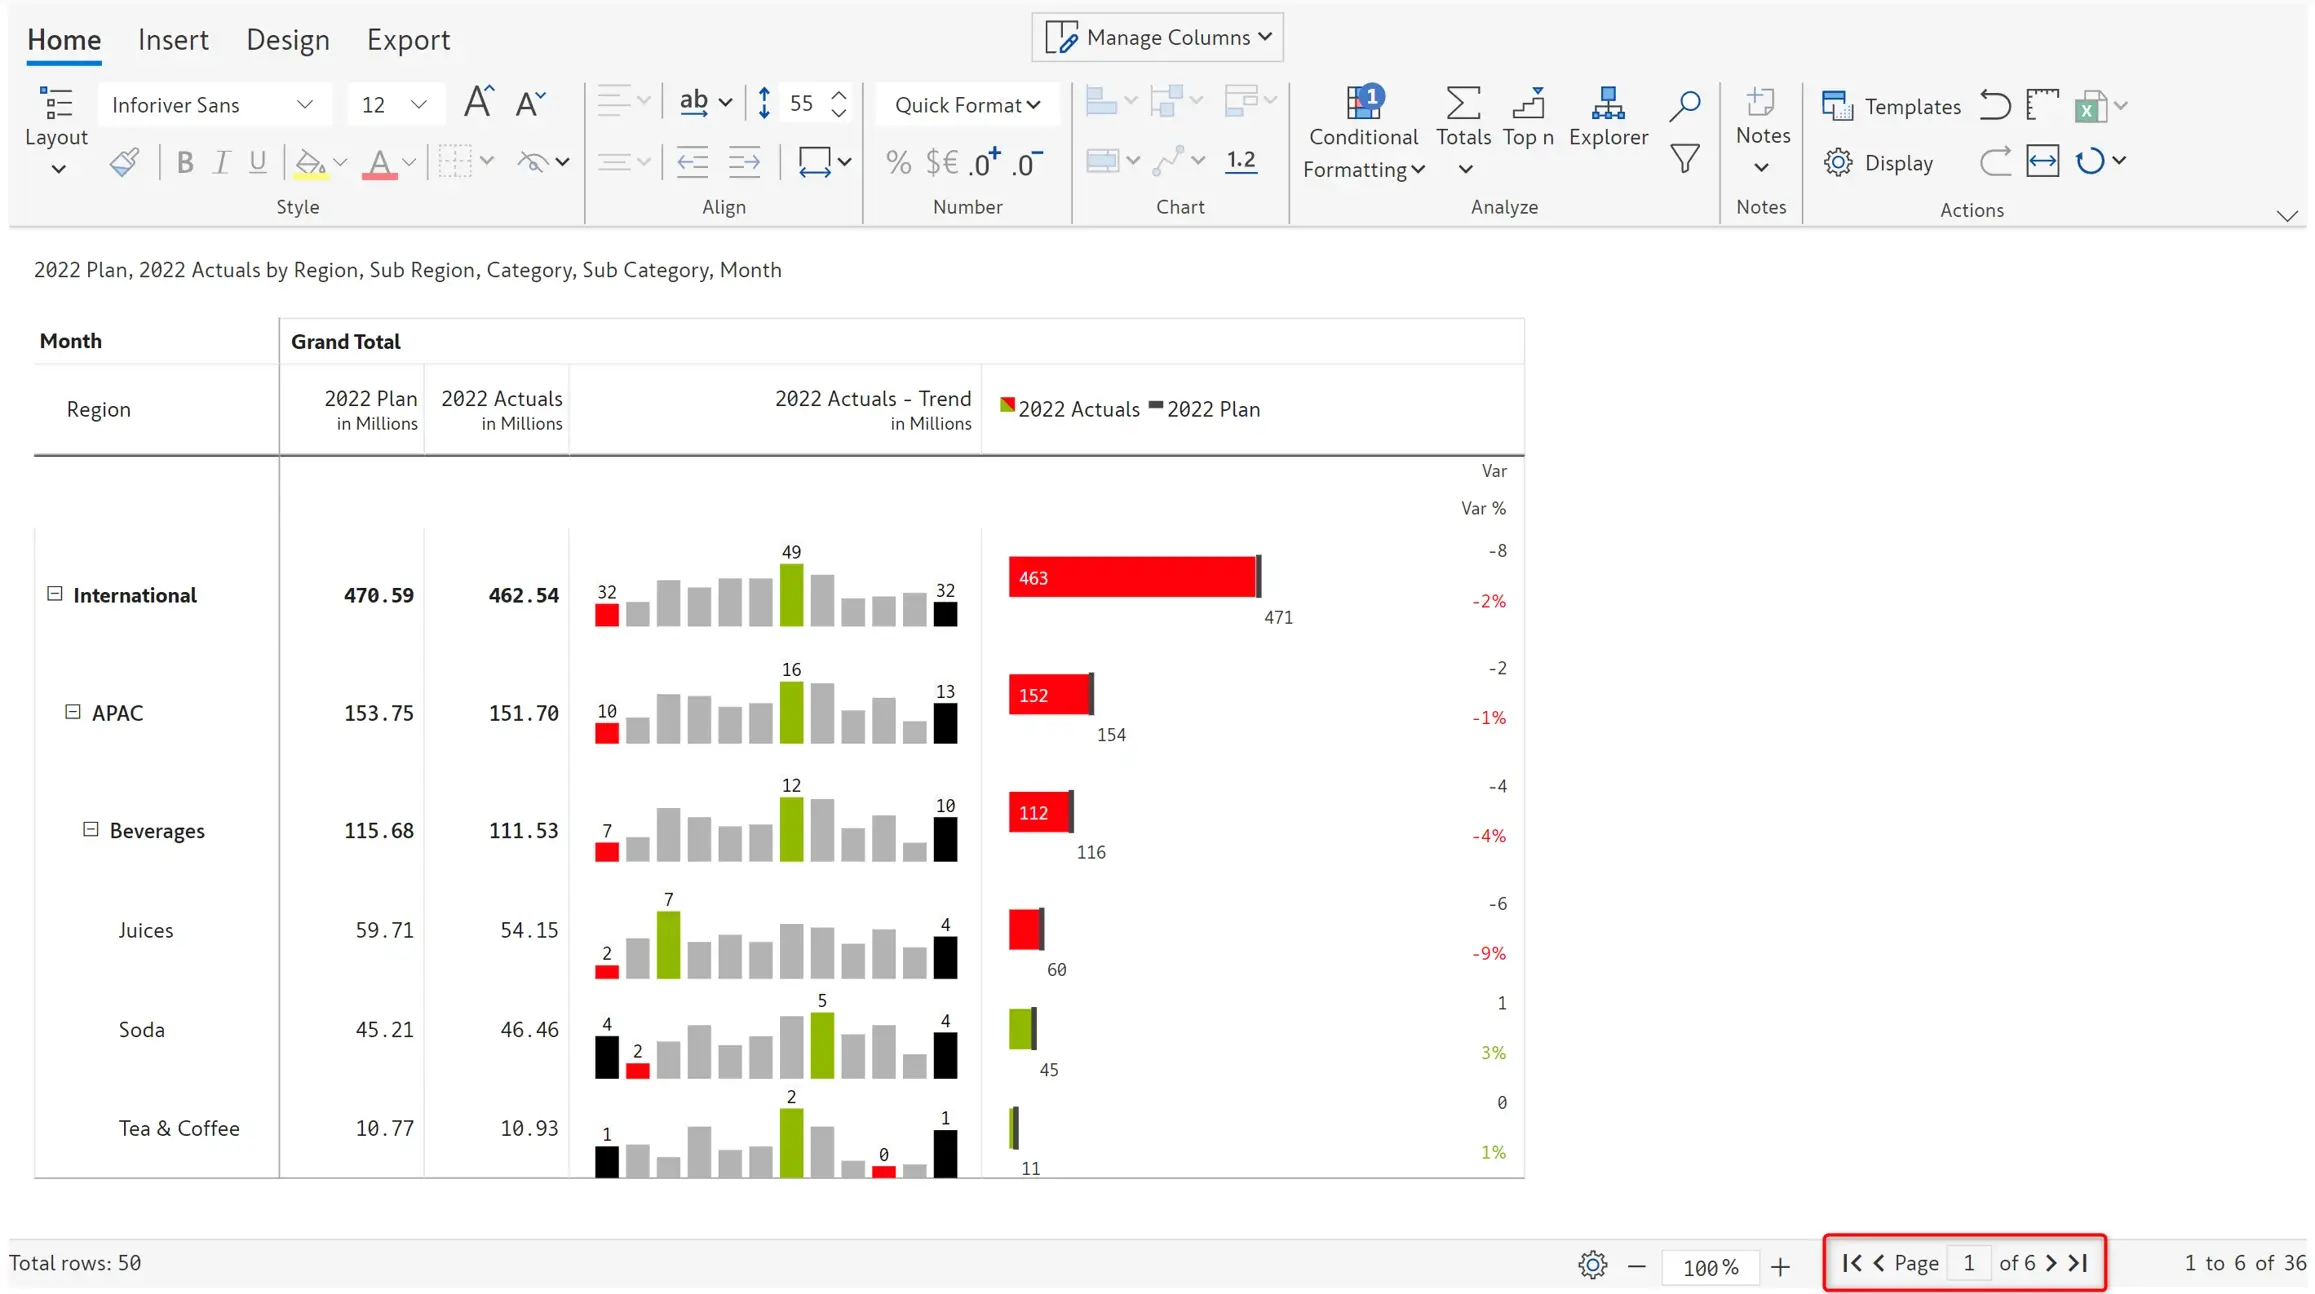
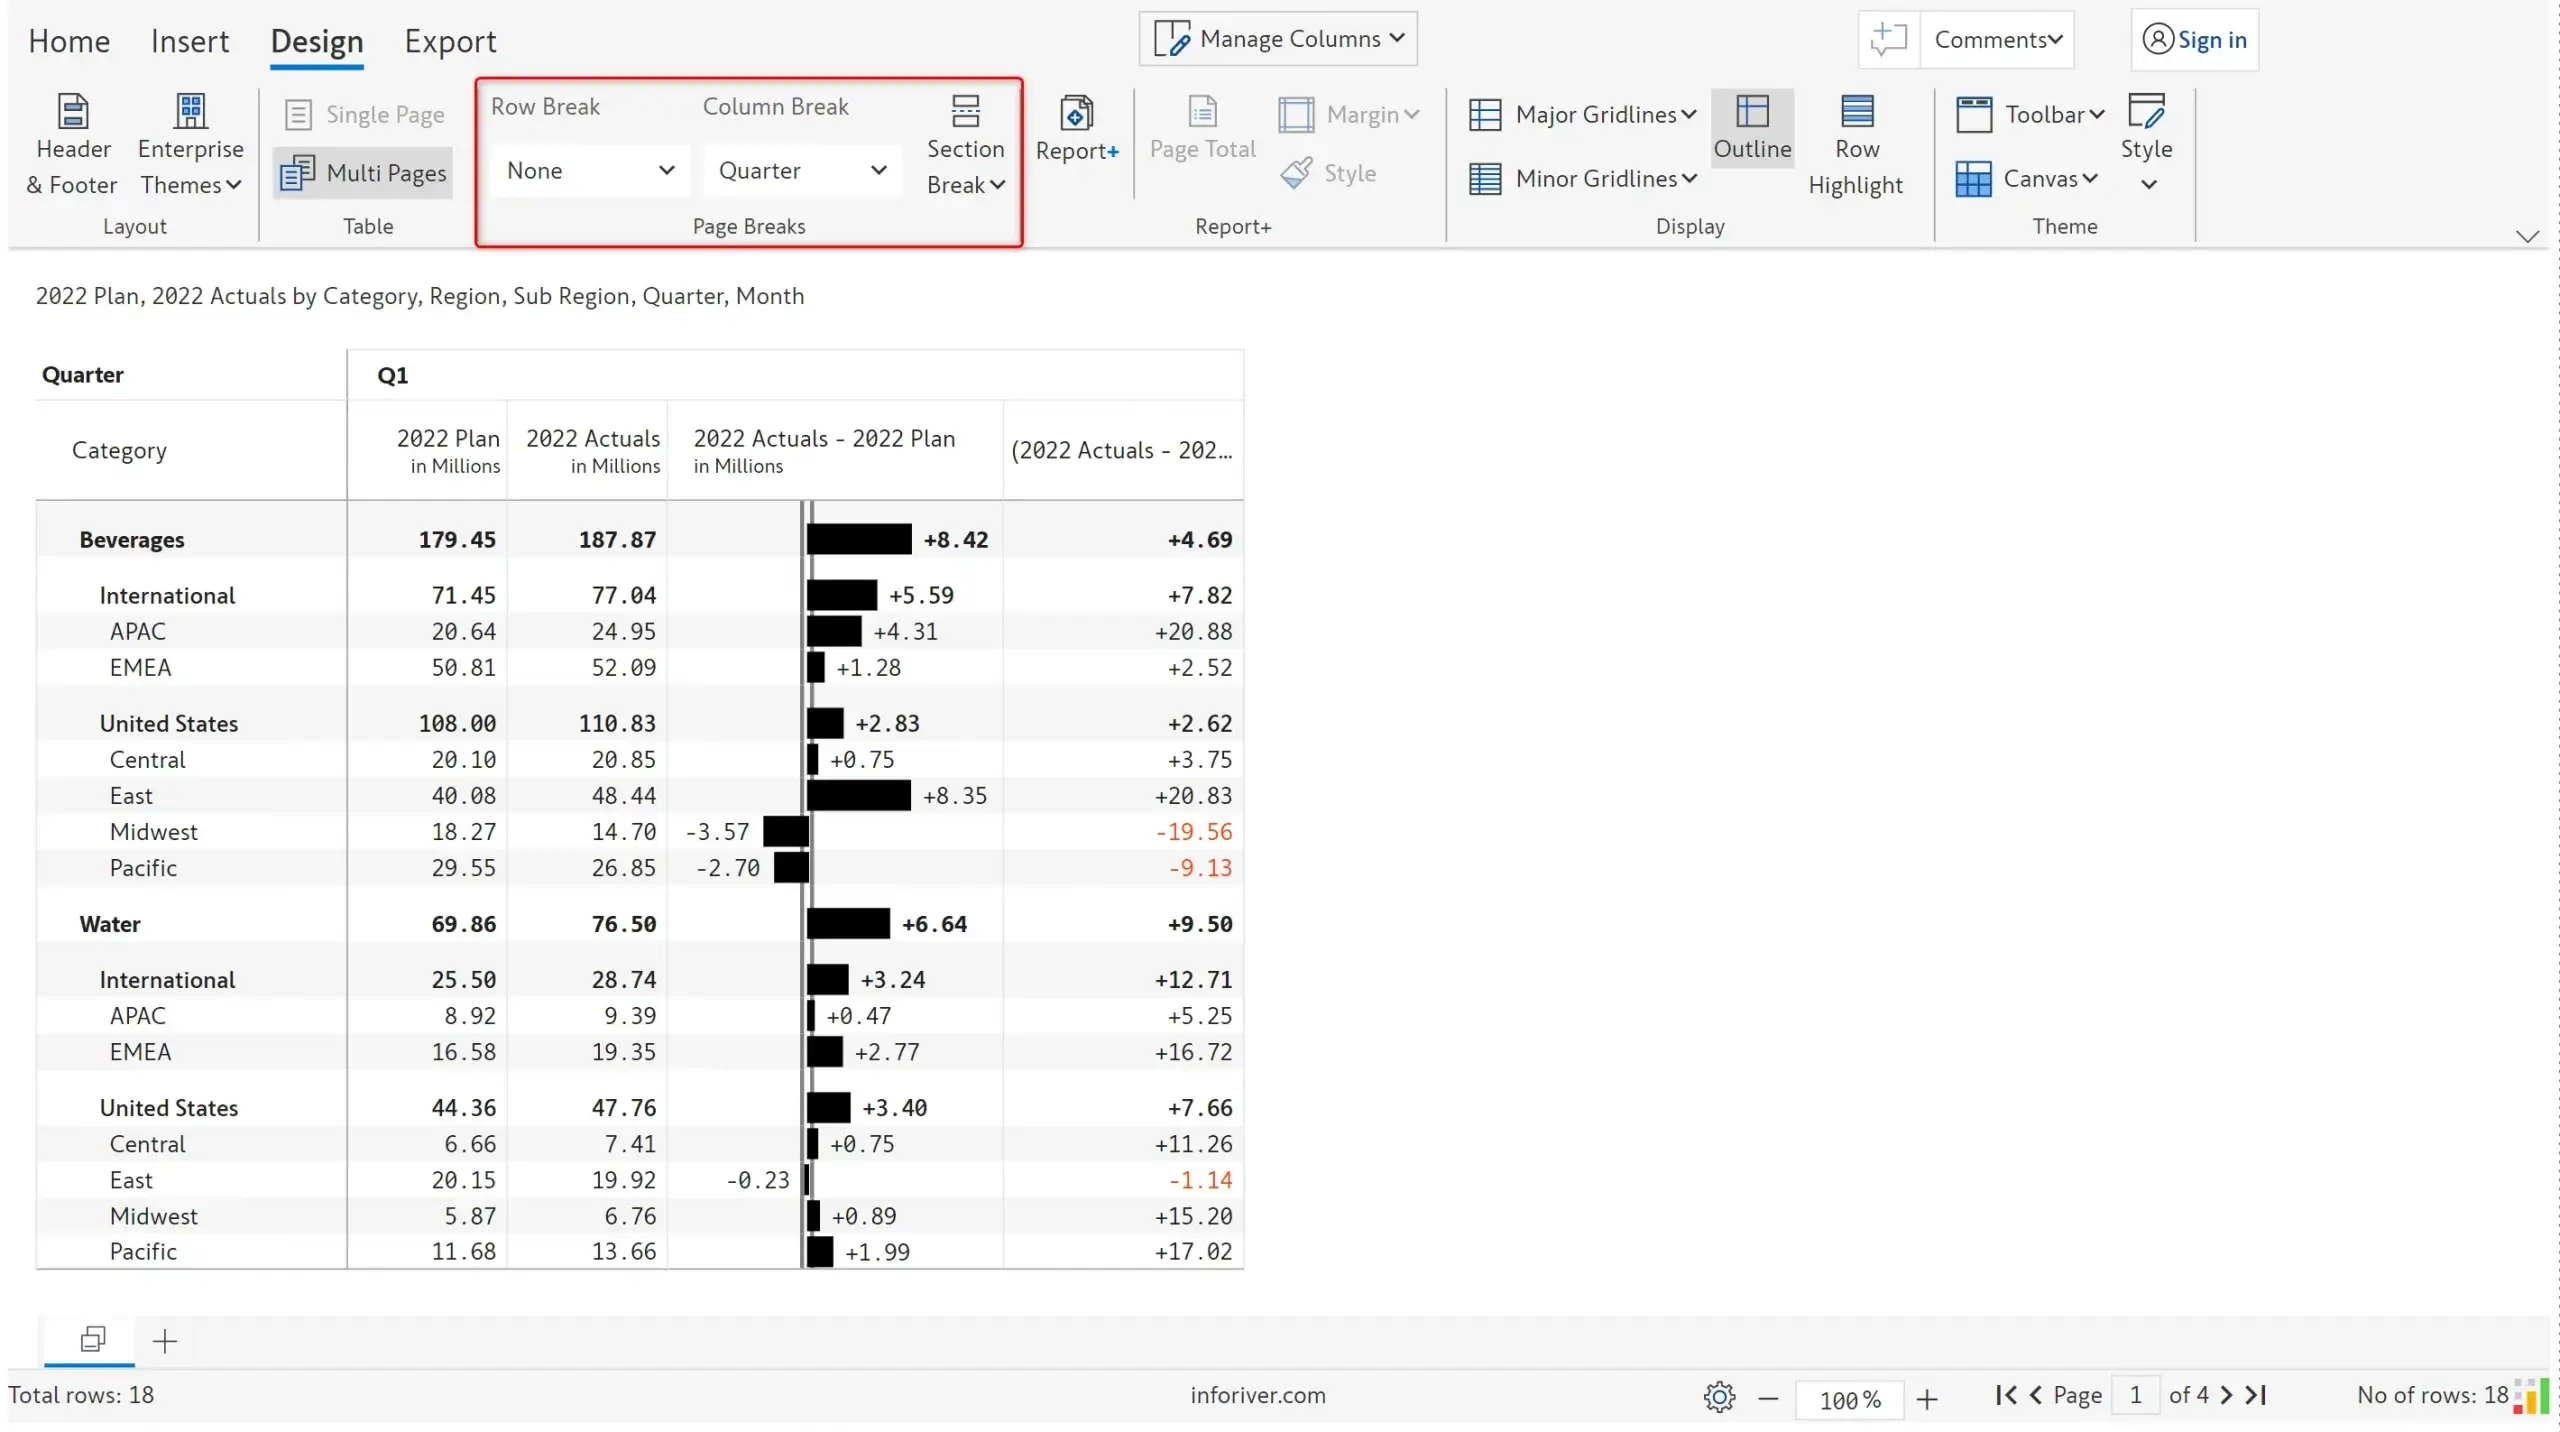
Create reports with First-Previous-Next-Last navigation, with the ability to insert page & section breaks
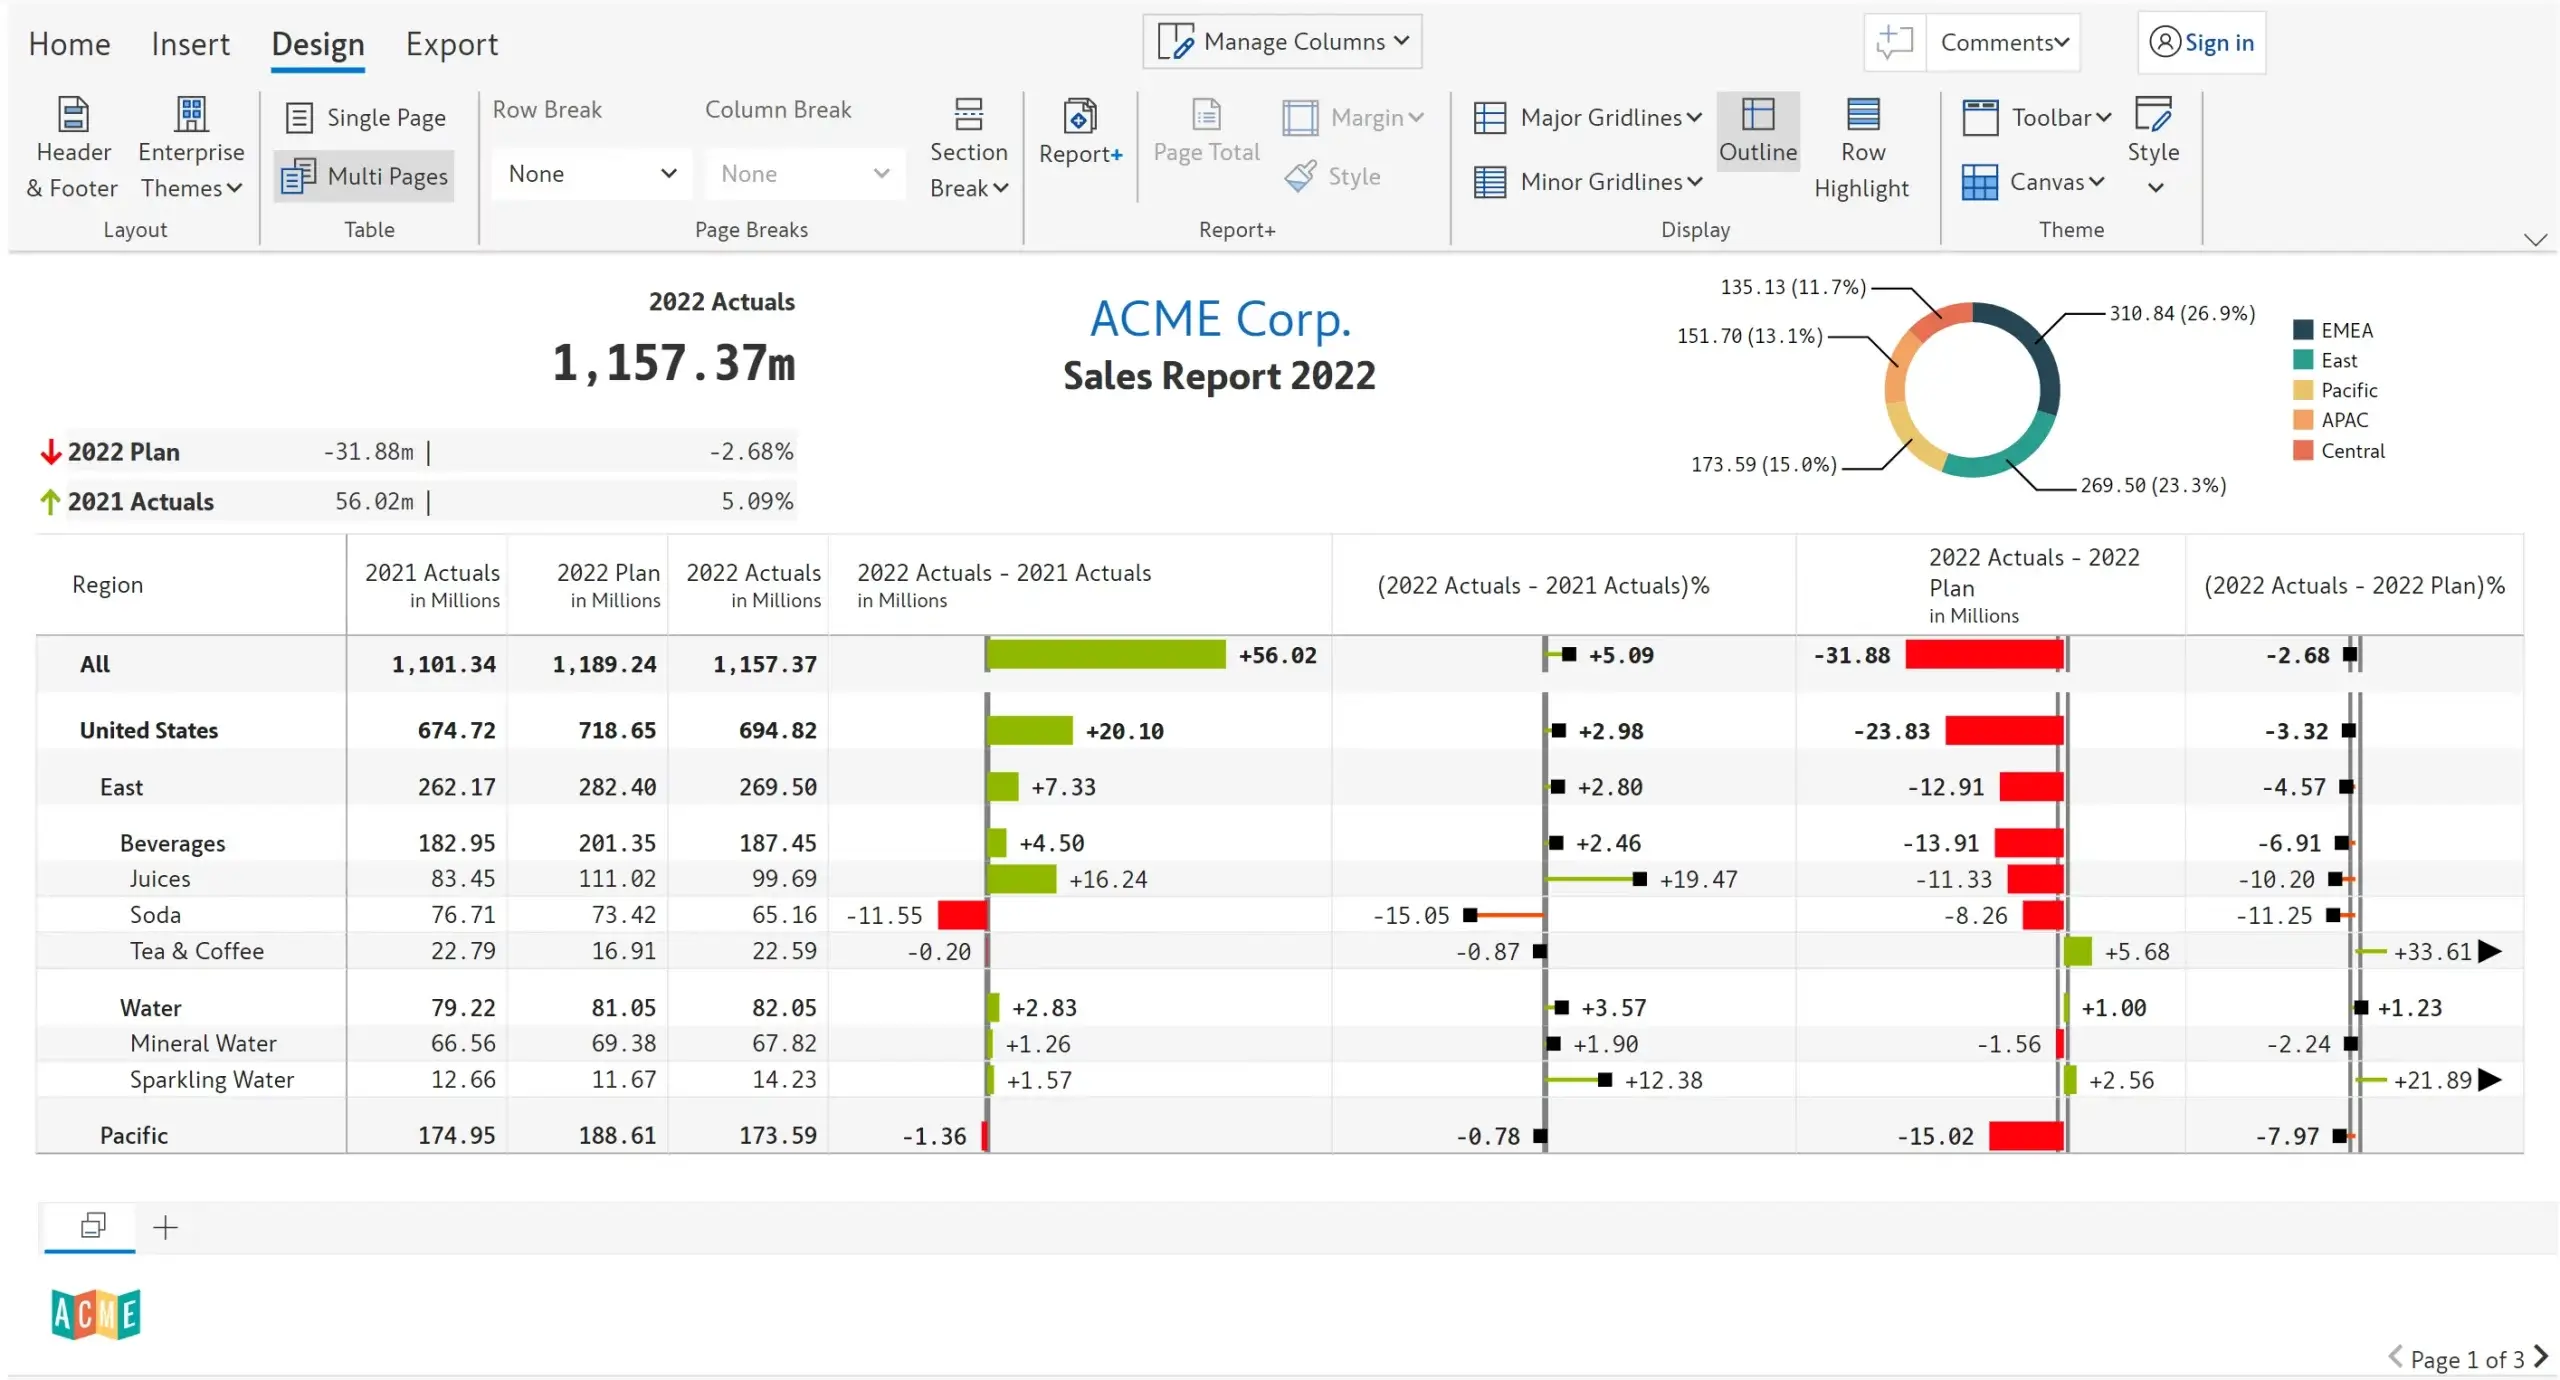
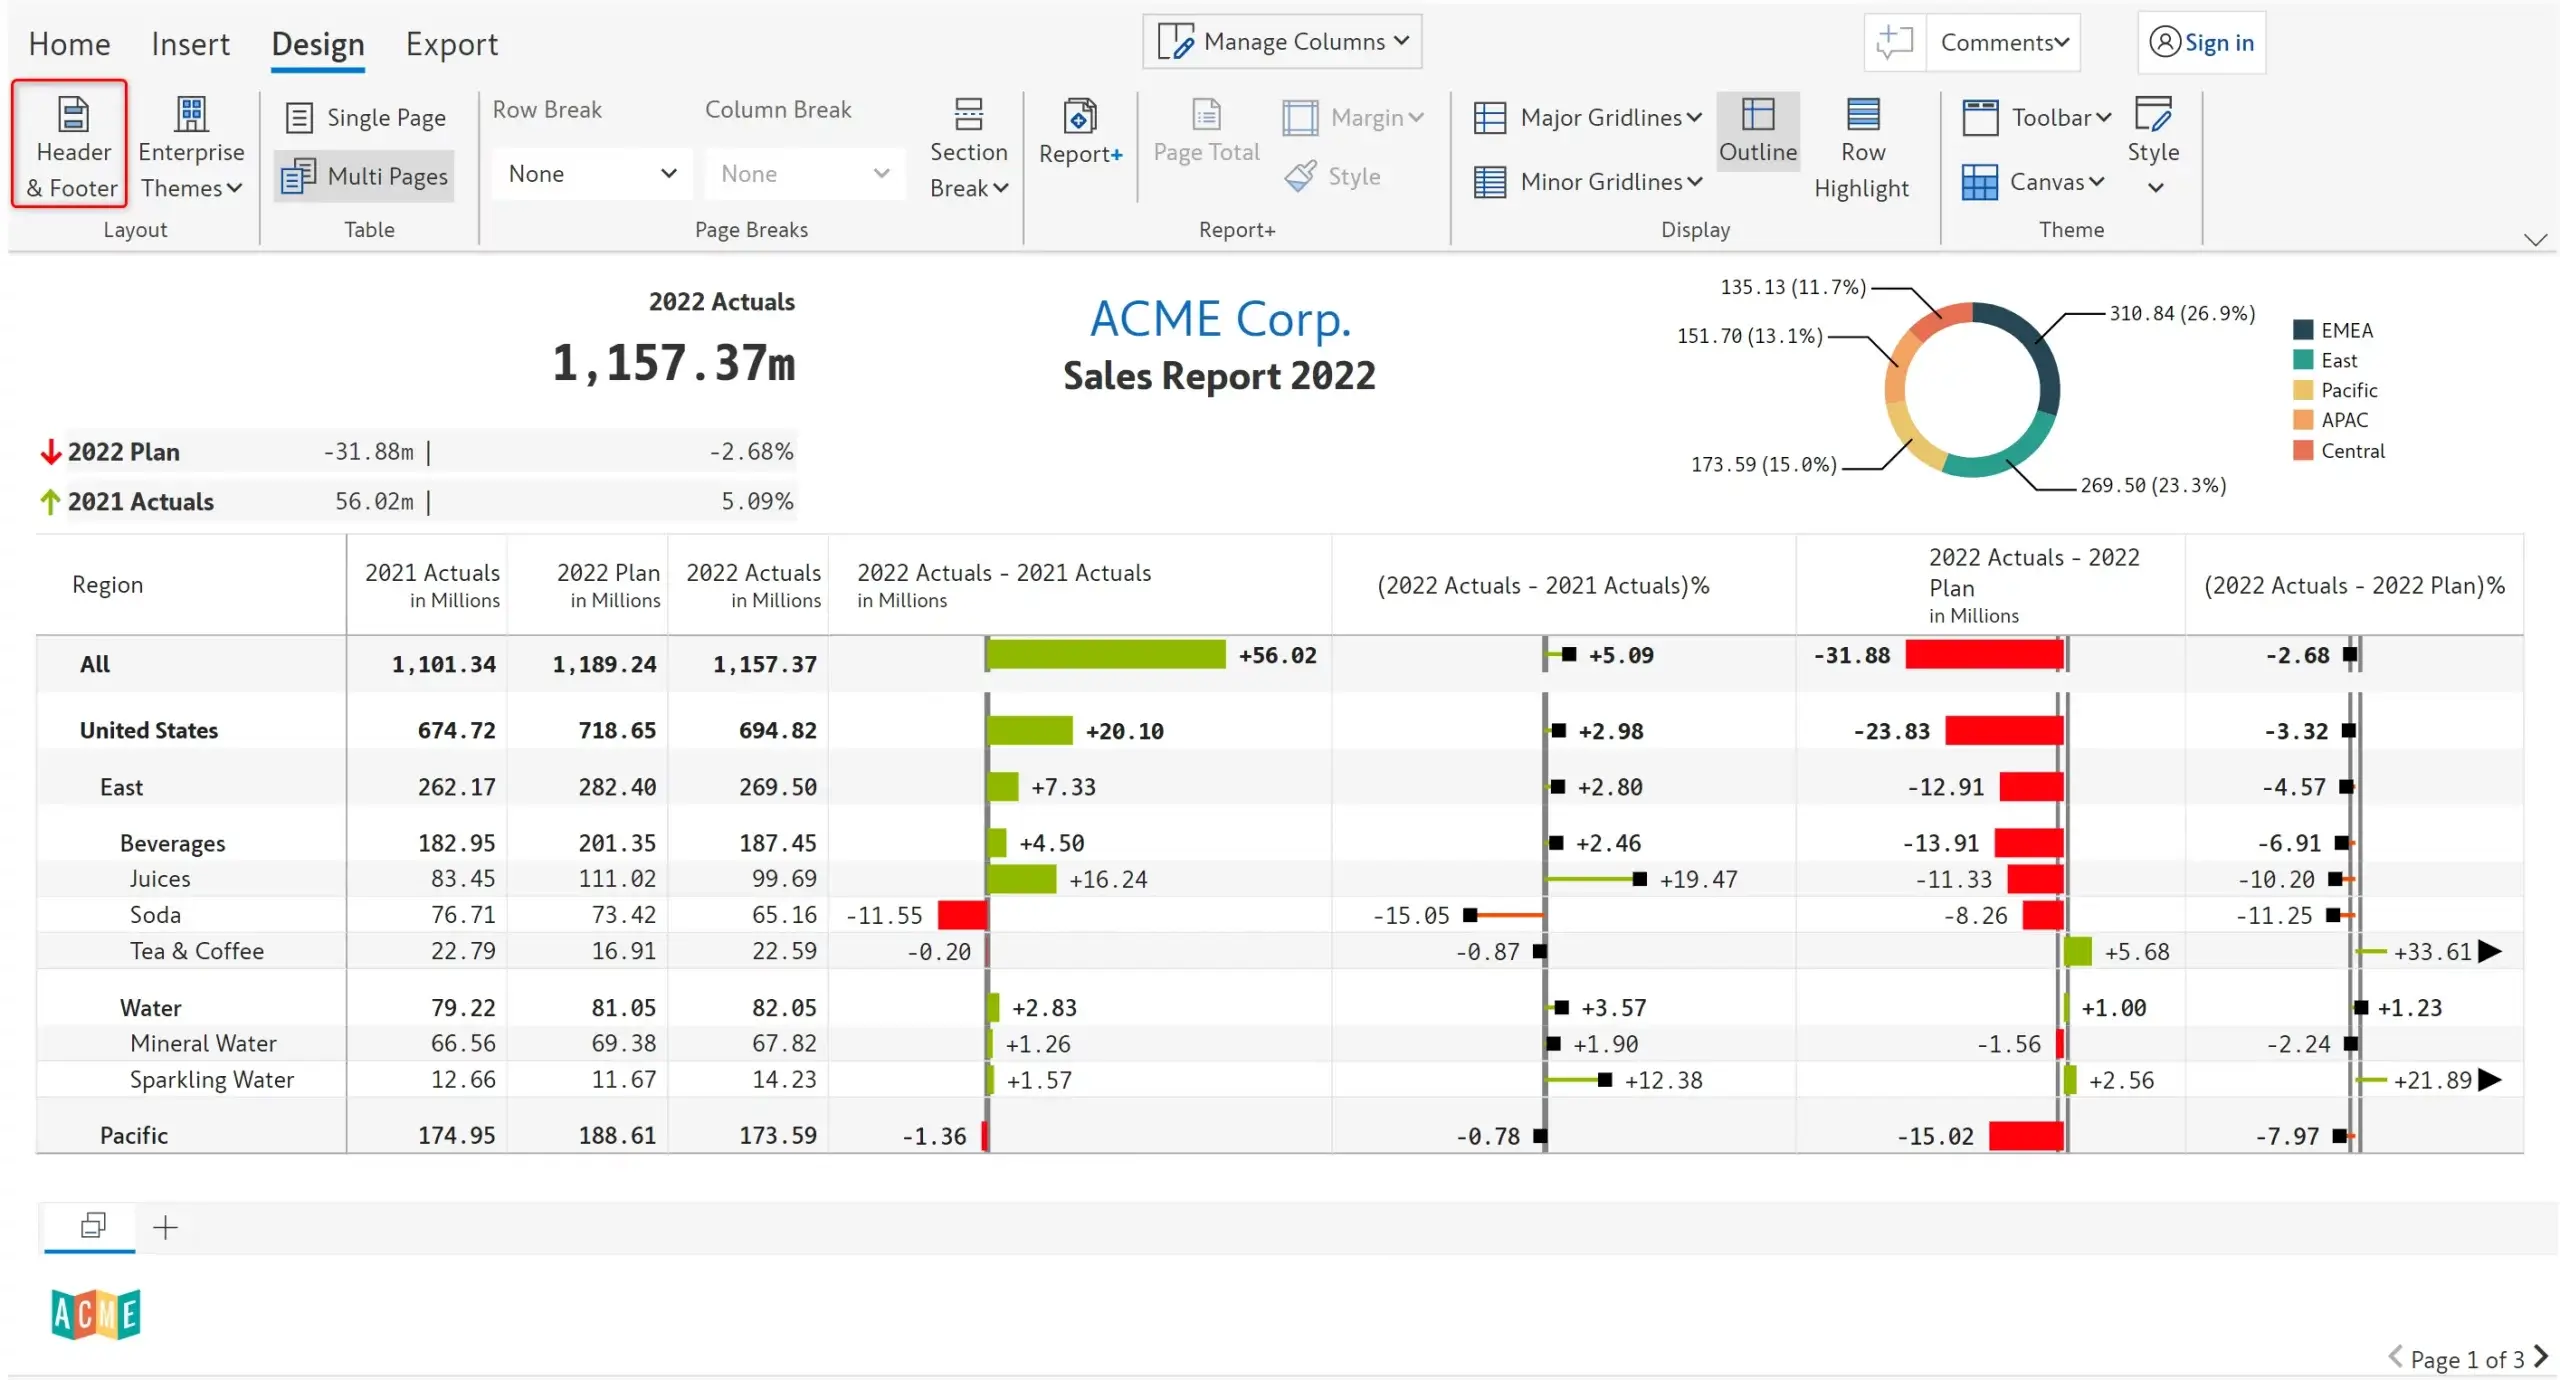
Configure report header and footer, insert logos and KPI cards; choose from preset header & footer layouts
Provide breaks in your report dynamically based on category values (e.g., each category starts in a new page)
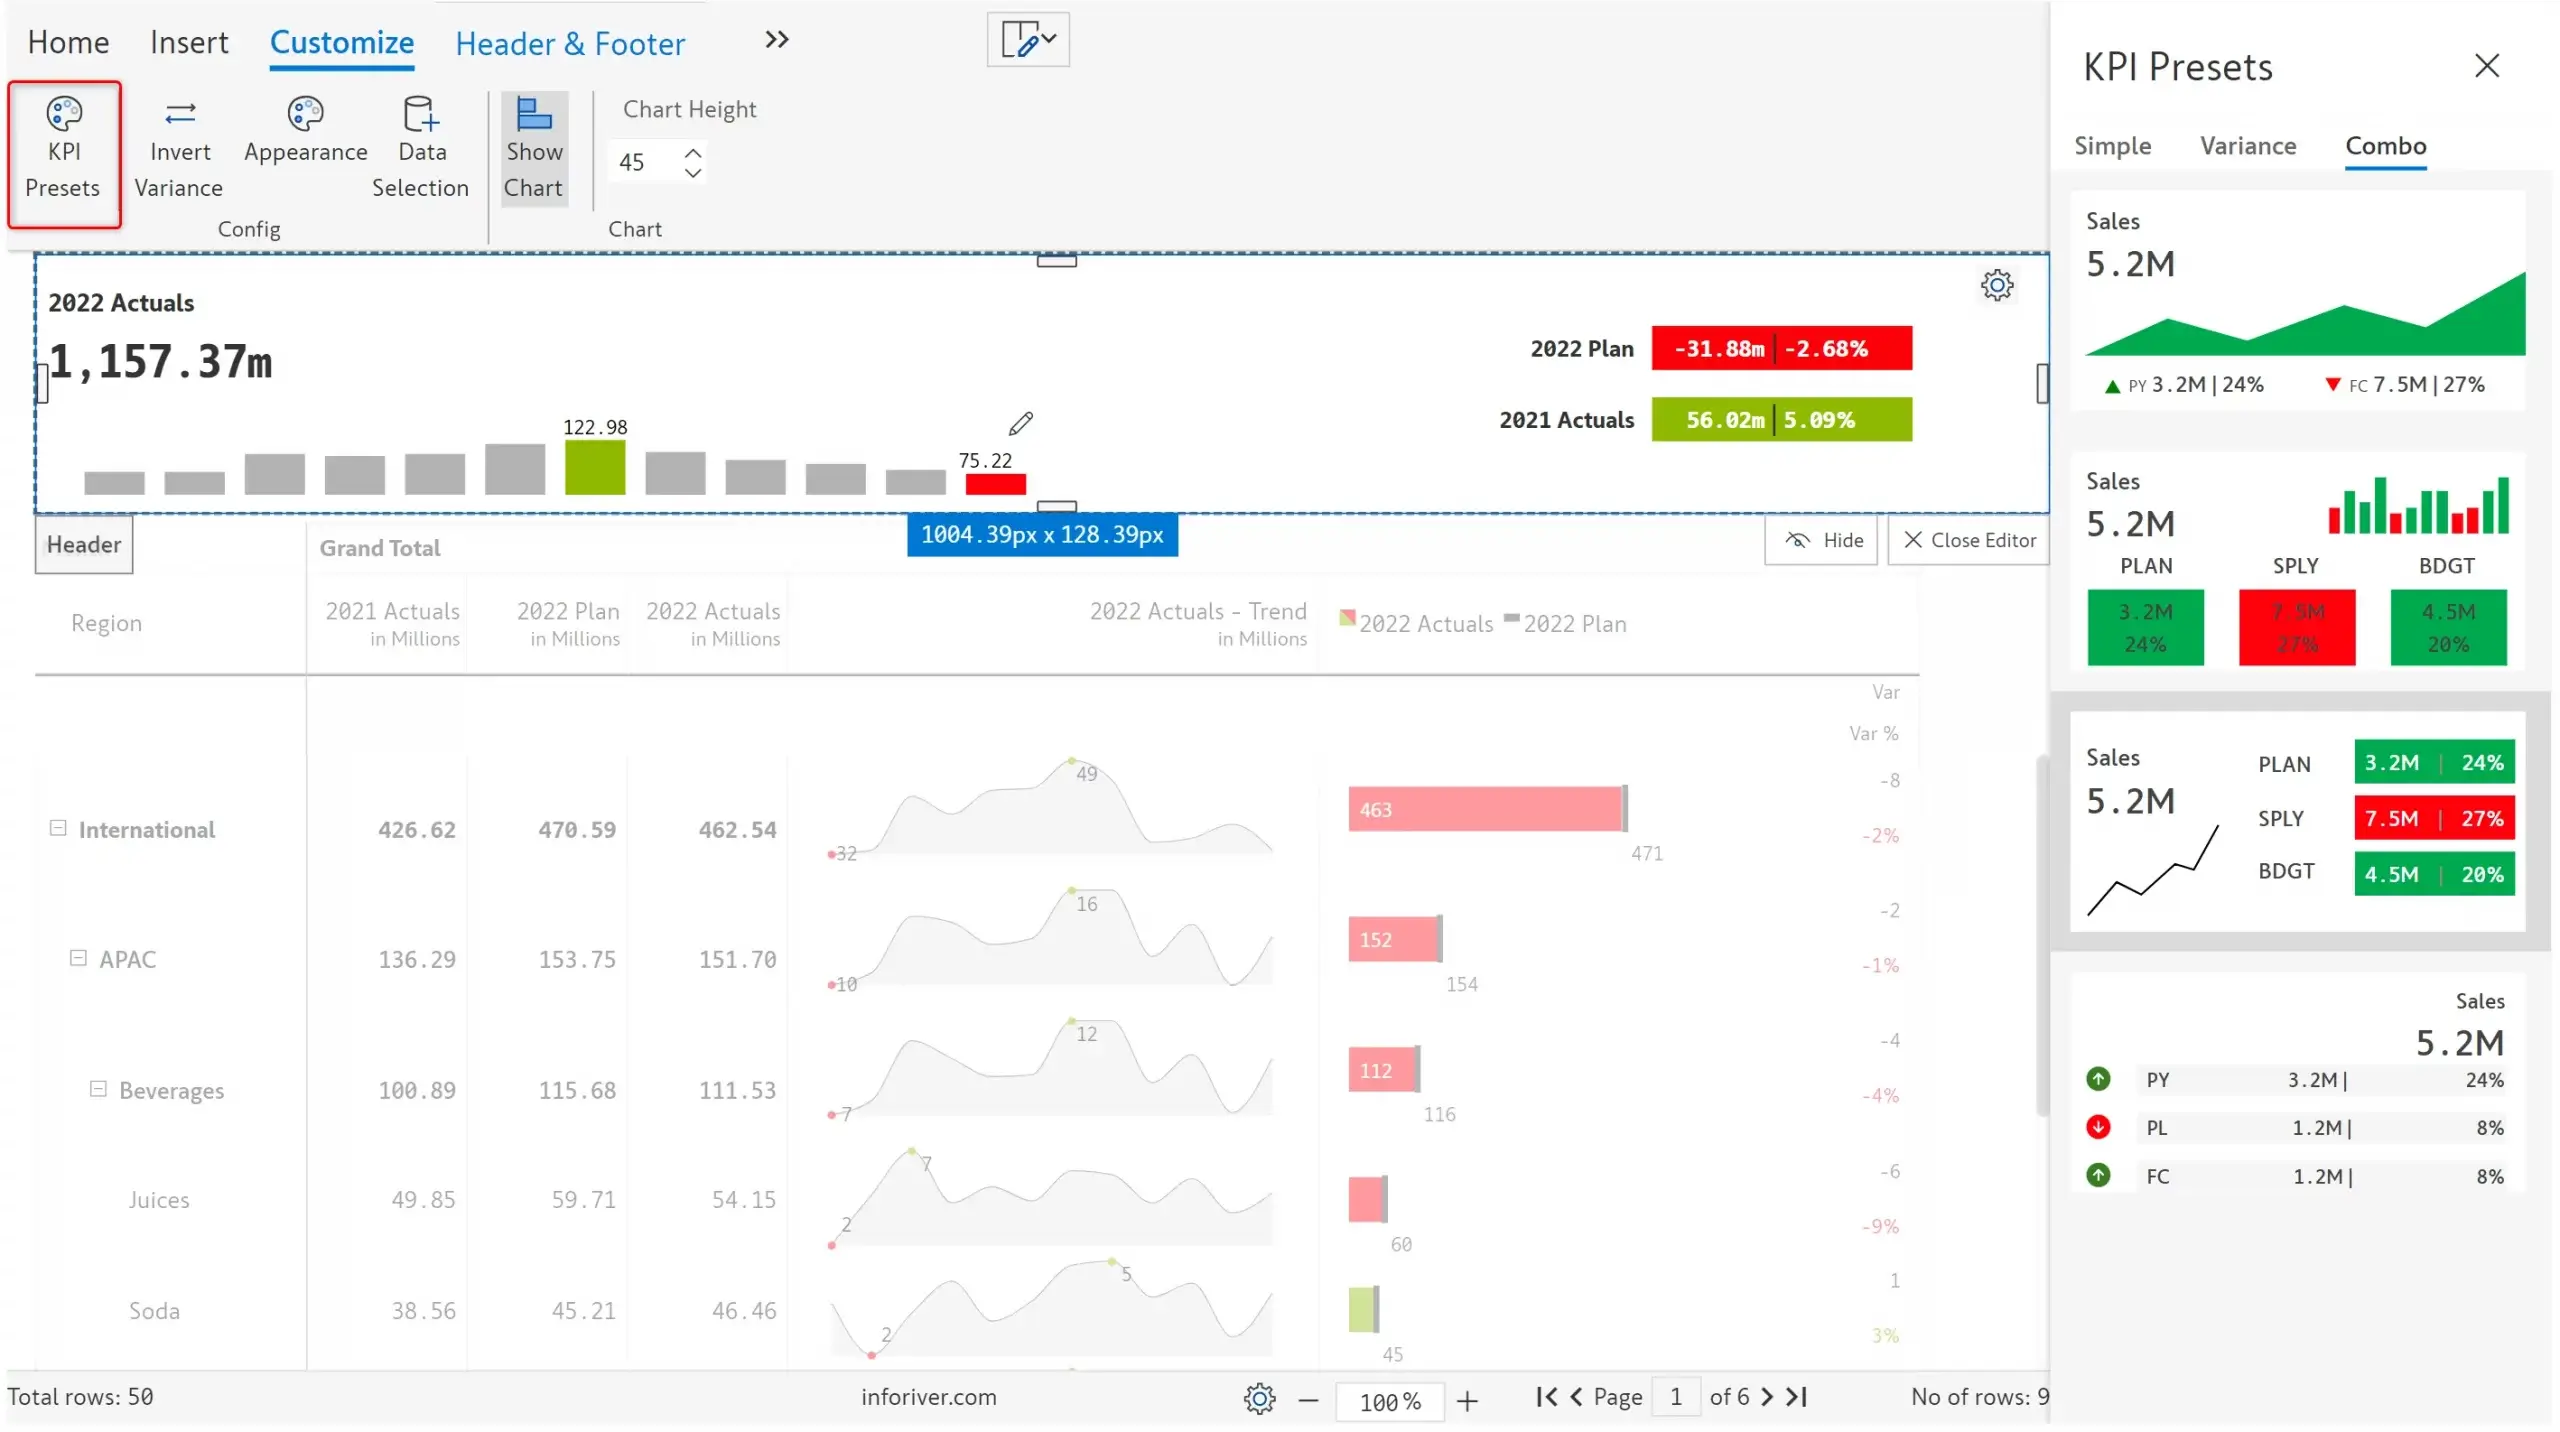
Insert pre-defined KPI cards with integrated trend and variance visualizations
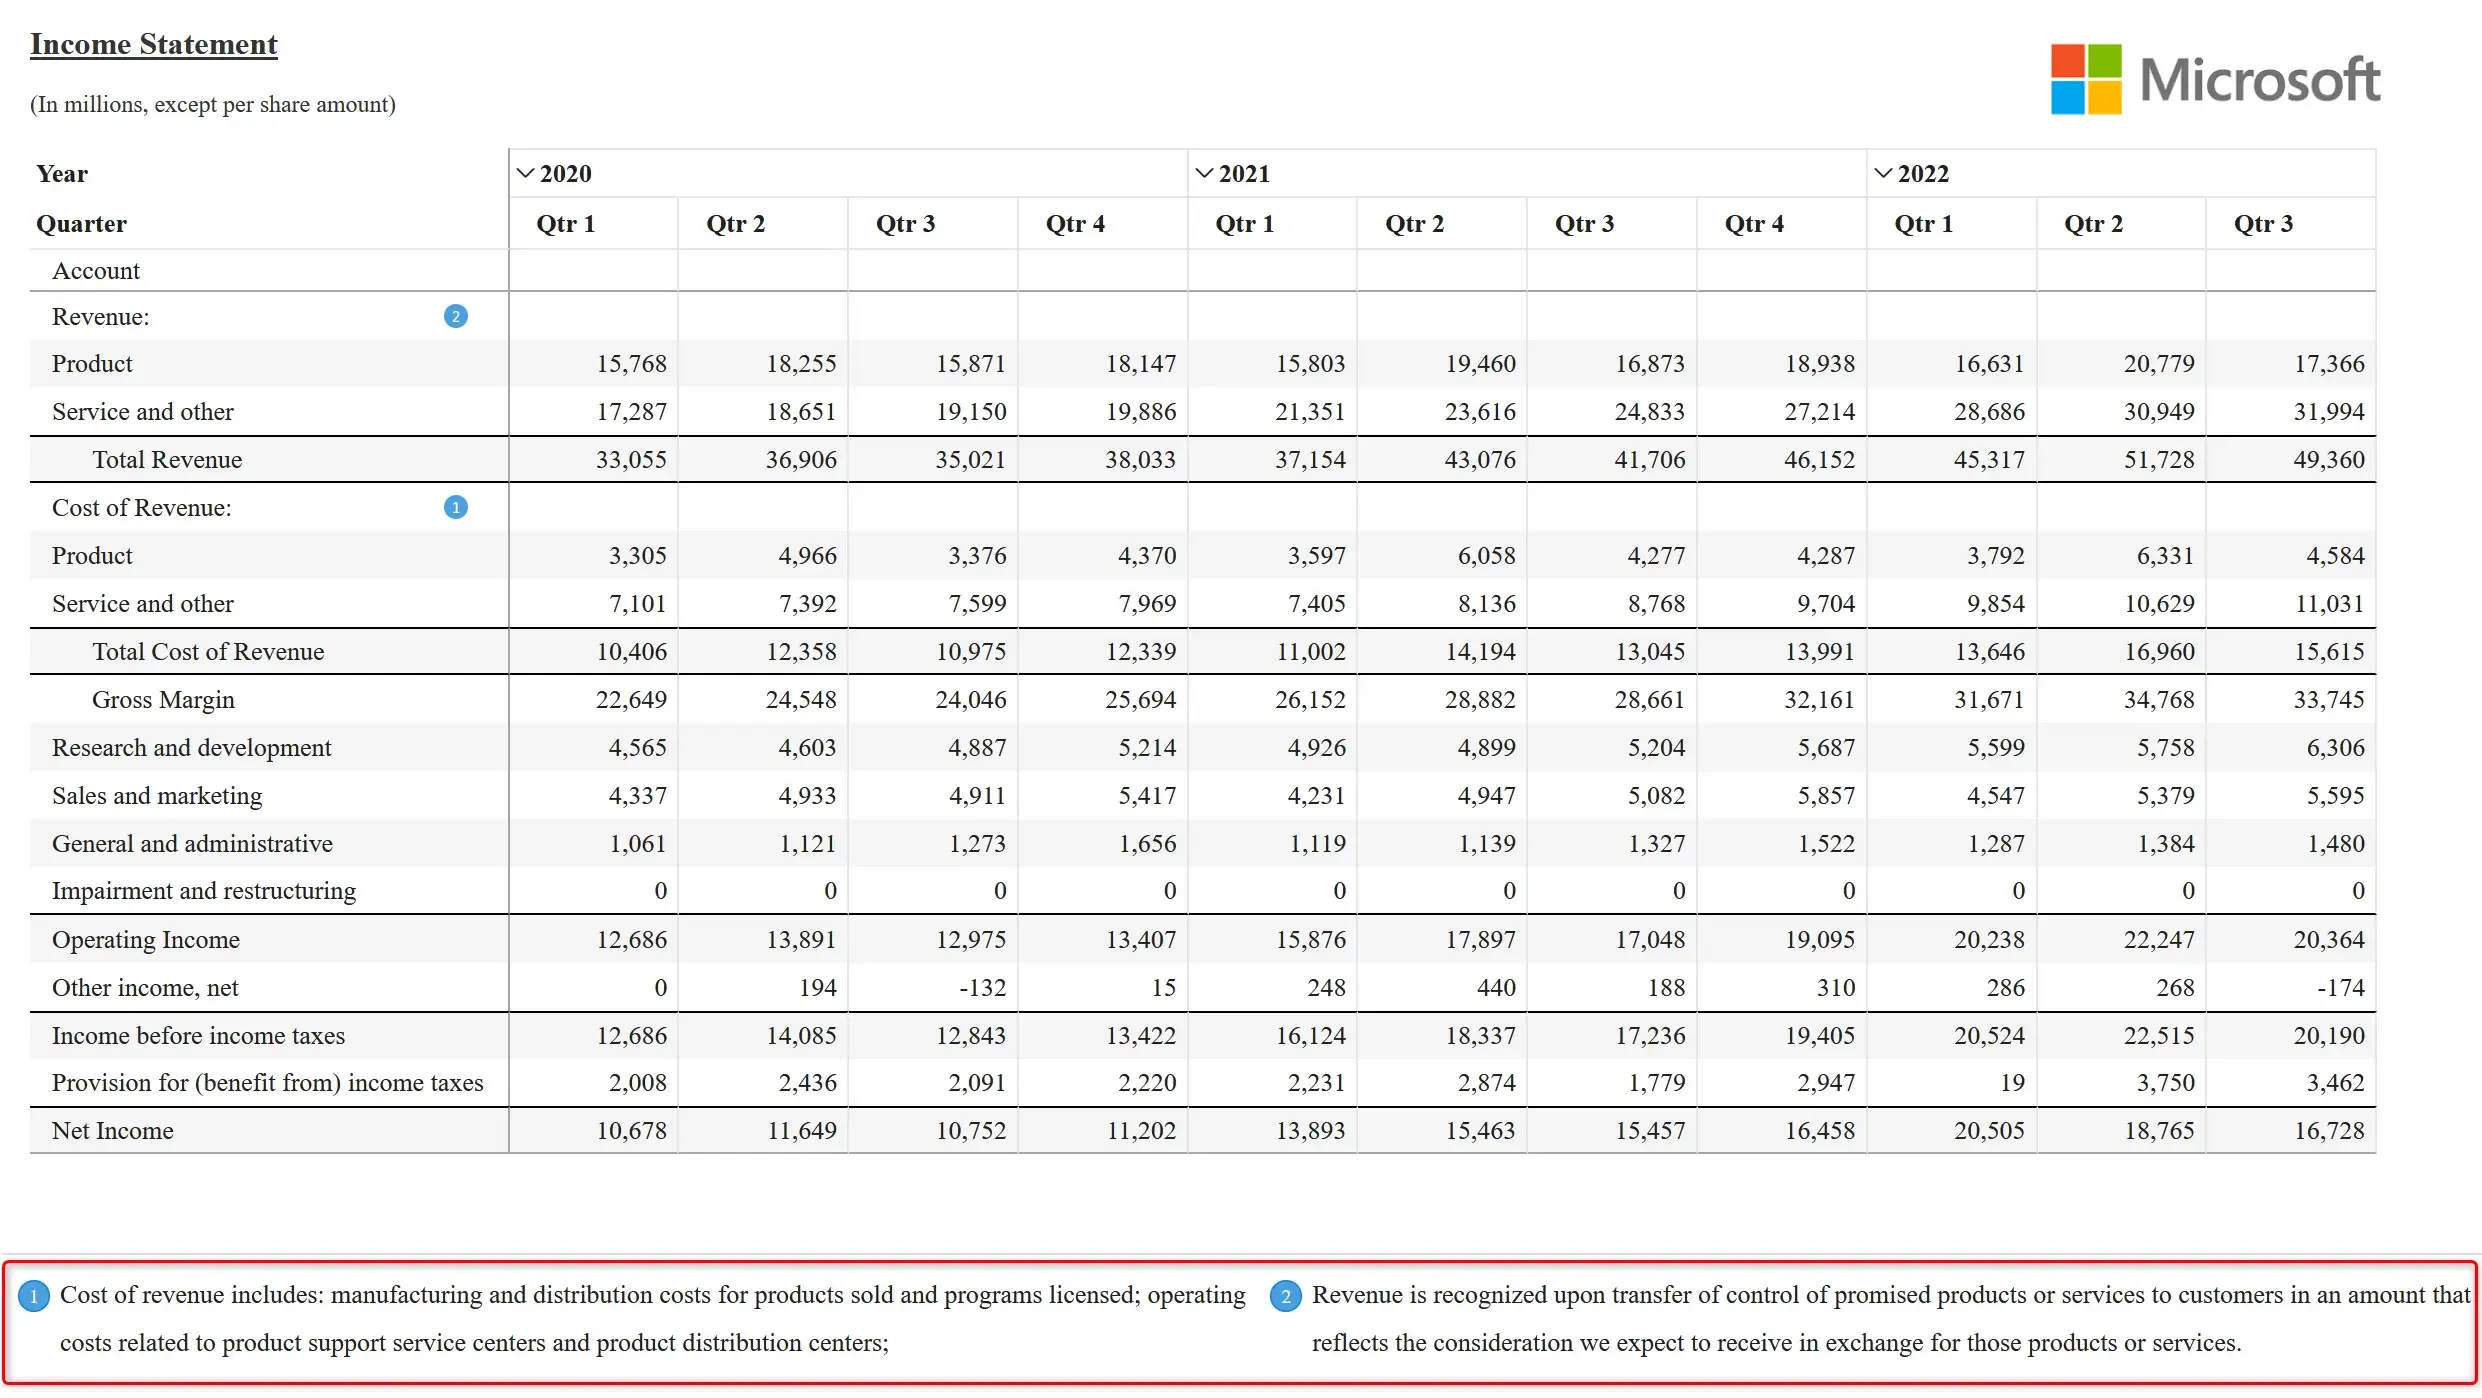
Add footnotes & annotations for specific accounts just like in the annual reports
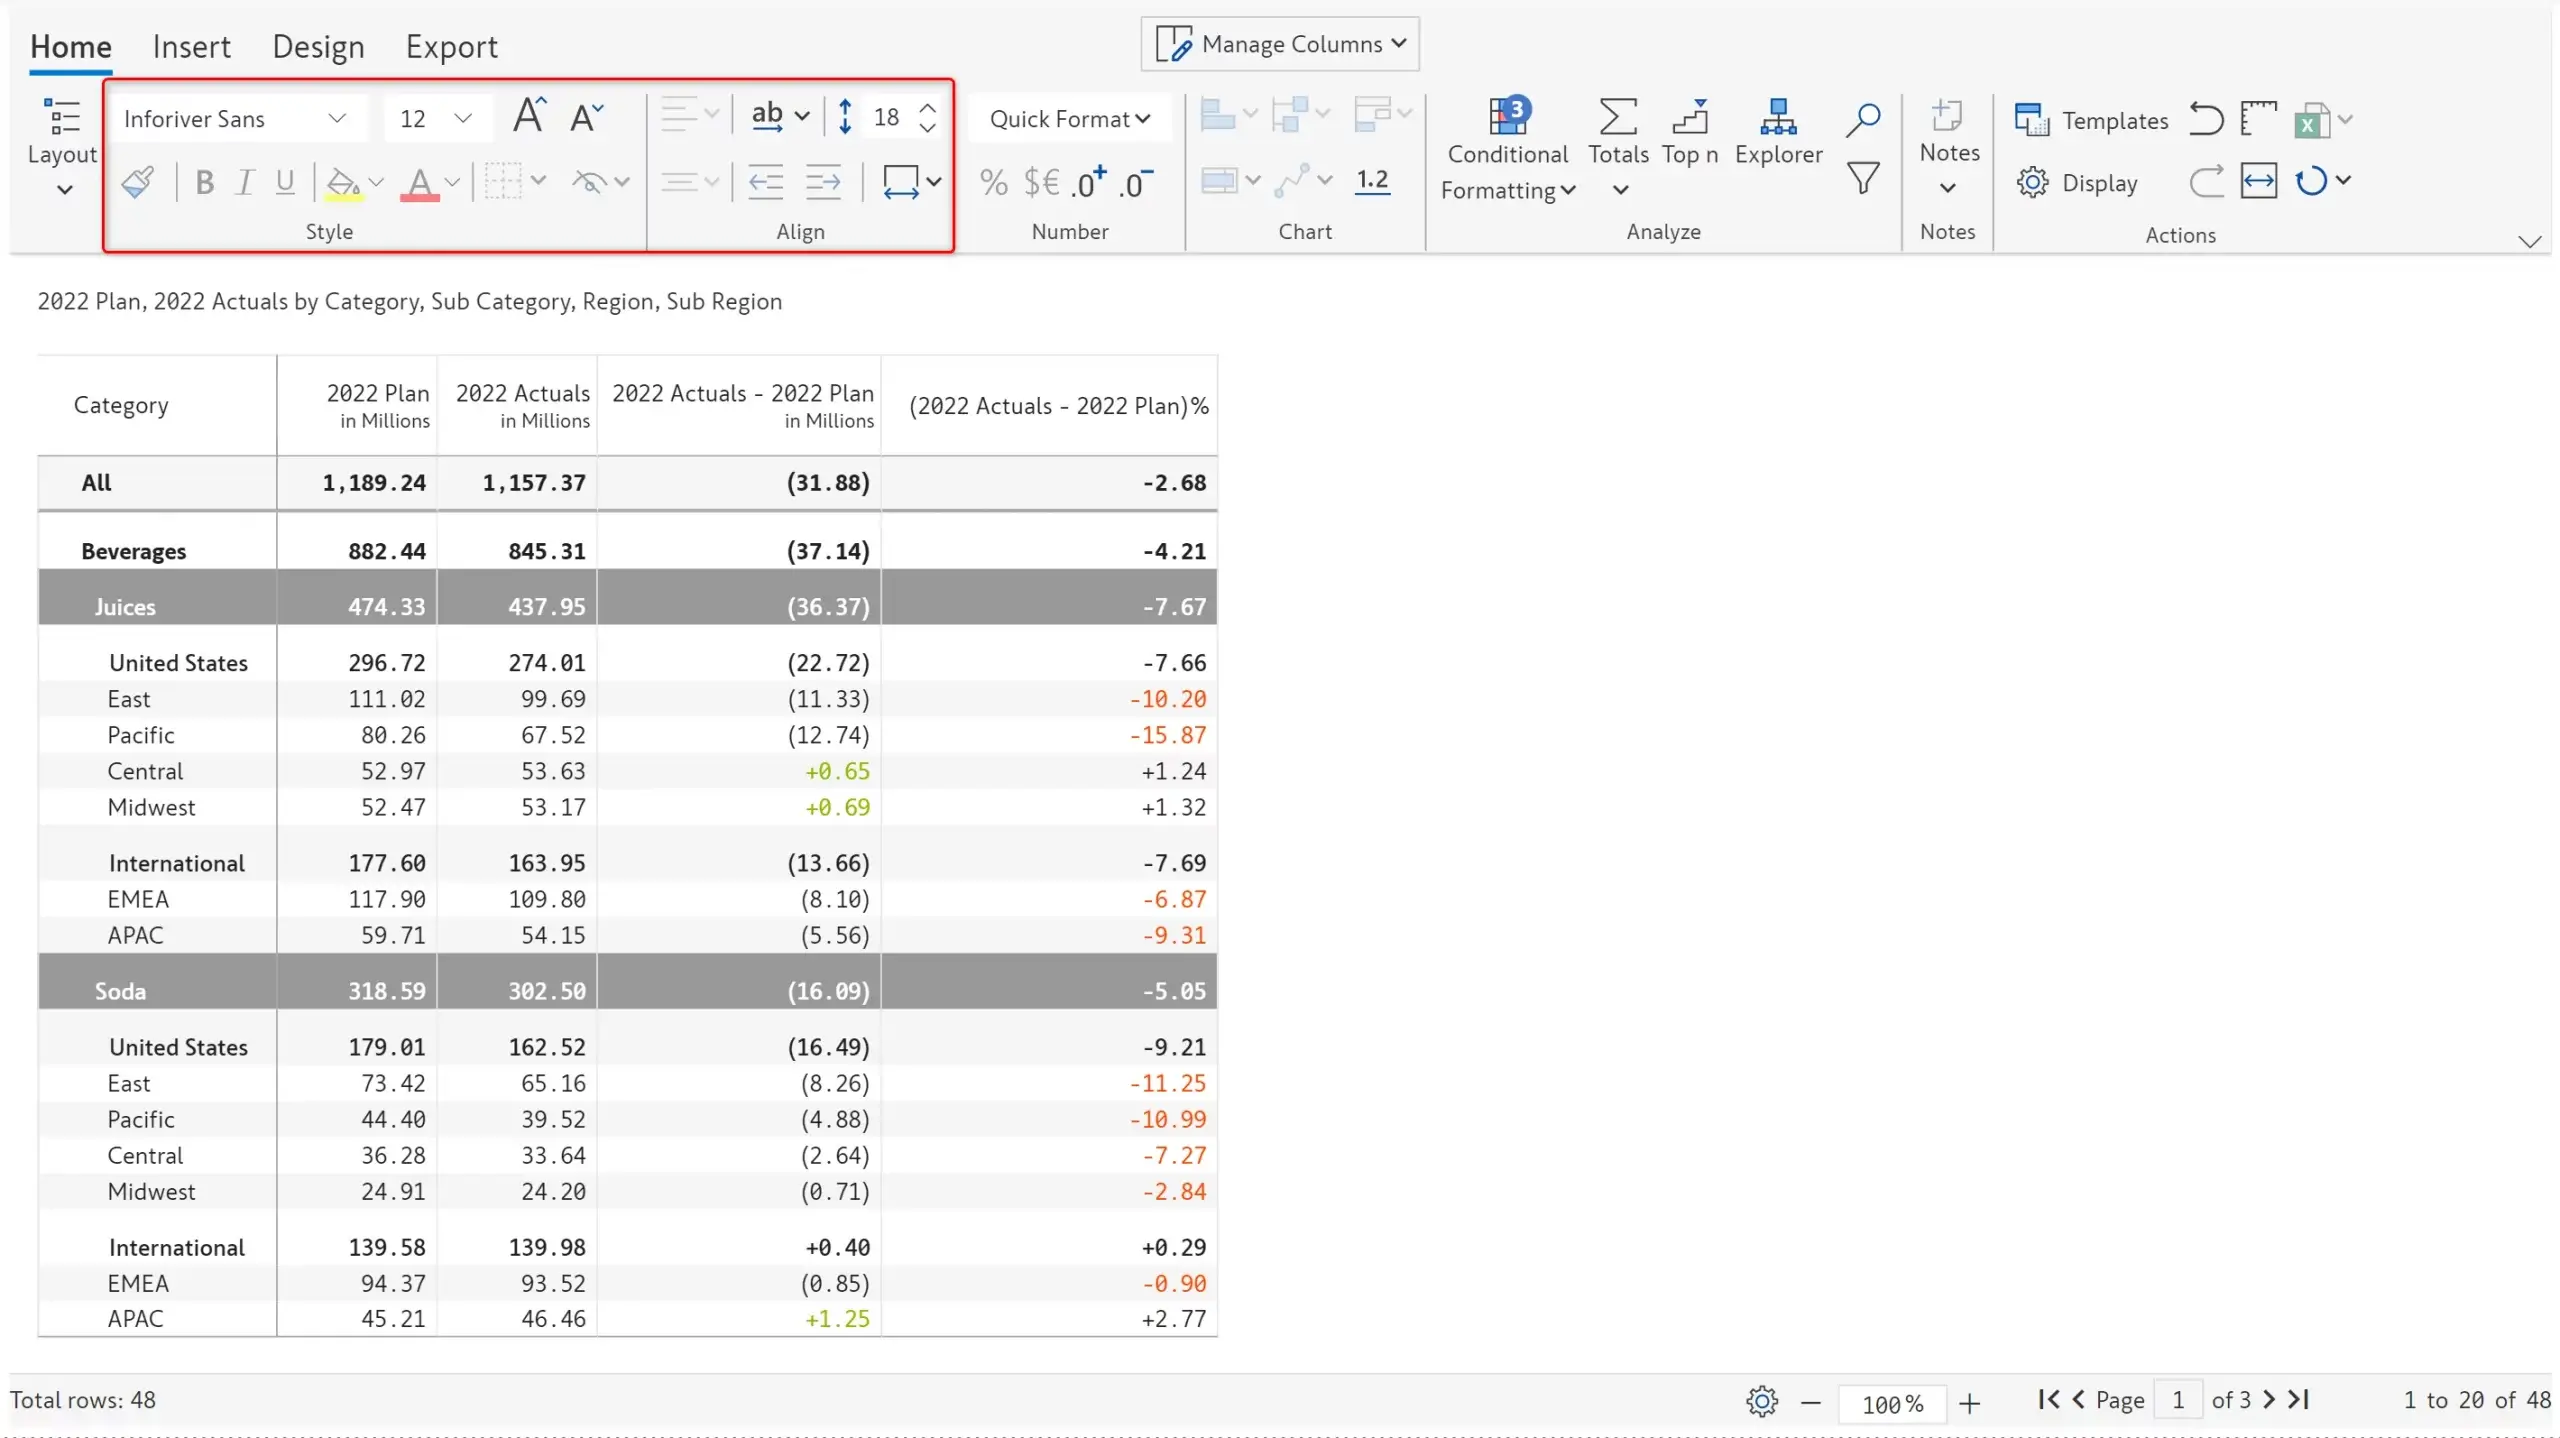
Apply borders, font & background colors at cell/row/column levels; align text, show/hide rows, resize rows, and more
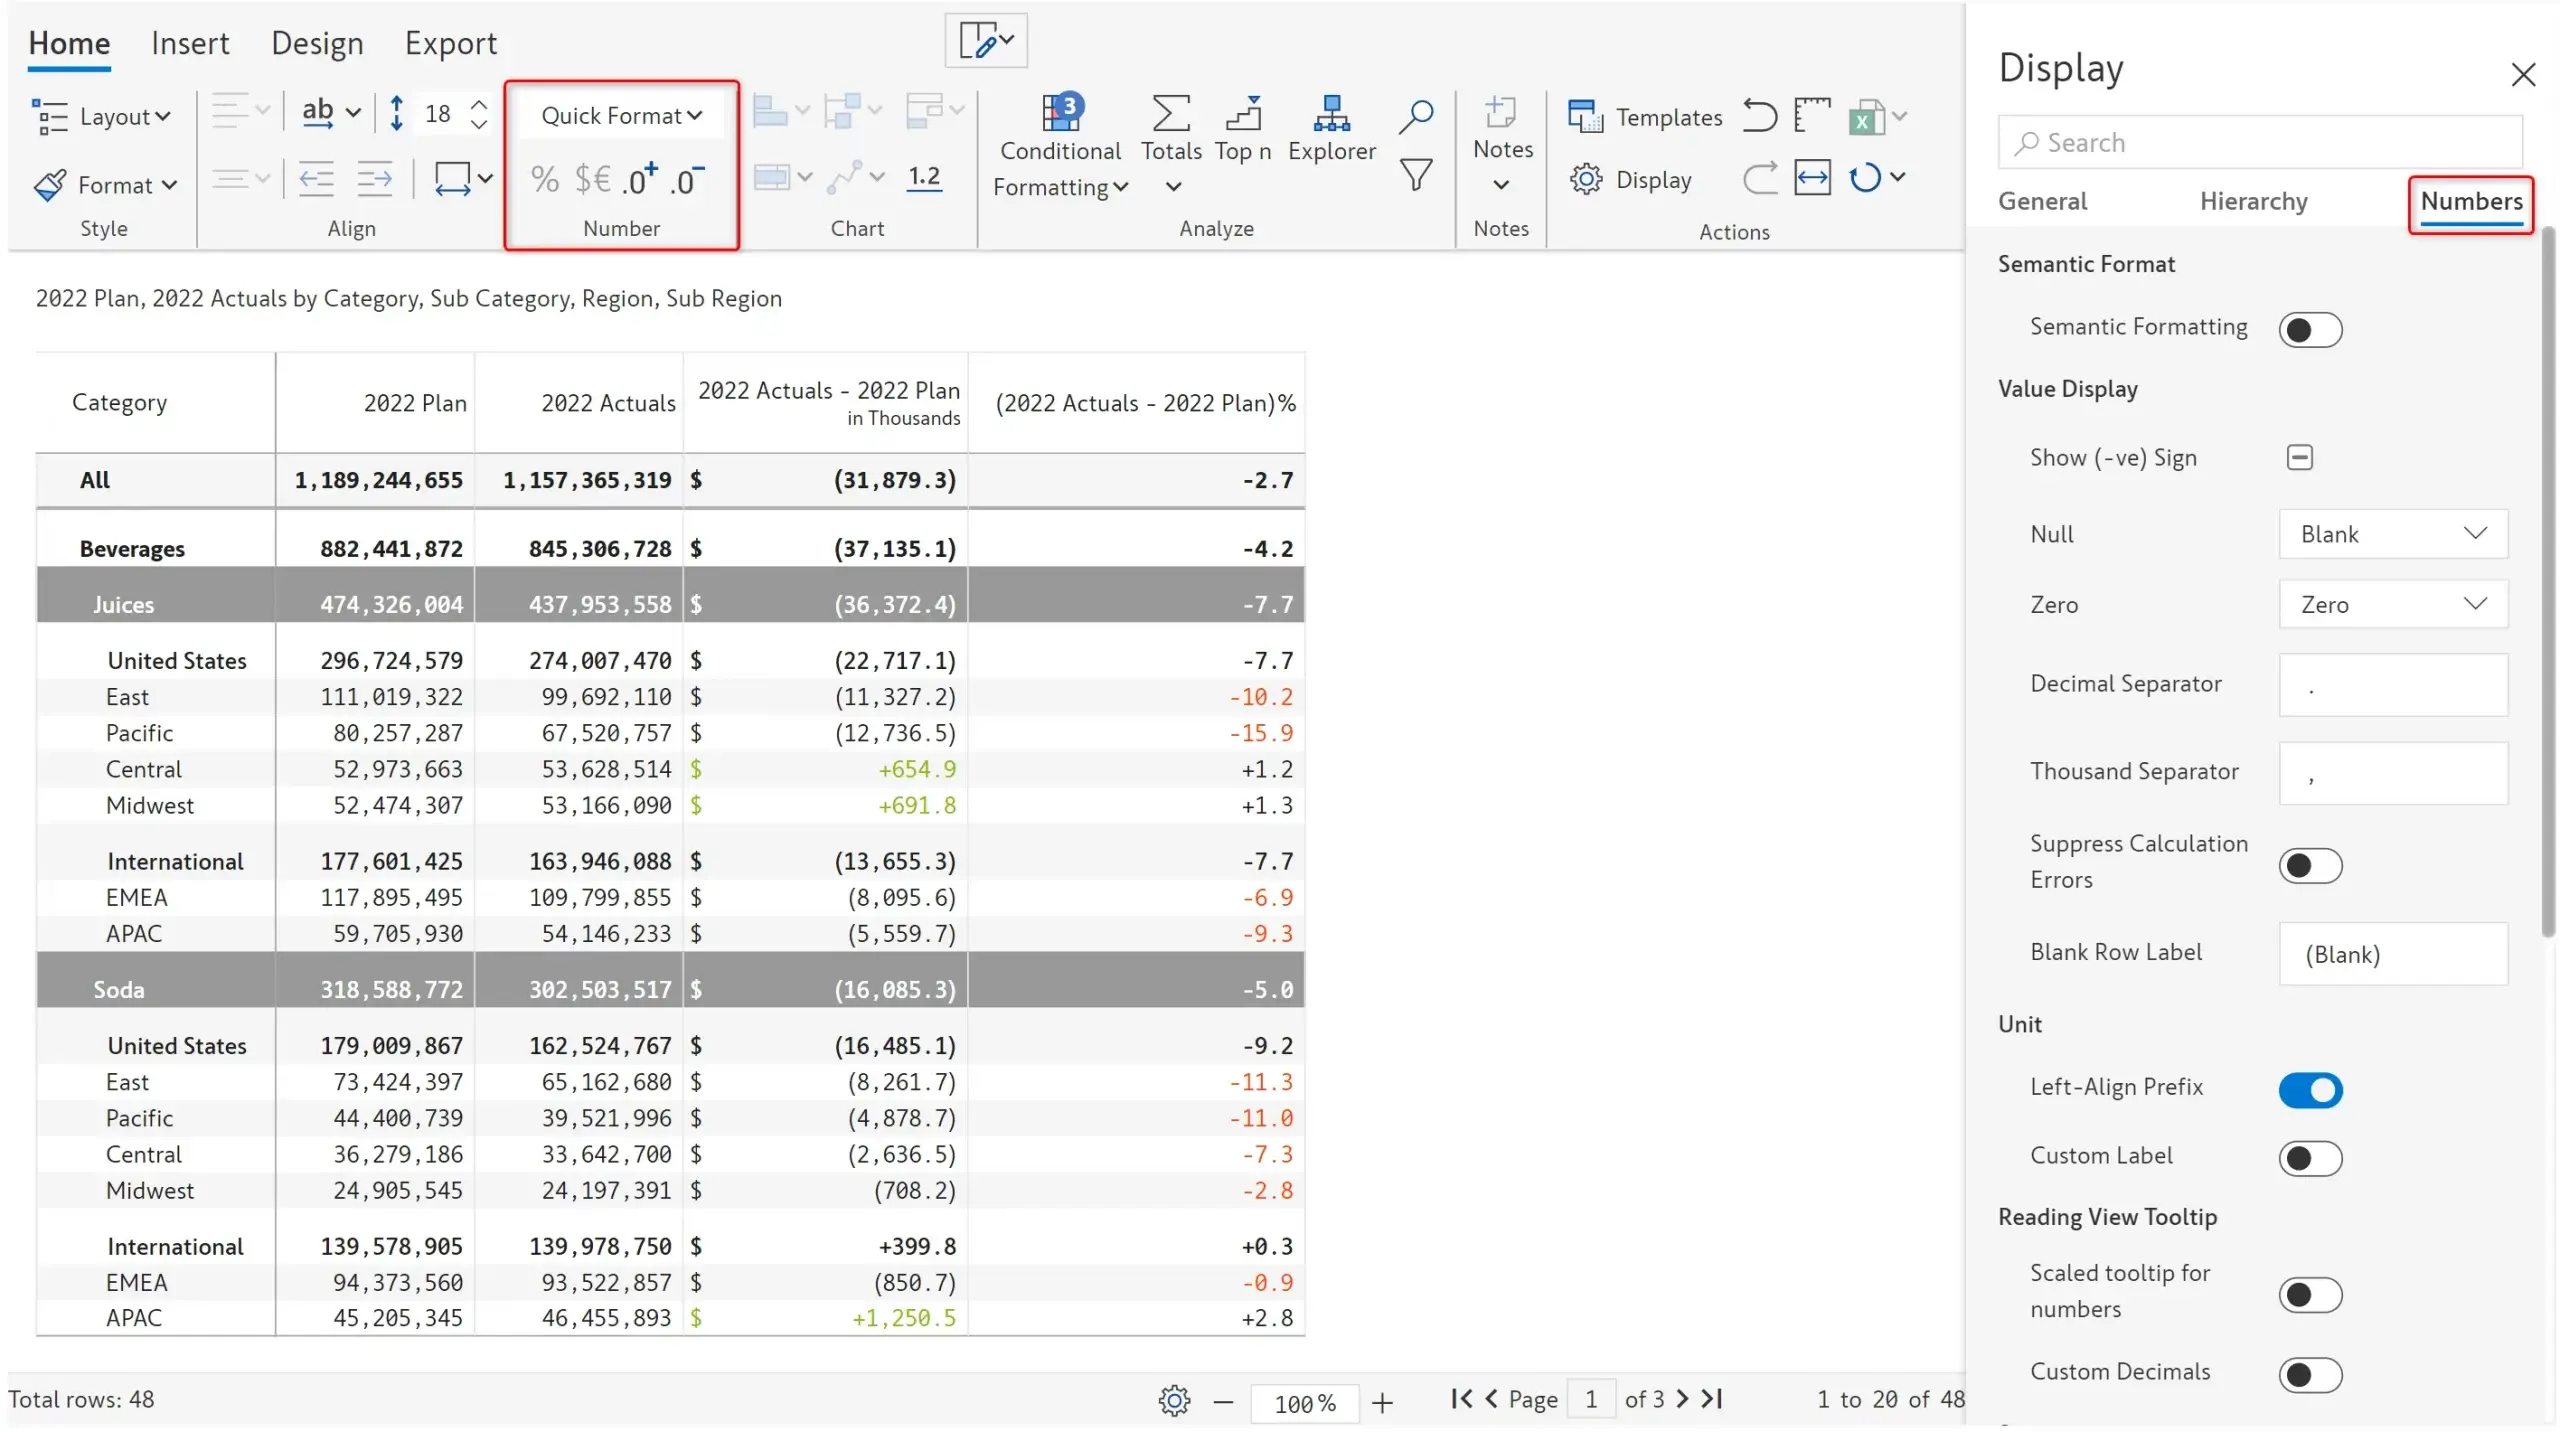
Format numbers, manage decimals, prefix and suffix at the table, measure or cell levels
Toggle between any of the nine (9) business templates, in a single click
Leverage excel-like layouts such as classic, stepped, outline and more; show measures on rows or columns using the pivot mode
Create reports with First-Previous-Next-Last navigation, with the ability to insert page & section breaks
Configure report header and footer, insert logos and KPI cards; choose from preset header & footer layouts
Insert pre-defined KPI cards with integrated trend and variance visualizations
Provide breaks in your report dynamically based on category values (e.g., each category starts in a new page)
Add footnotes & annotations for specific accounts just like in the annual reports
Apply borders, font & background colors at cell/row/column levels; align text, show/hide rows, resize rows, and more
Format numbers, manage decimals, prefix and suffix at the table, measure or cell levels

Inforiver helps enterprises consolidate planning, reporting & analytics on a single platform (Power BI). The no-code, self-service award-winning platform has been recognized as the industry’s best and is adopted by many Fortune 100 firms.
Inforiver is a product of Lumel, the #1 Power BI AppSource Partner. The firm serves over 3,000 customers worldwide through its portfolio of products offered under the brands Inforiver, EDITable, ValQ, and xViz.