
Upcoming webinar on 'Inforiver Charts : The fastest way to deliver stories in Power BI', Aug 29th , Monday, 10.30 AM CST. Register Now
Upcoming webinar on 'Inforiver Charts : The fastest way to deliver stories in Power BI', Aug 29th , Monday, 10.30 AM CST. Register Now


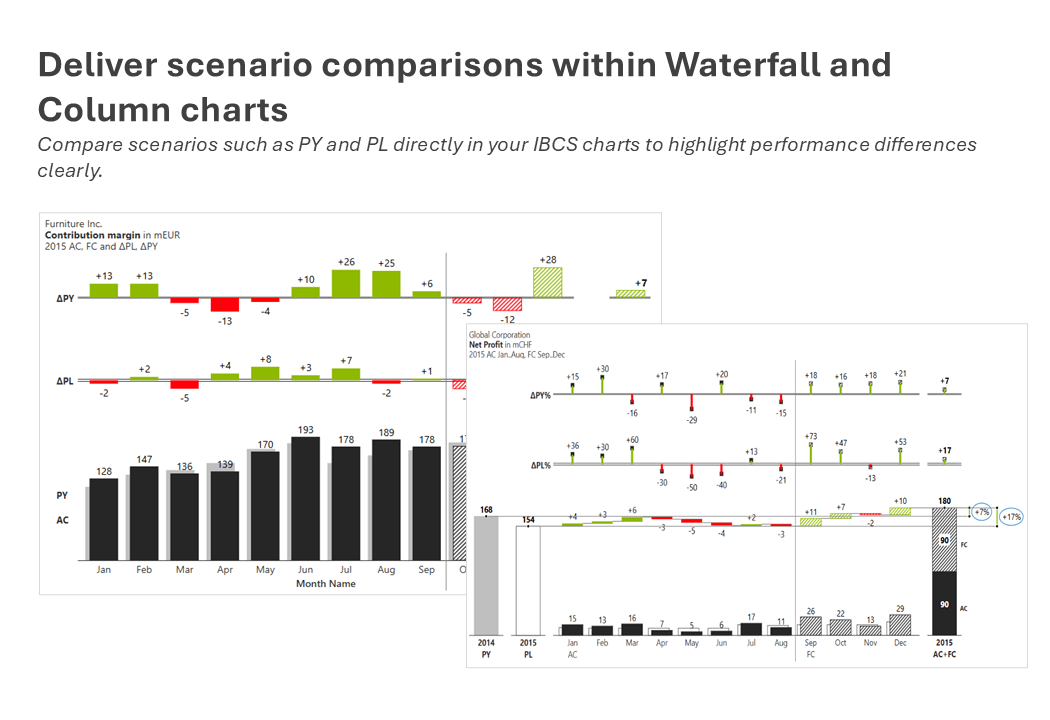
Inforiver perfectly applies IBCS notation to its interactive and consumer-centric software. It feels like coming home.
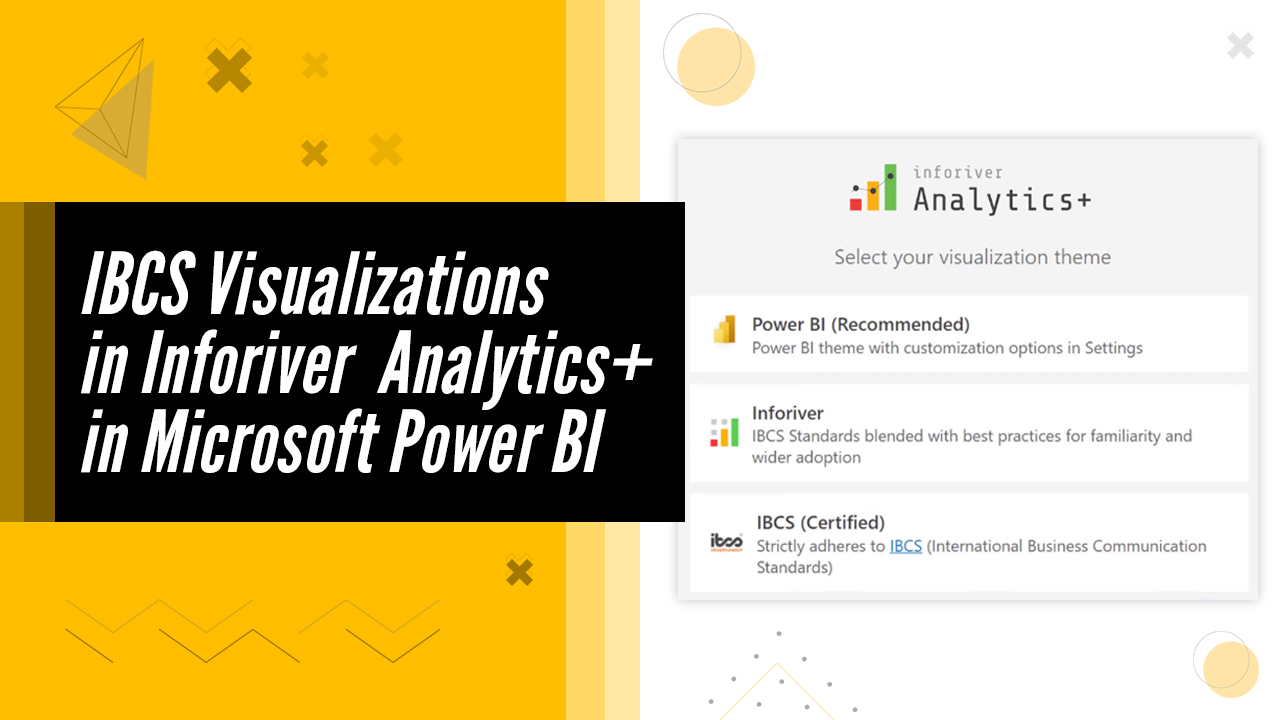
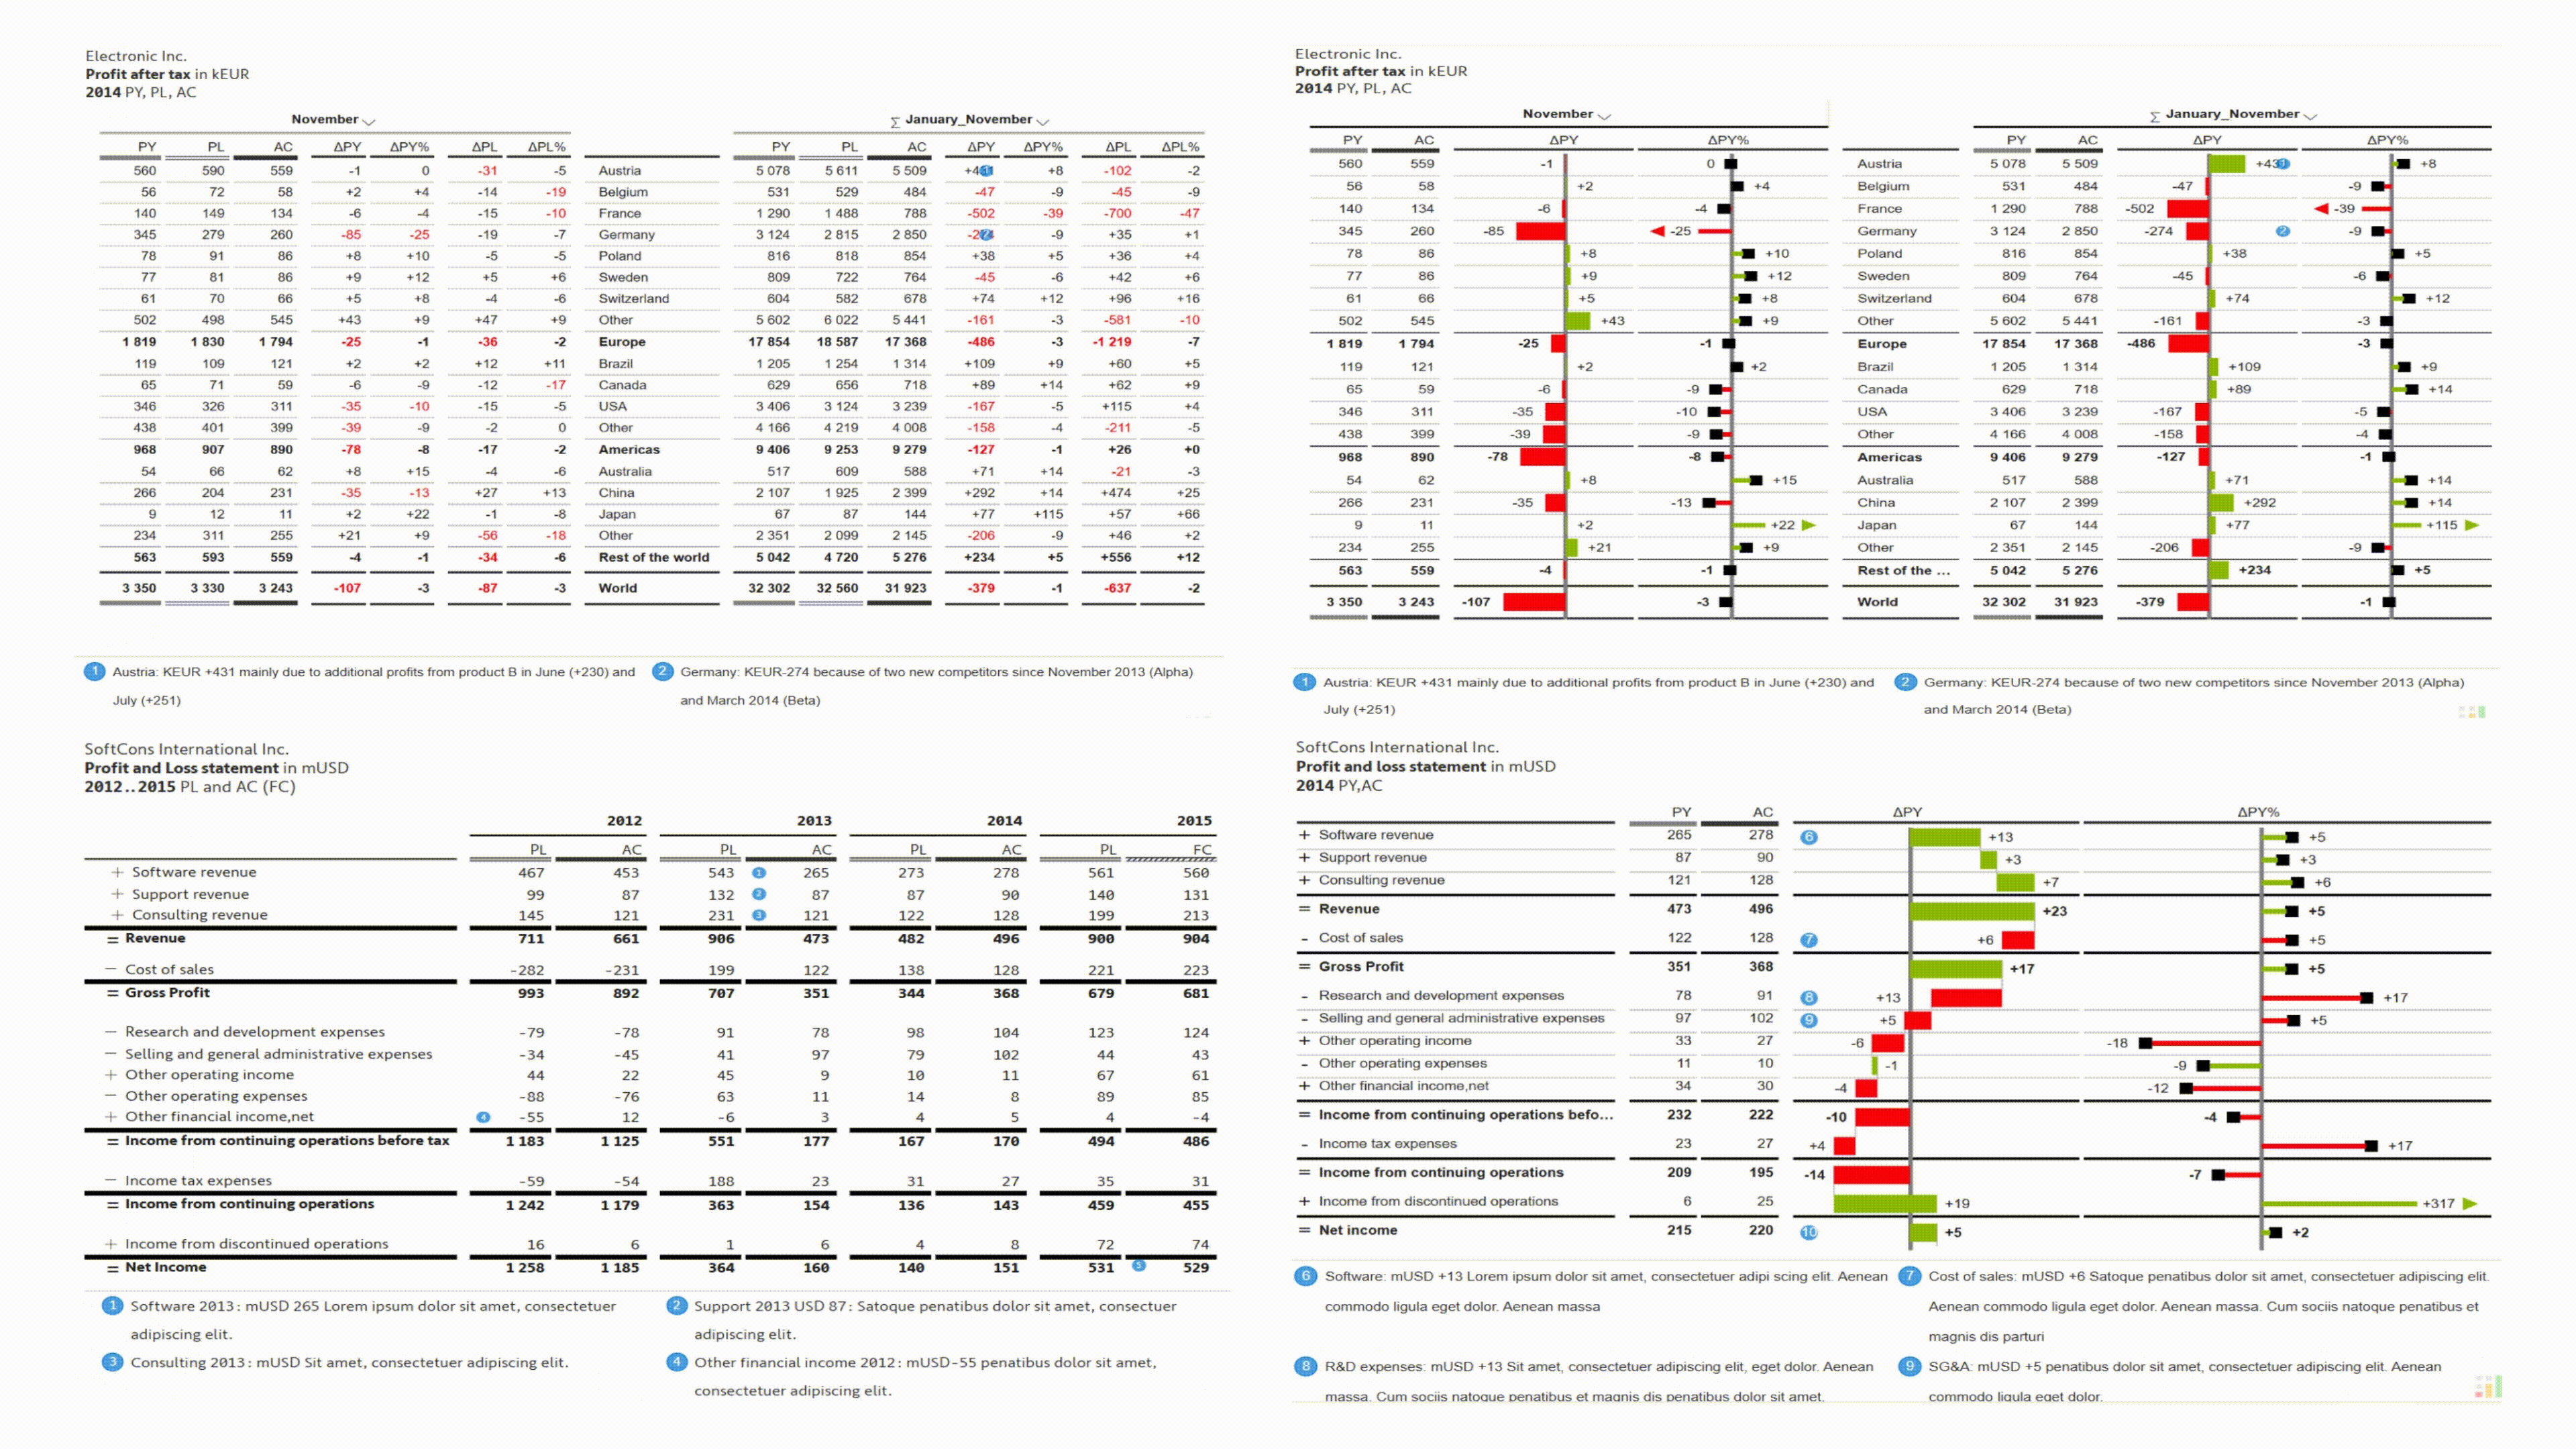
Experience the fastest way to deliver insightful IBCS charts using Inforiver Analytics+
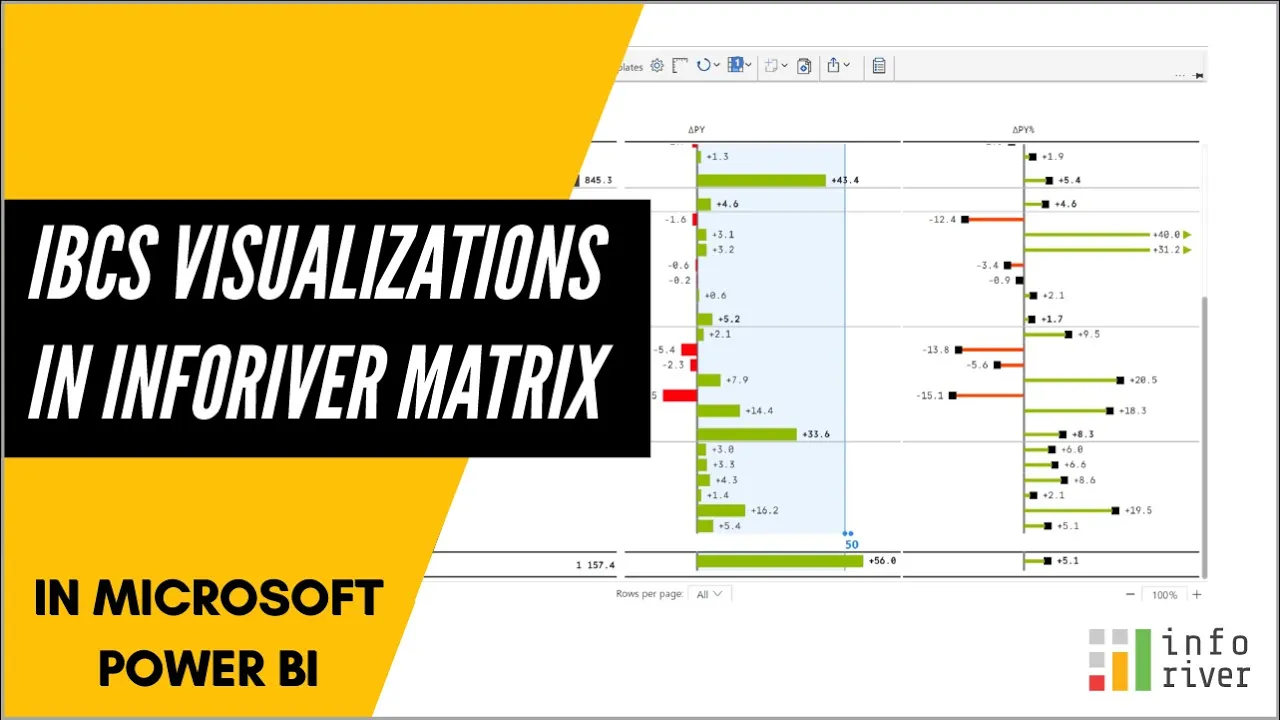
Experience the fastest way to deliver insightful visualizations following IBCS standards using Inforiver Matrix.


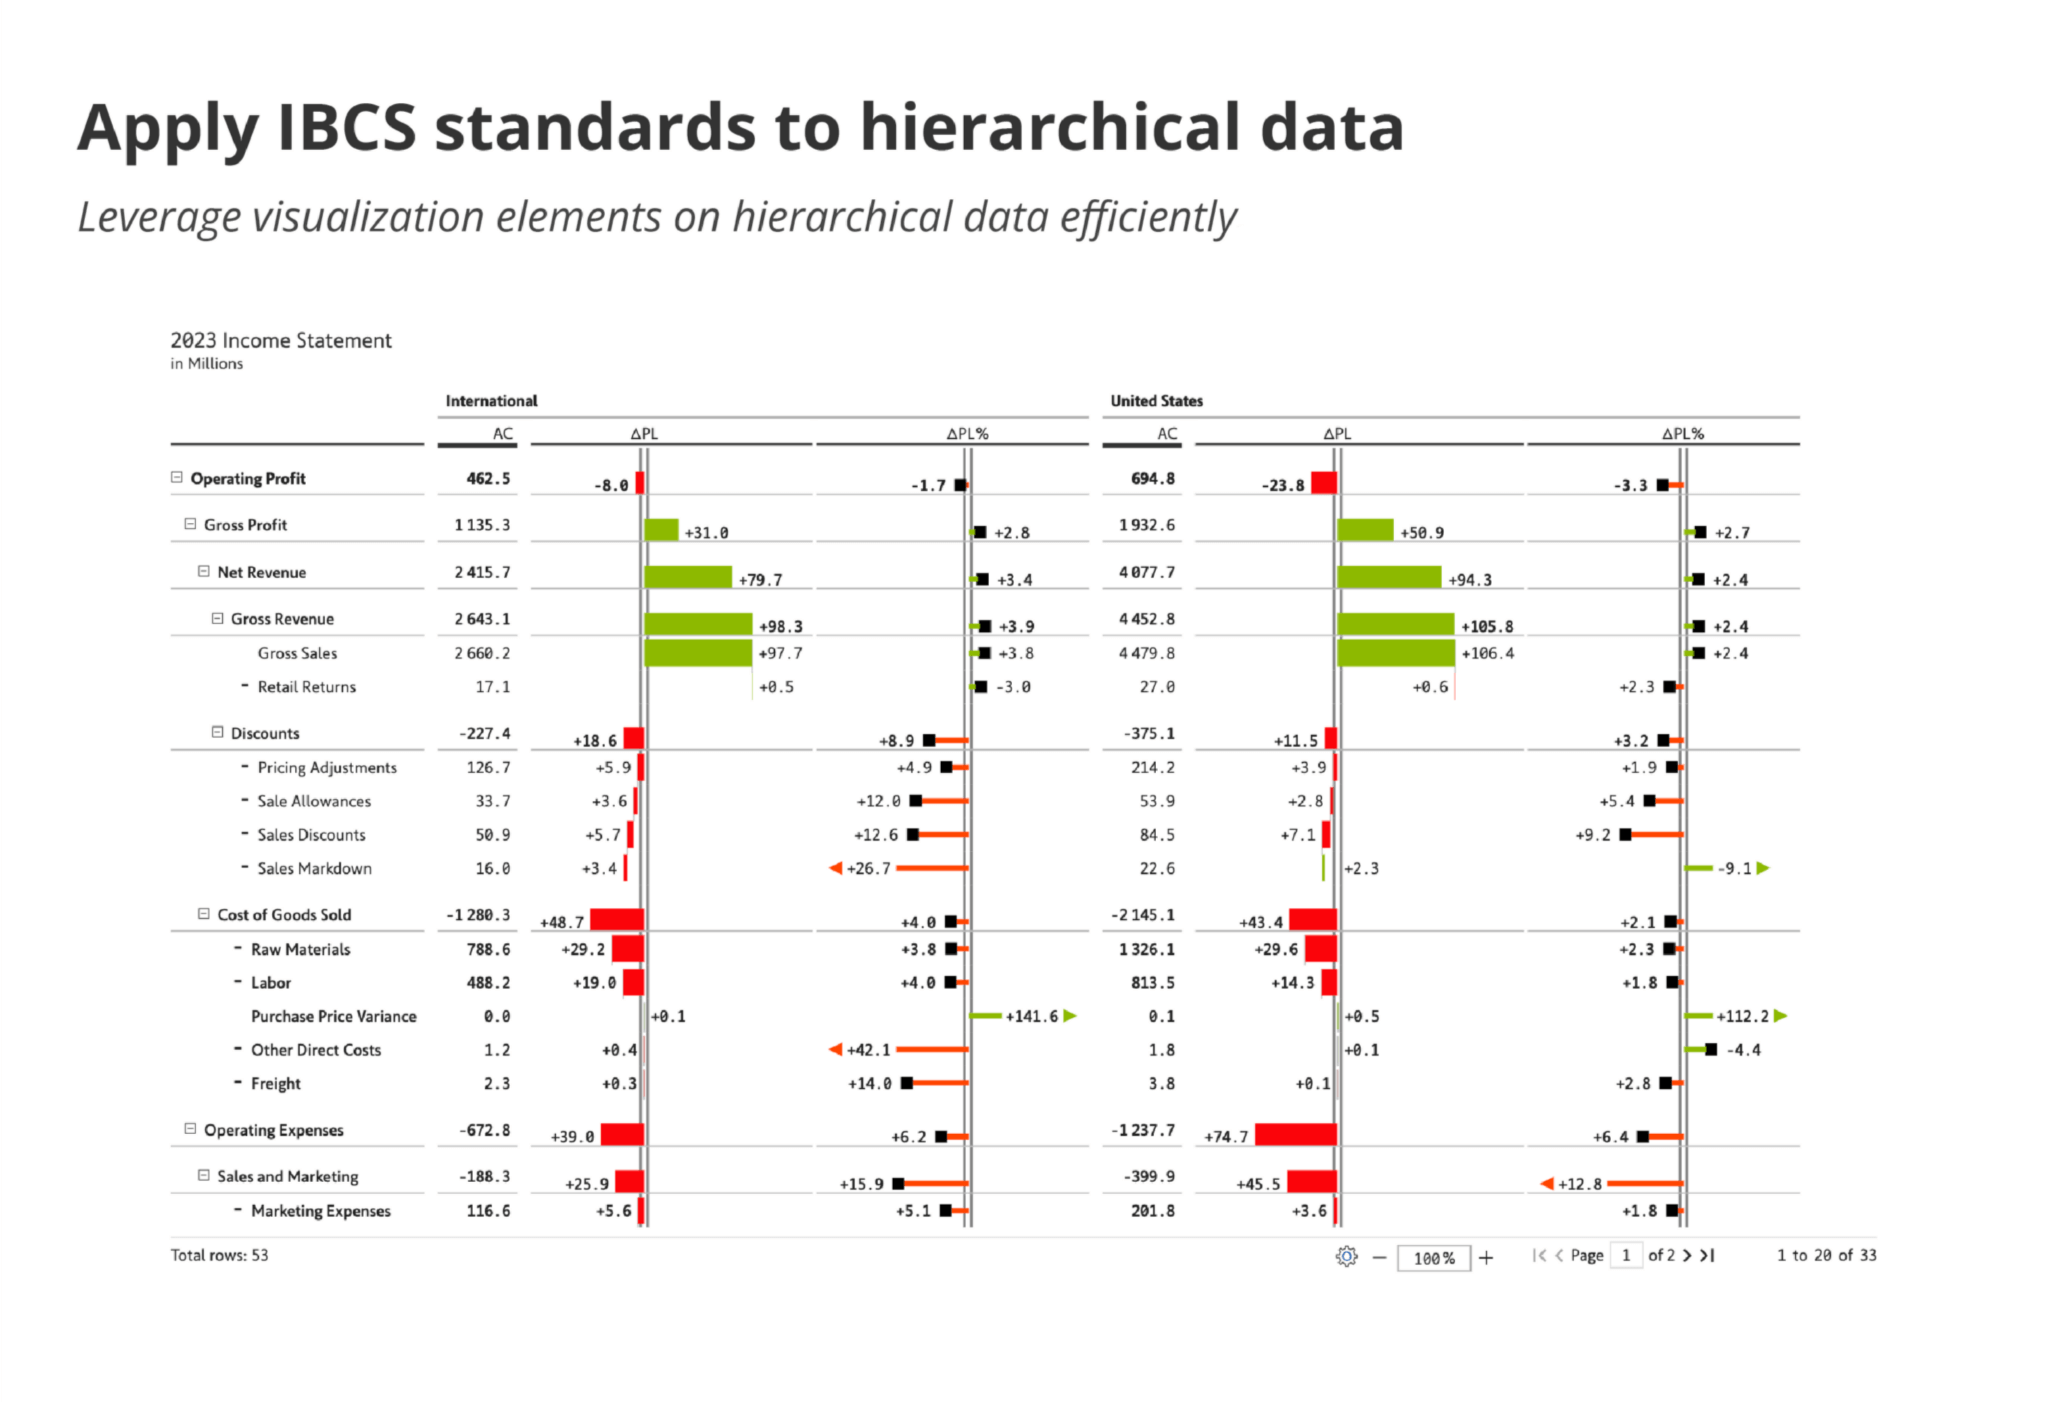


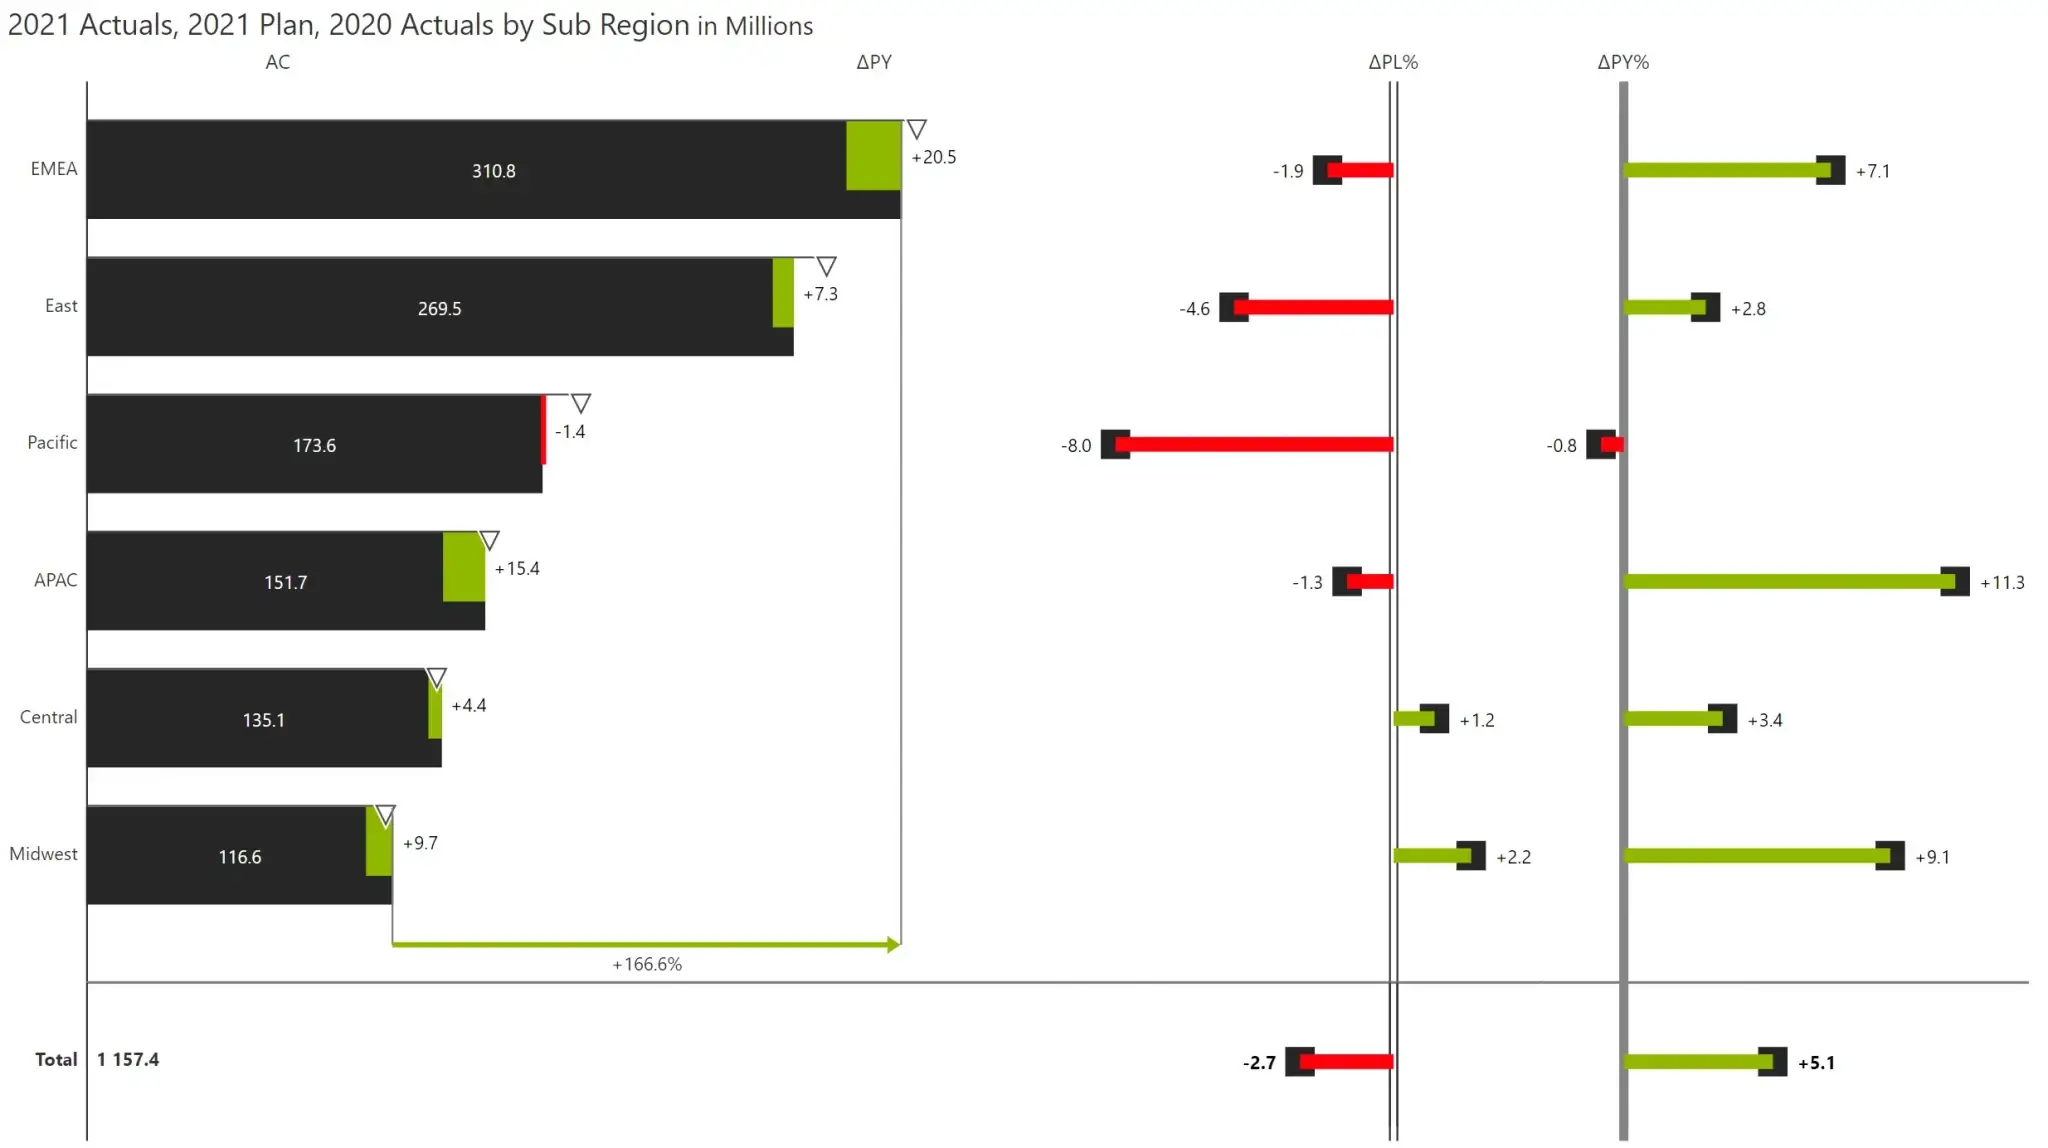
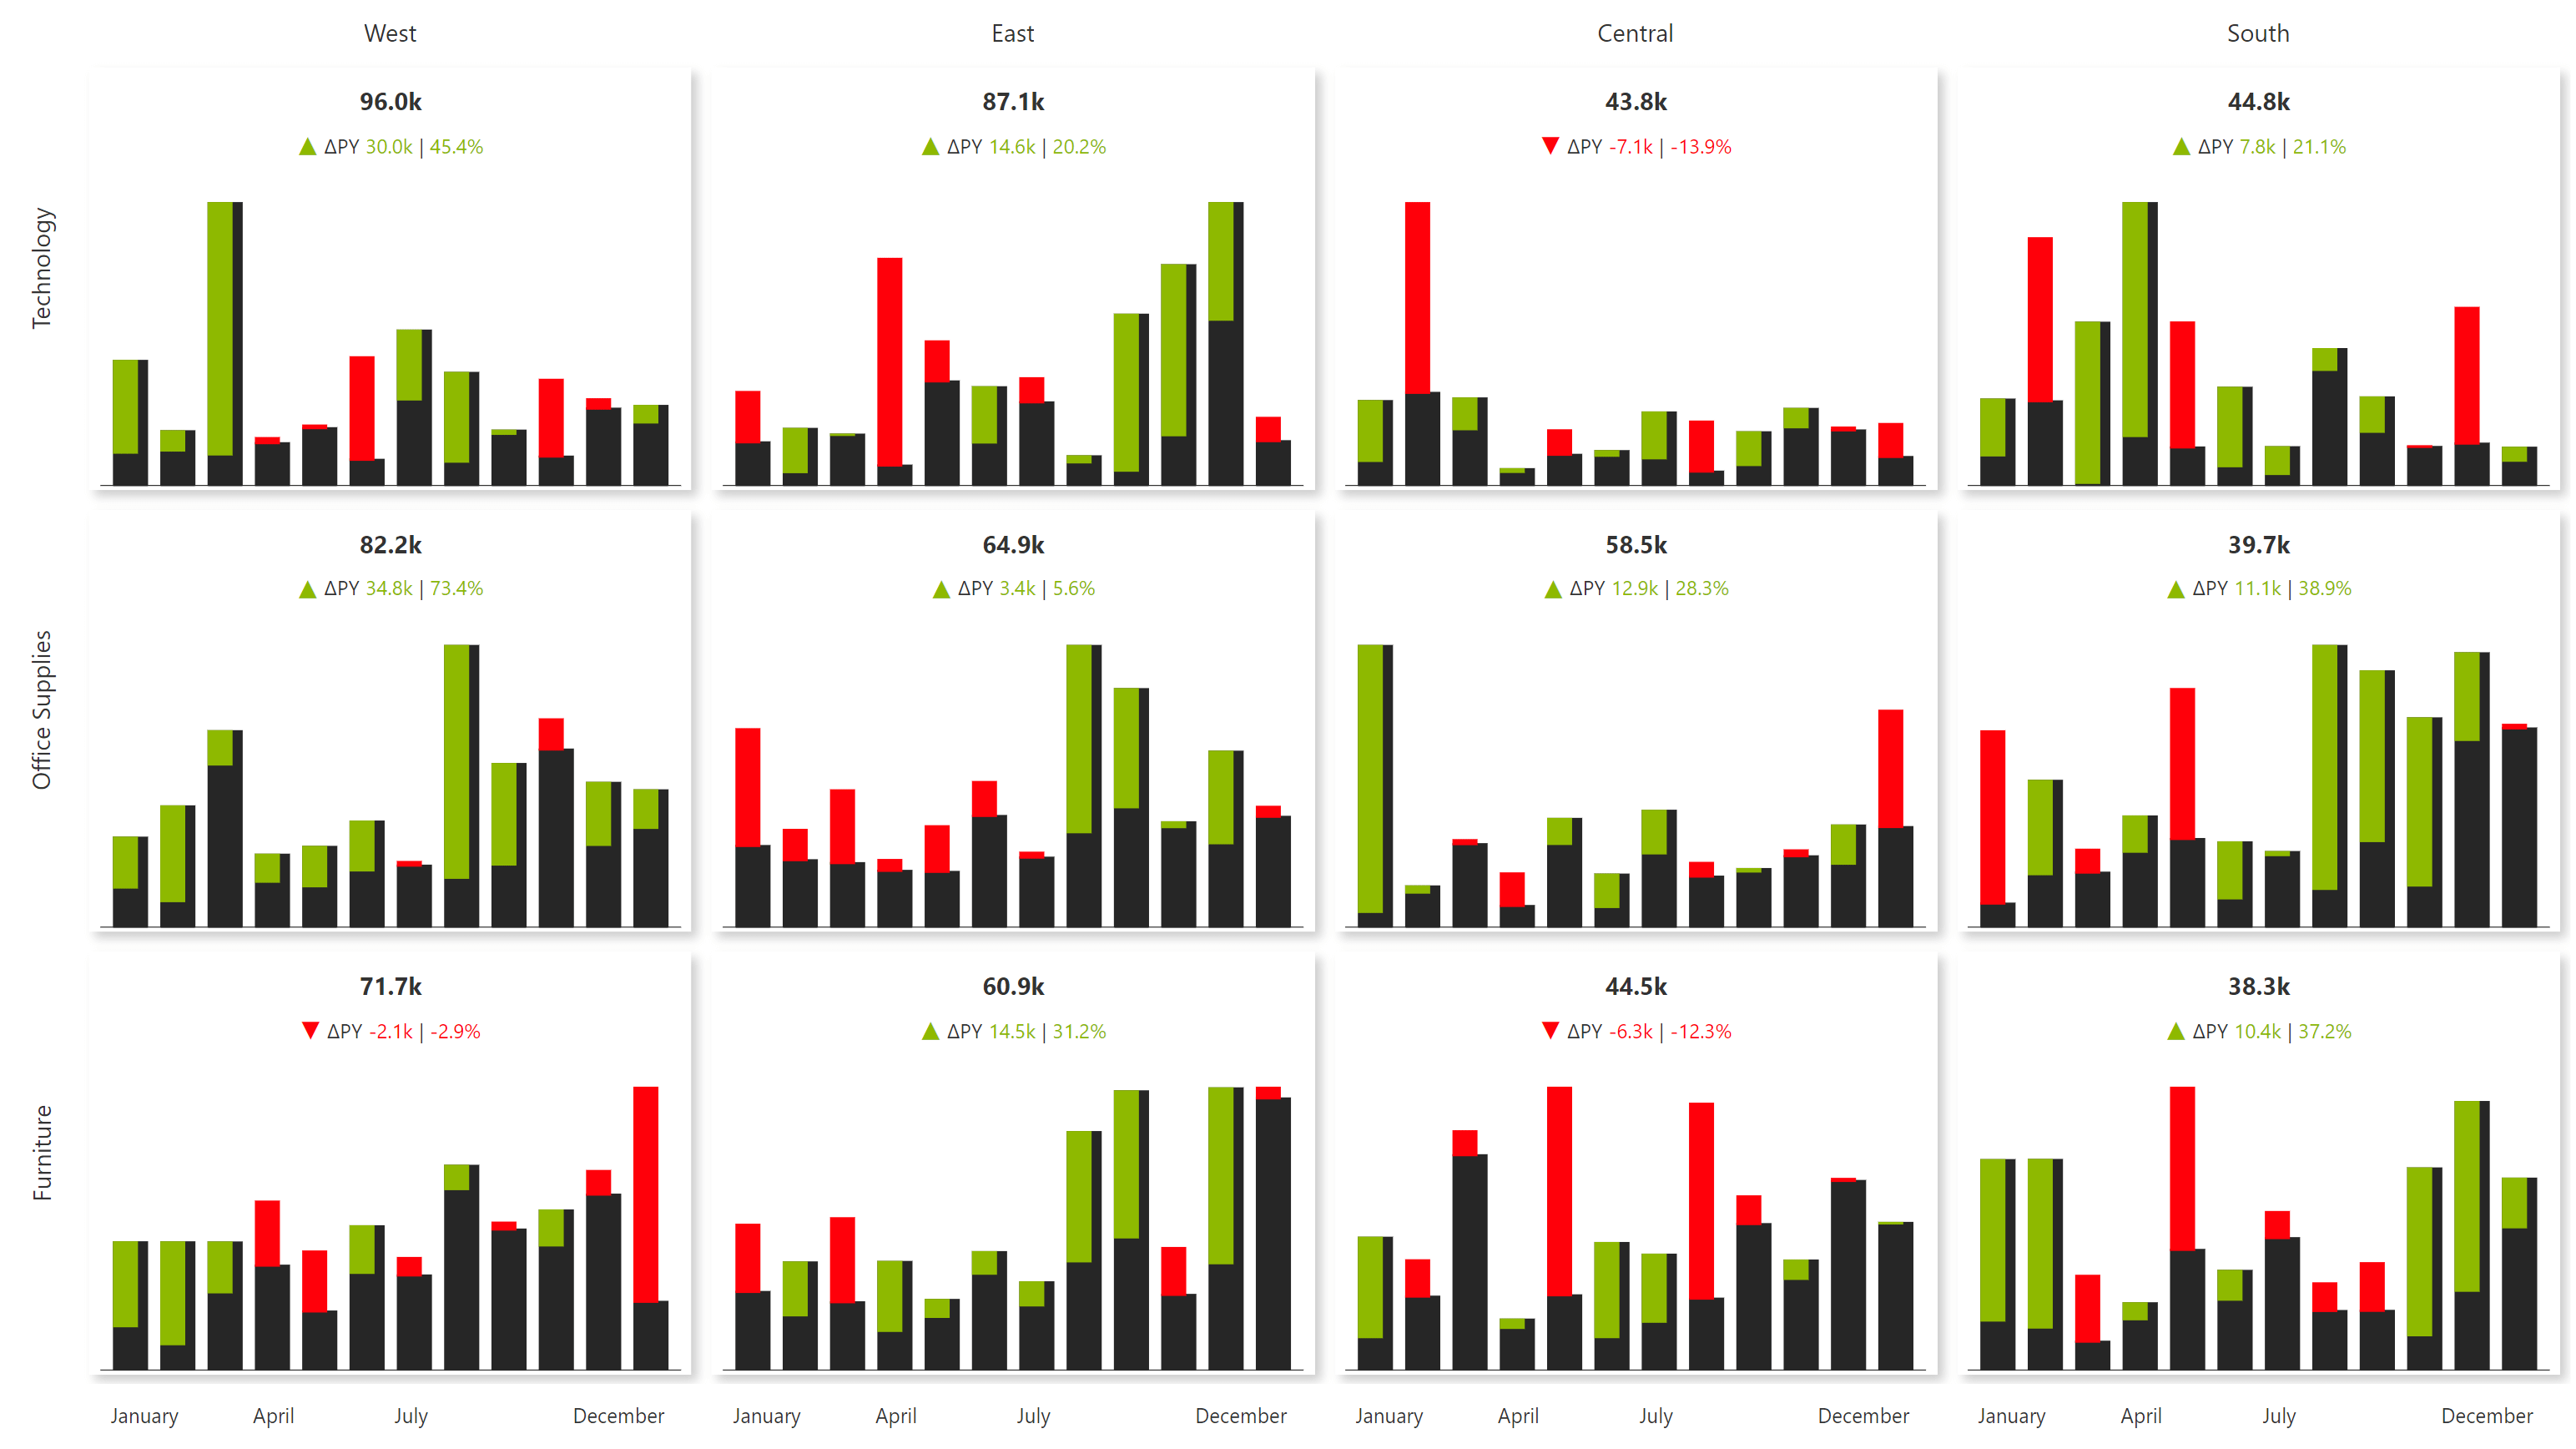
Leverage visualization elements on hierarchical data efficiently.
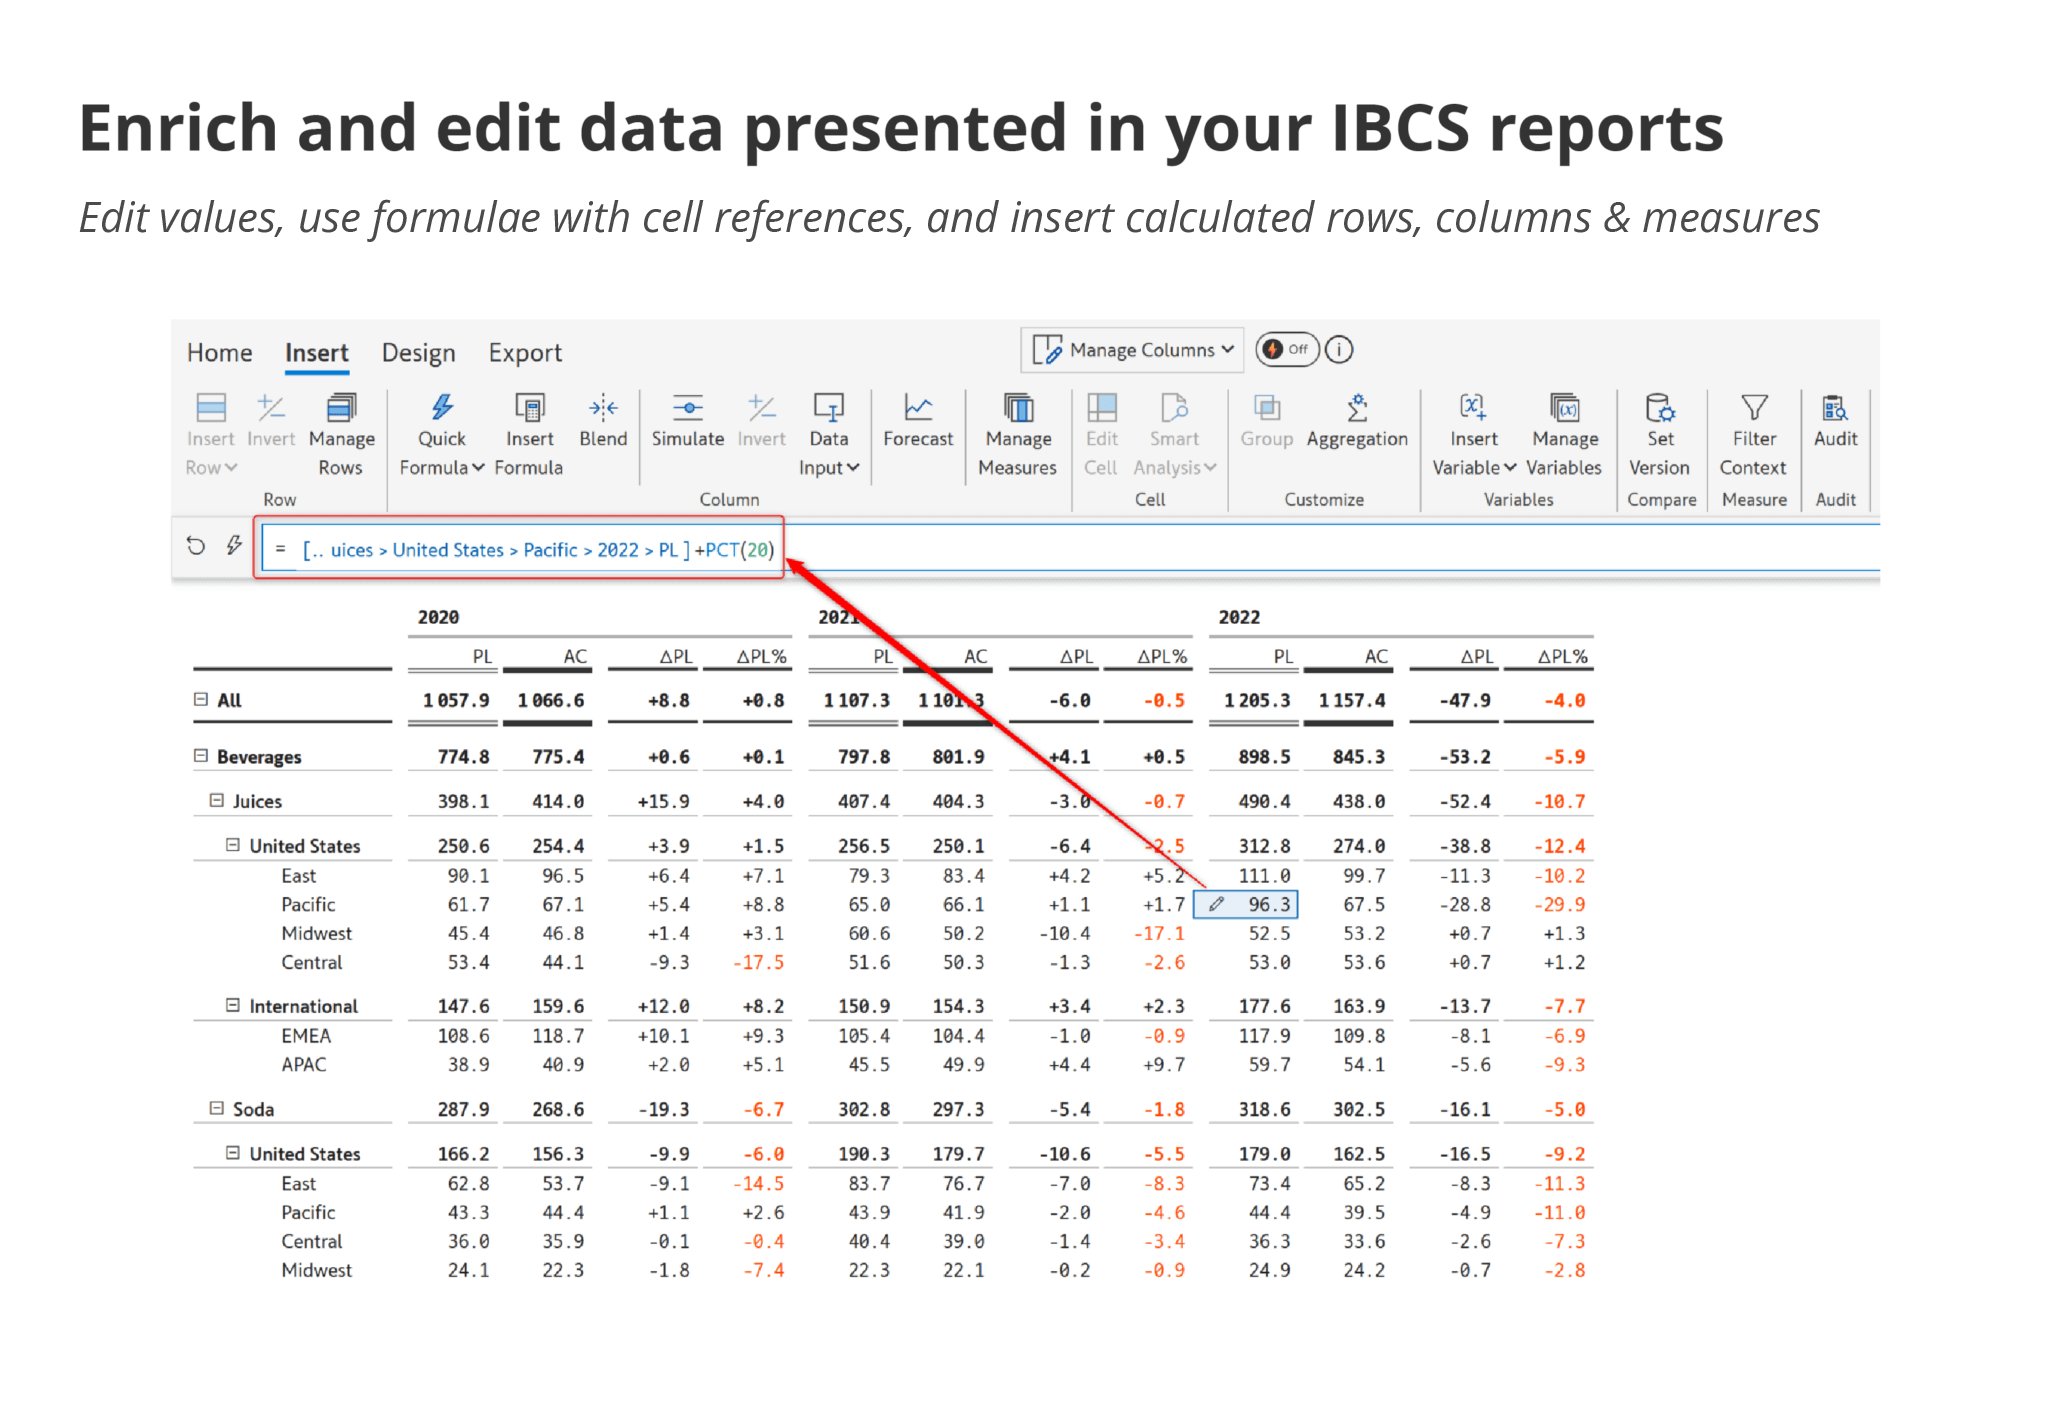
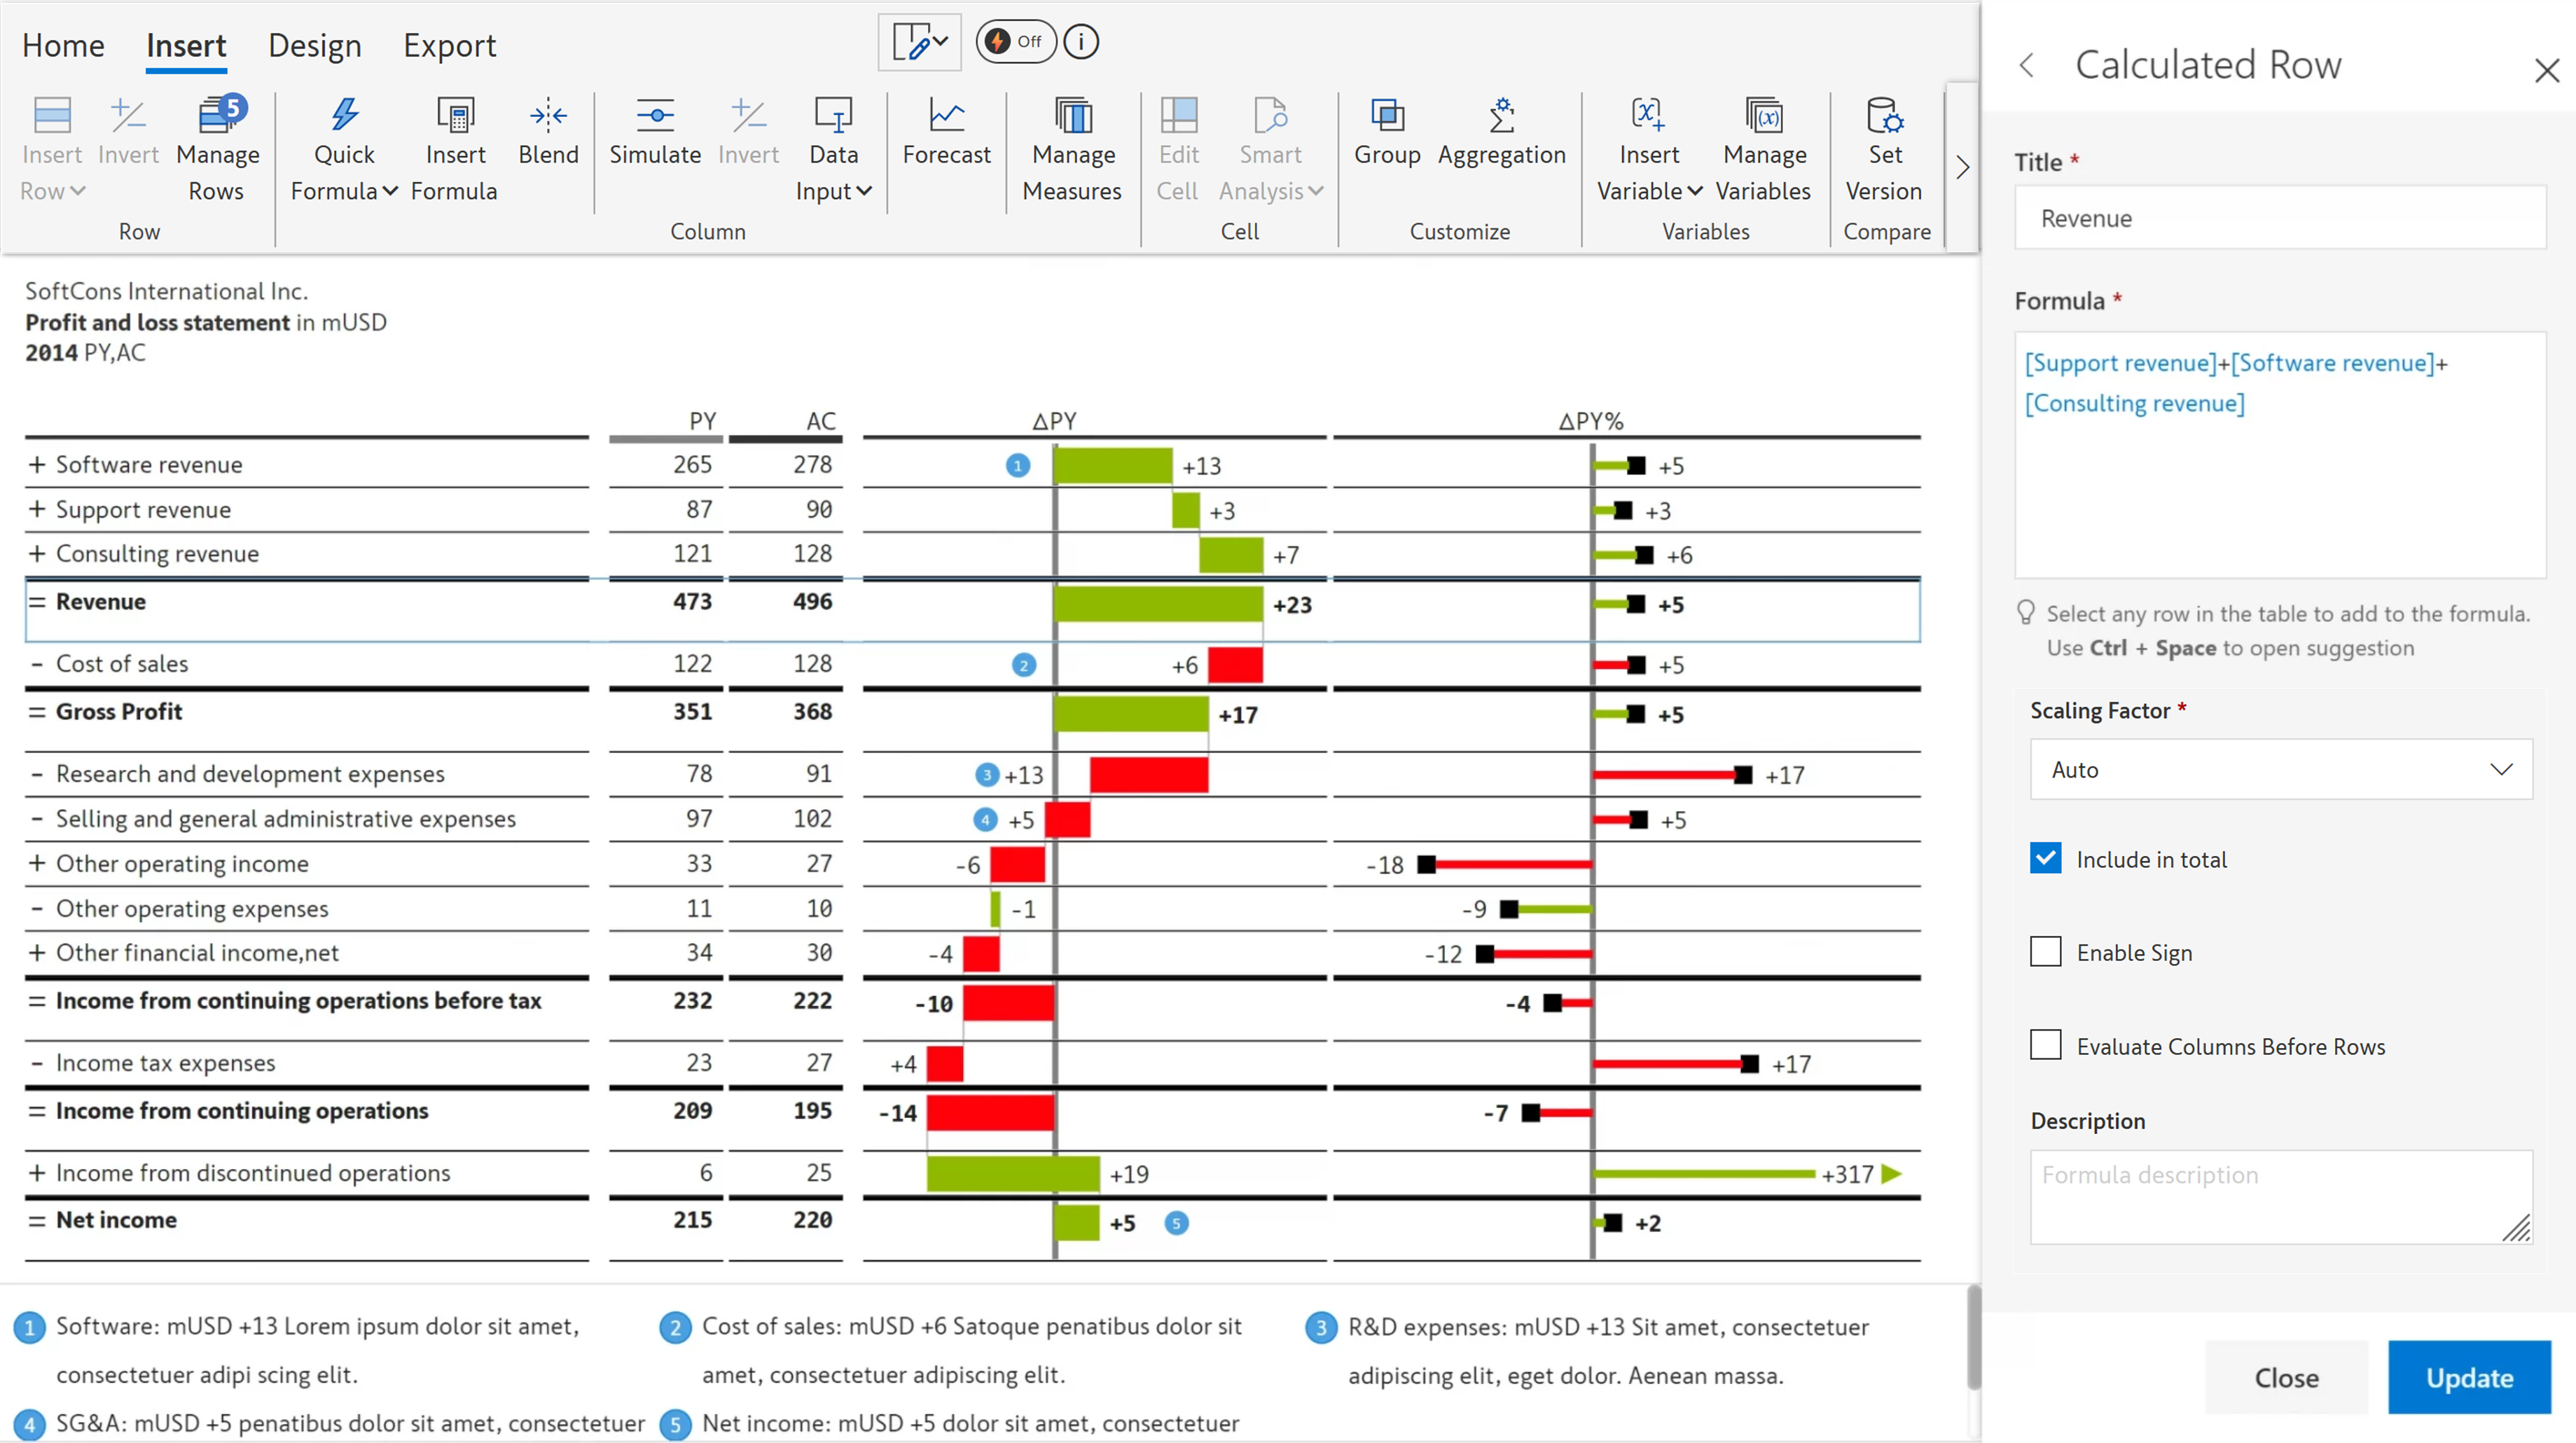
Edit values, use formulate with cell references, and insert calculated rows, columns & measures.
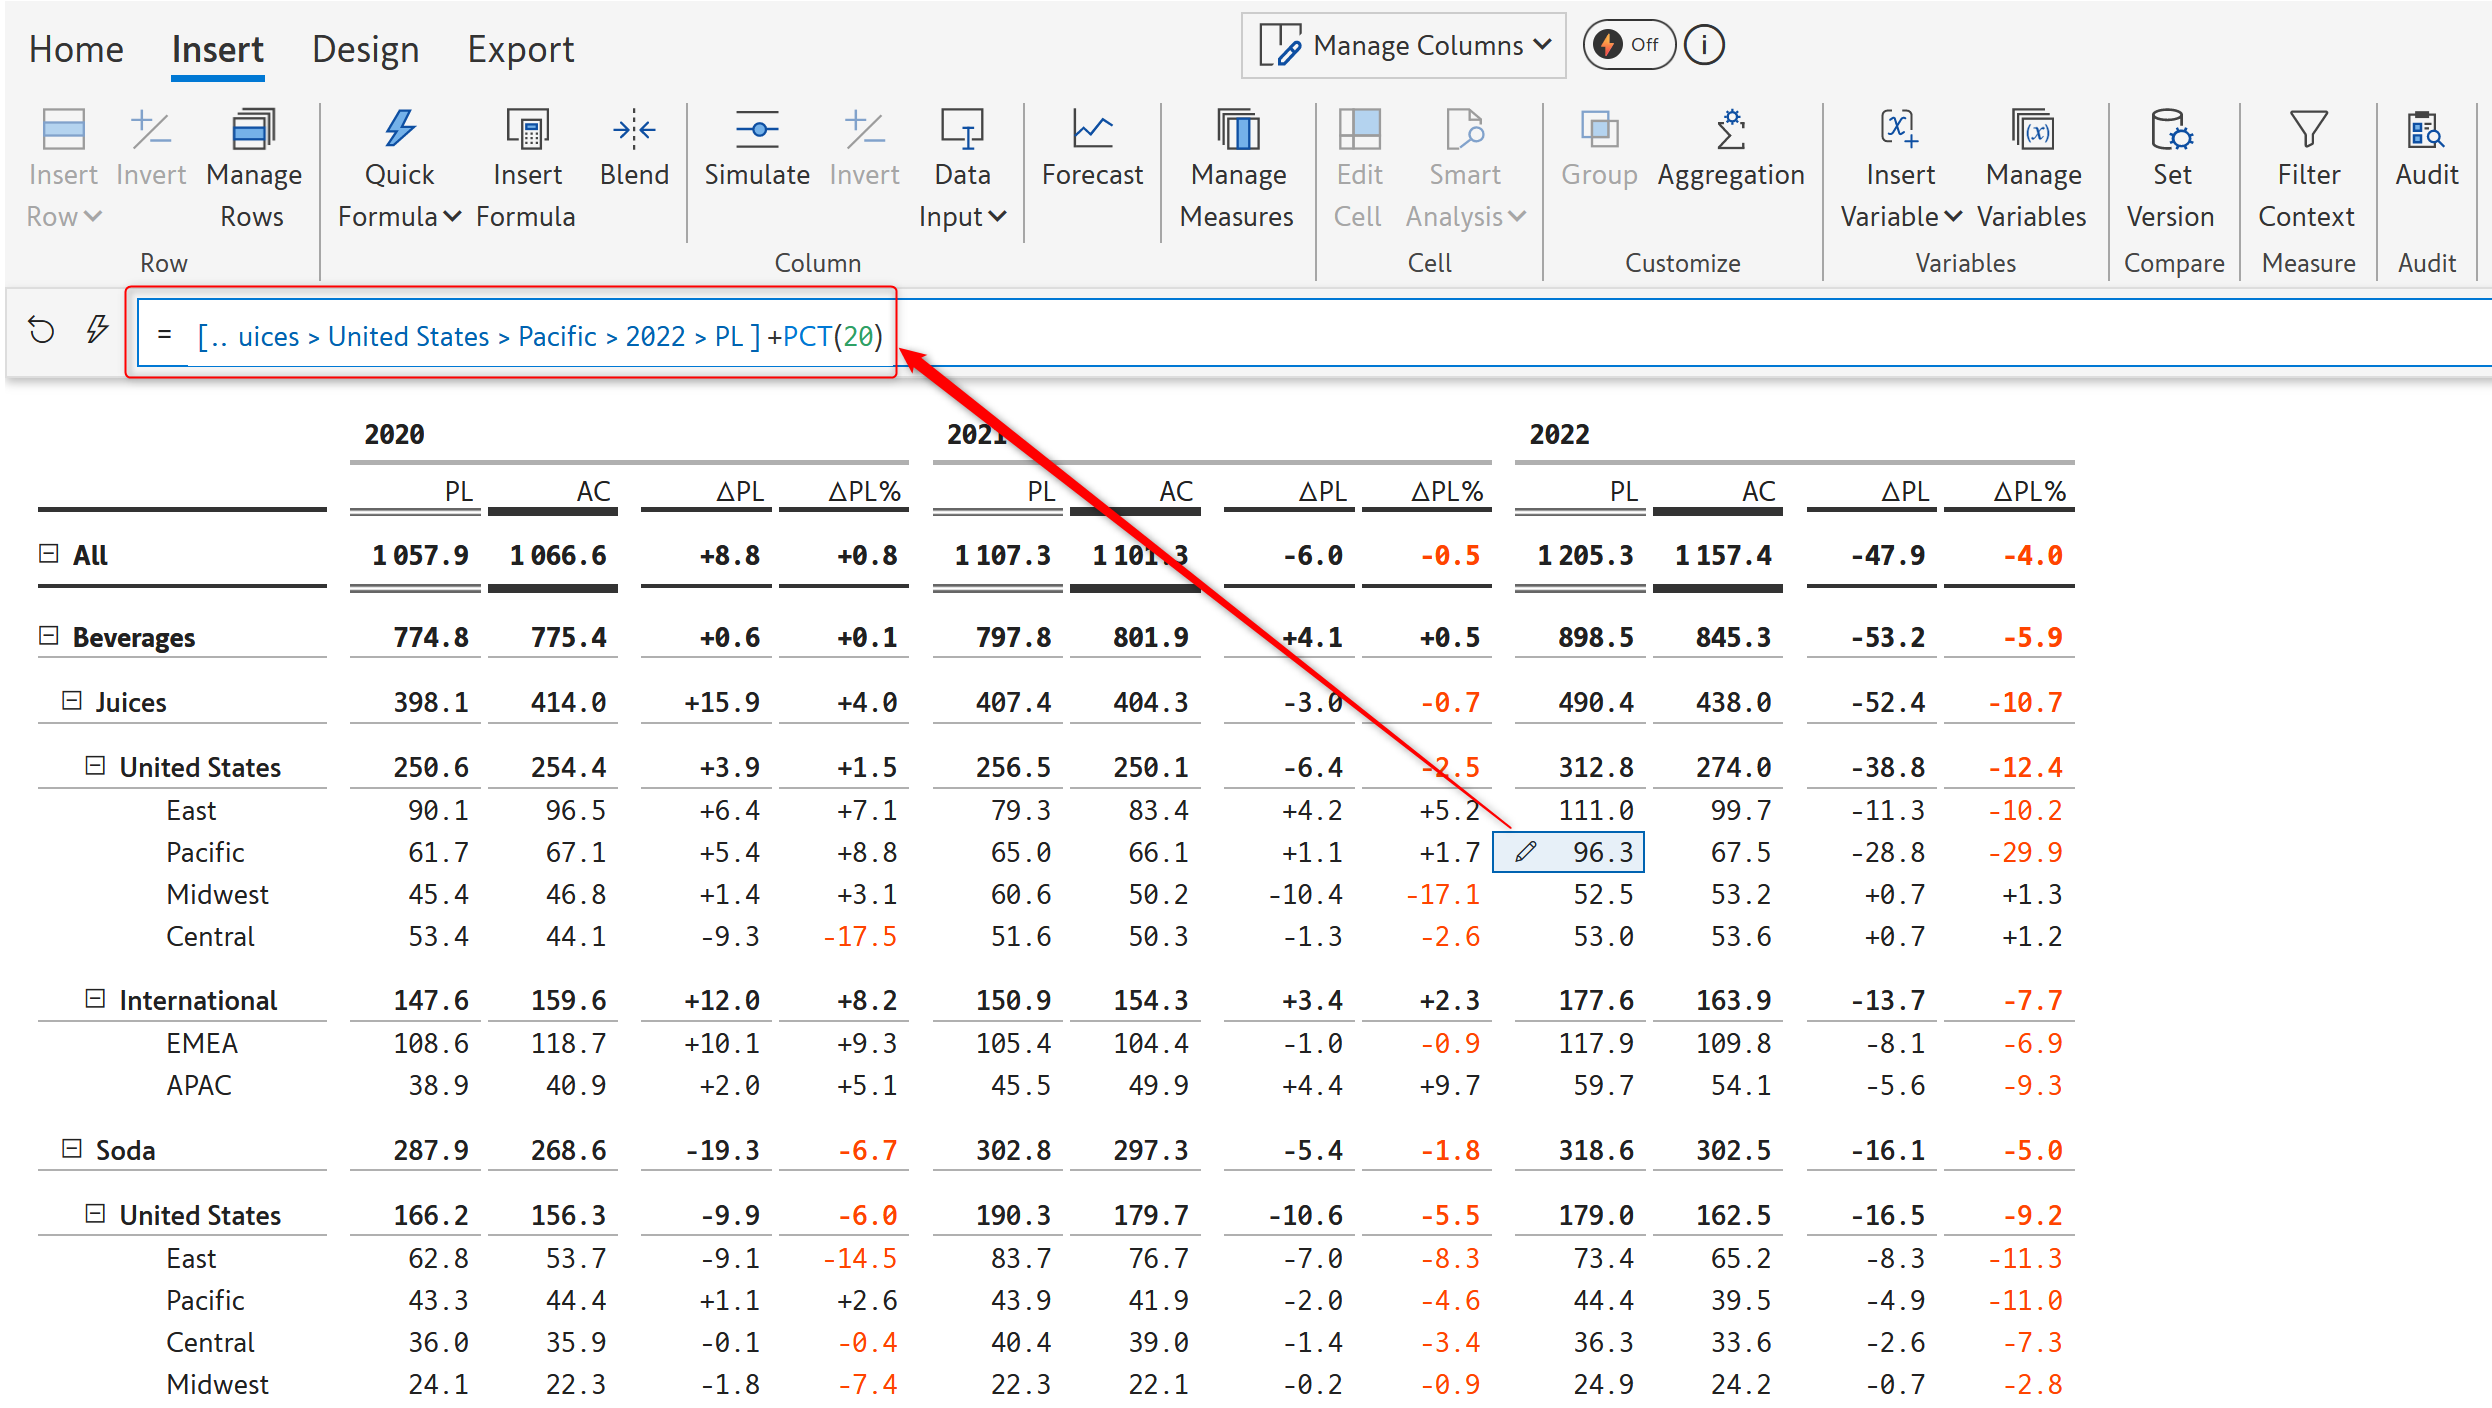
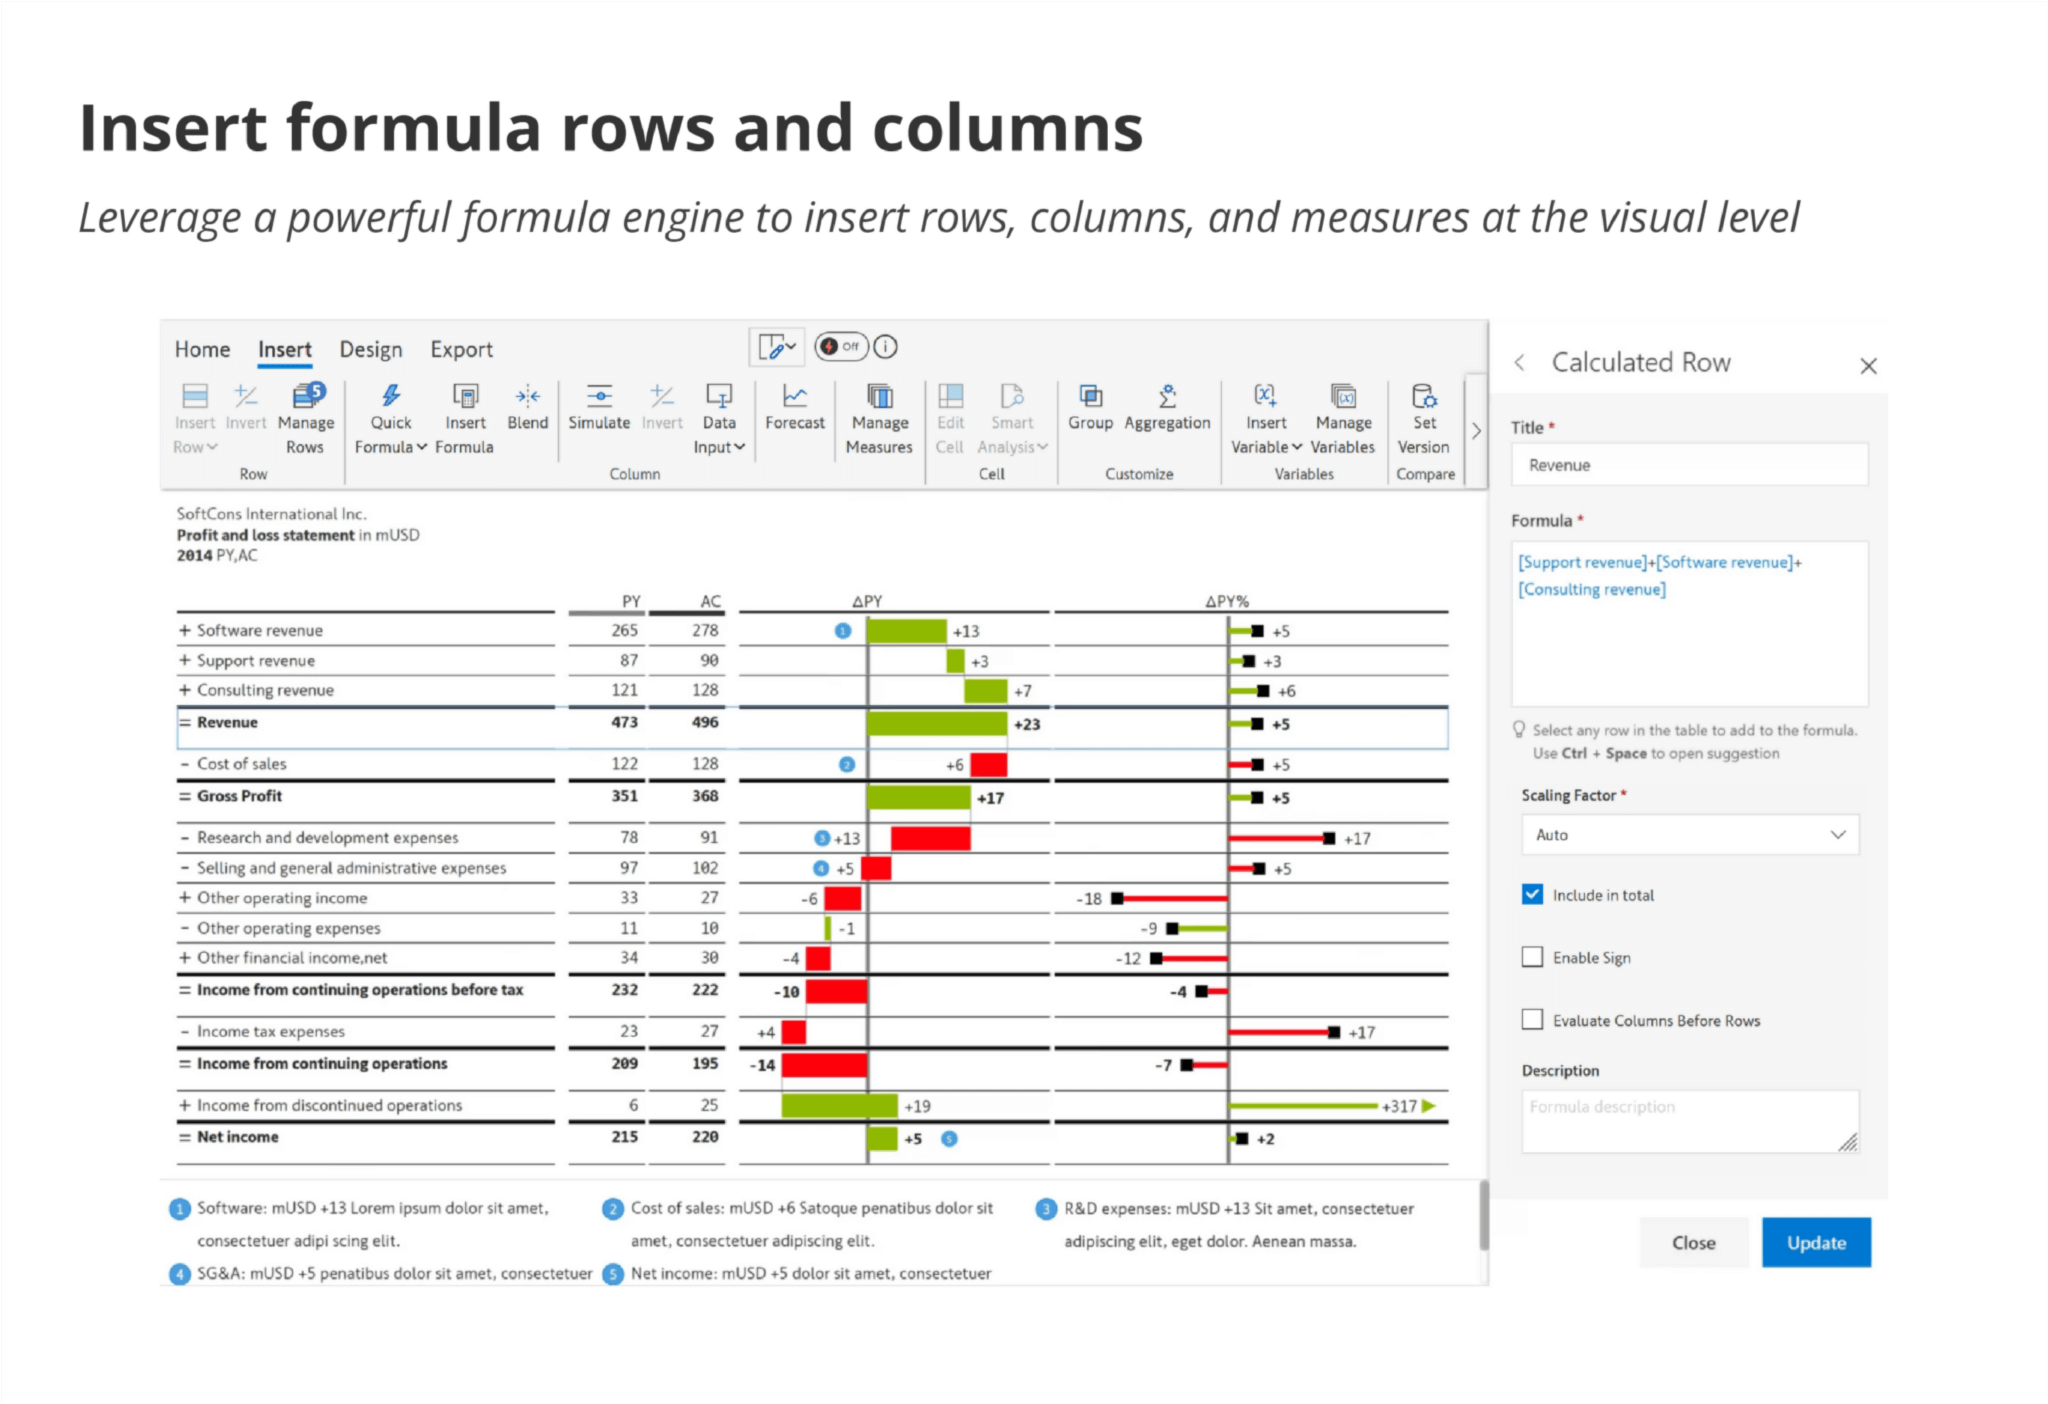
Leverage a powerful formula engine to insert rows, columns, and measures at the visual level.
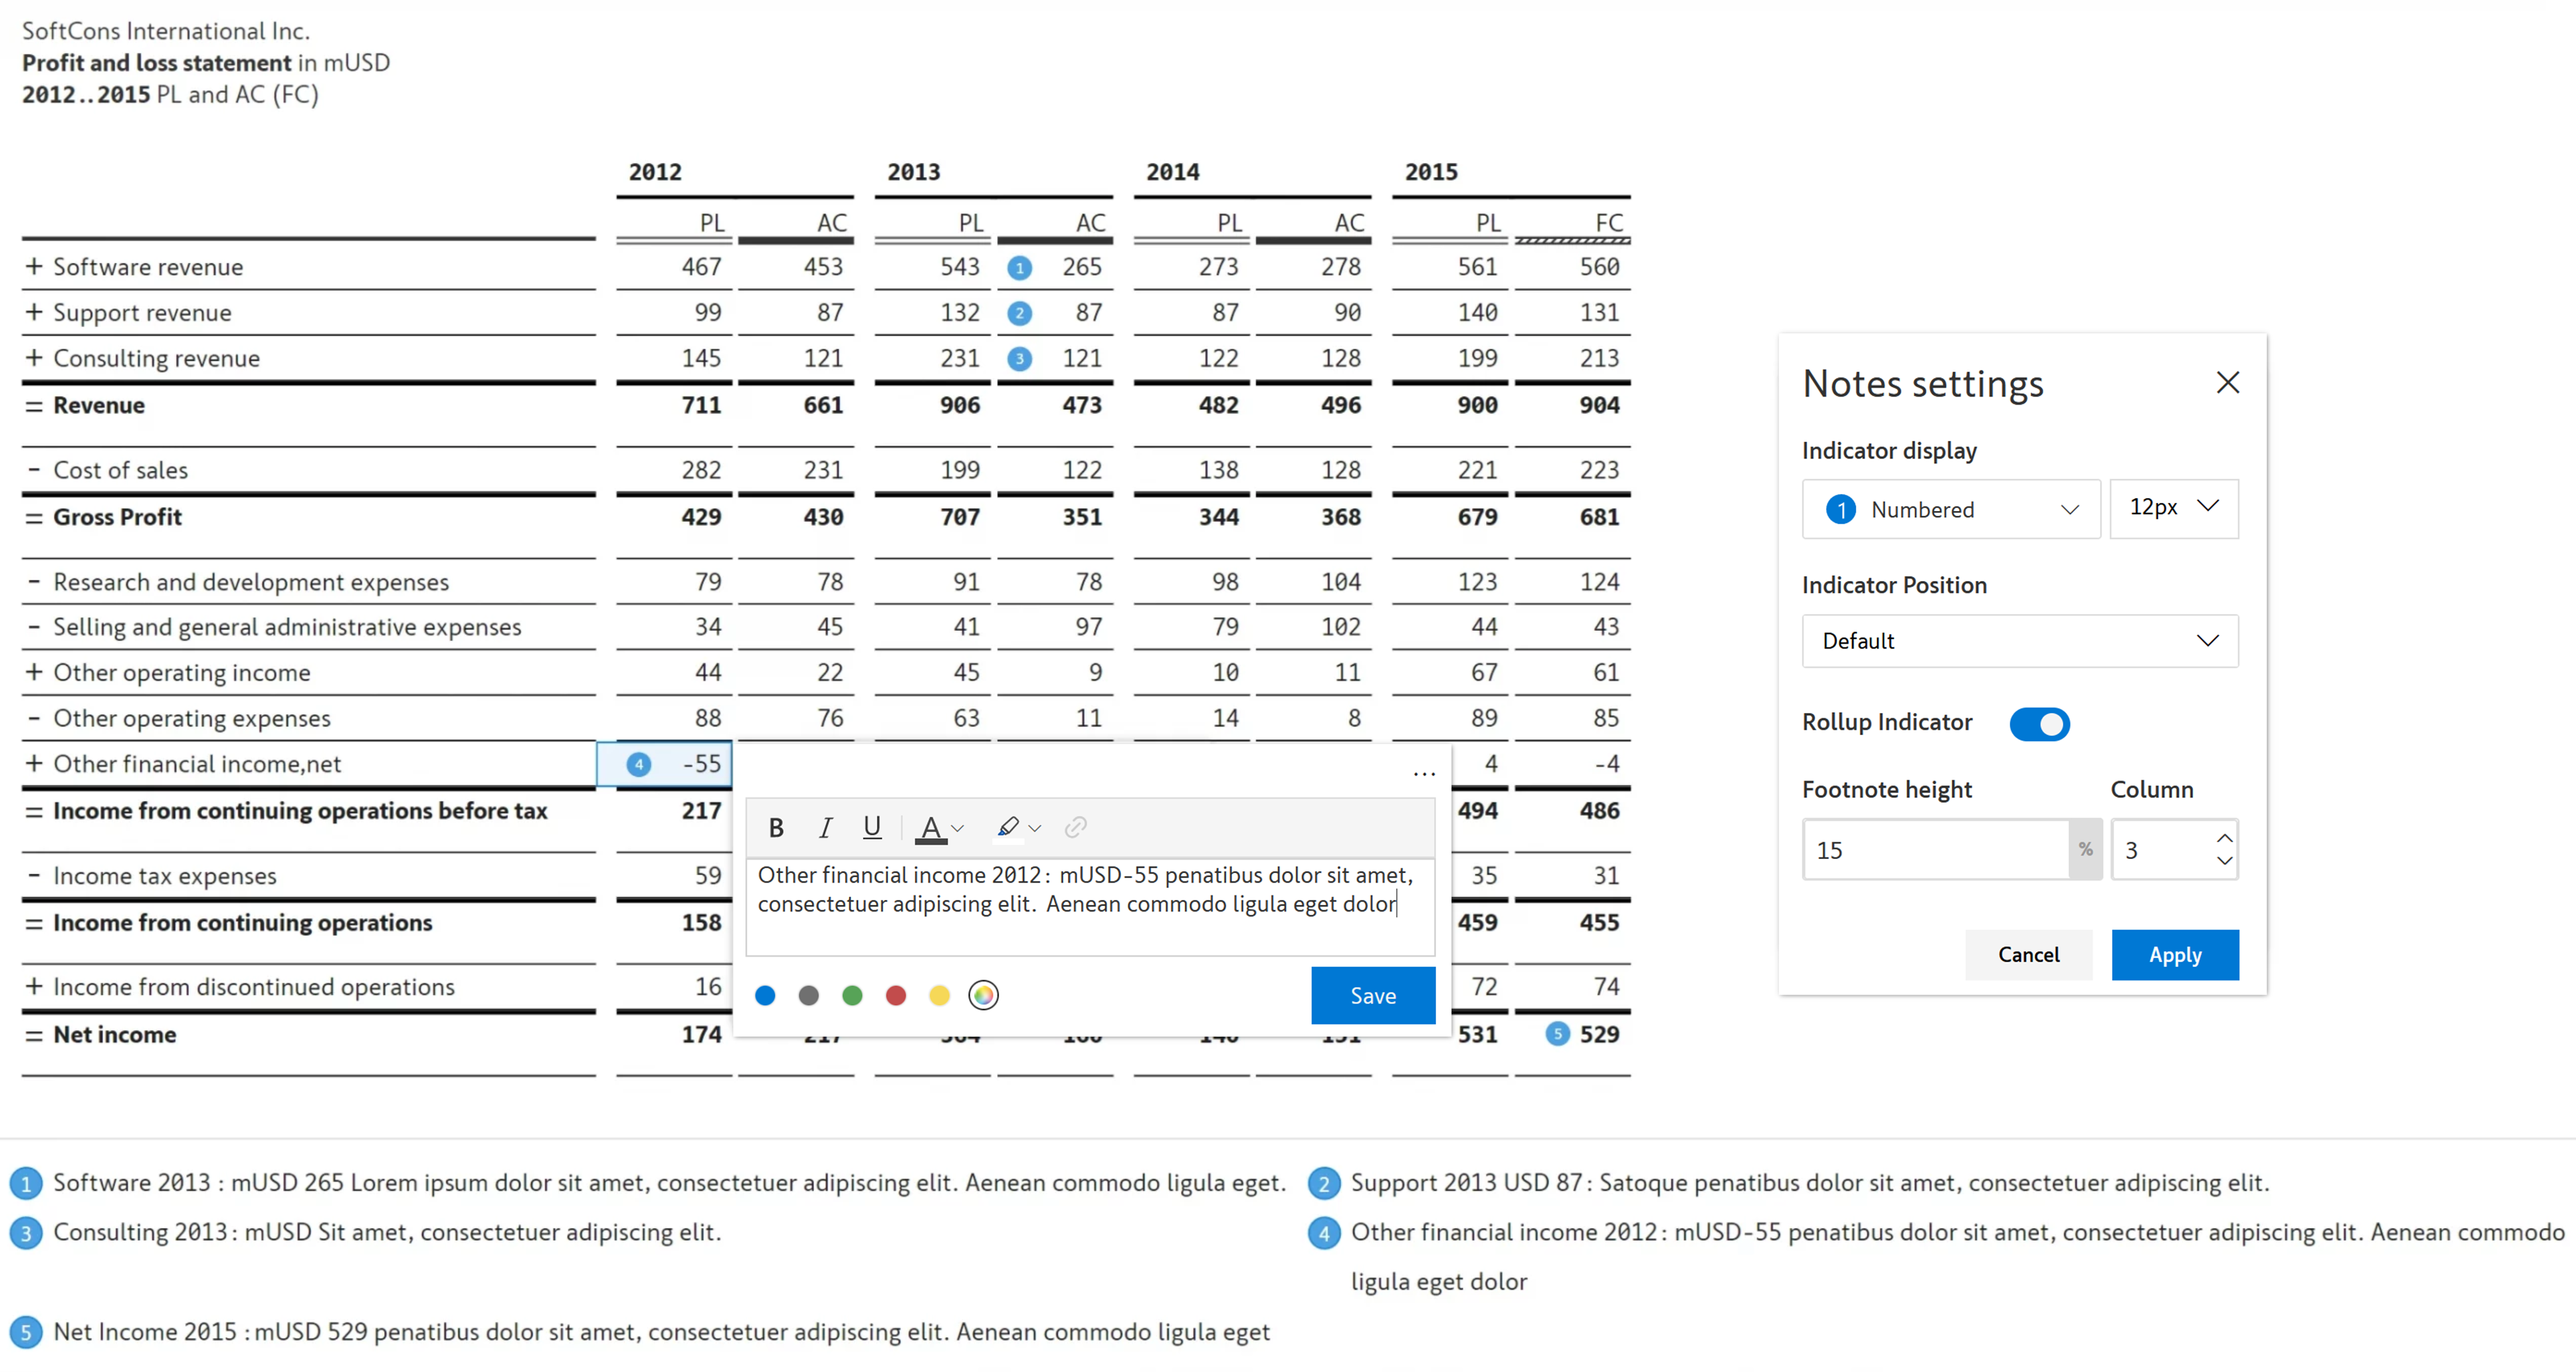
Enhance your reports with formattable multi-line headers, cell / row / column-level notes, footnotes & annotations.
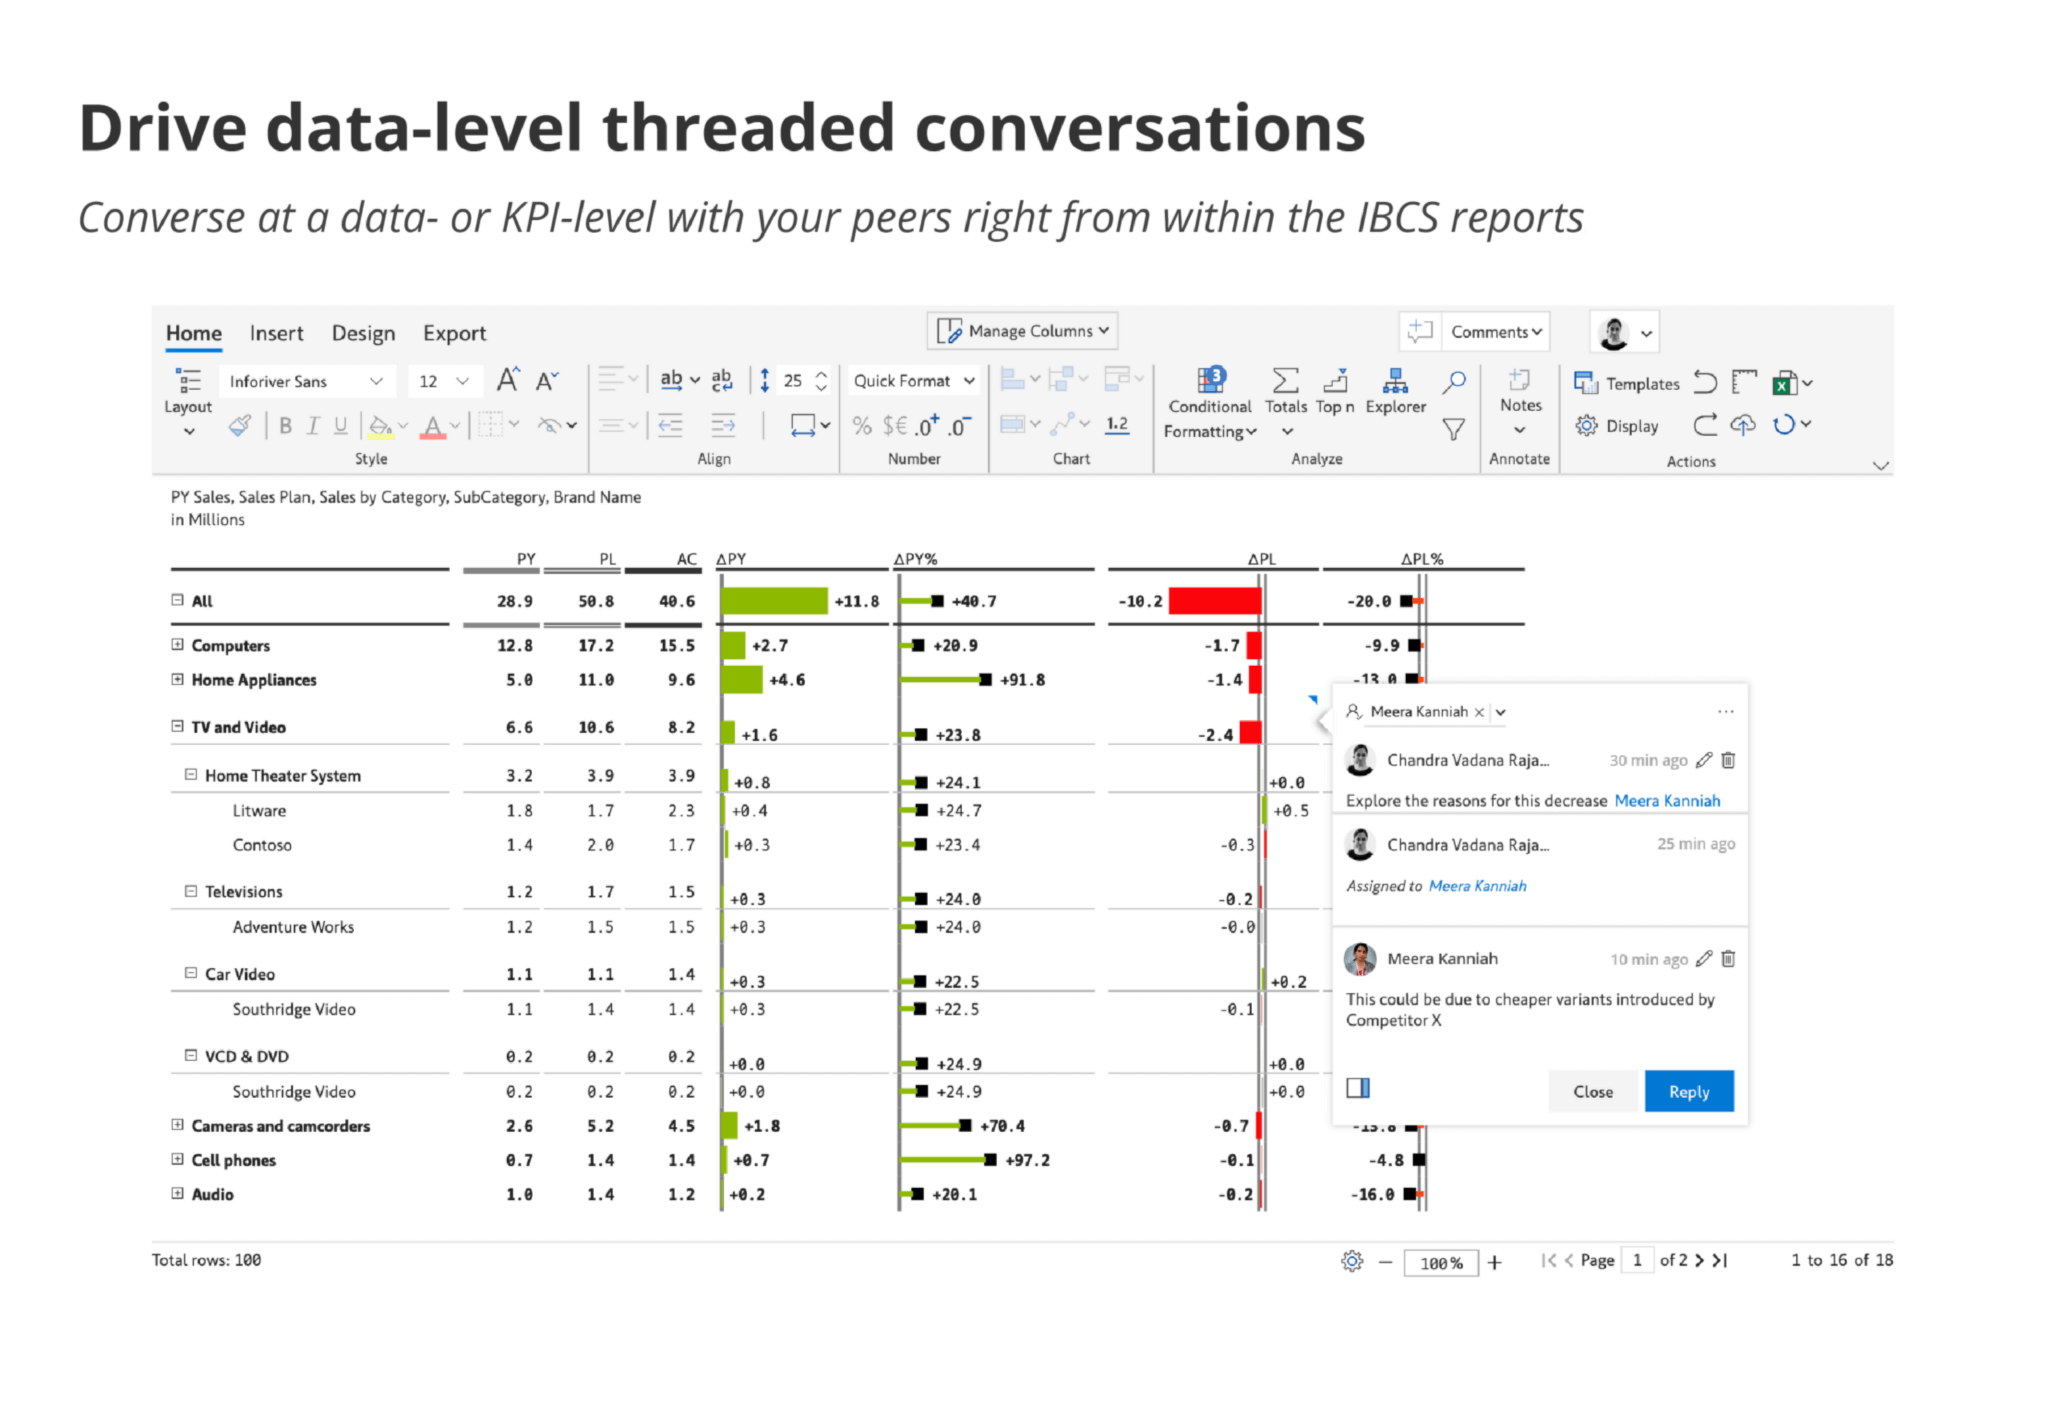
Converse at a data- or KPI-level with your peers right from within the IBCS reports.
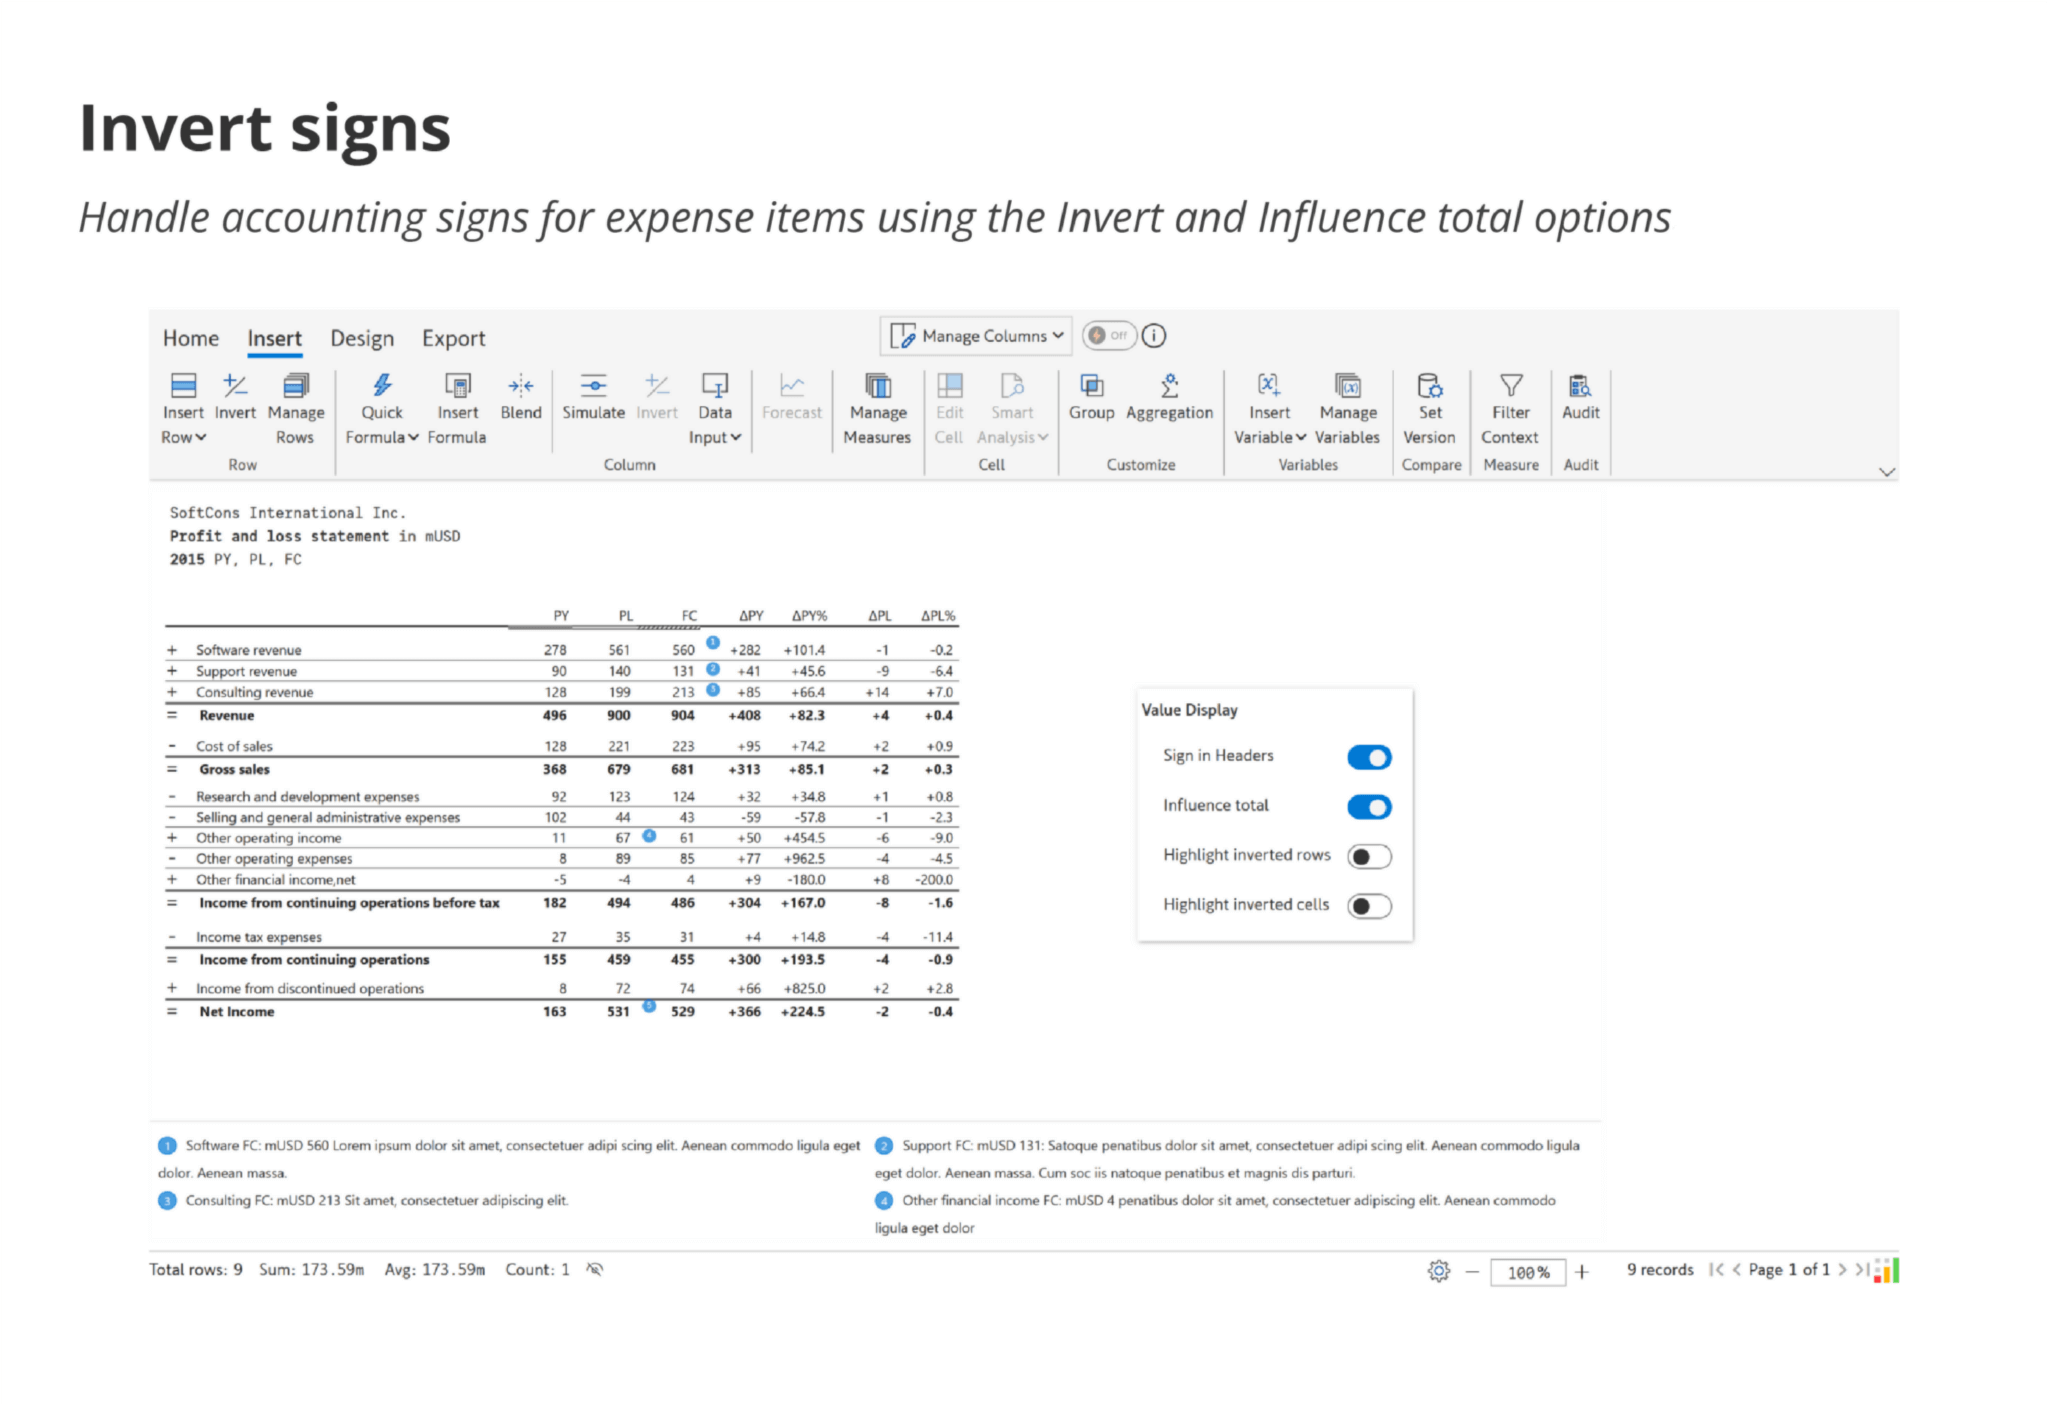
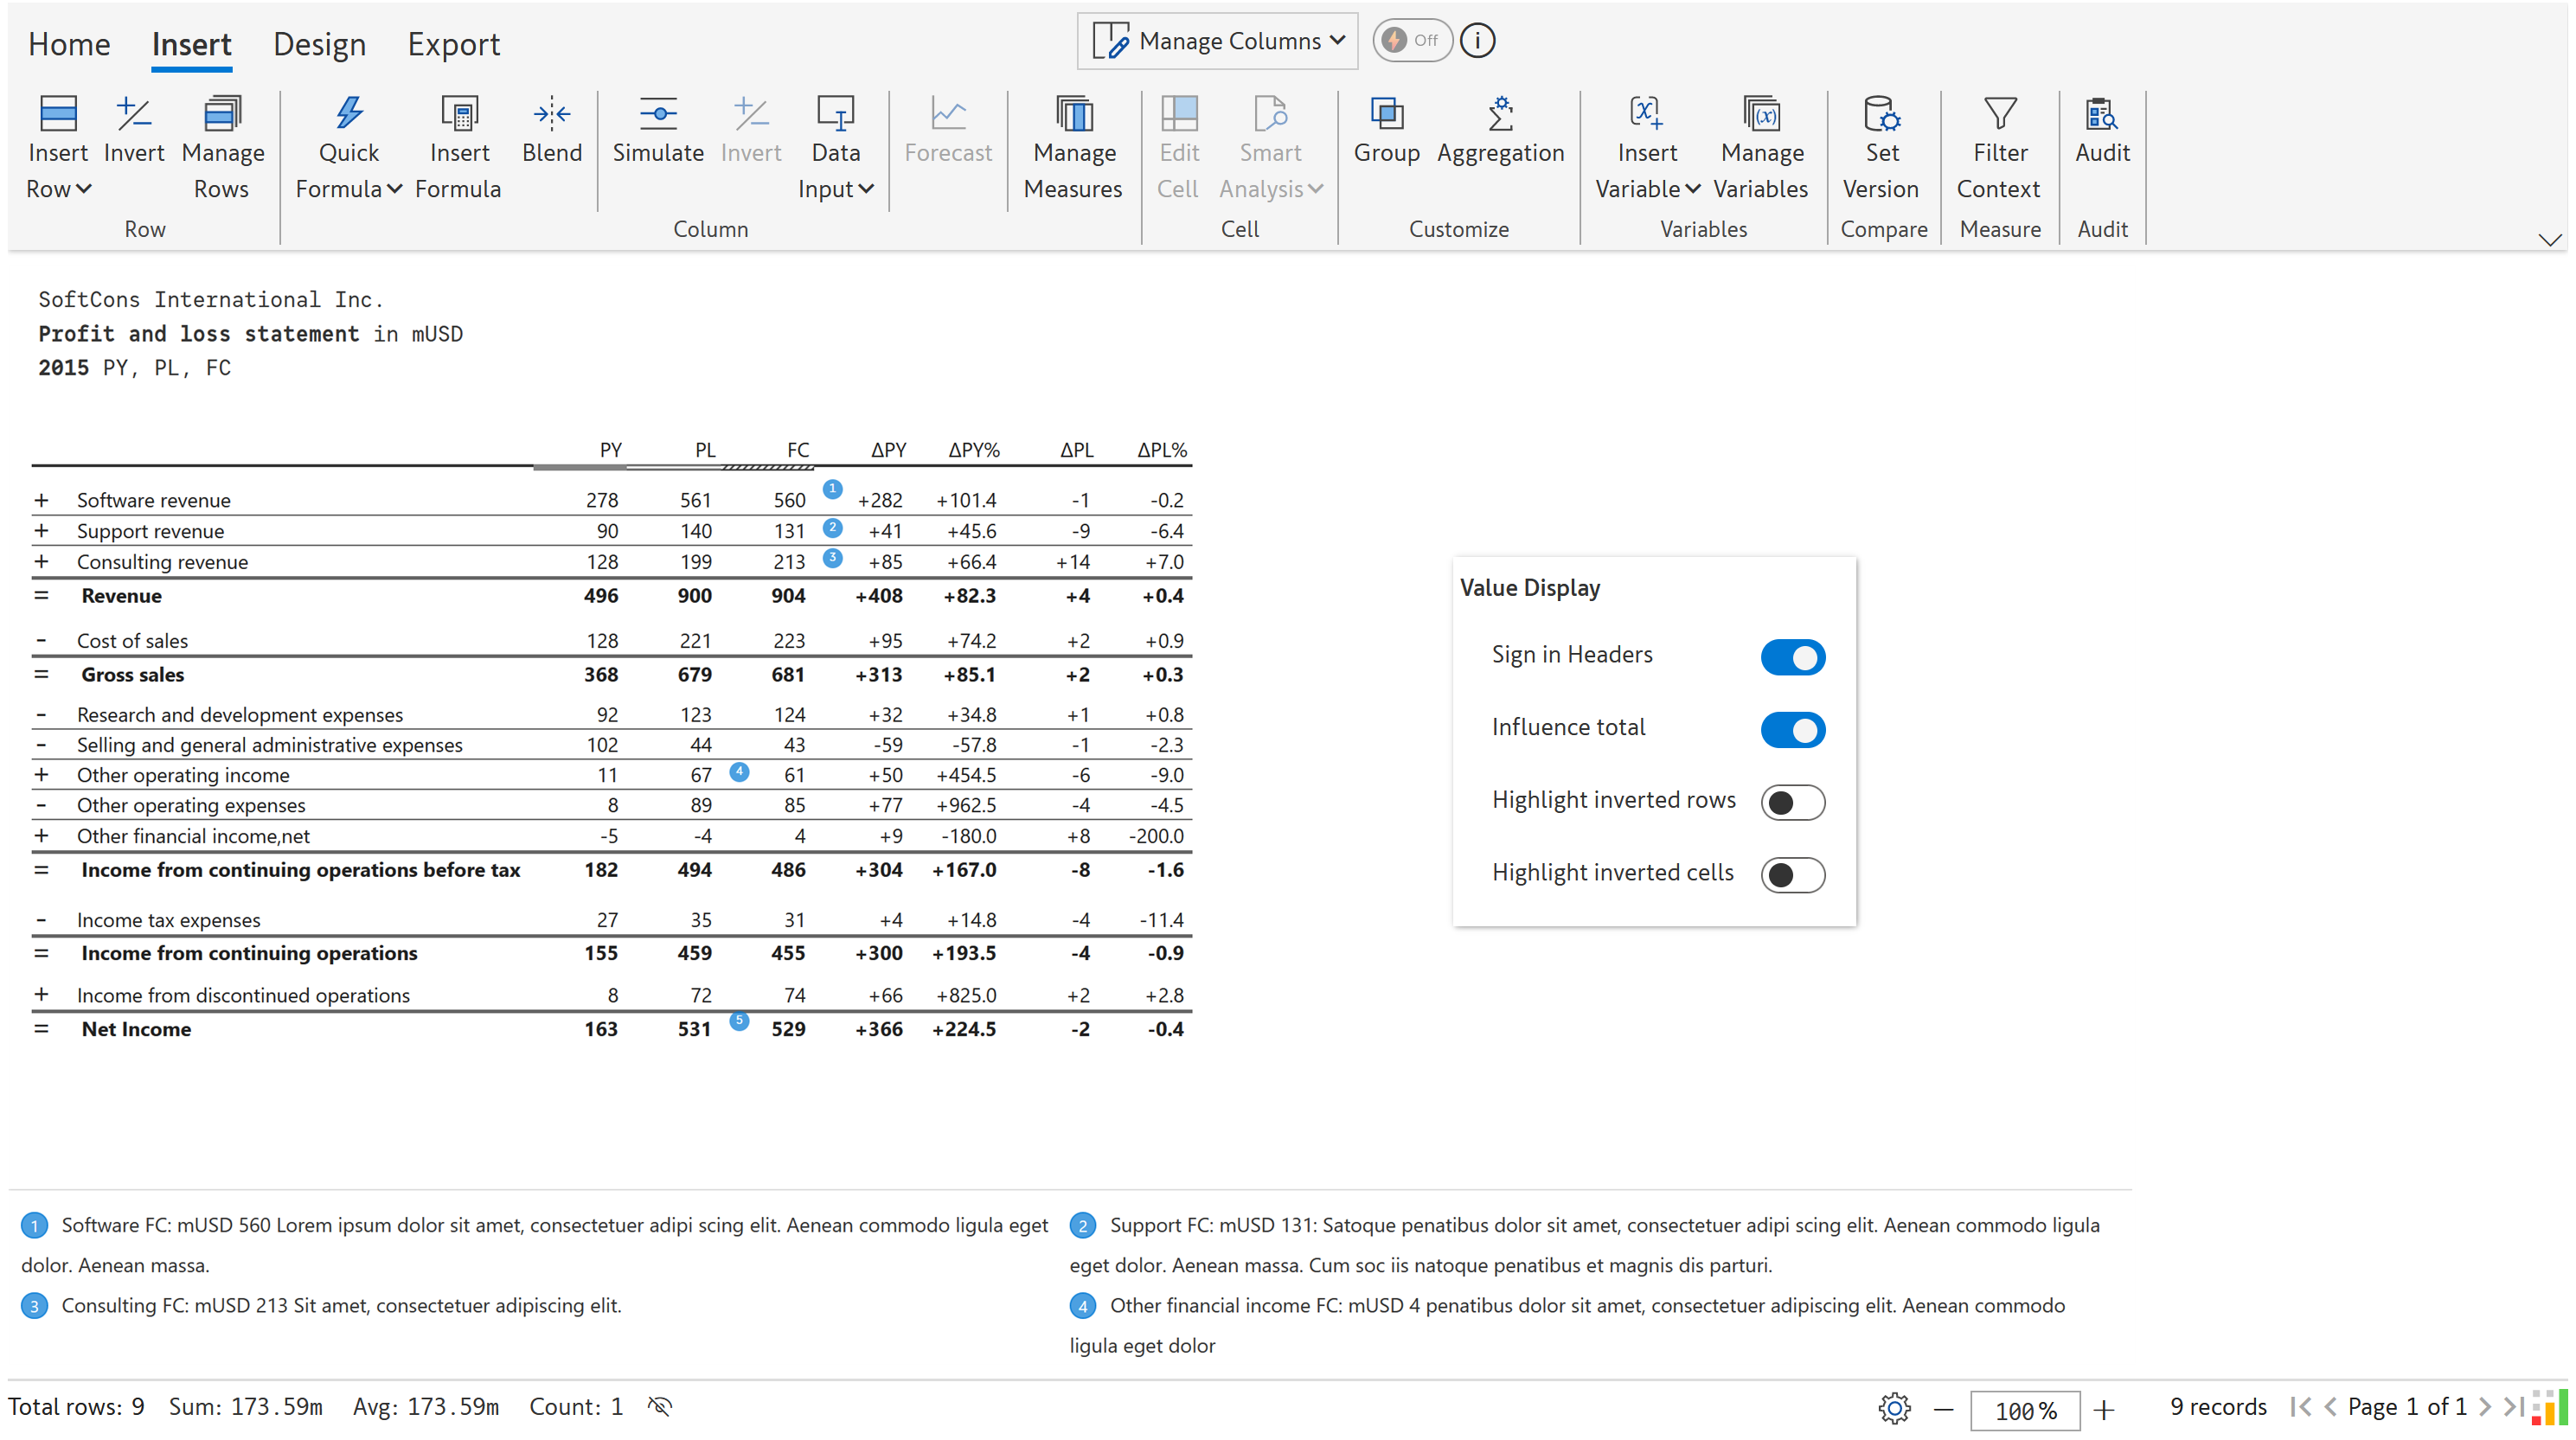
Handle accounting signs for expense items using the Invert and Influence total options.

In this webinar, learn how to leverage one-click IBCS report templates to deliver stunning and engaging visualizations in Power BI.
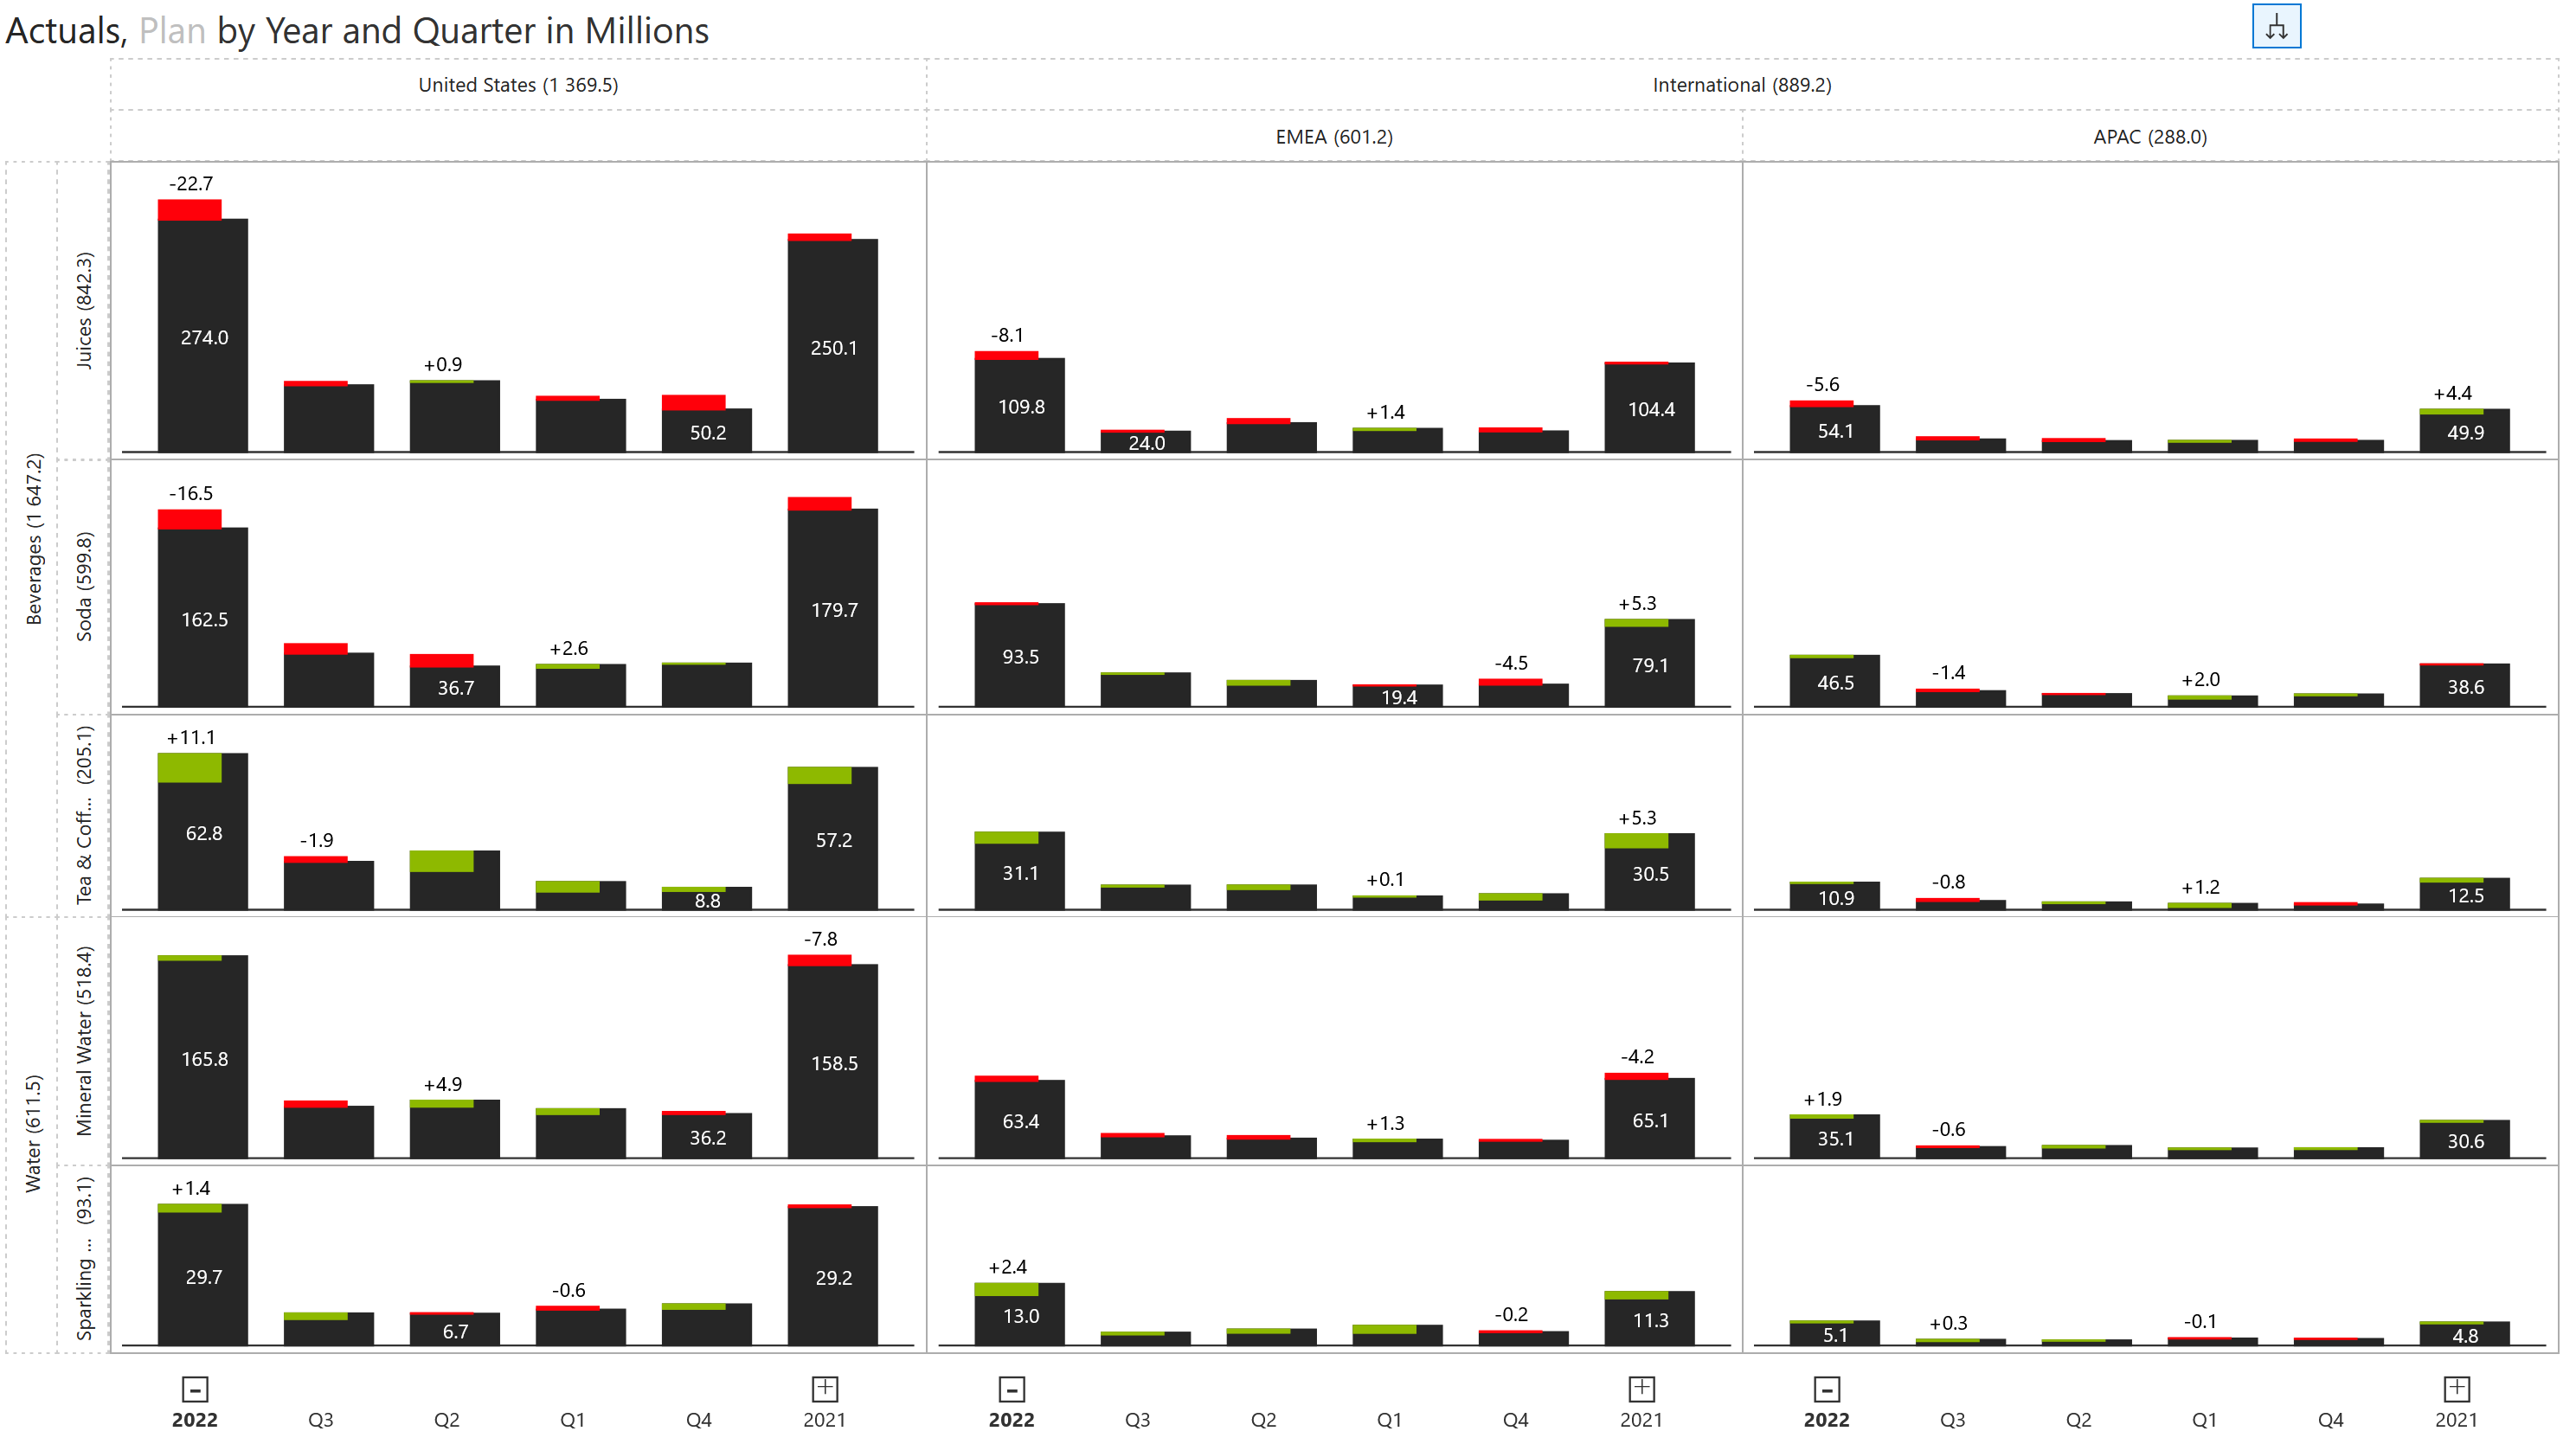
Experience a true multi-dimensional analysis experience in your IBCS reports. Add categories to rows, columns, axes, and legends, and enable hierarchy expand/collapse in rows, columns, and x-axis.
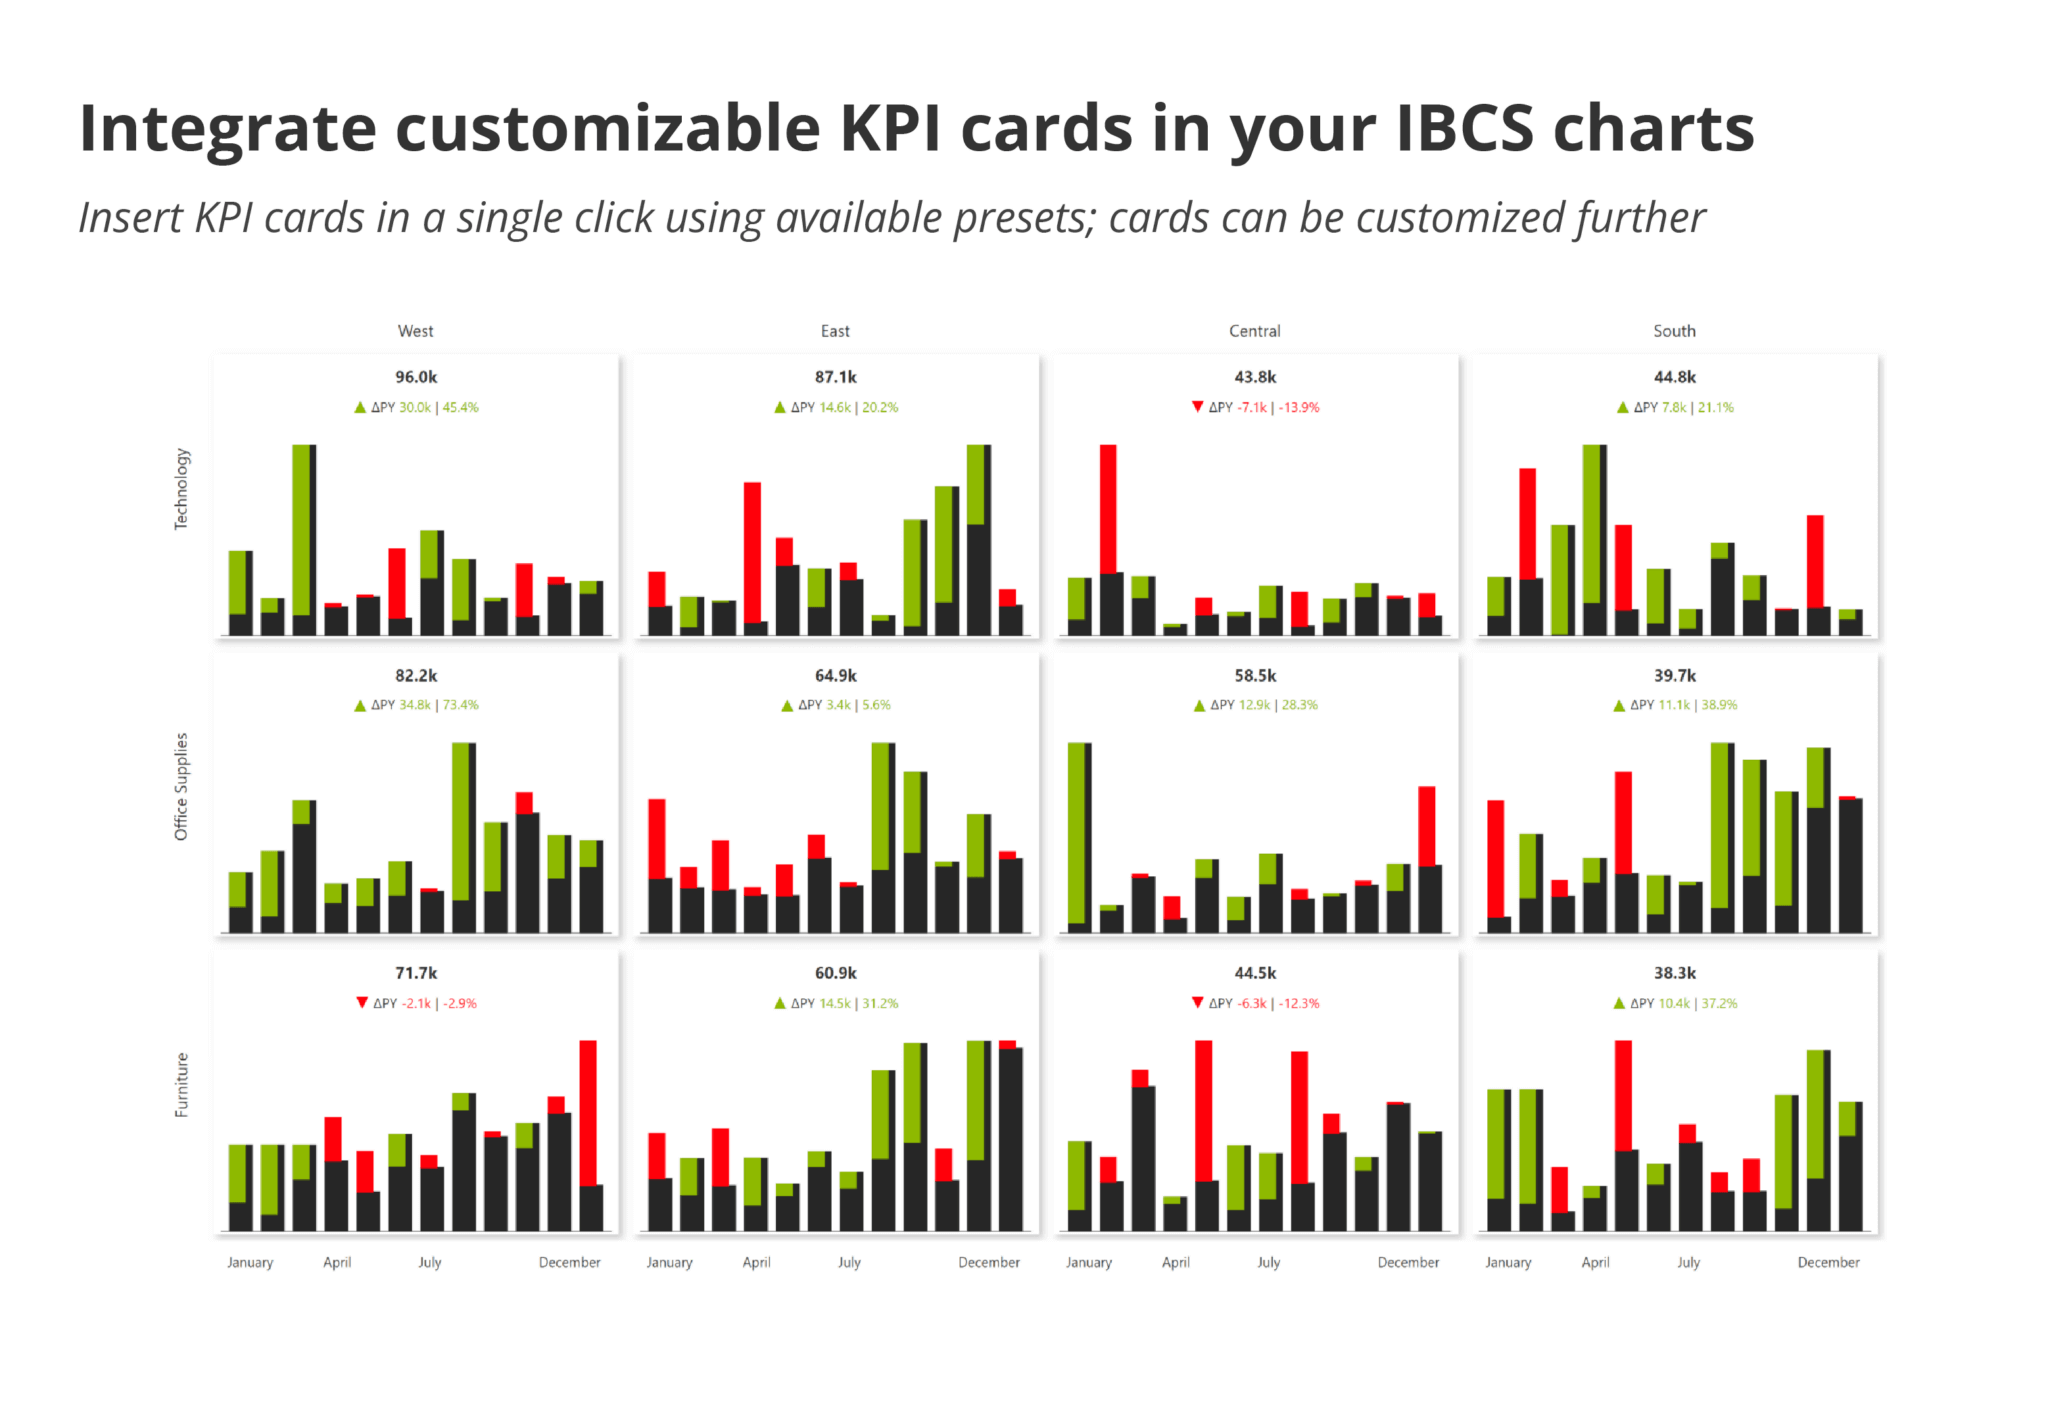
Insert KPI cards in a single click using available presets; cards can be customized further.
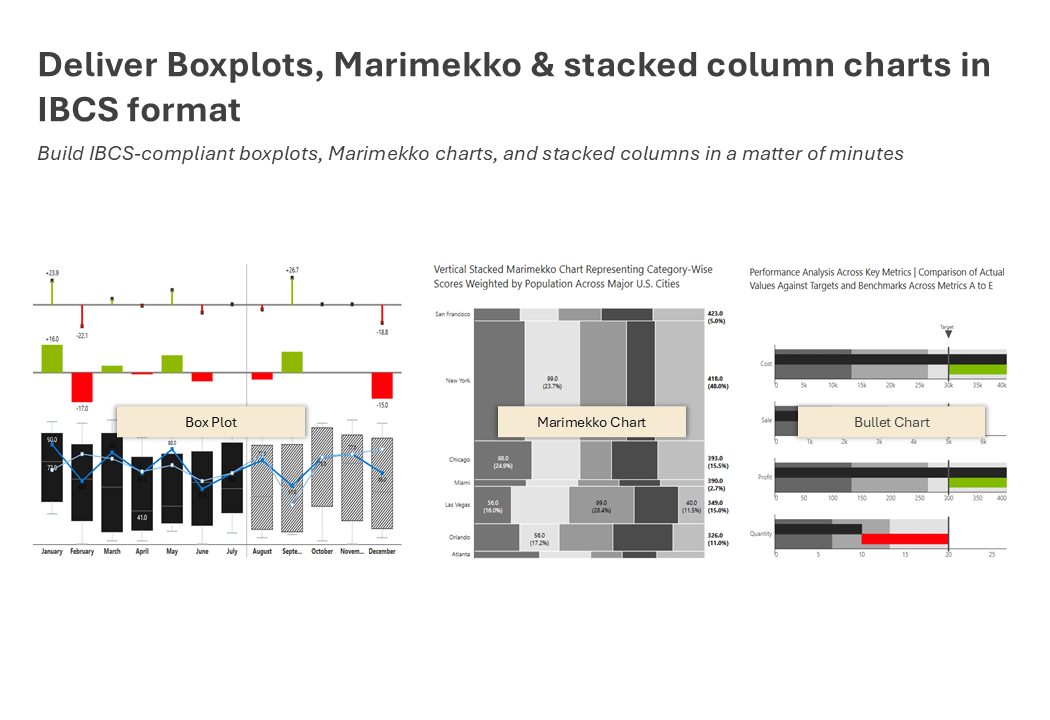
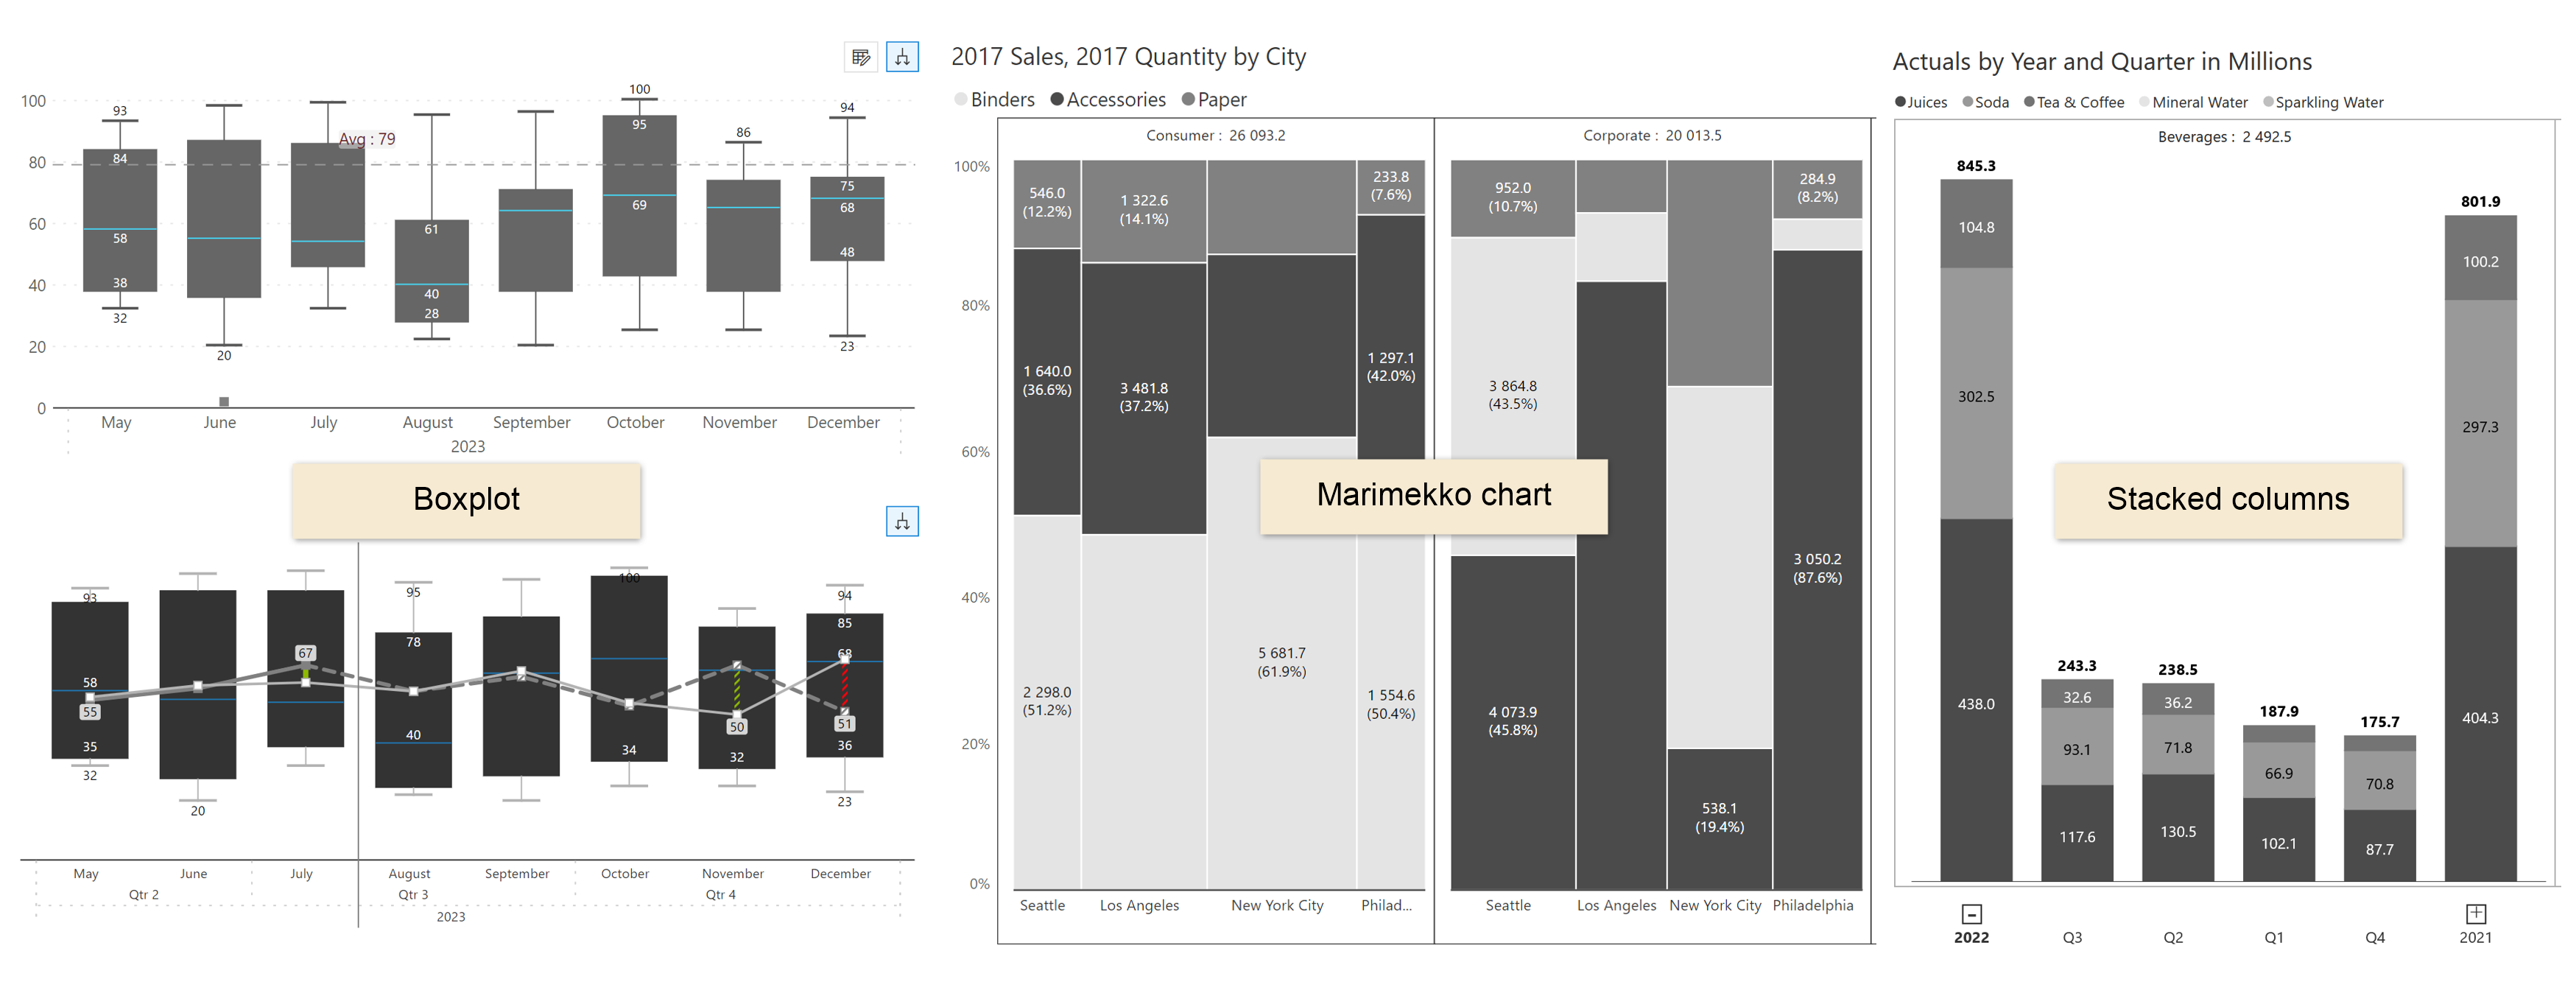
Build IBCS-compliant boxplots, Marimekko charts, and stacked columns in a matter of minutes.
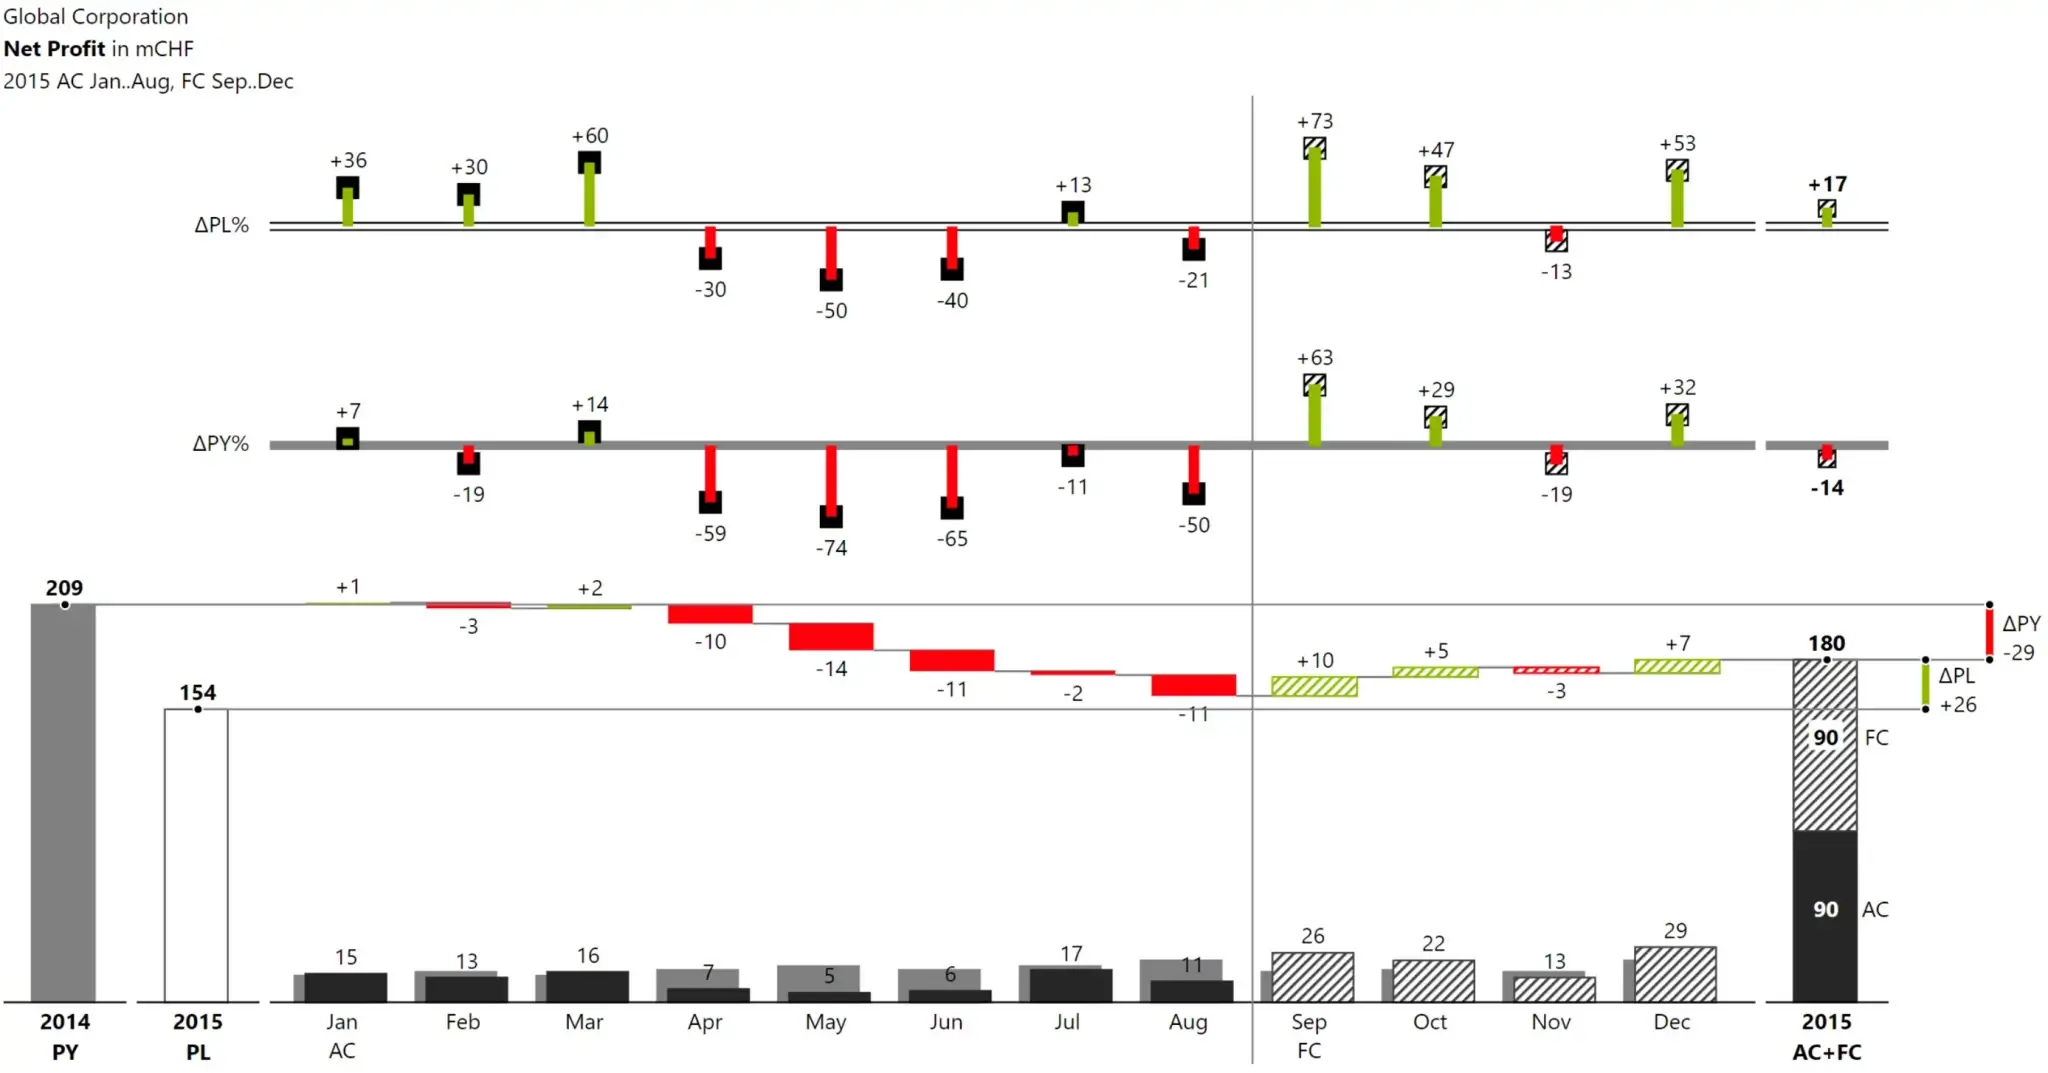
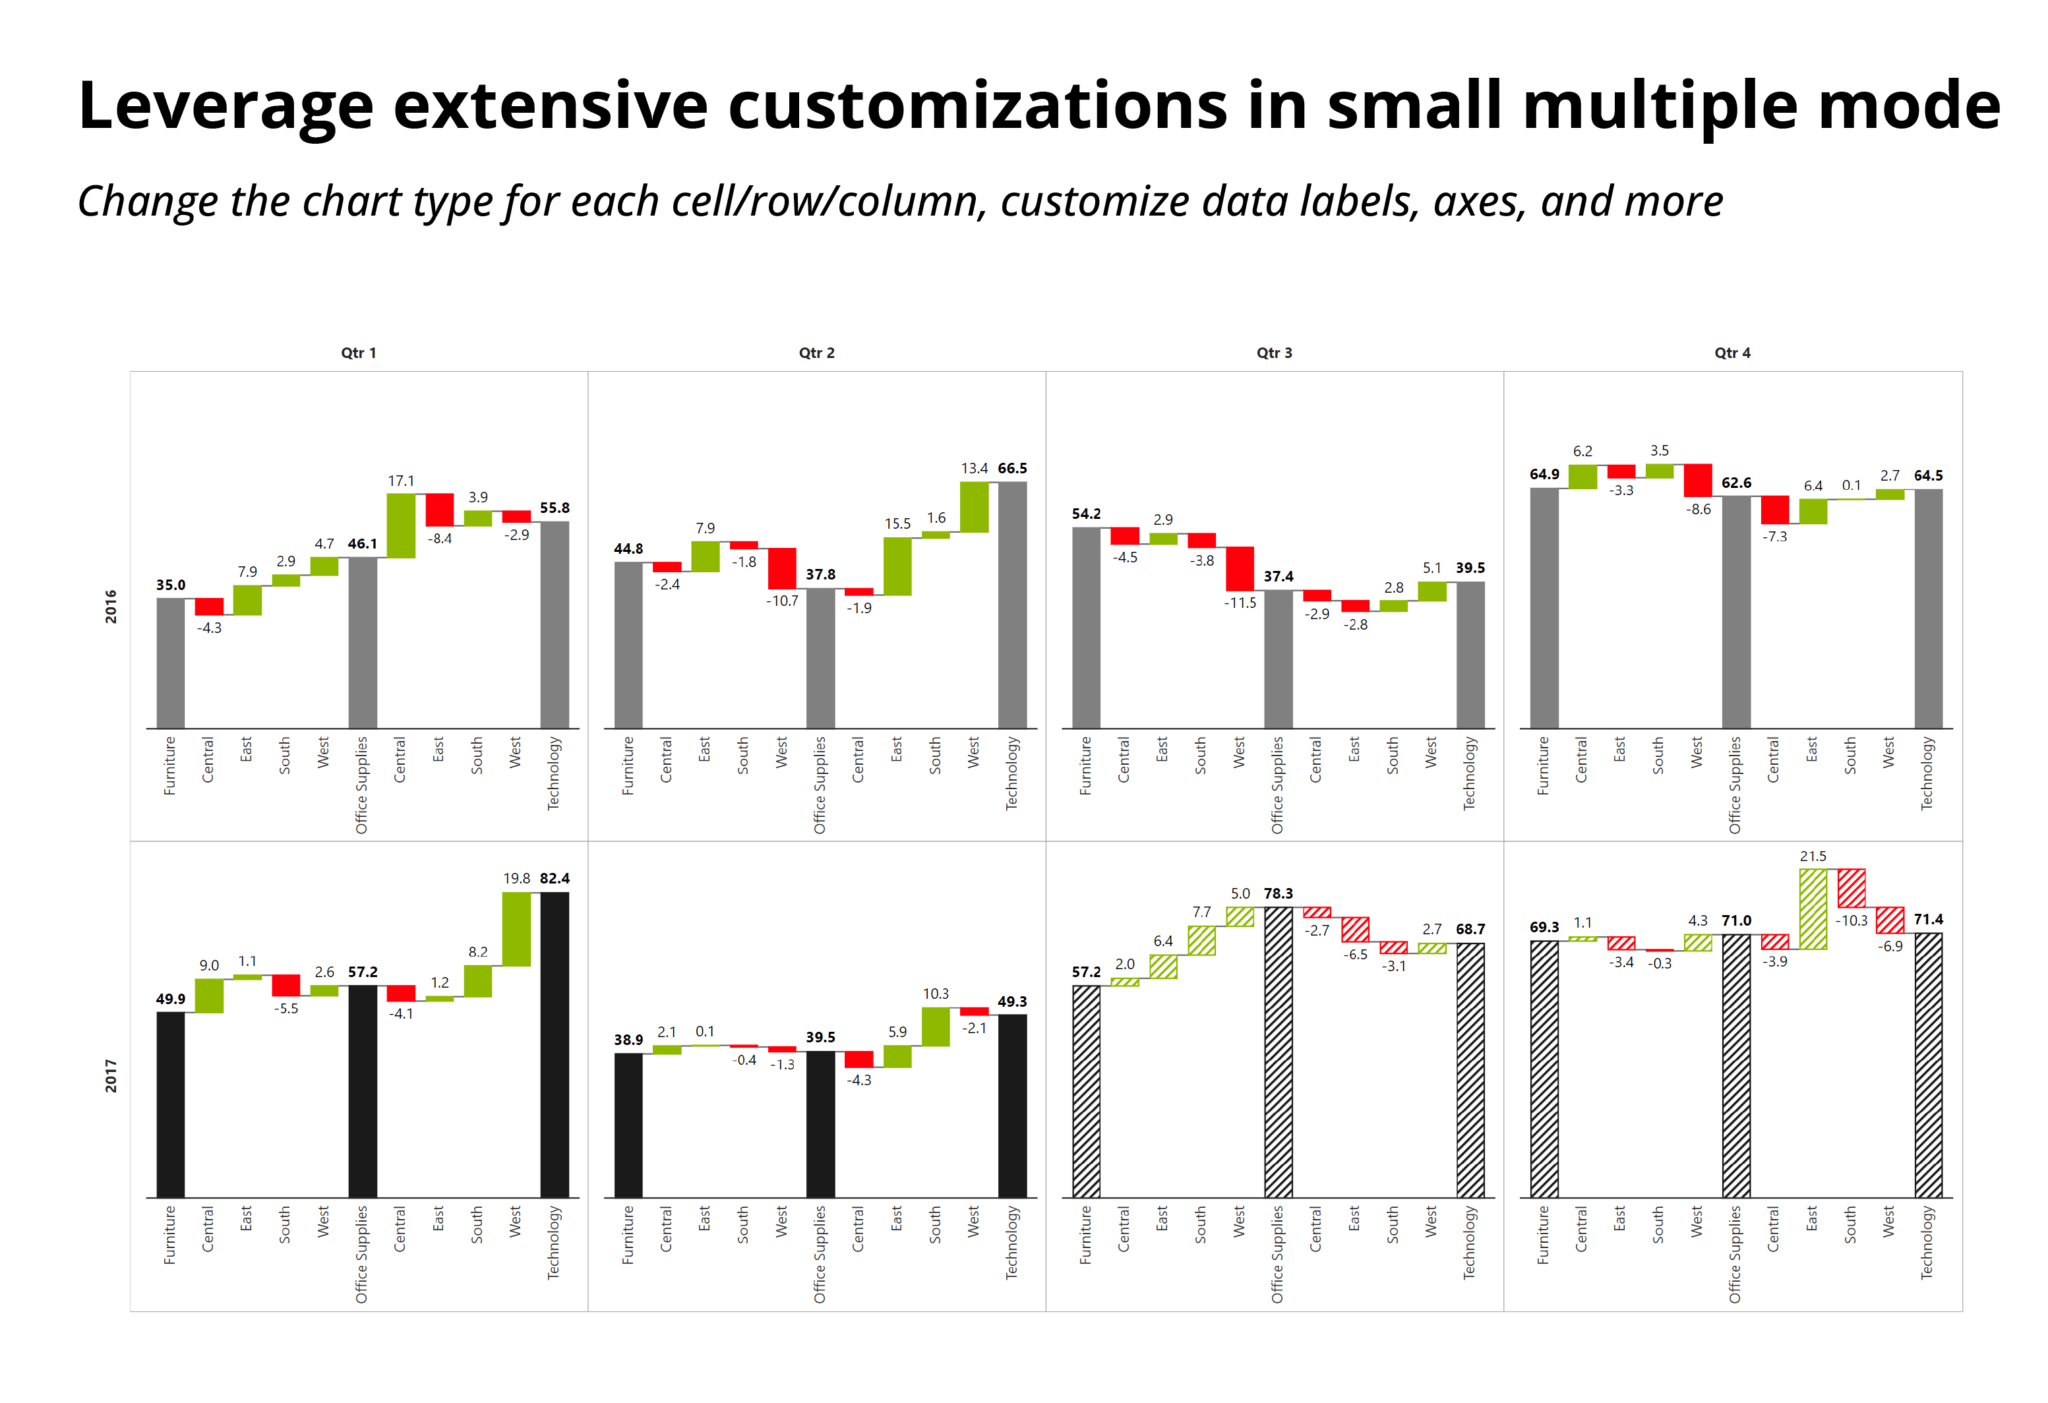
Tell compelling stories using dynamic data-level comments. It supports options such as small multiples, vertical text orientation, dynamic data tags, and more.
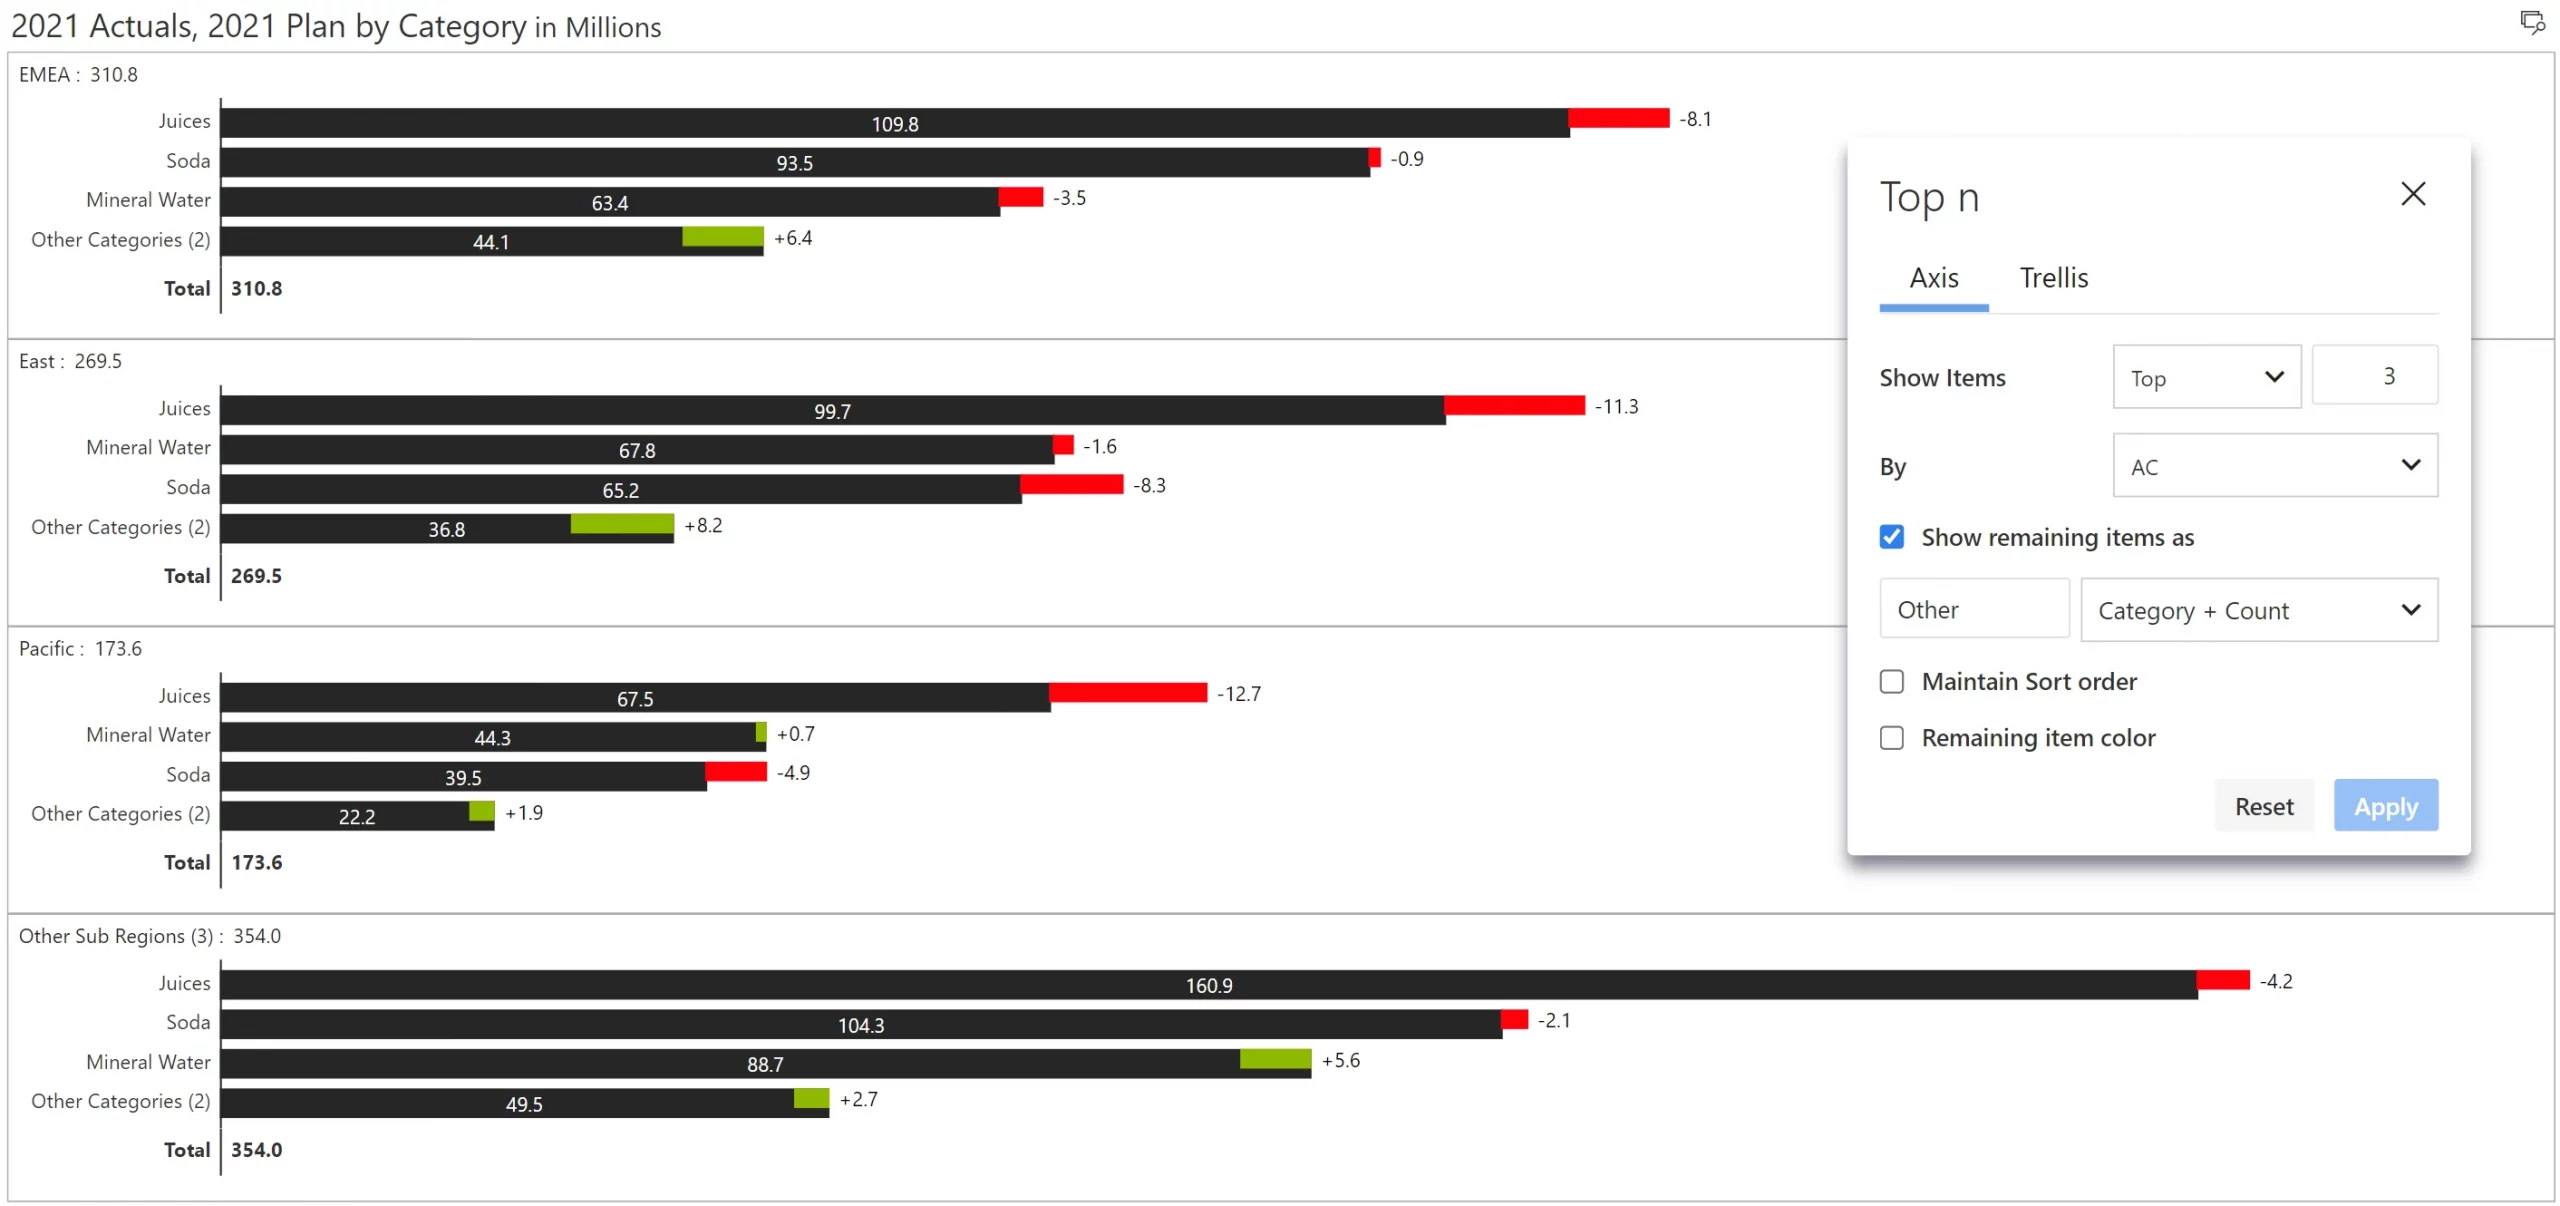
Filter the top/bottom N categories and display the rest as others.
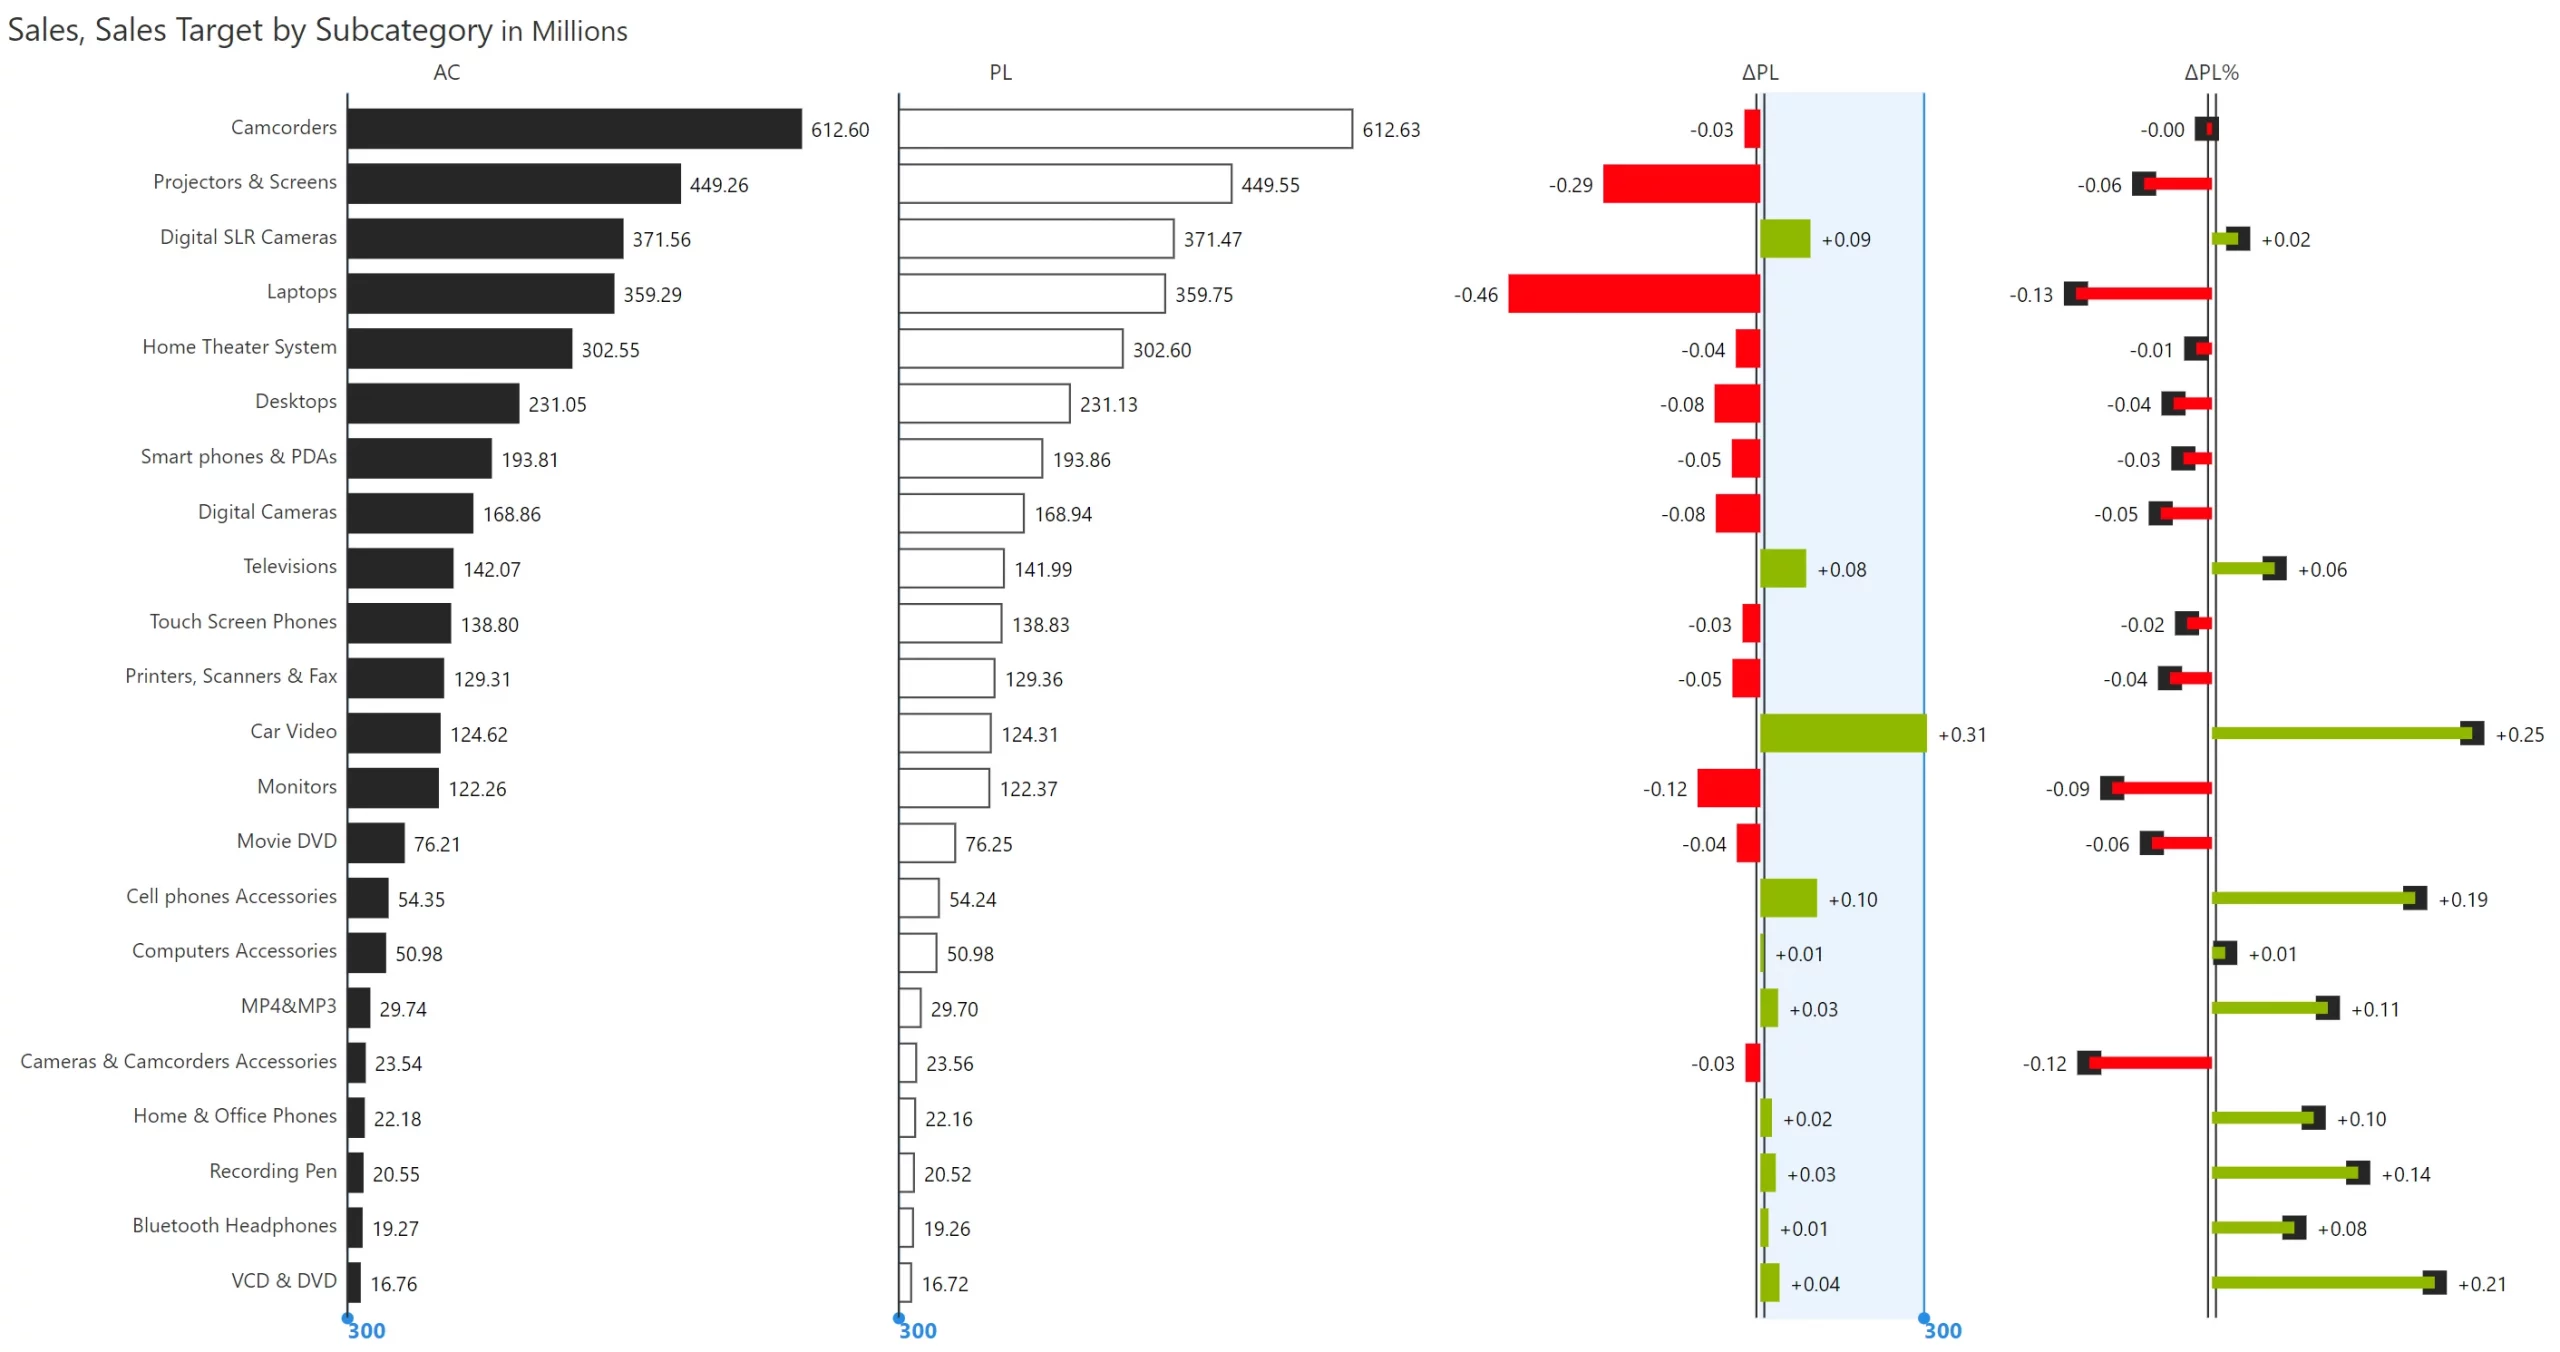
The scale bands, introduced from IBCS version 1.1, help magnify smaller variances thereby enhancing readability
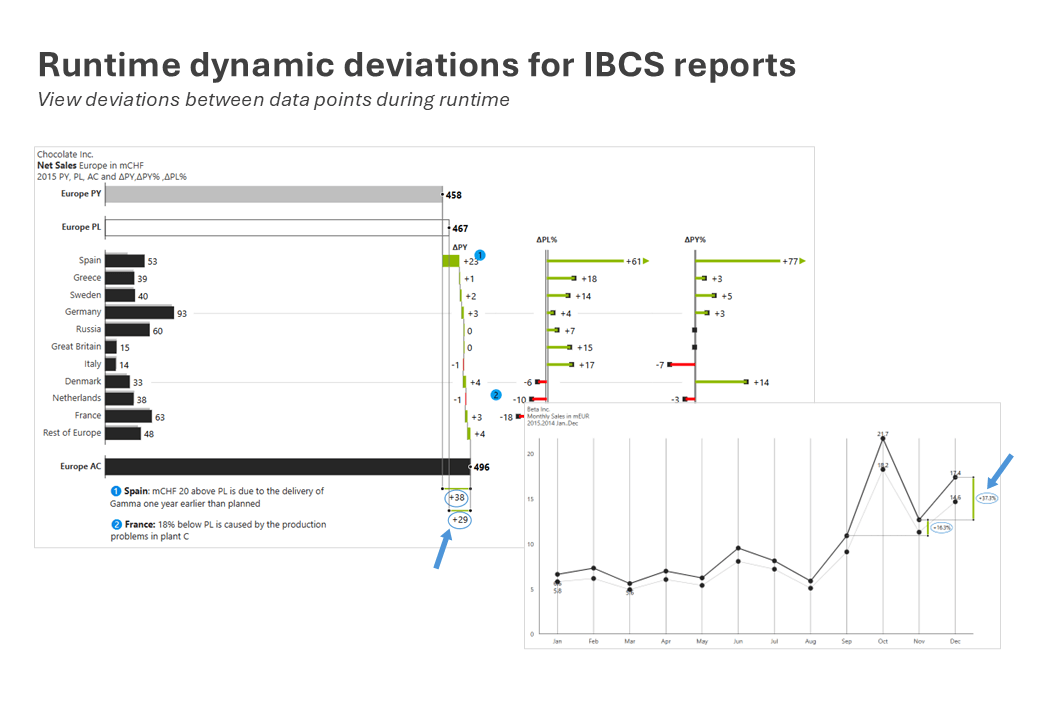
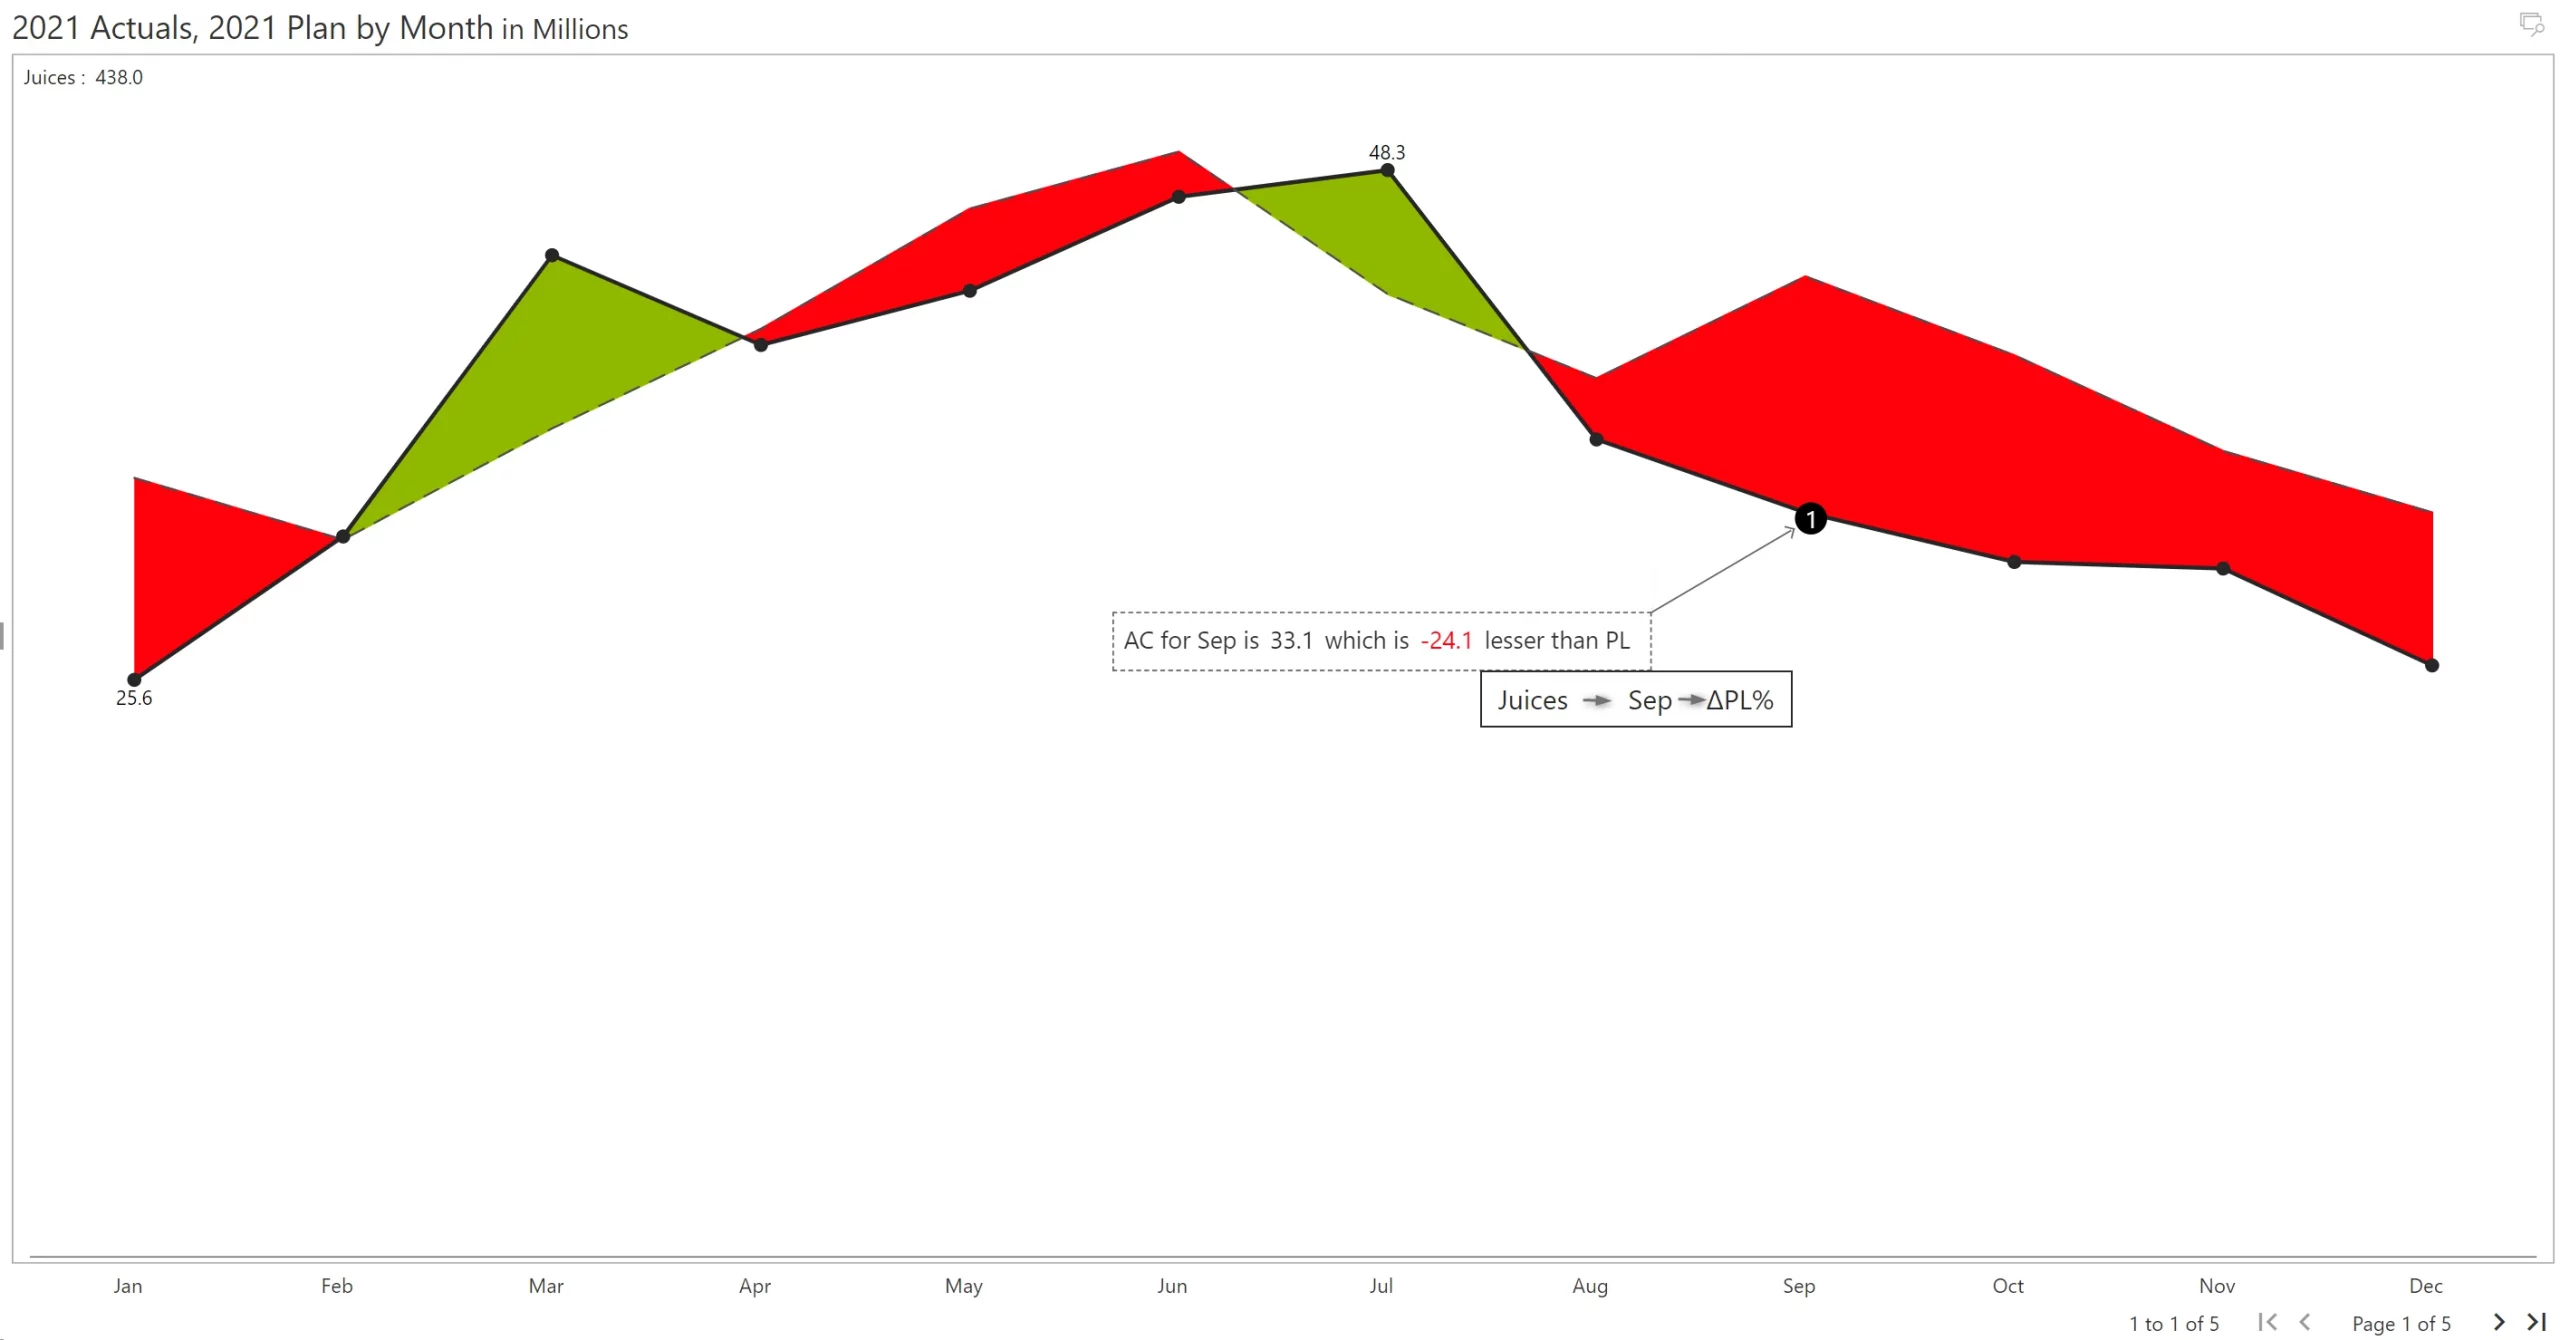
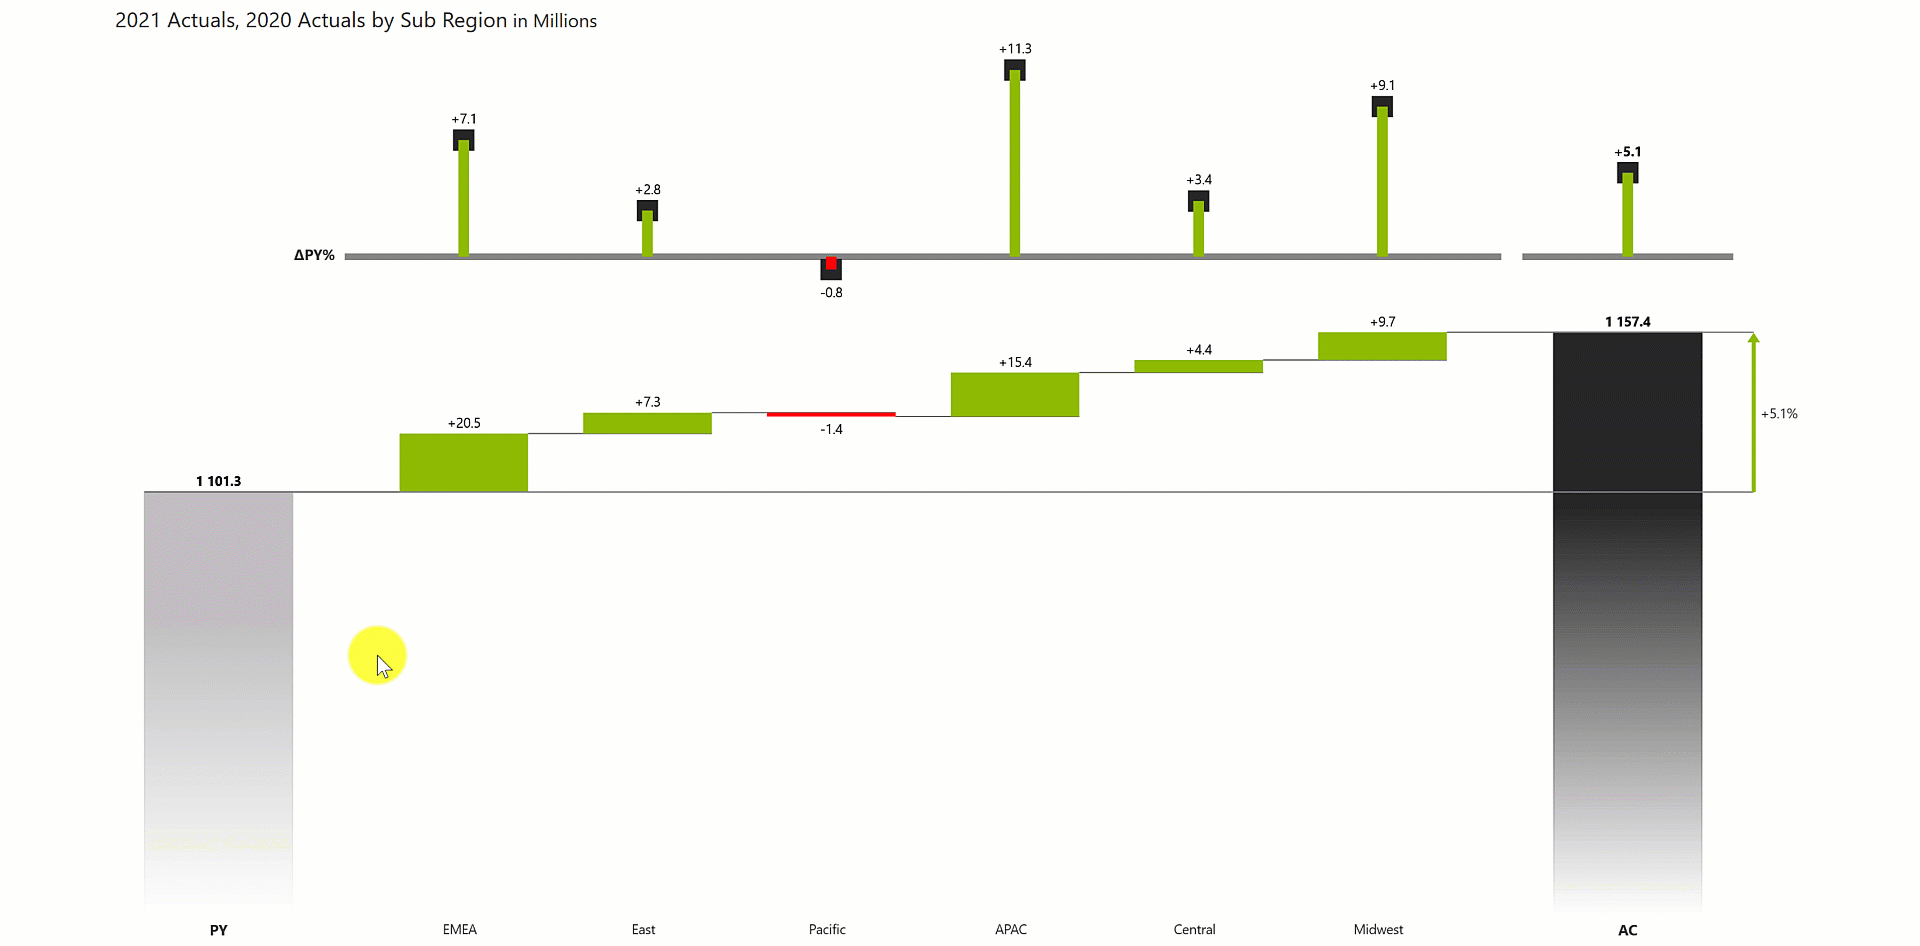
View deviation between two data points during runtime.
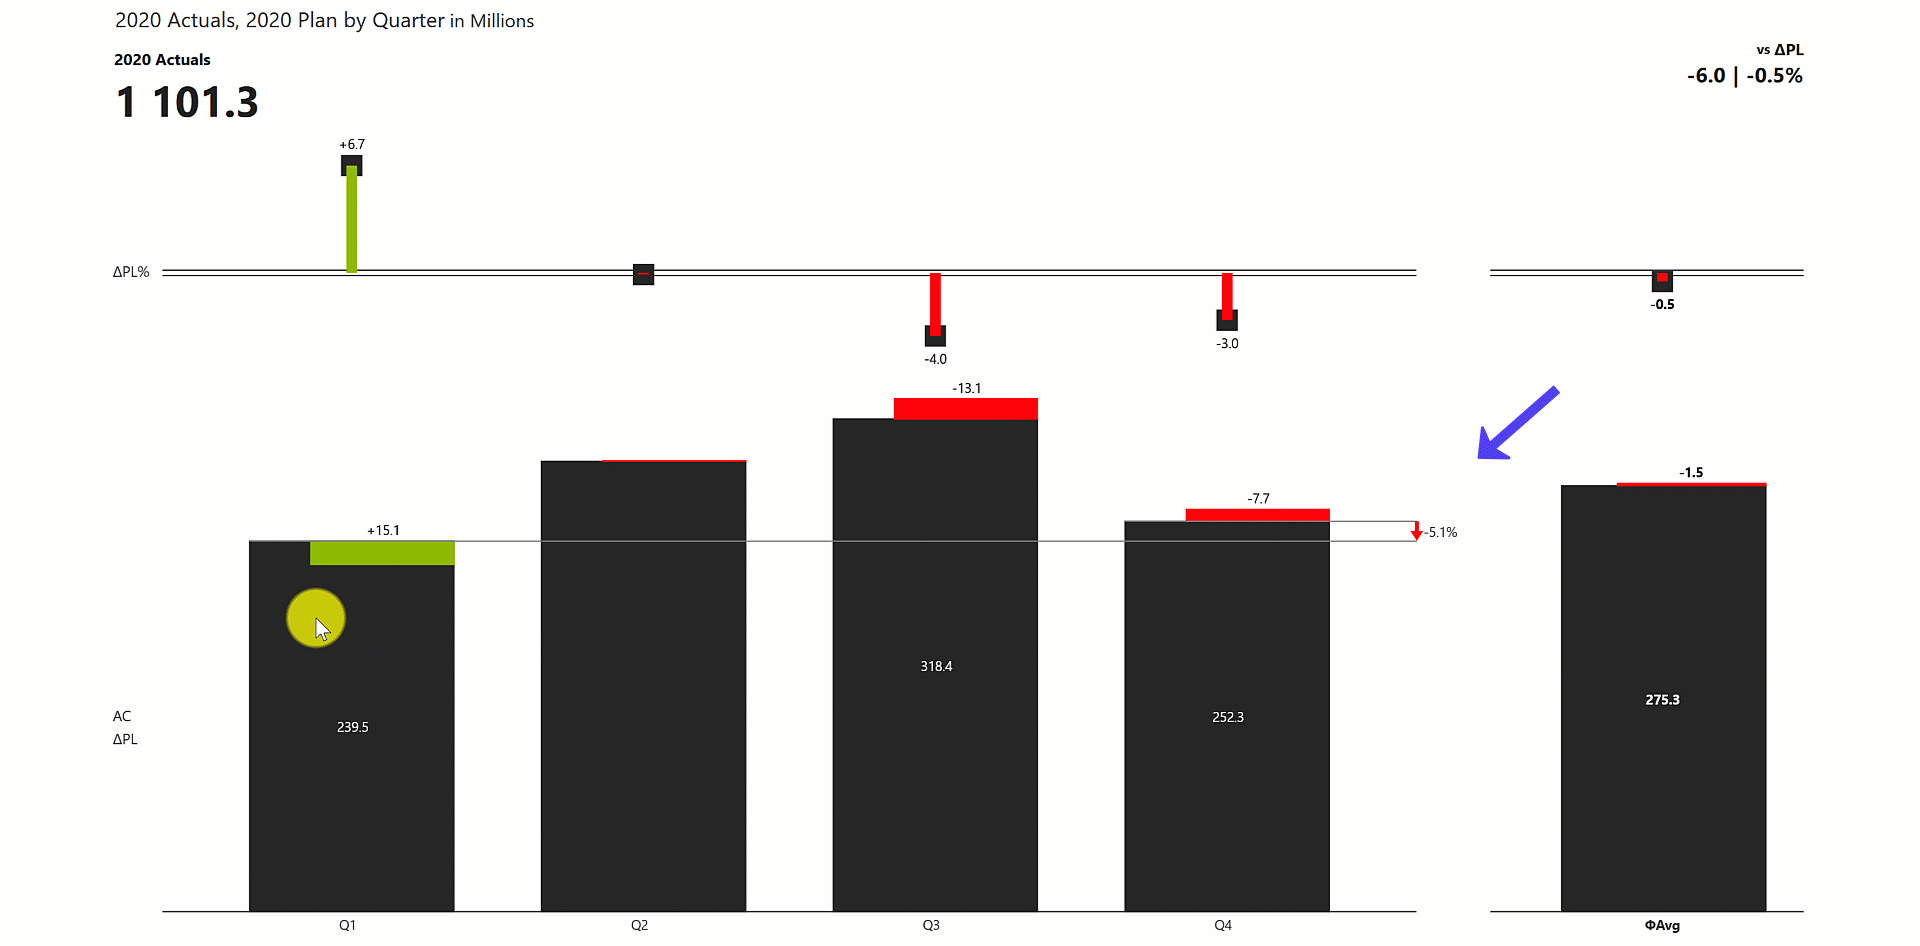
Dynamically re-size your Y axis to zoom into large value ranges with minimal deviations.
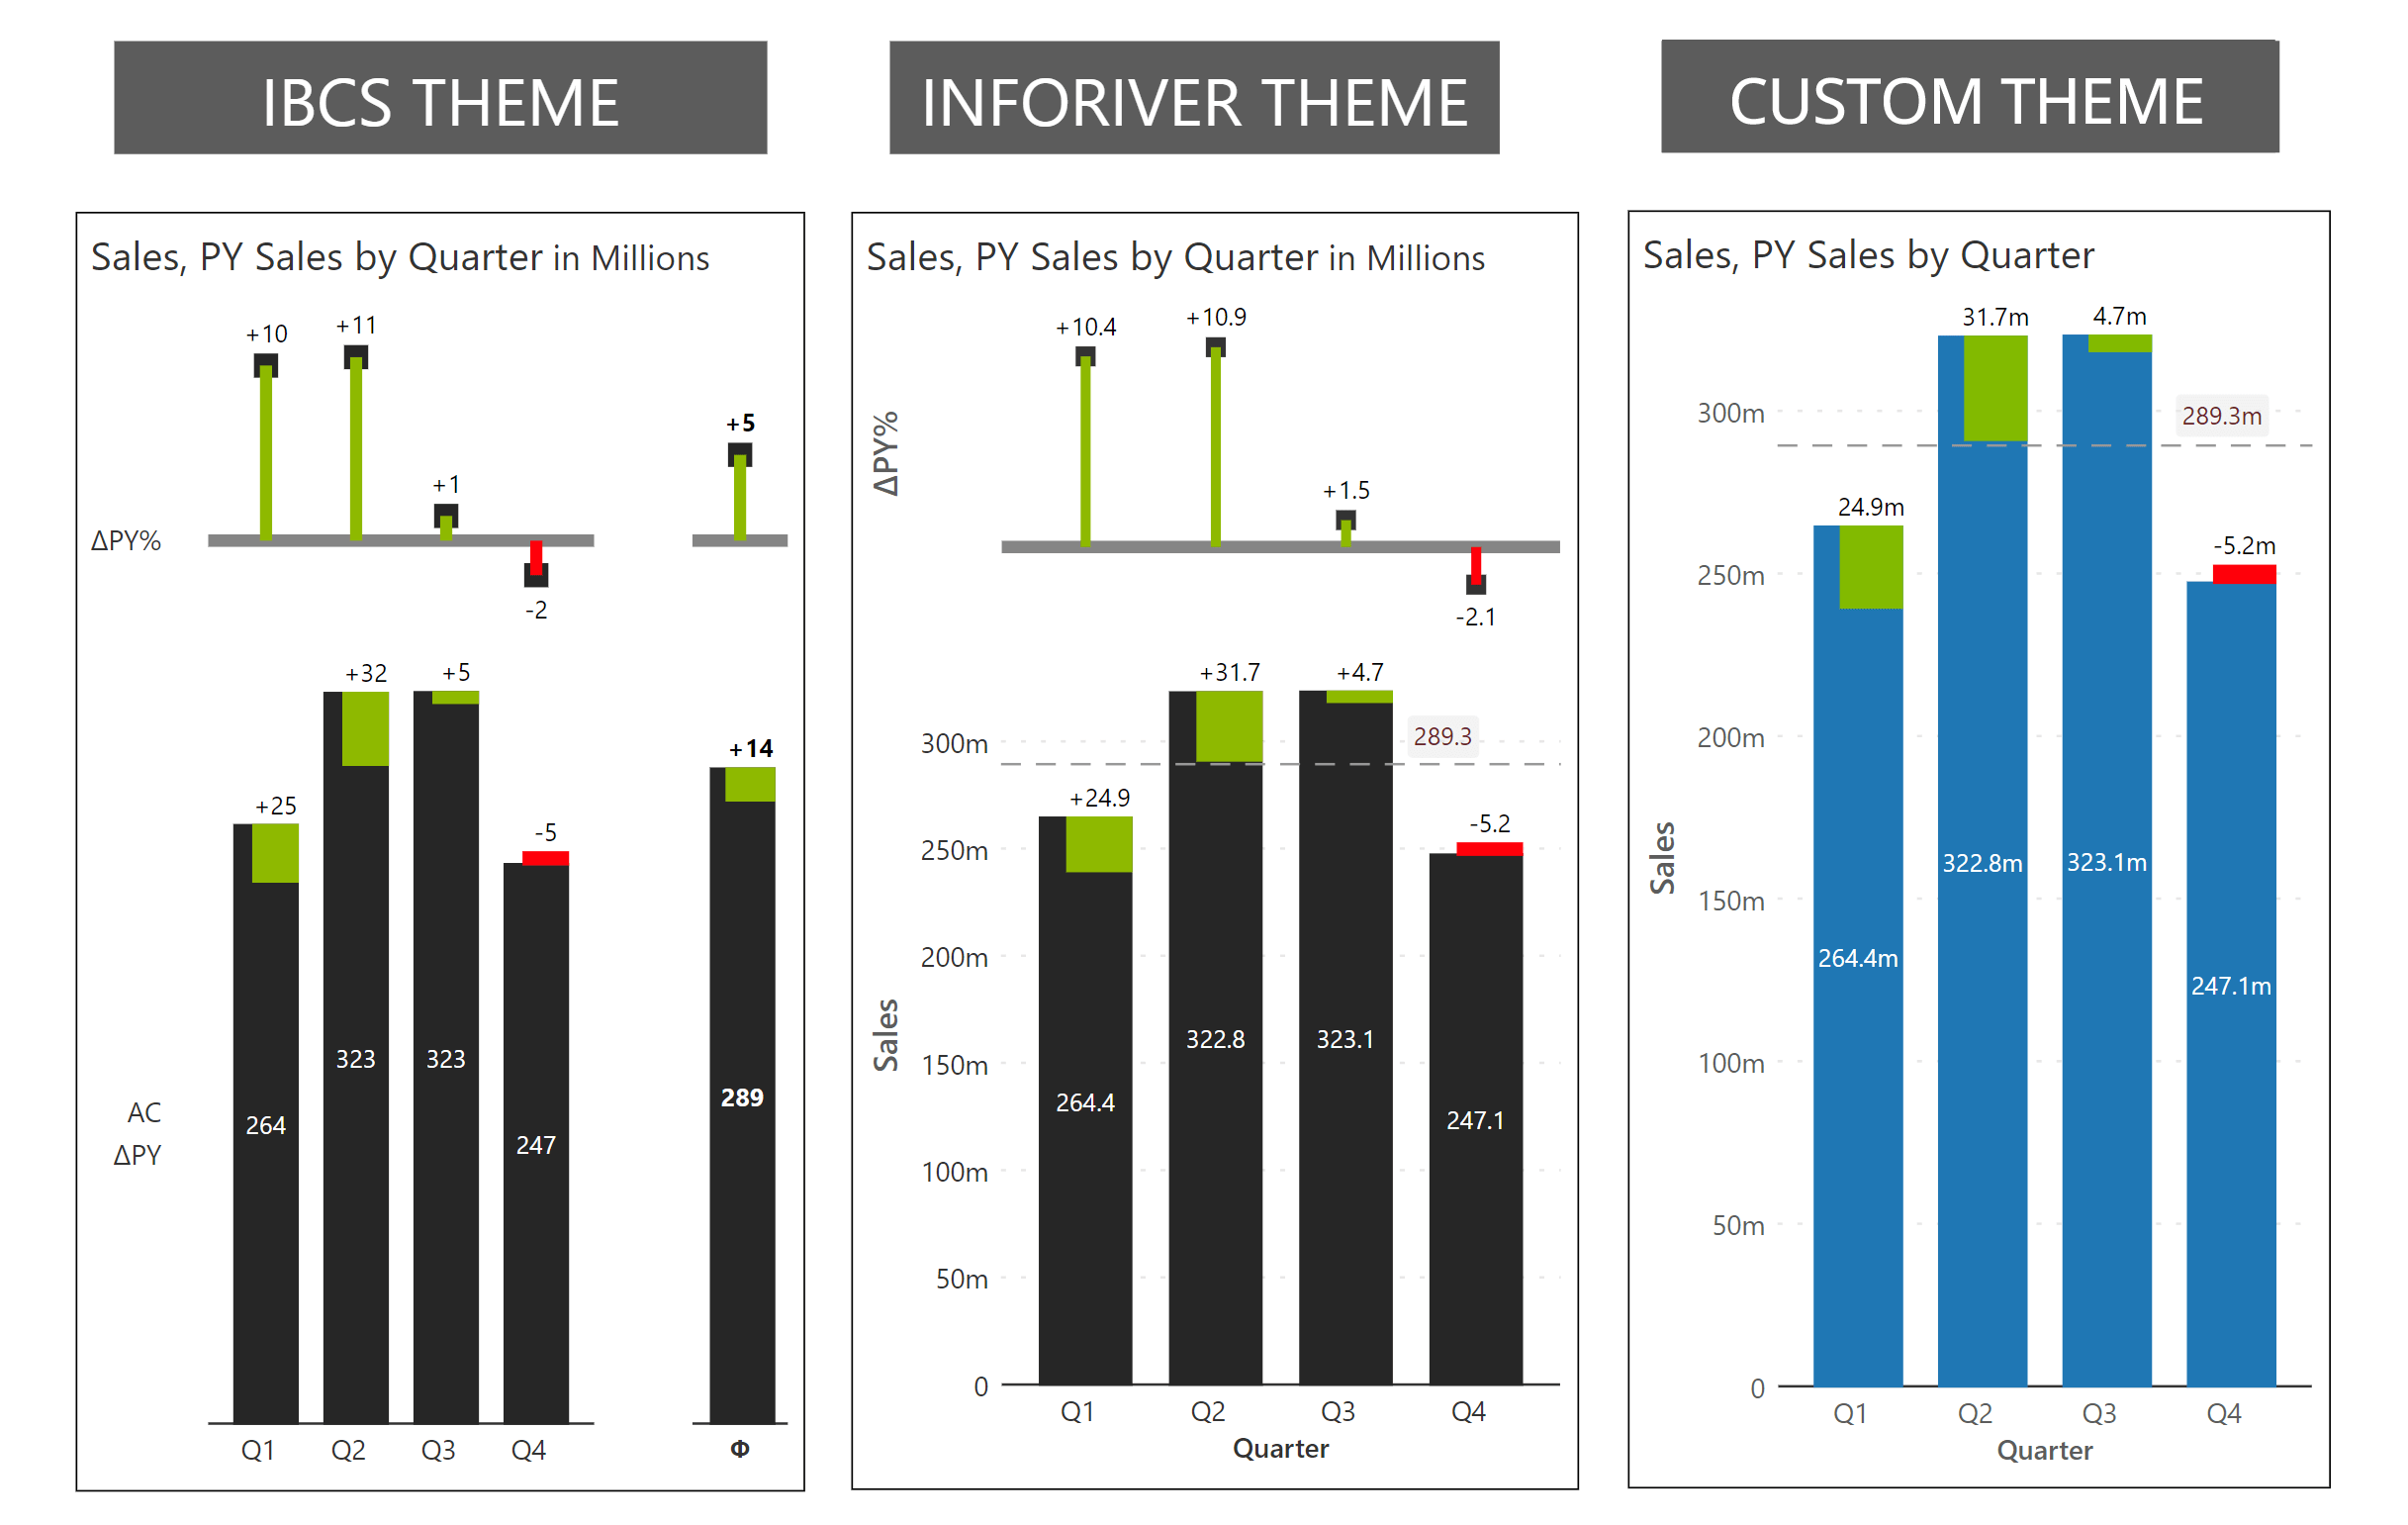
Customize theme options to blend IBCS standards with other visualization best practices.

Inforiver helps enterprises consolidate planning, reporting & analytics on a single platform (Power BI). The no-code, self-service award-winning platform has been recognized as the industry’s best and is adopted by many Fortune 100 firms.
Inforiver is a product of Lumel, the #1 Power BI AppSource Partner. The firm serves over 3,000 customers worldwide through its portfolio of products offered under the brands Inforiver, EDITable, ValQ, and xViz.
