Upcoming webinar on 'Inforiver Charts : The fastest way to deliver stories in Power BI', Aug 29th , Monday, 10.30 AM CST. Register Now
Upcoming webinar on 'Inforiver Charts : The fastest way to deliver stories in Power BI', Aug 29th , Monday, 10.30 AM CST. Register Now

Migrate from Tableau /Spotfire / Qlik / Think-cell
Dashboards & storyboards
100+Charts|Gantt|Cards|Tables
Visualization & storytelling
Migrate from Cognos, SAP WEBI/Crystal, WebFOCUS
Financial statements
Paginated reporting
IBCS Variance reporting
Migrate from Excel, Hyperion, Cognos, TM1, Anaplan, SAP BPC / SAC, OneStream
Data input templates
Planning & forecasting
Writeback
Migrate from Excel, Airtable, Smartsheet
Editable table
Approval workflow
Writeback
Date & Time: Thursday May 21, 2026, 10 AM CT
Speaker: Ashish Chandulal Babaria, Product Consultant, Lumel
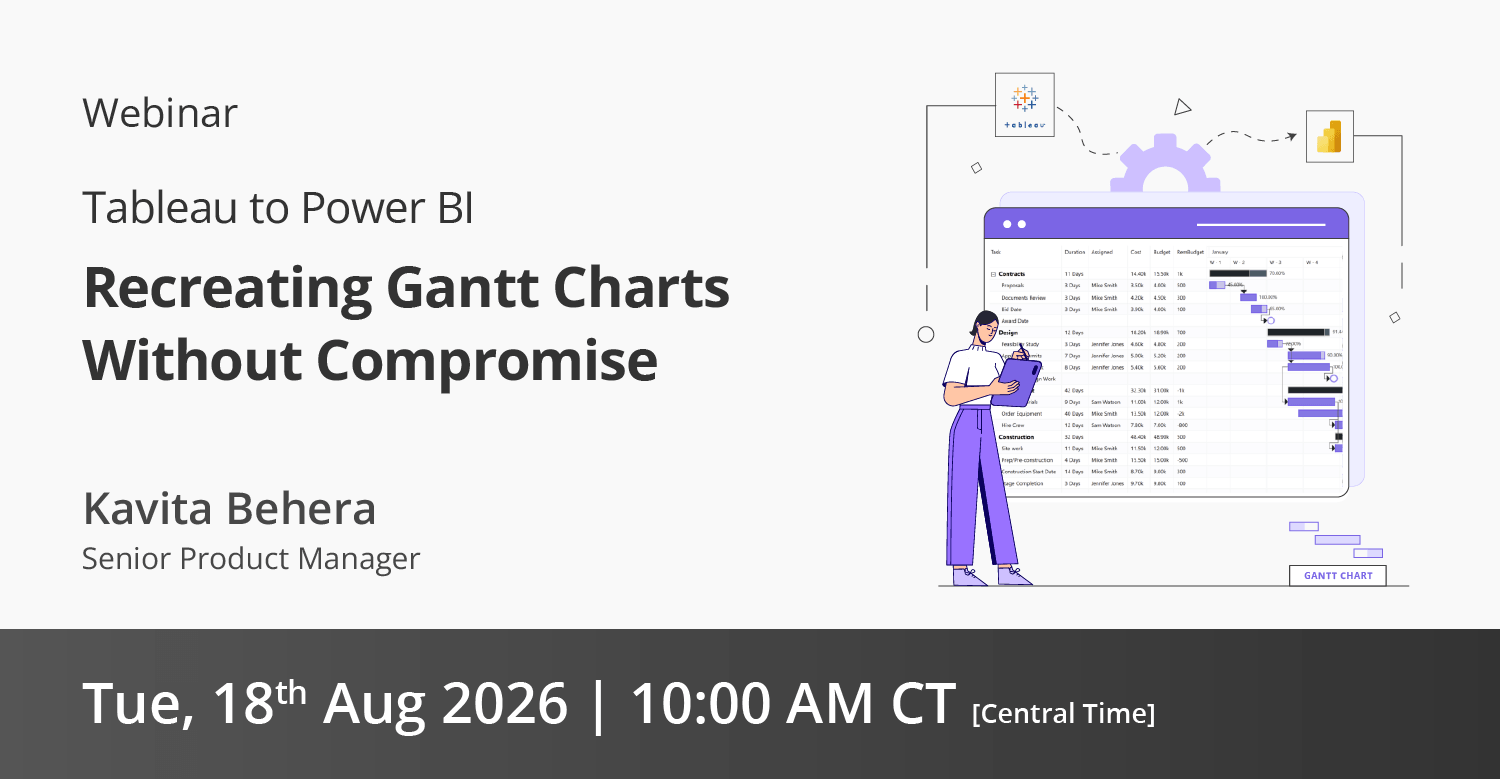
Kavita Behera
Senior Product Manager


I don’t think of Inforiver as just a custom visual. I think of it as the best in class solution to a wide range of problems that traditionally we were only able to solve with Excel. I can’t think of a better way to lift and shift your traditional Excel-marts into a modern Power BI platform.

Andre Fomin
Managing Director, obviEnce


Khaled Chowdhury
Former Global Director – Data & Analytics, CMC Materials
We are pleased to express our satisfaction with Inforiver's products, team, and support services, which have proven to be a truly refreshing and transformative experience for our organization. Writeback Matrix has played a pivotal role in empowering our operations, significantly expediting our planning processes, and enhancing the seamless flow of information within our enterprise.

Rajan Zejnuni
Manager Business Process & Data Intelligence, Adapa

Discover how the Inforiver BI Bundle streamlines enterprise reporting in Power BI with no-code visuals, consistent design, and faster report creation. This on-demand webinar walks you through the full suite—Analytics+, Reporting Matrix, Premium Table, and SuperFilter—while showcasing how teams can replace legacy tools and build interactive reports with ease.
Learn how to accelerate your migration from Tableau, Qlik, Cognos, Spotfire, and SAP to Power BI using Inforiver - featuring faster development, advanced visuals, and a live demo.

Discover 30 proven best practices to build lean, scalable, and lightning-fast Power BI reports with optimized models, clear visuals, and peak performance.
Get your questions answered, respond to other user queries, submit feature requests, catch up on recent product updates and more.

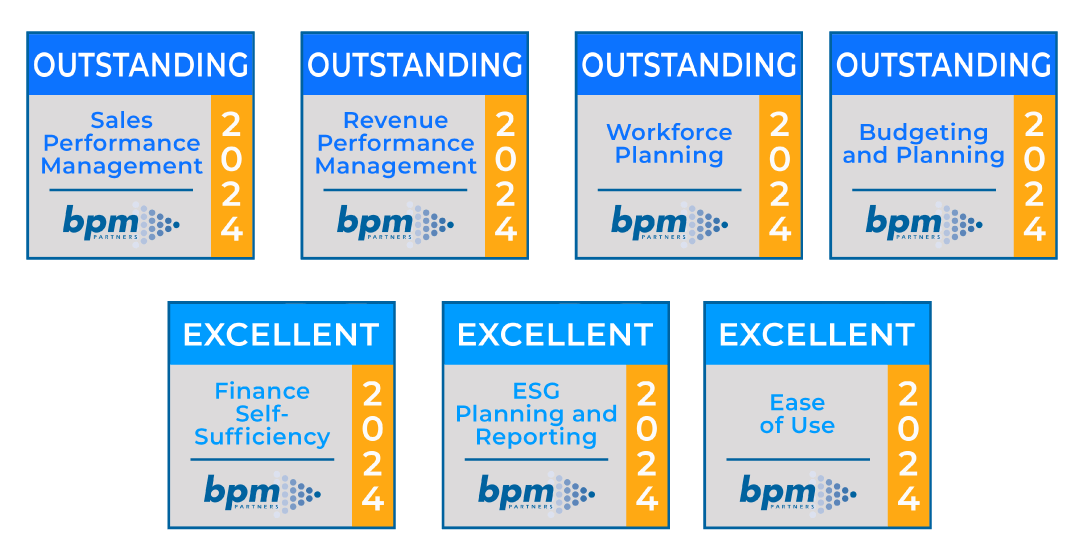
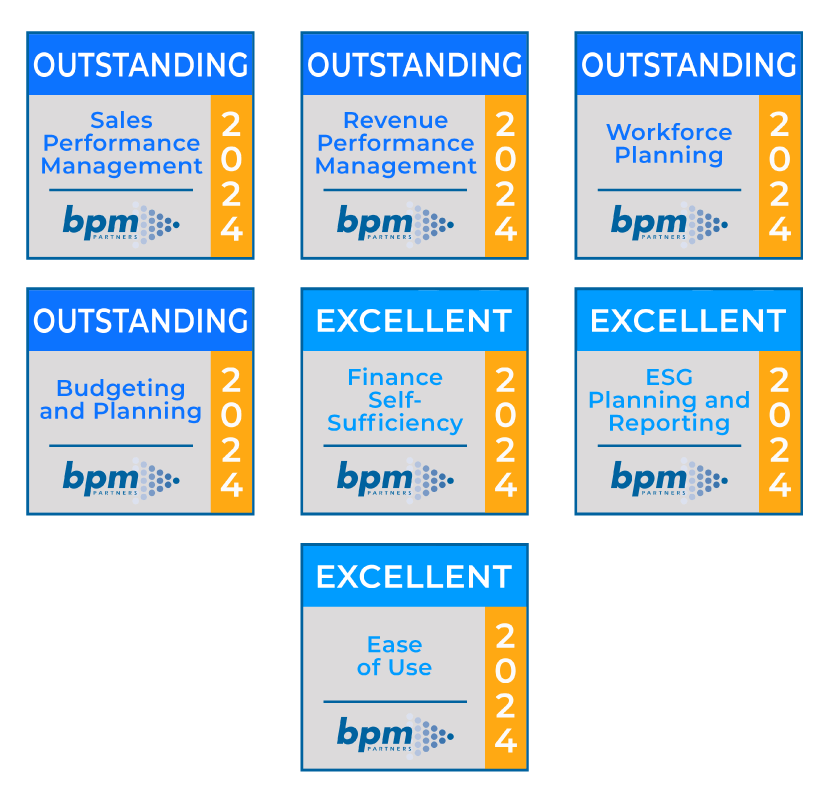
Inforiver helps enterprises consolidate planning, reporting & analytics on a single platform (Power BI). The no-code, self-service award-winning platform has been recognized as the industry’s best and is adopted by many Fortune 100 firms.
Inforiver is a product of Lumel, the #1 Power BI AppSource Partner. The firm serves over 3,000 customers worldwide through its portfolio of products offered under the brands Inforiver, EDITable, ValQ, and xViz.