
Upcoming webinar on 'Inforiver Charts : The fastest way to deliver stories in Power BI', Aug 29th , Monday, 10.30 AM CST. Register Now
Upcoming webinar on 'Inforiver Charts : The fastest way to deliver stories in Power BI', Aug 29th , Monday, 10.30 AM CST. Register Now

Create interactive, formatted, and paginated reports in minutes. Explore features like page breaks, filters, and formatted headers with Inforiver's Report+.
Paginated reports display operational and transactional data spanning multiple pages and are ideal for printing. Power BI Report Builder is the standalone tool for authoring paginated reports for the Power BI service. There are several limitations to using Power BI Report Builder, such as:
Limited interactivity - Paginated reports lack the interactive features found in other Power BI report types. They are designed for static viewing and are not suitable for ad-hoc data exploration or interactive analysis.
Complexity in design - Creating and designing paginated reports may require more effort and time compared to other Power BI report types due to their fixed layouts. Power BI Report Builder also has a different user interface and functionality than Power BI service, which might be new to the users.
Inforiver for Power BI offers a no-code paginated reporting solution that overcomes the above-mentioned limitations and delivers several key features.
Navigate between pages in the paginated report using the First-Previous-Next-Last navigation.
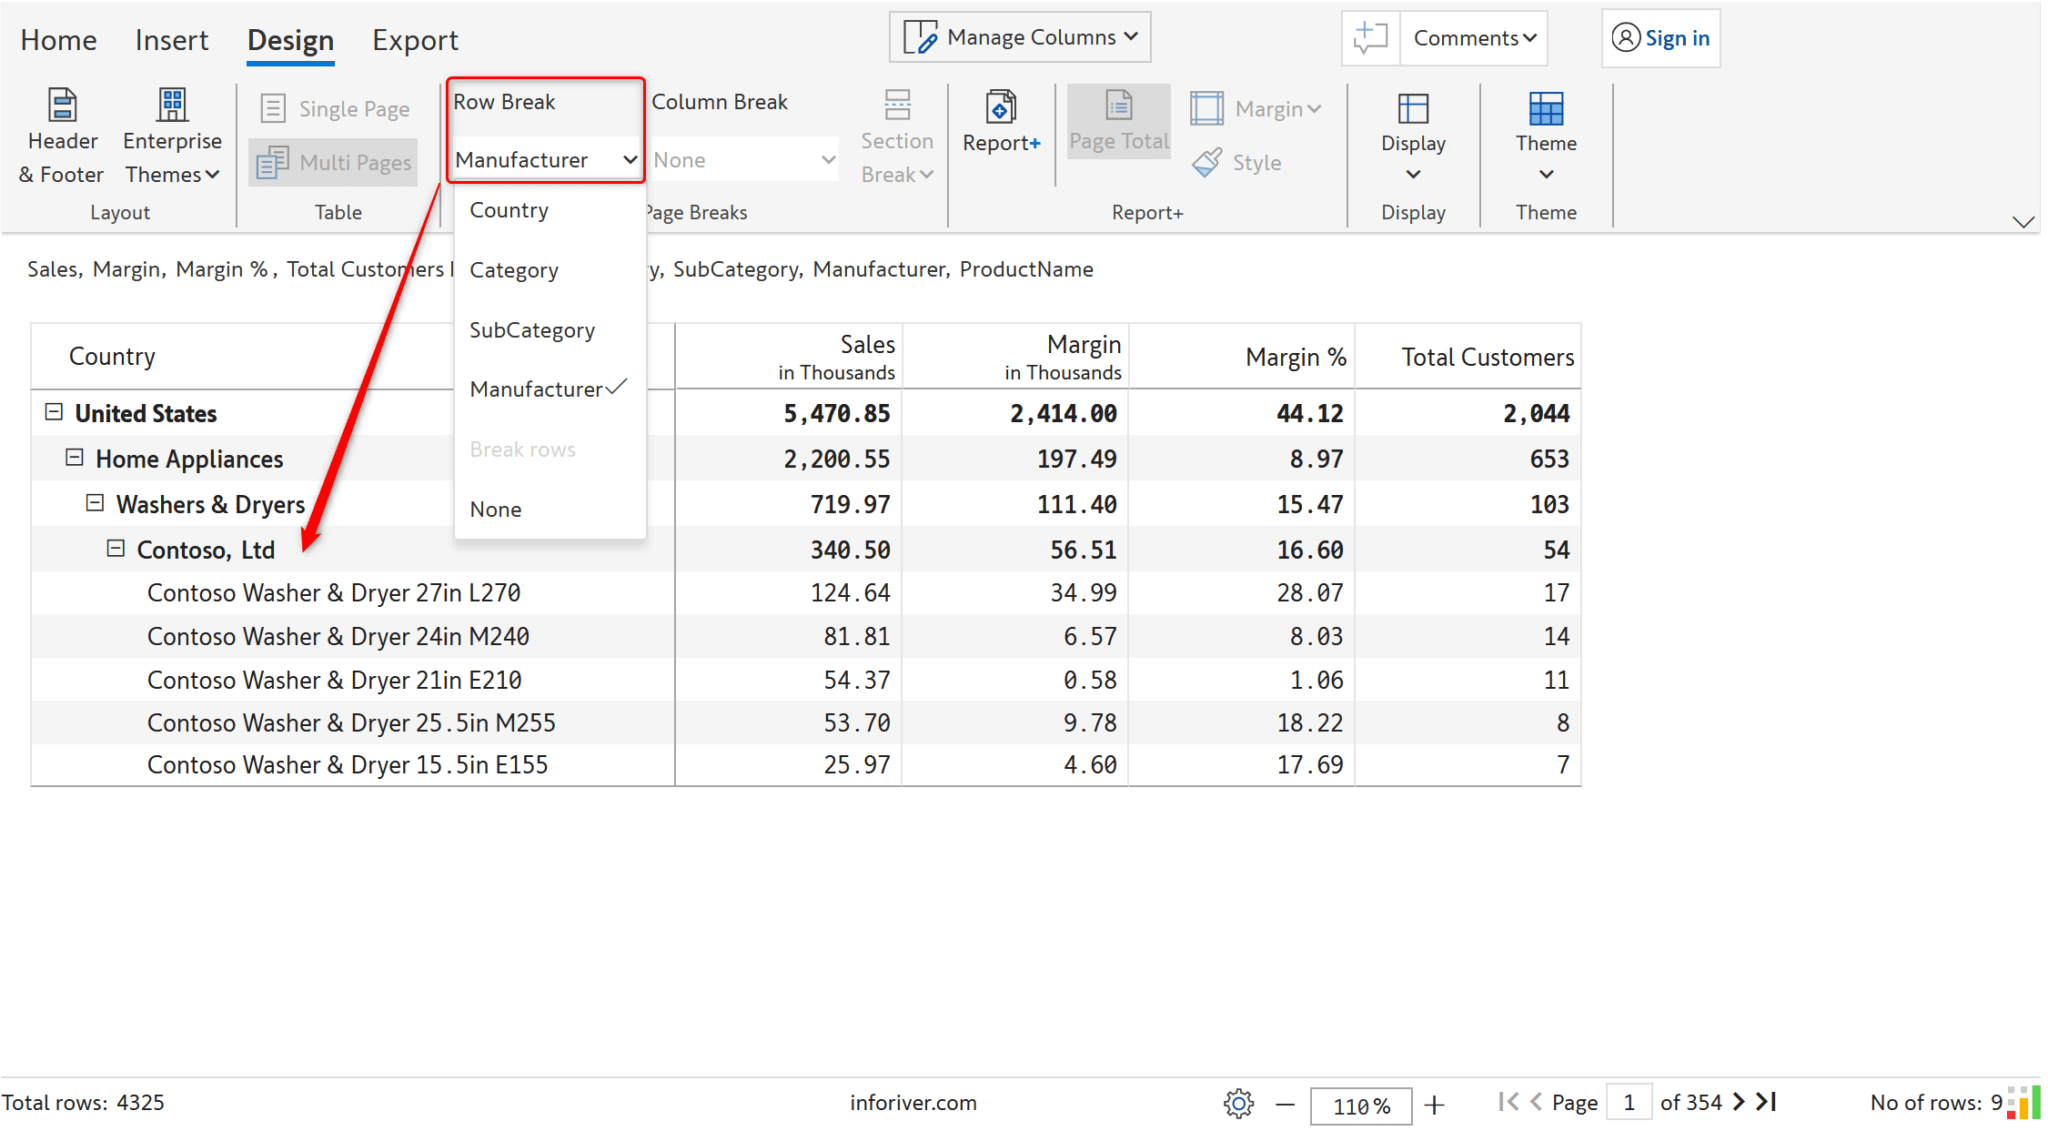
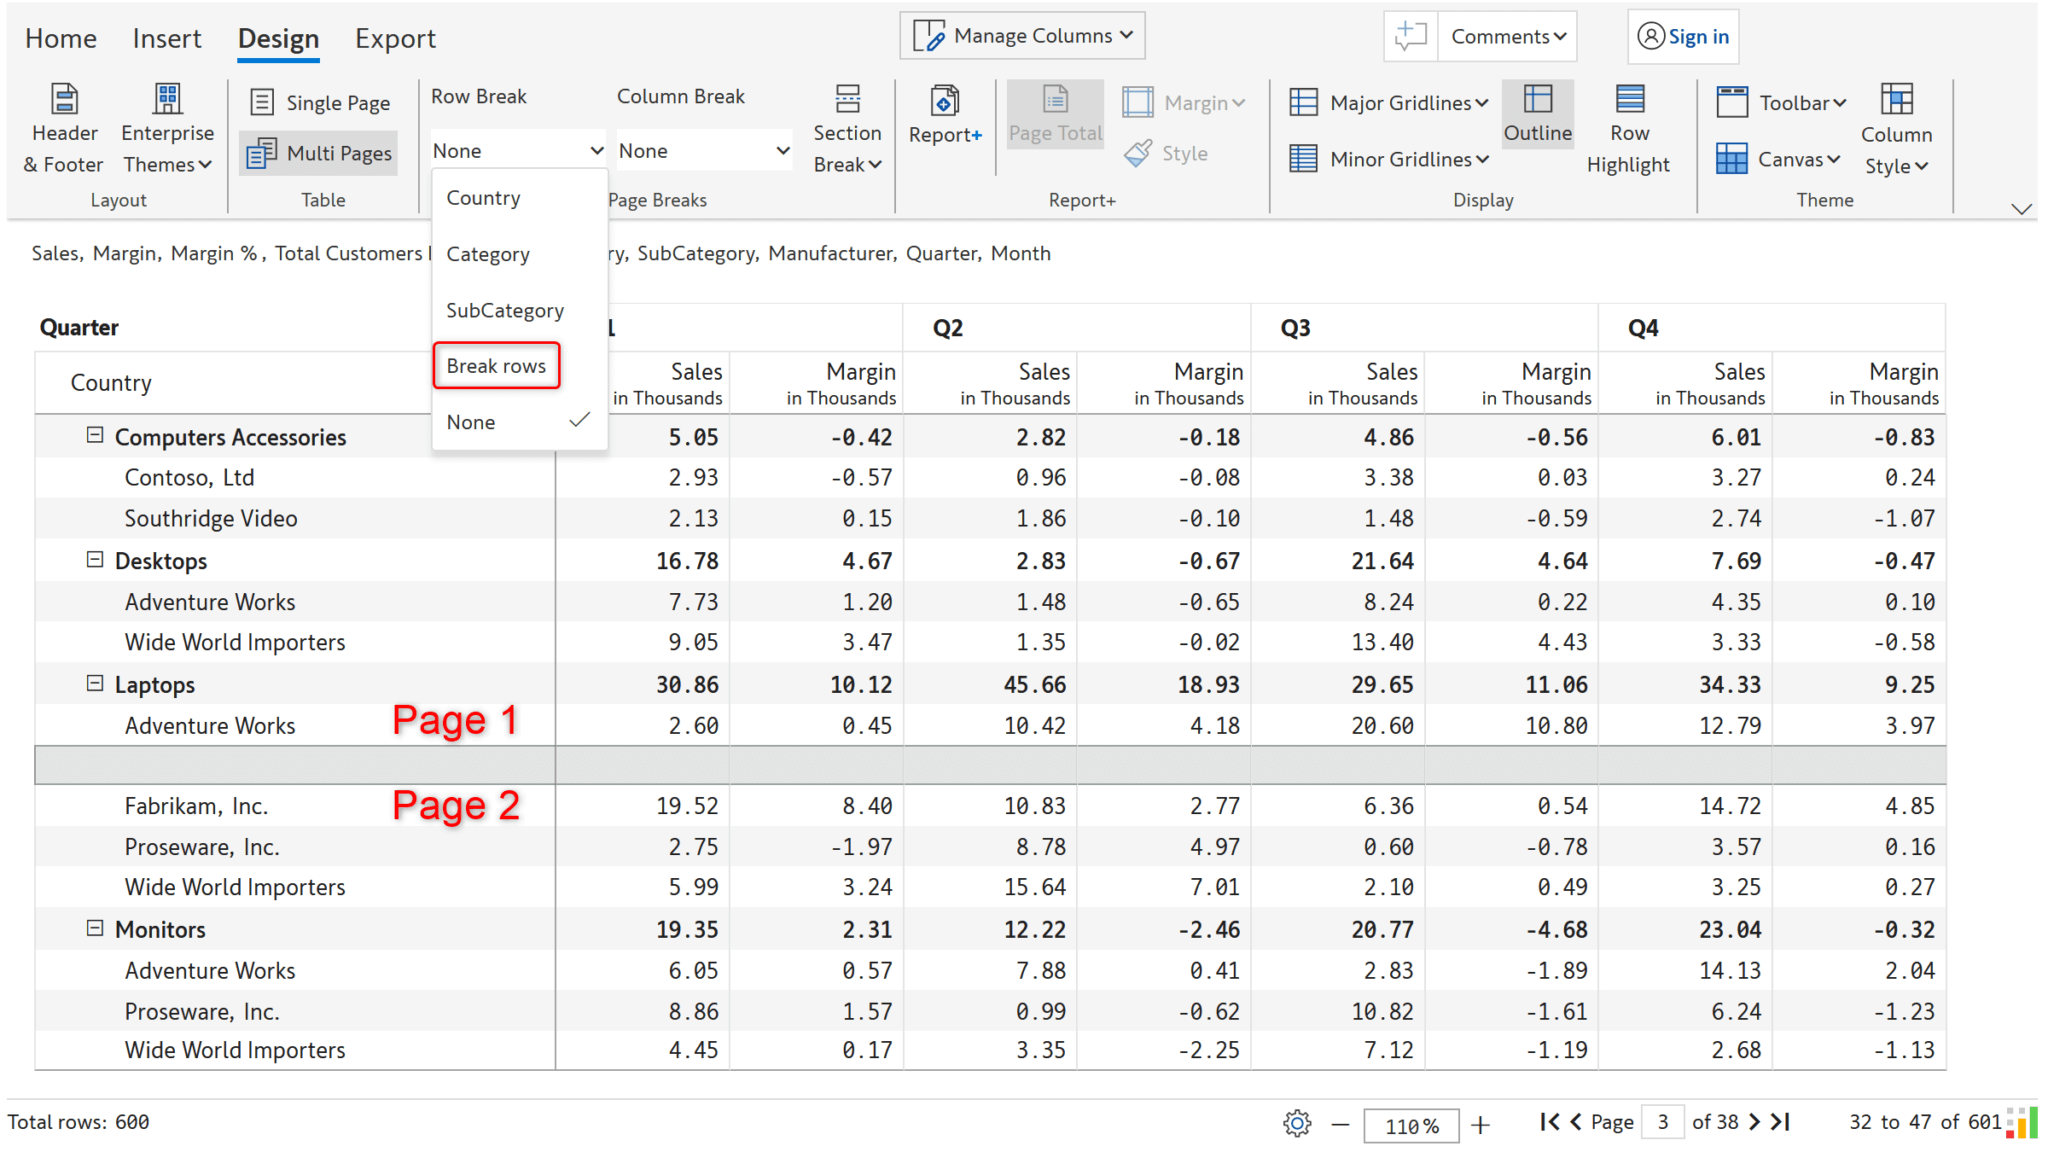
Provide breaks in your paginated report dynamically based on the row category values (e.g., each category in the rows starts on a new page). In the image below, by selecting ‘Manufacturer’ in the ‘Row Break’ dropdown, each page shows only the products belonging to a manufacturer.
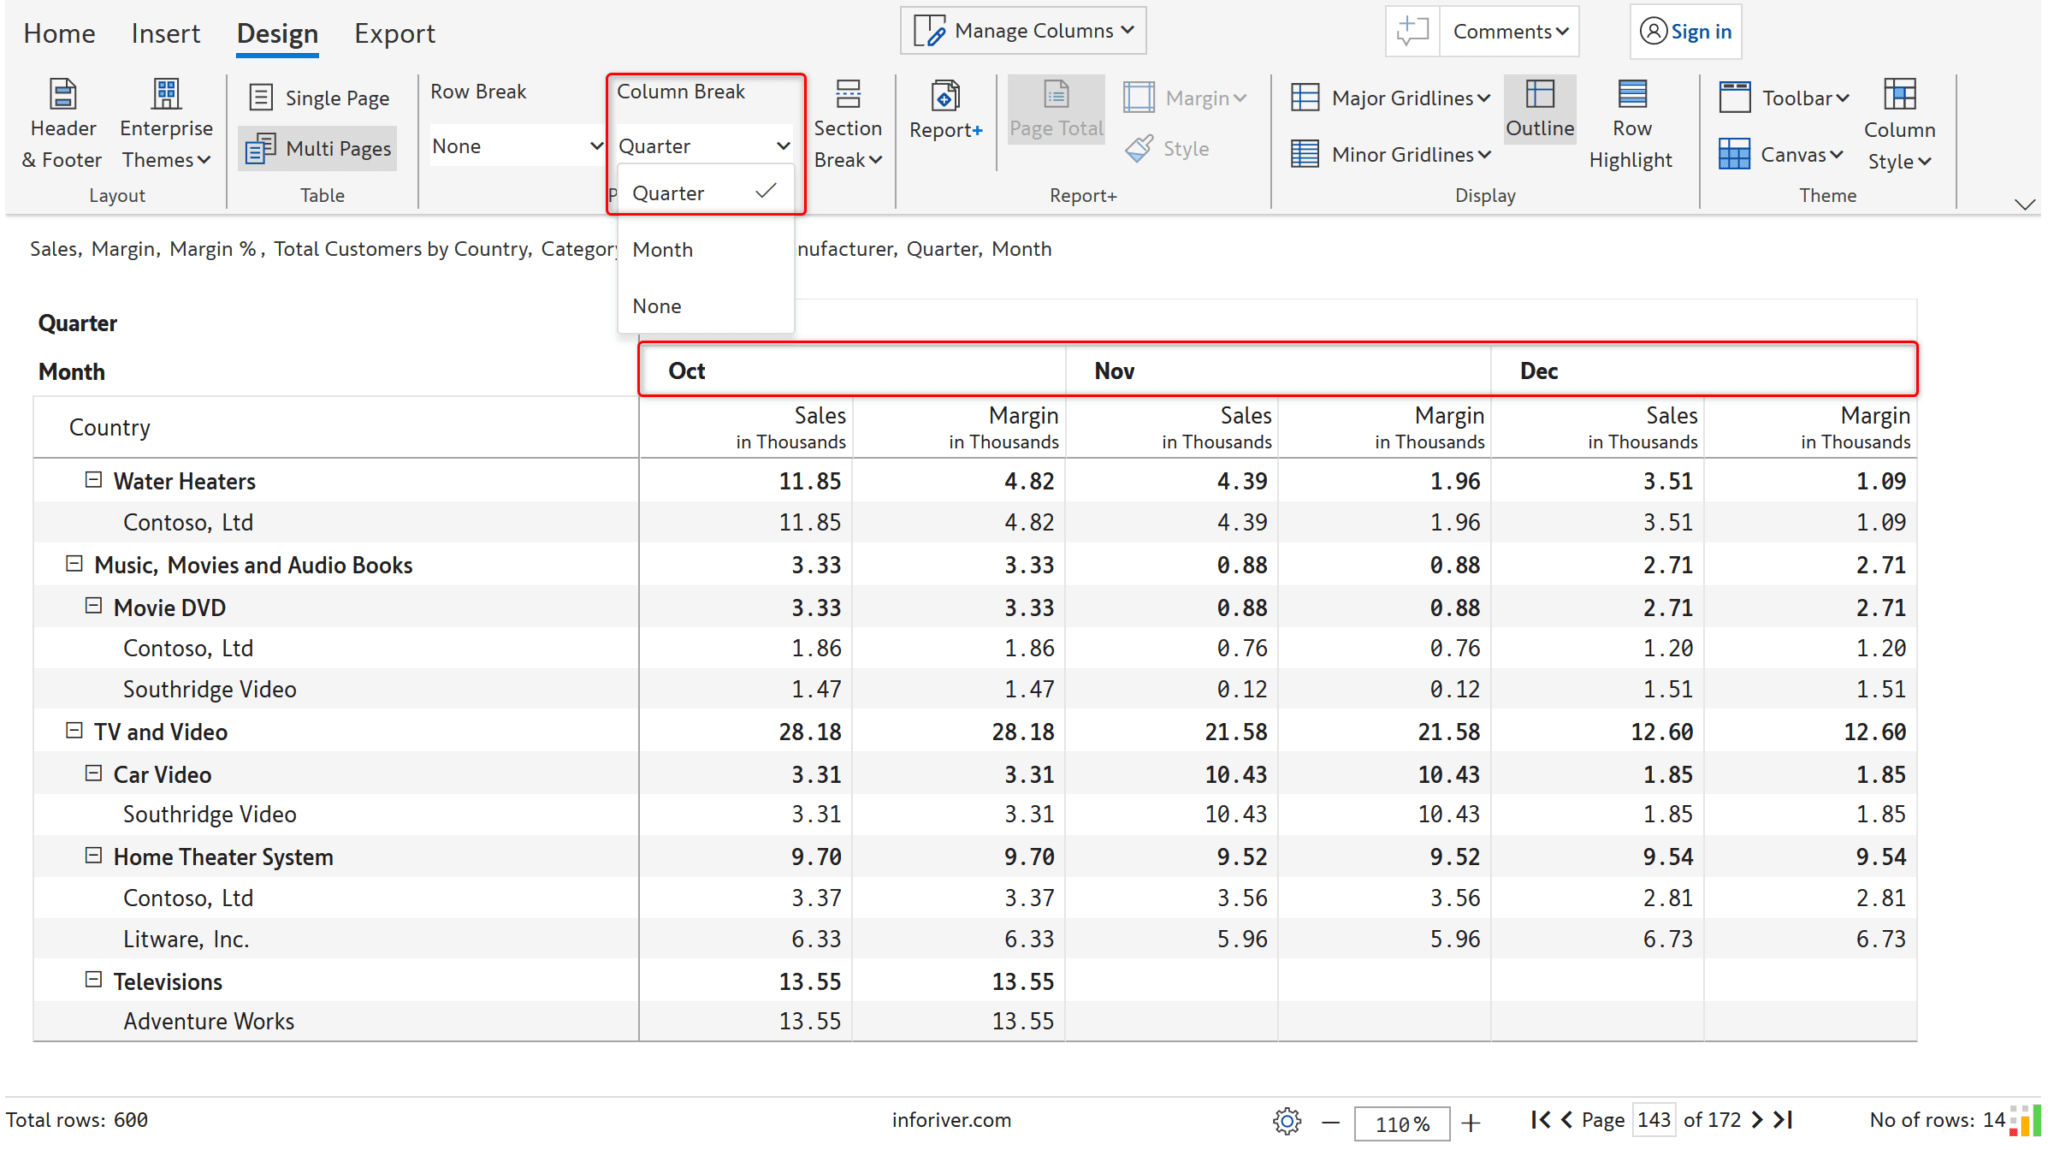
Start a new page in the paginated report based on the column category. In the image below, we have a column hierarchy (Quarter -> Month), and each quarter starts on a new page.
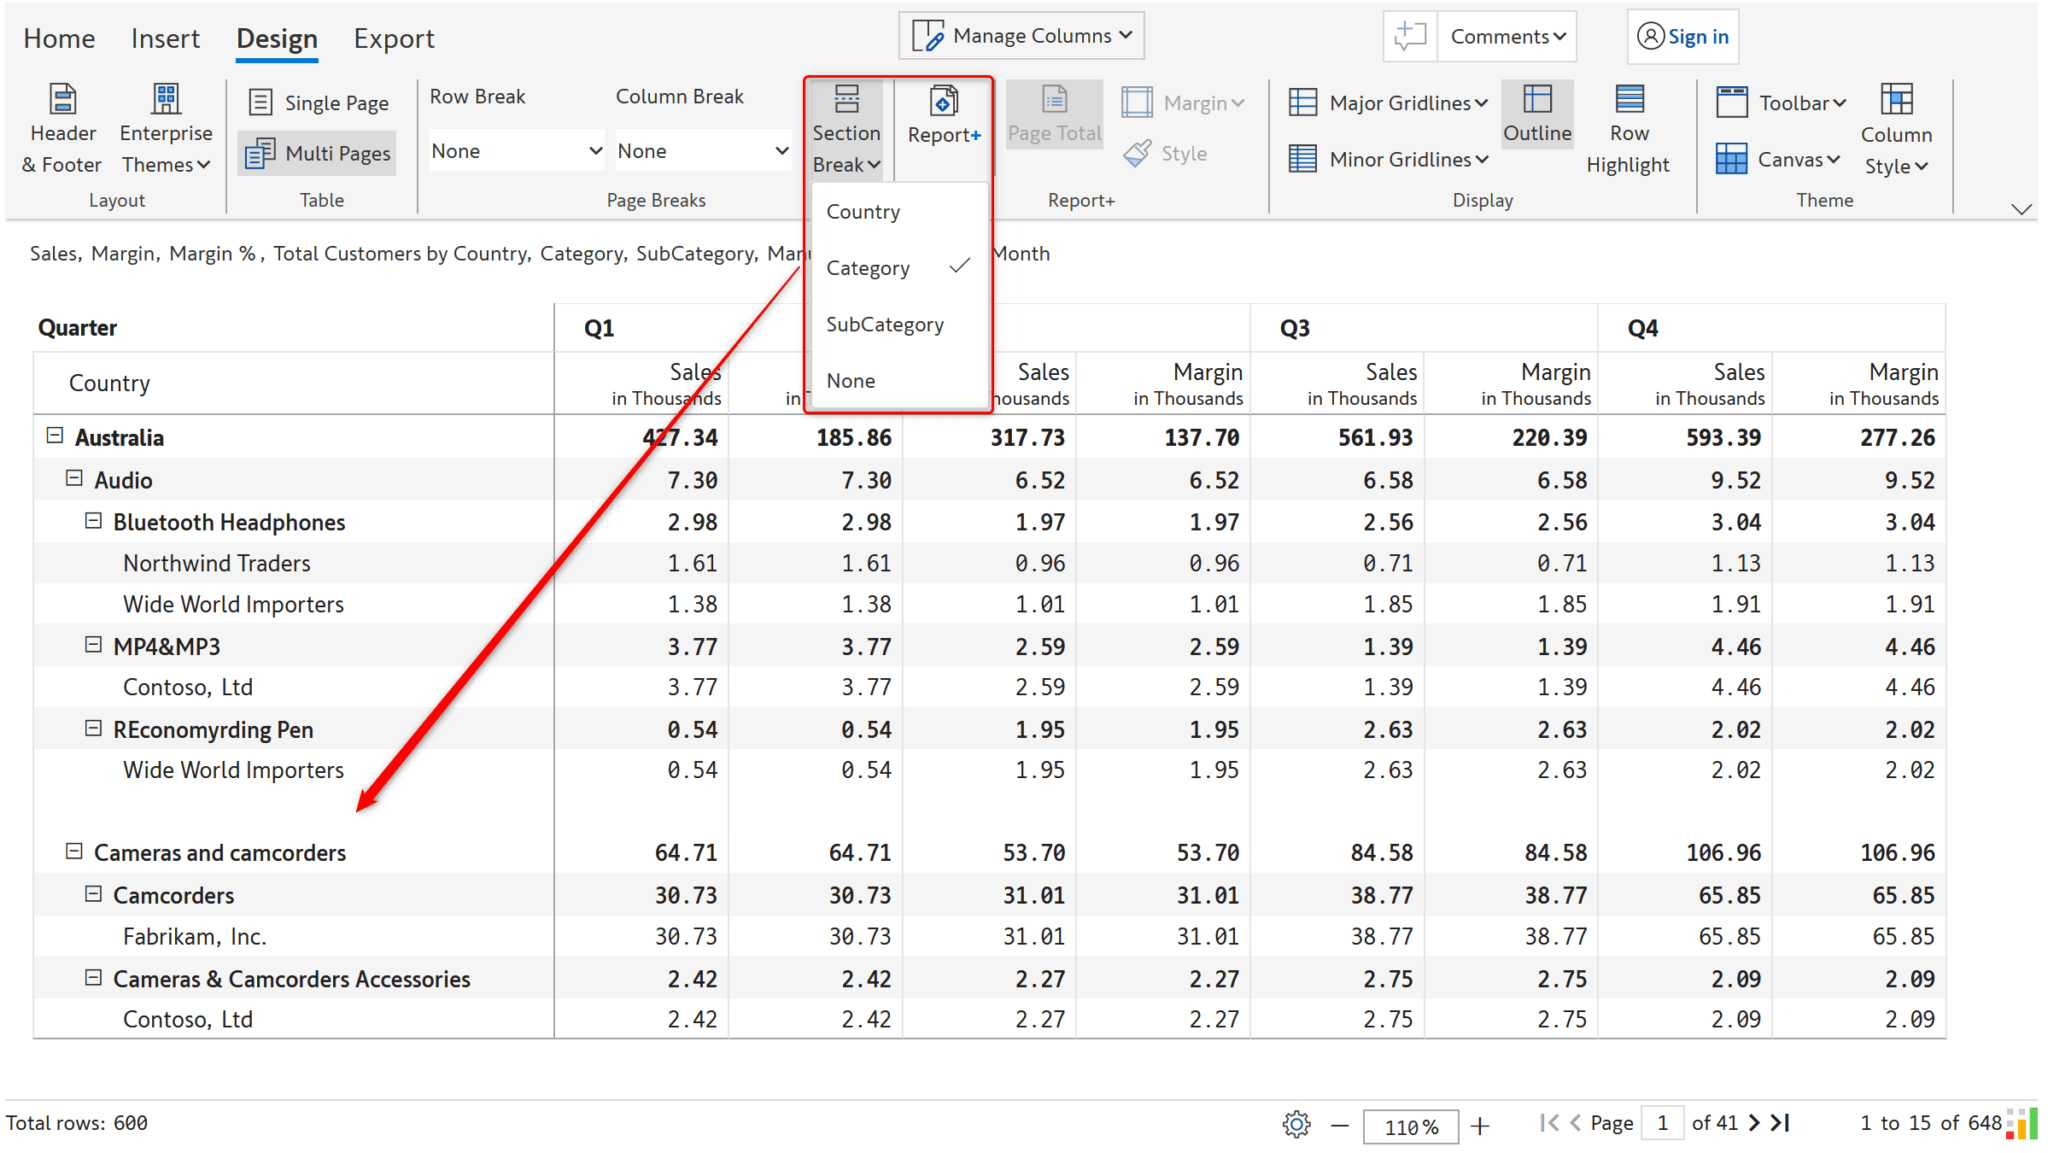
Leverage section breaks to insert a blank row after each category. In the image below, a blank row is inserted after each category, i.e., Audio, Cameras and camcorders in the paginated report.
Insert a page break at any point in the report by inserting a 'break row’ from ‘Insert’ -> ‘Insert Row.’ Choose the ‘Break rows’ option in the row break dropdown. The rows before and after the break row will be shown on different pages.
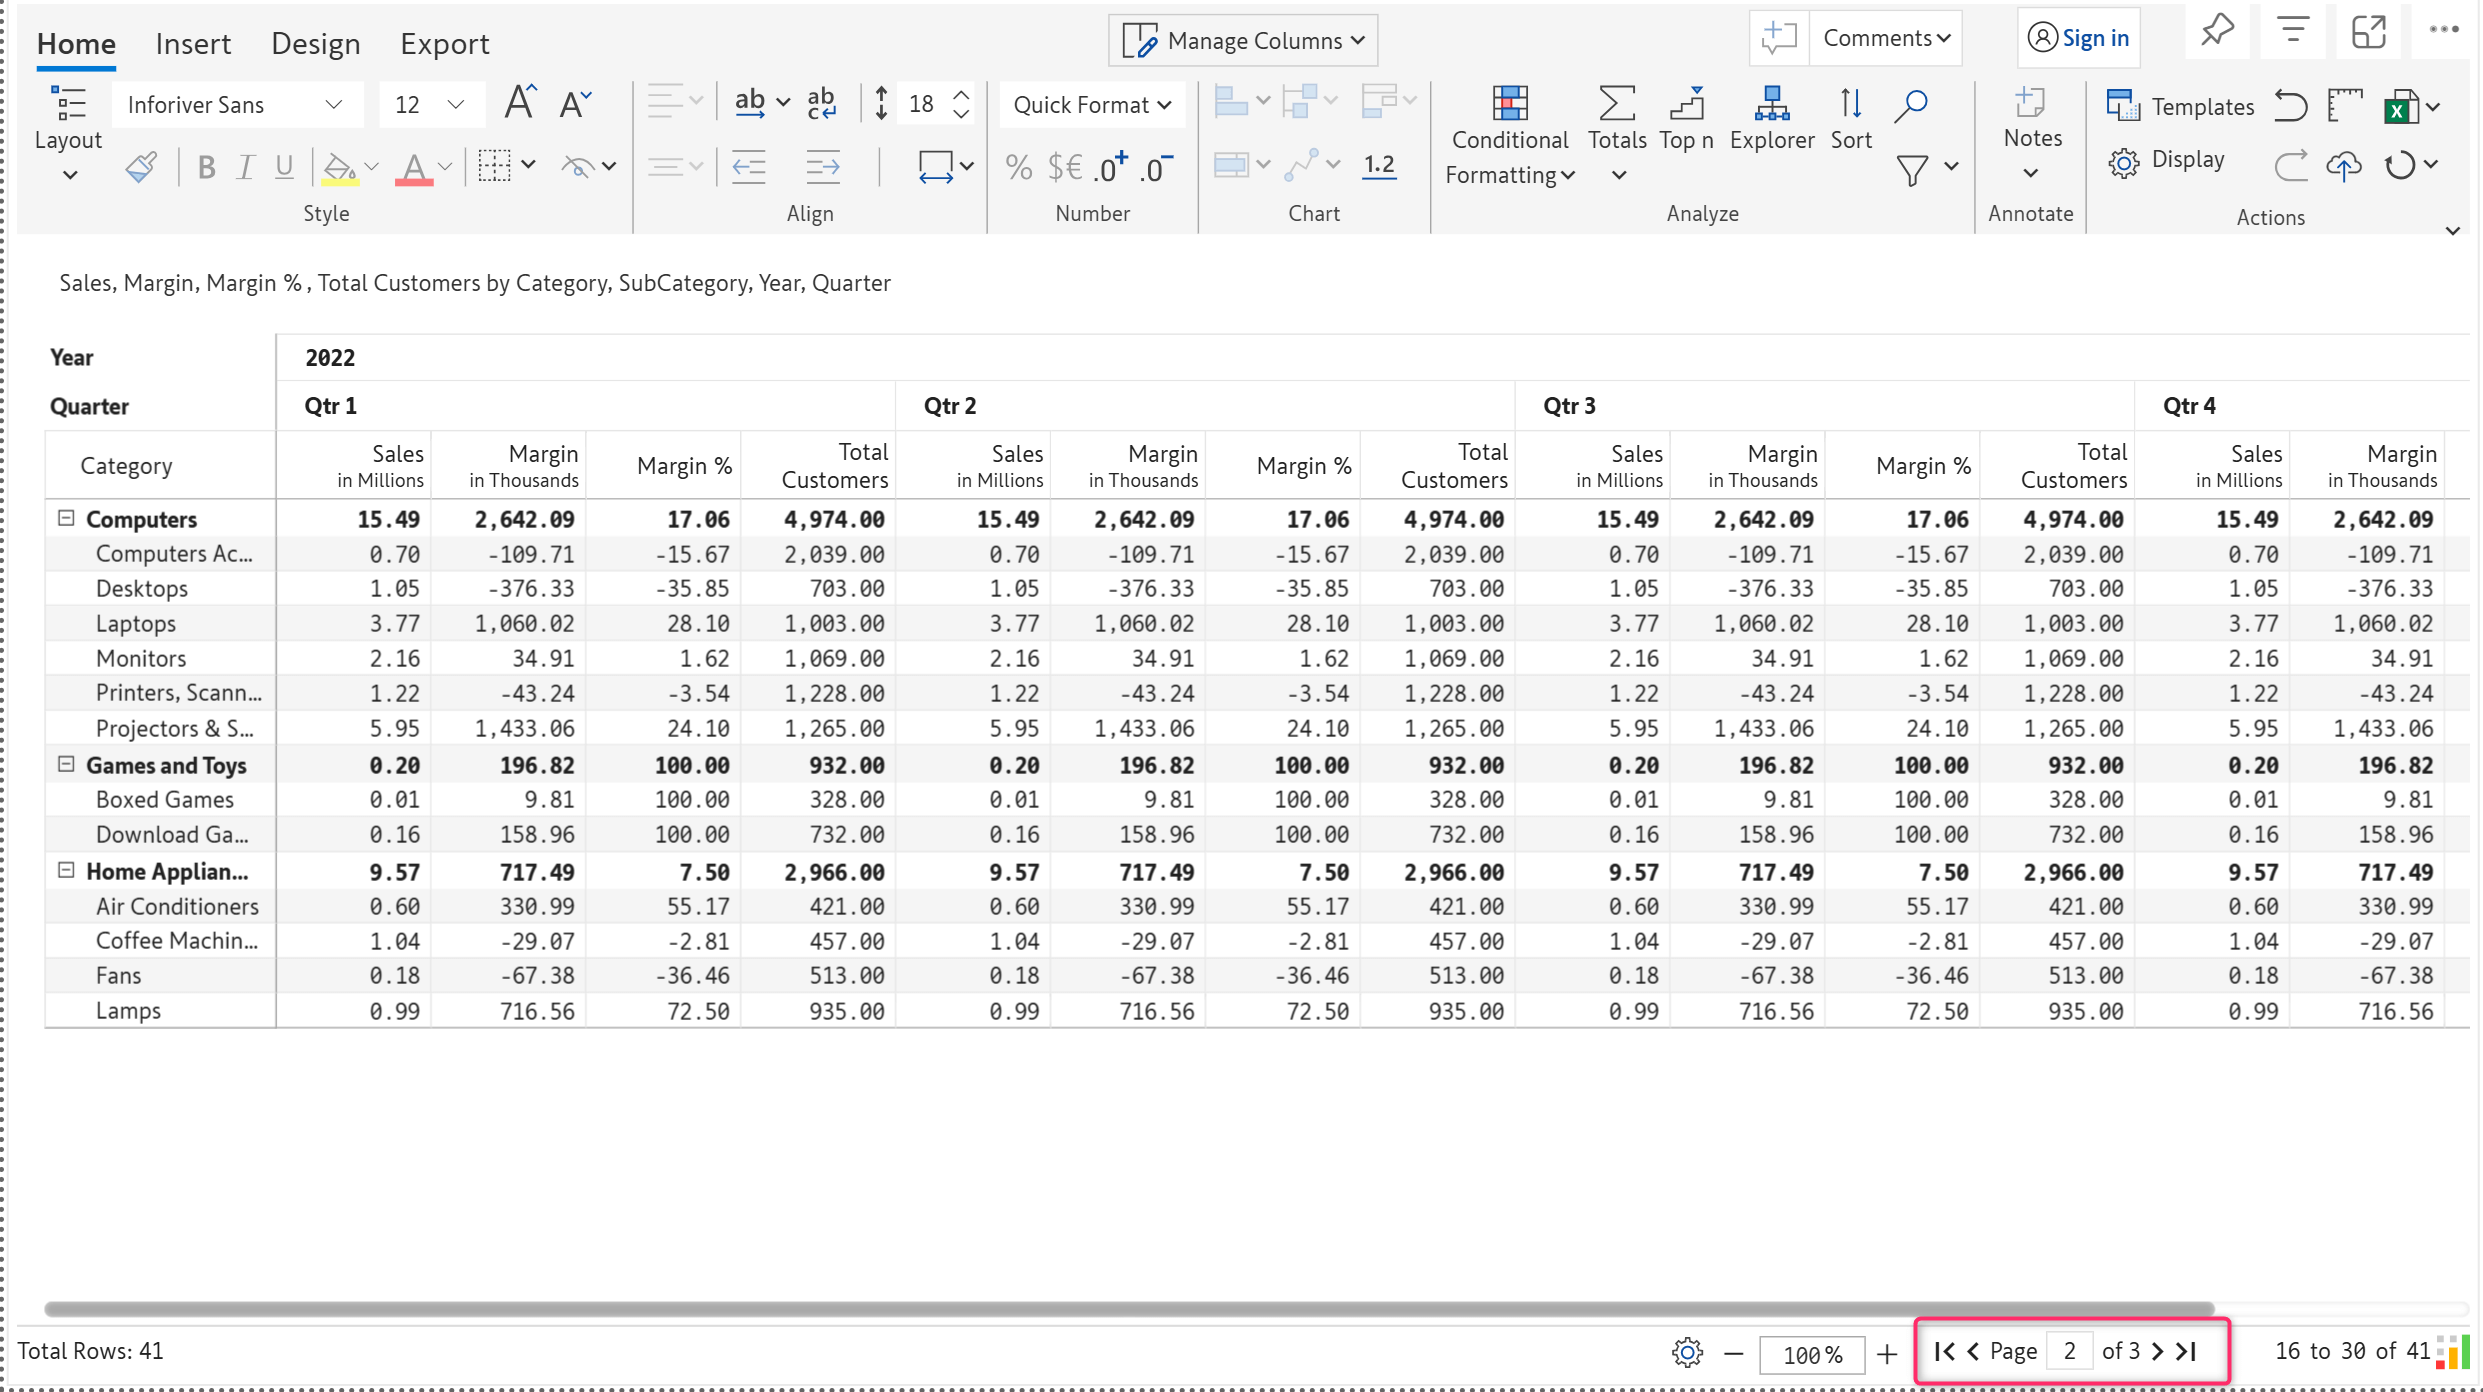
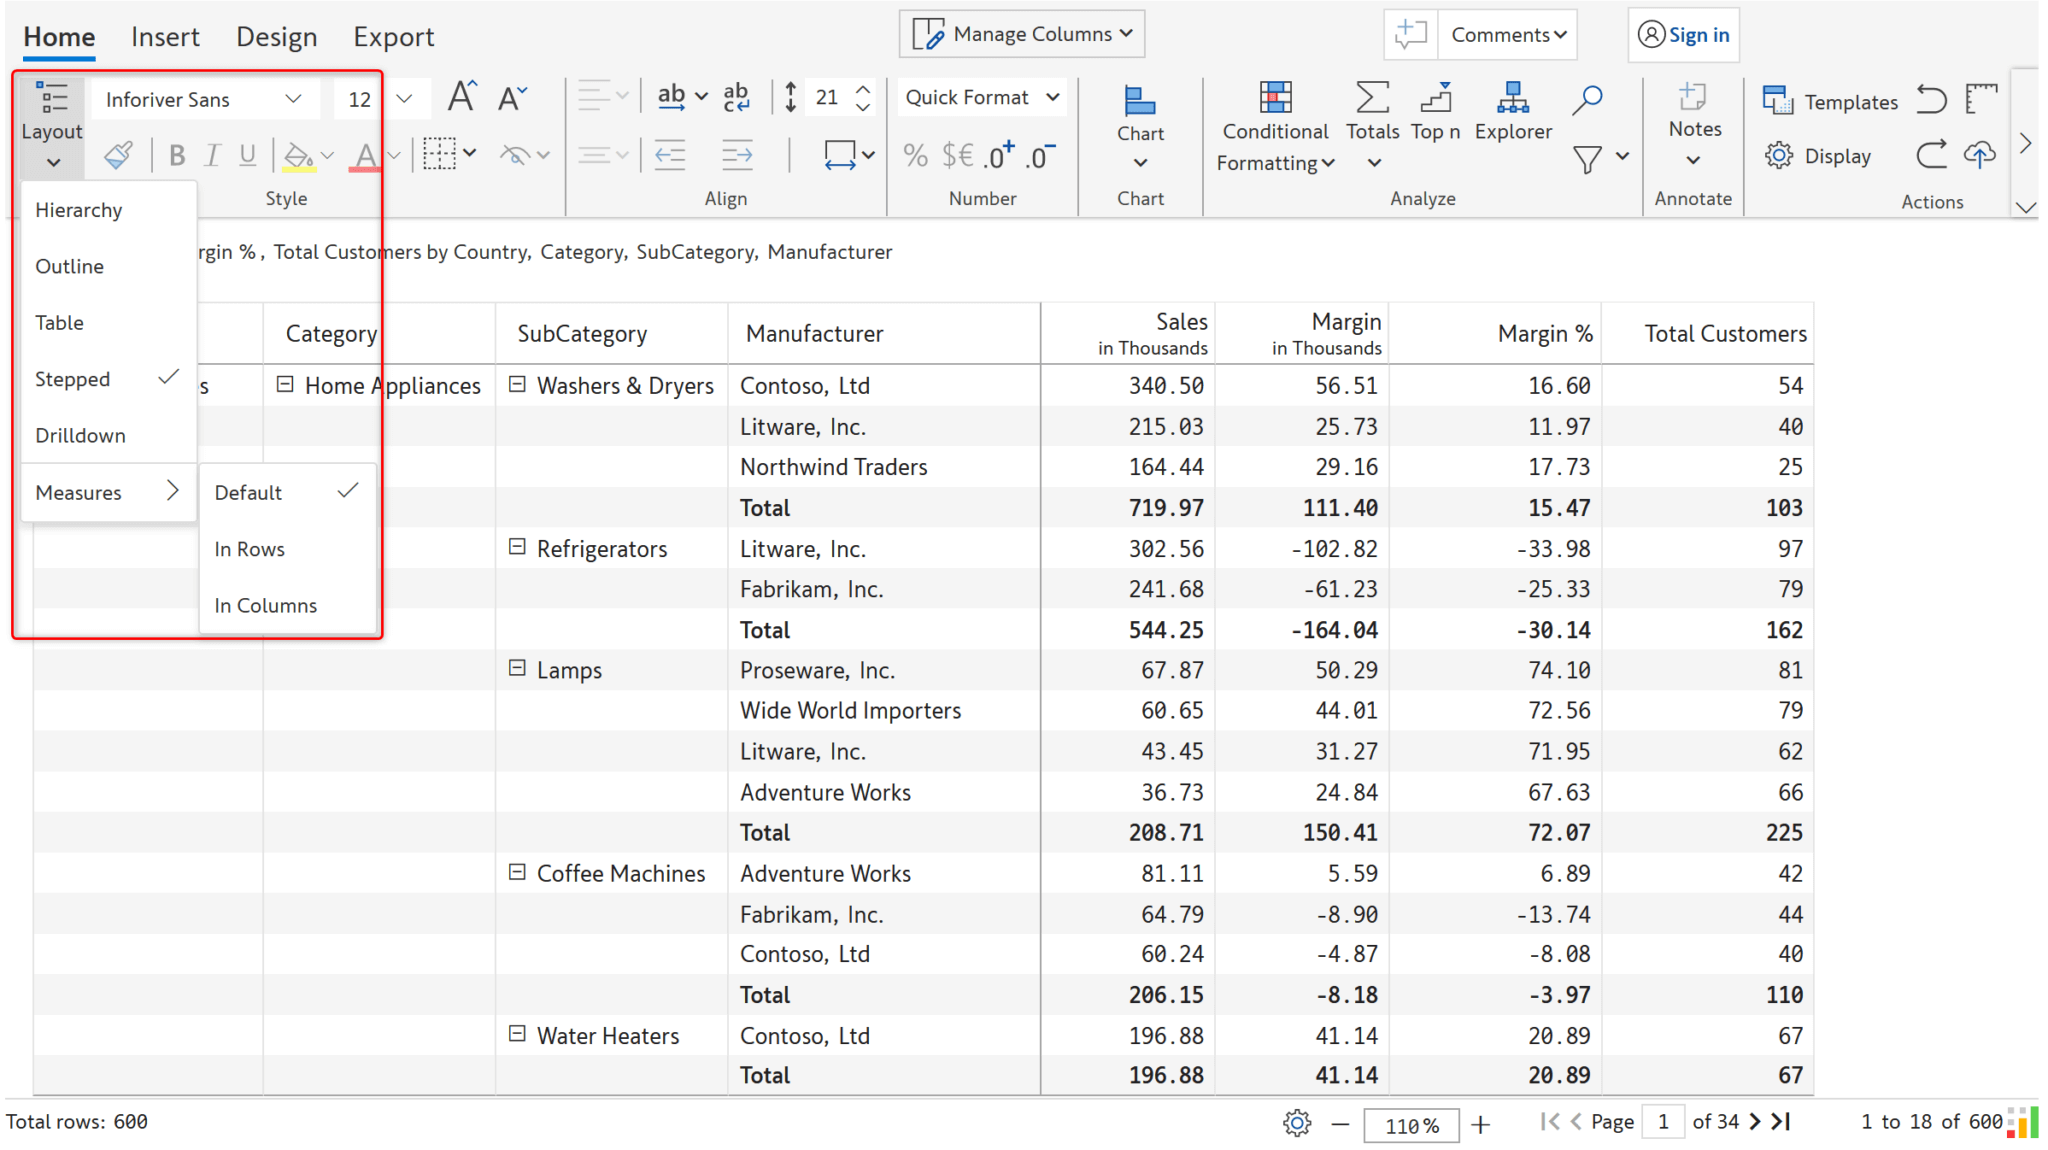
Apply tabular, matrix, and other Excel-like layouts to the paginated report. You can also display measures in rows or columns.
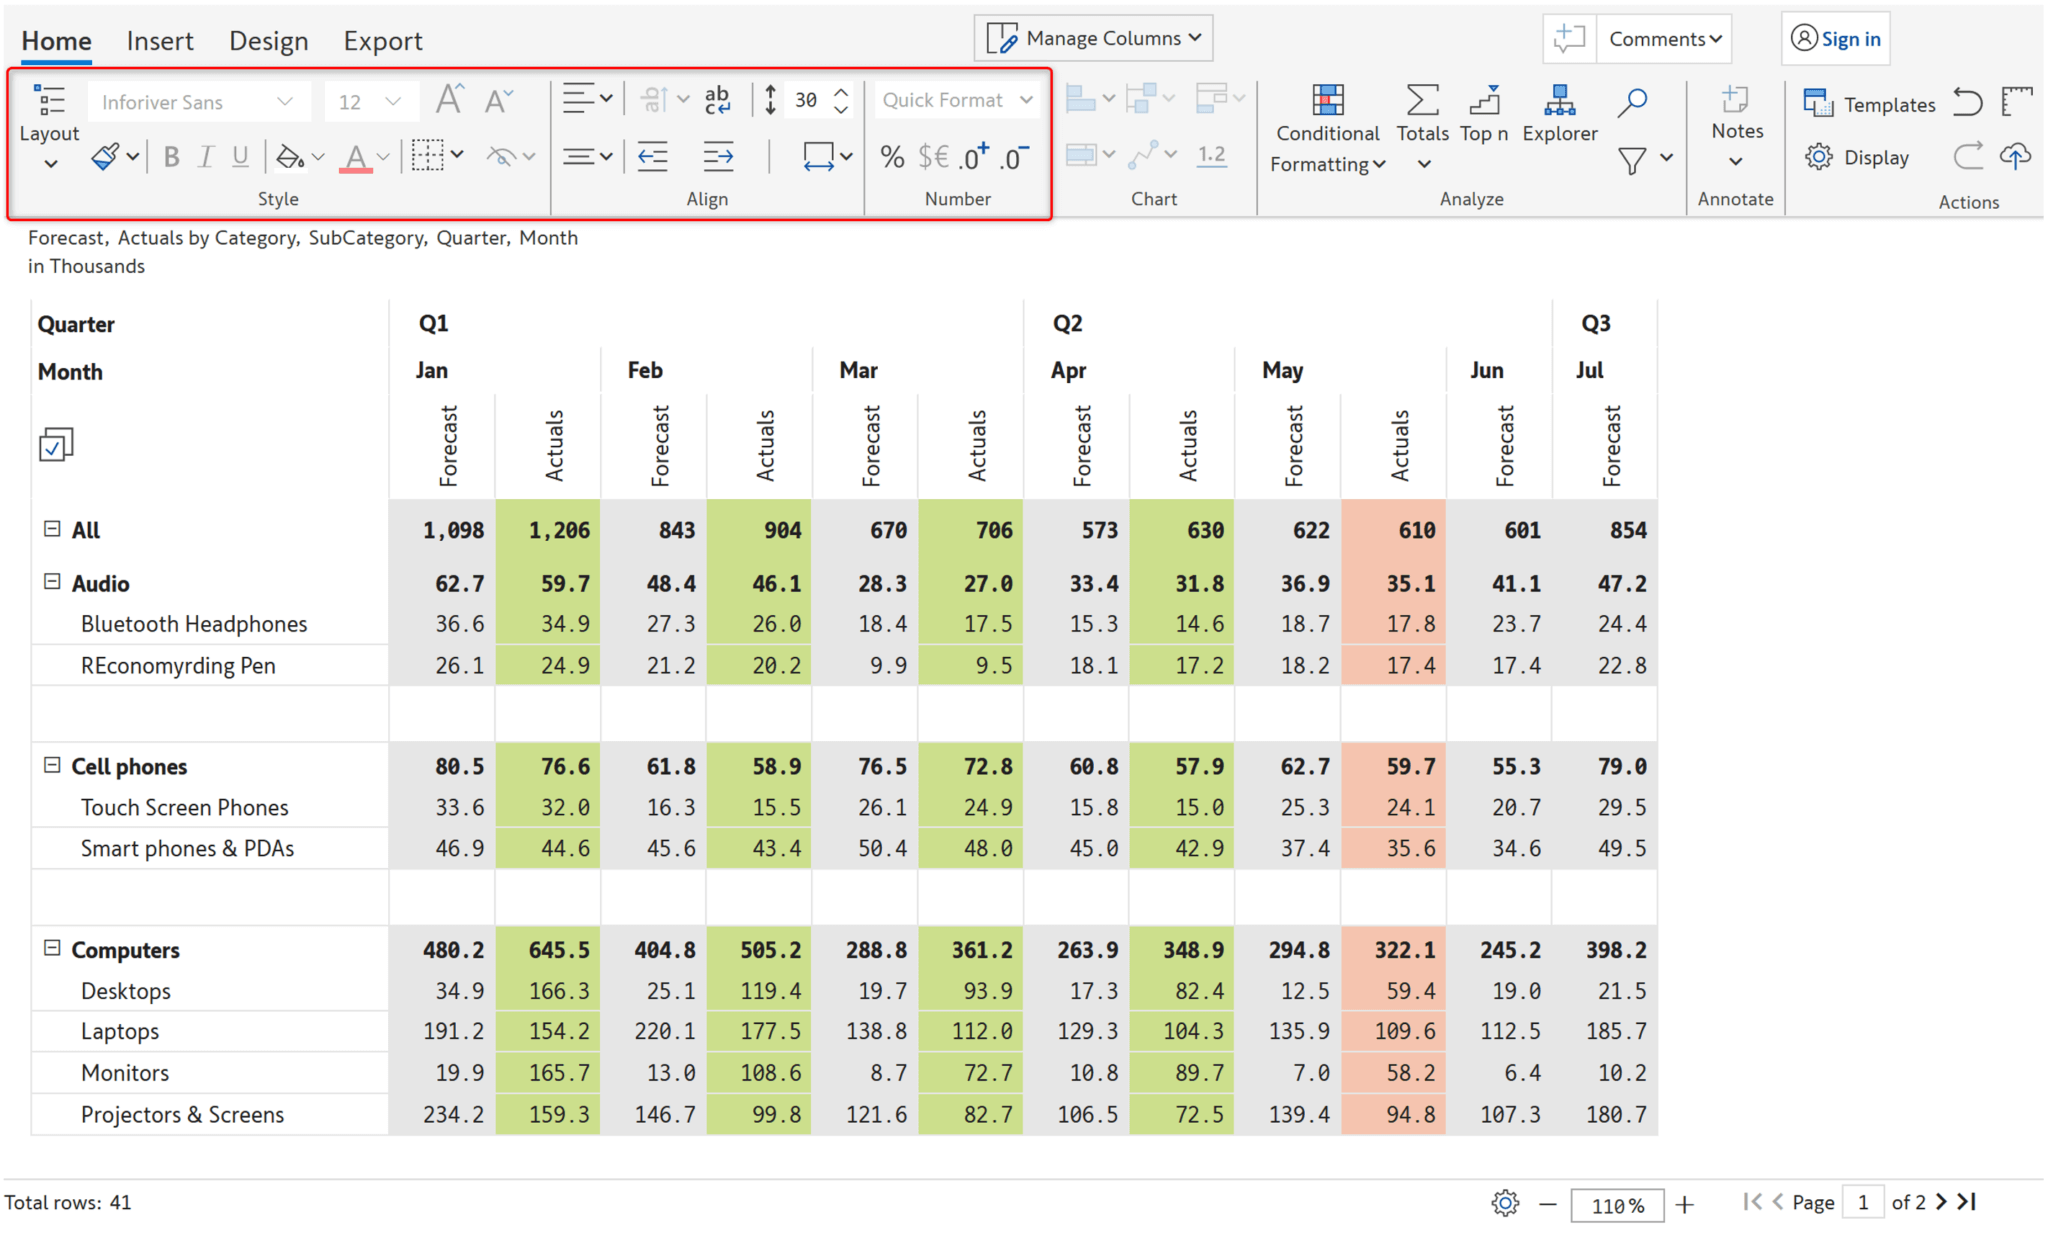
Apply Excel-like cell and value formatting to your paginated reports. You can change the font color, style, size, and text alignment in a cell or apply formatting effects. Inforiver also comes prepackaged with intelligent number formatting & scaling recognition capabilities.
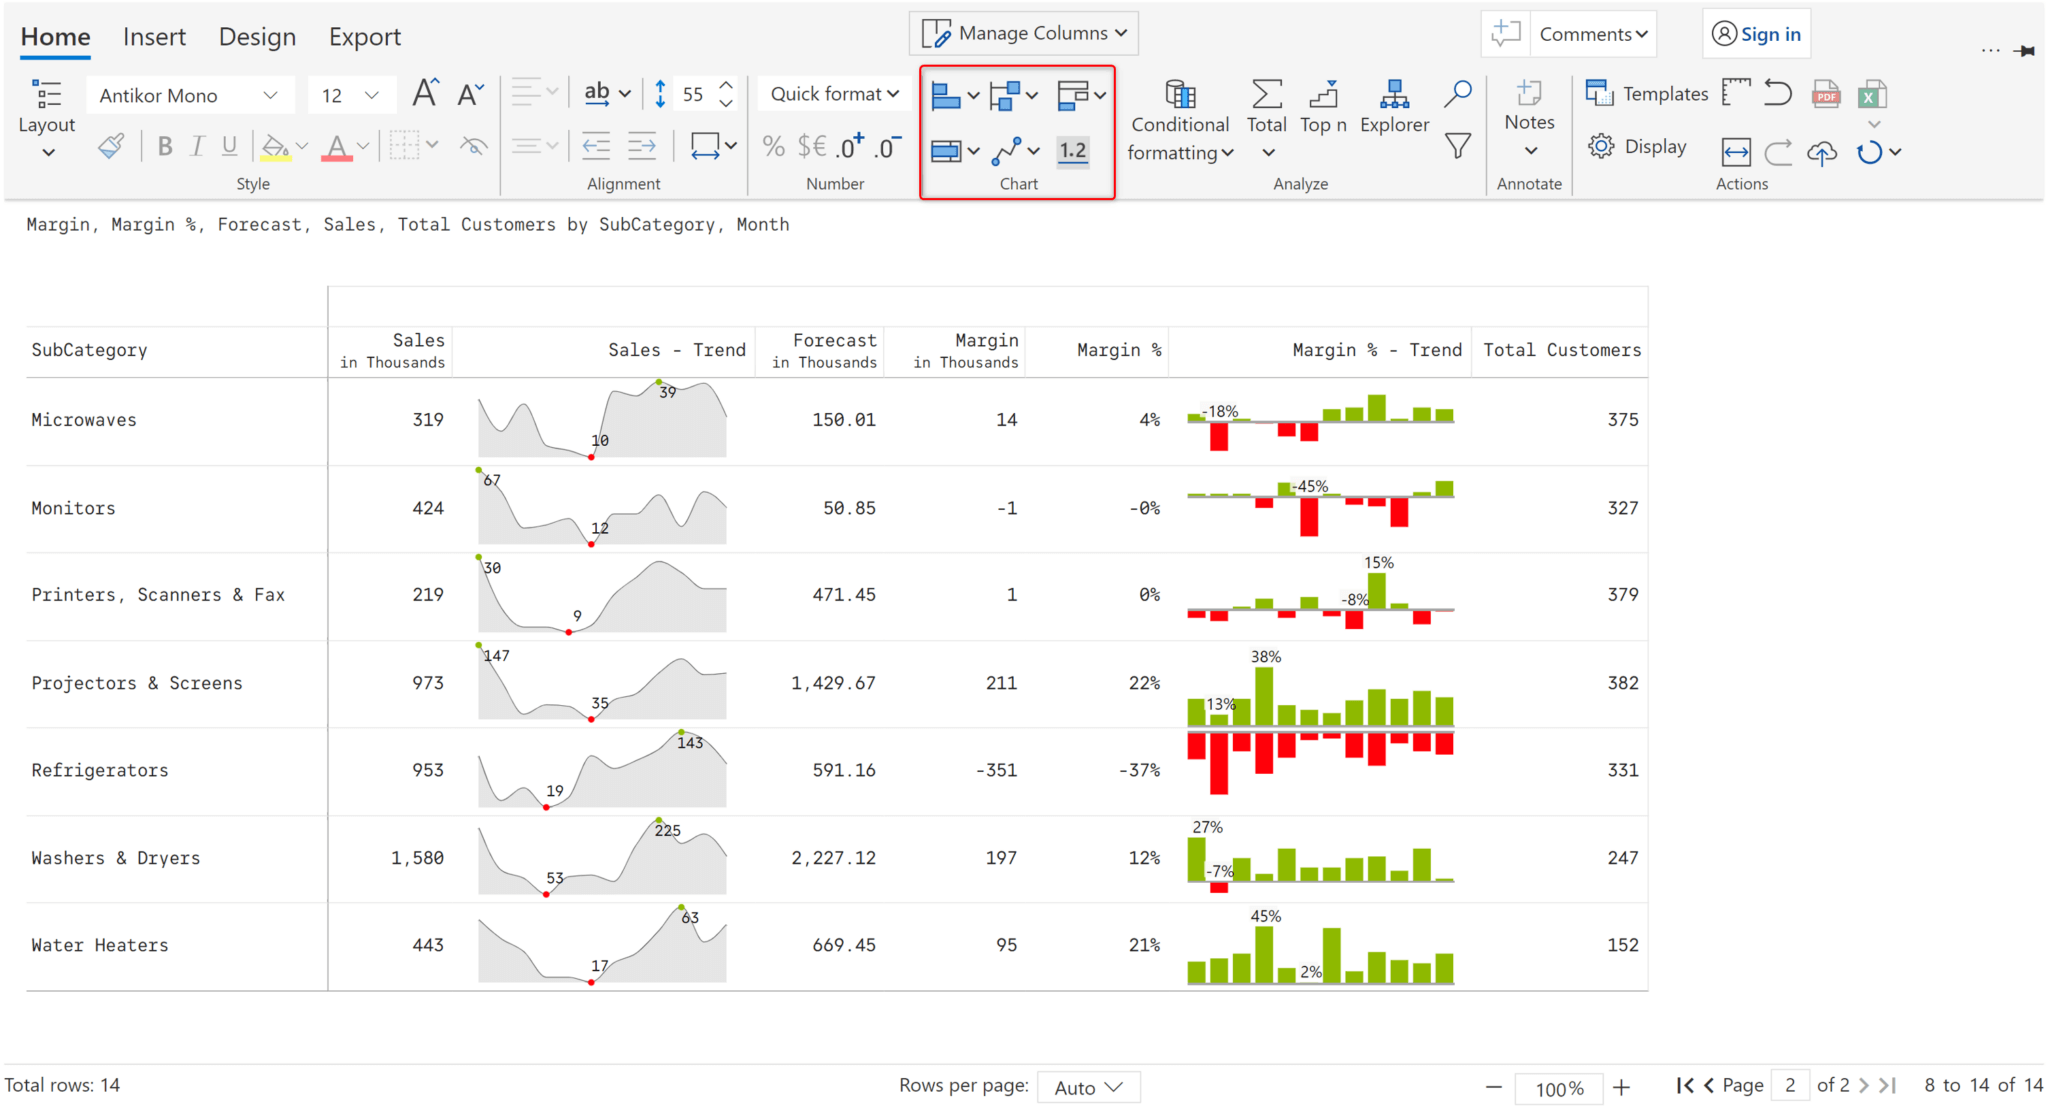
Deliver a variety of in-cell charts in your paginated reports in a few clicks. These include advanced bullet charts, waterfall charts, sparklines, range plots, and more.
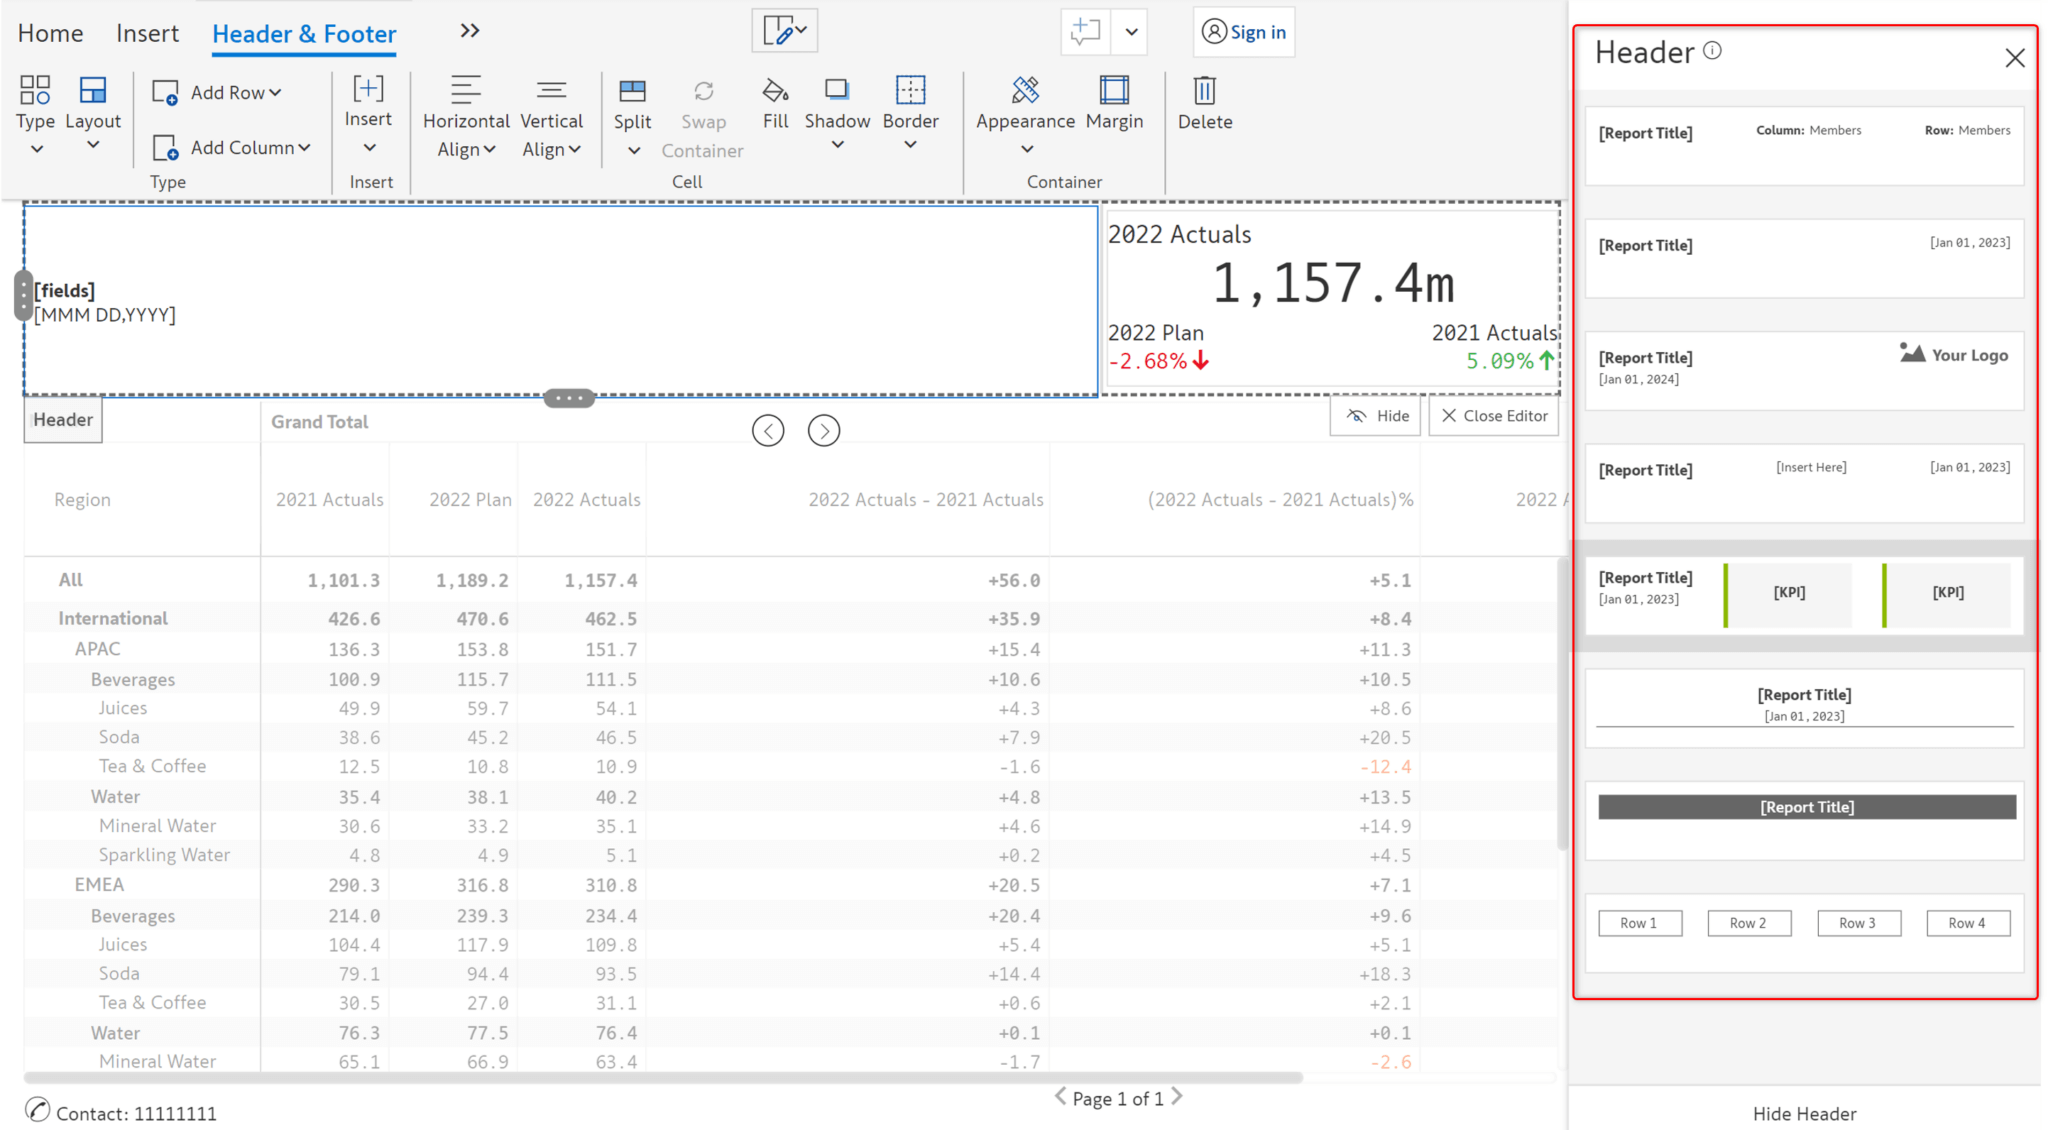
Leverage one-click presets to insert header and footer in your paginated reports. The header and footer can include highly formatted text, images, KPI cards, and charts.
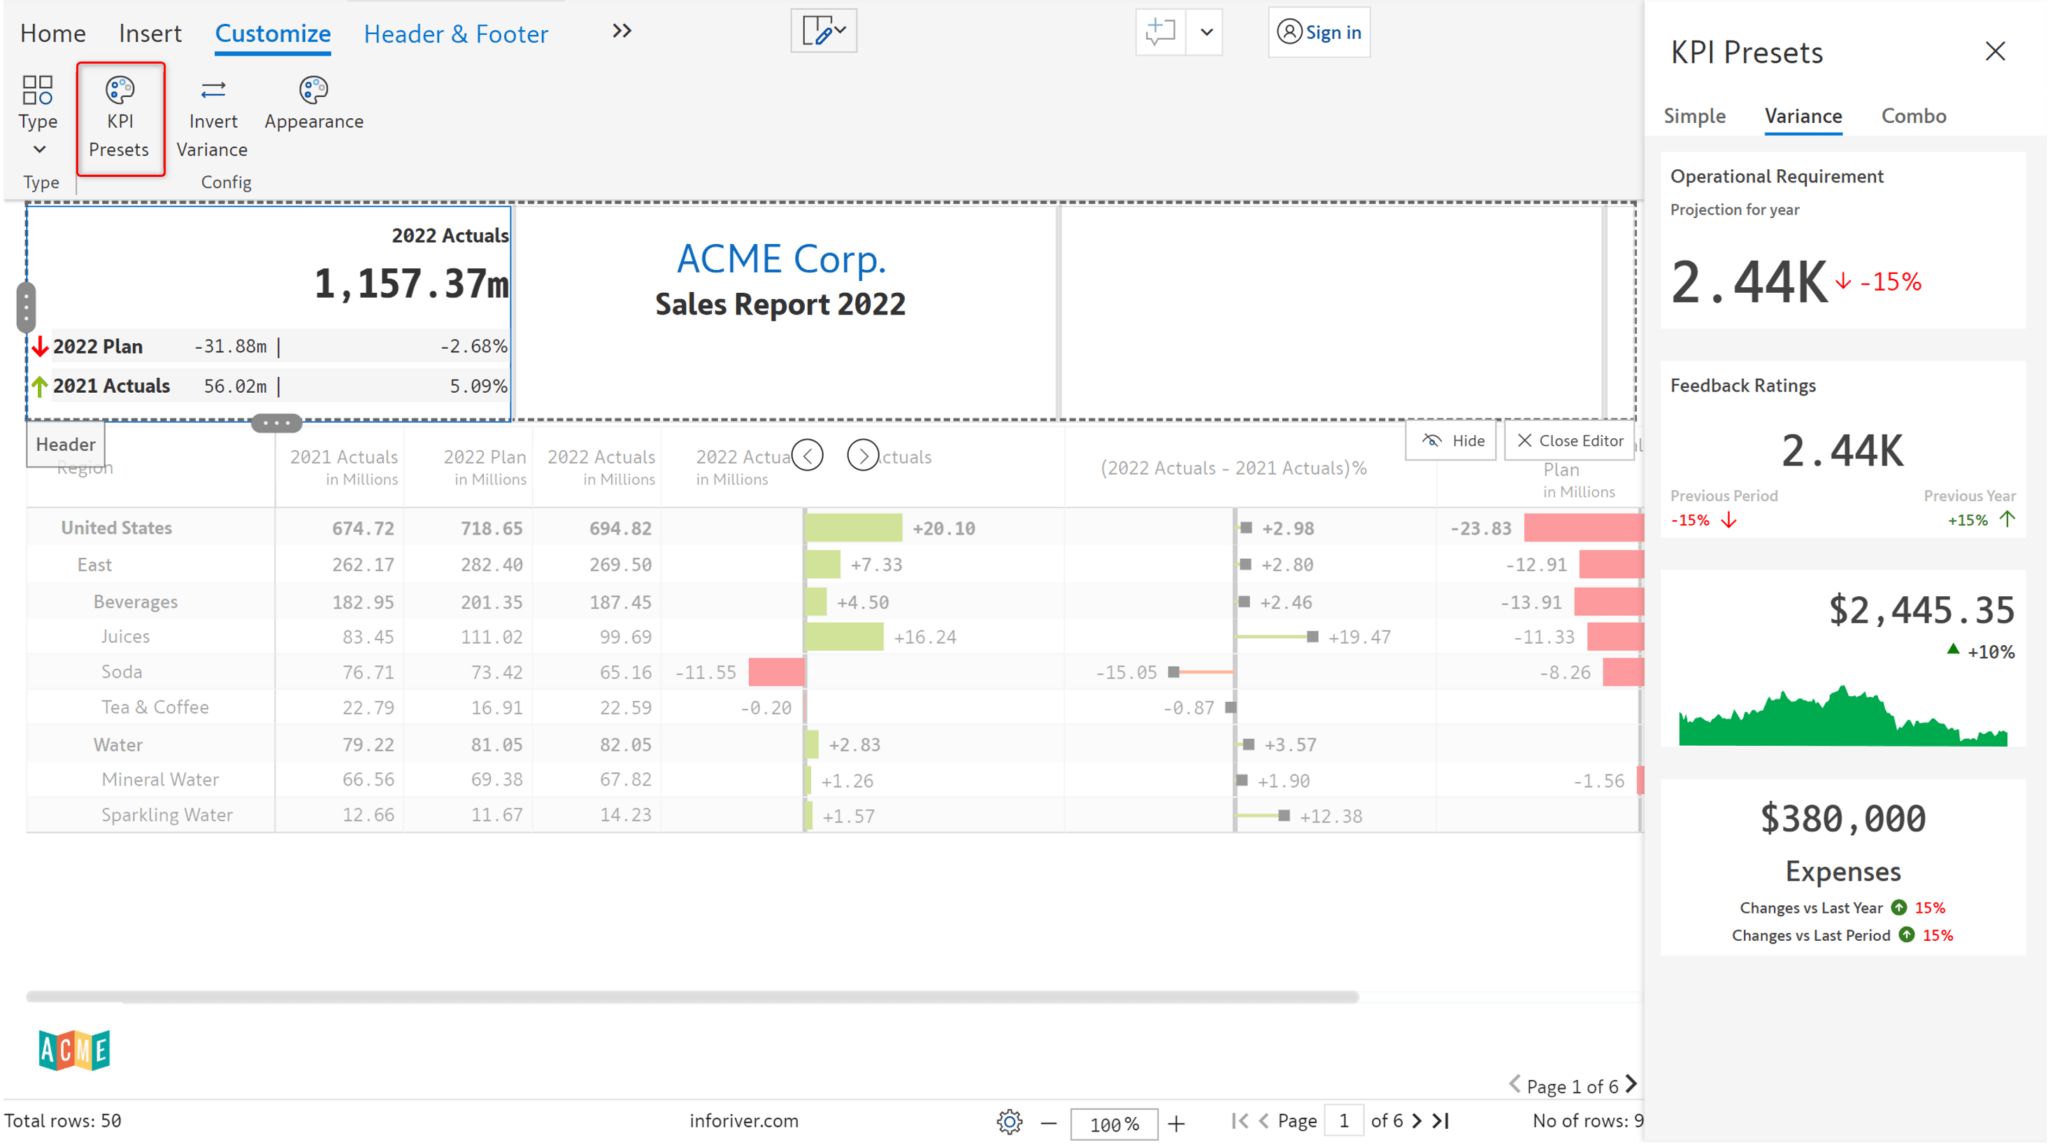
Add KPI cards in the header and footer using one-click KPI card presets or customize them as desired.
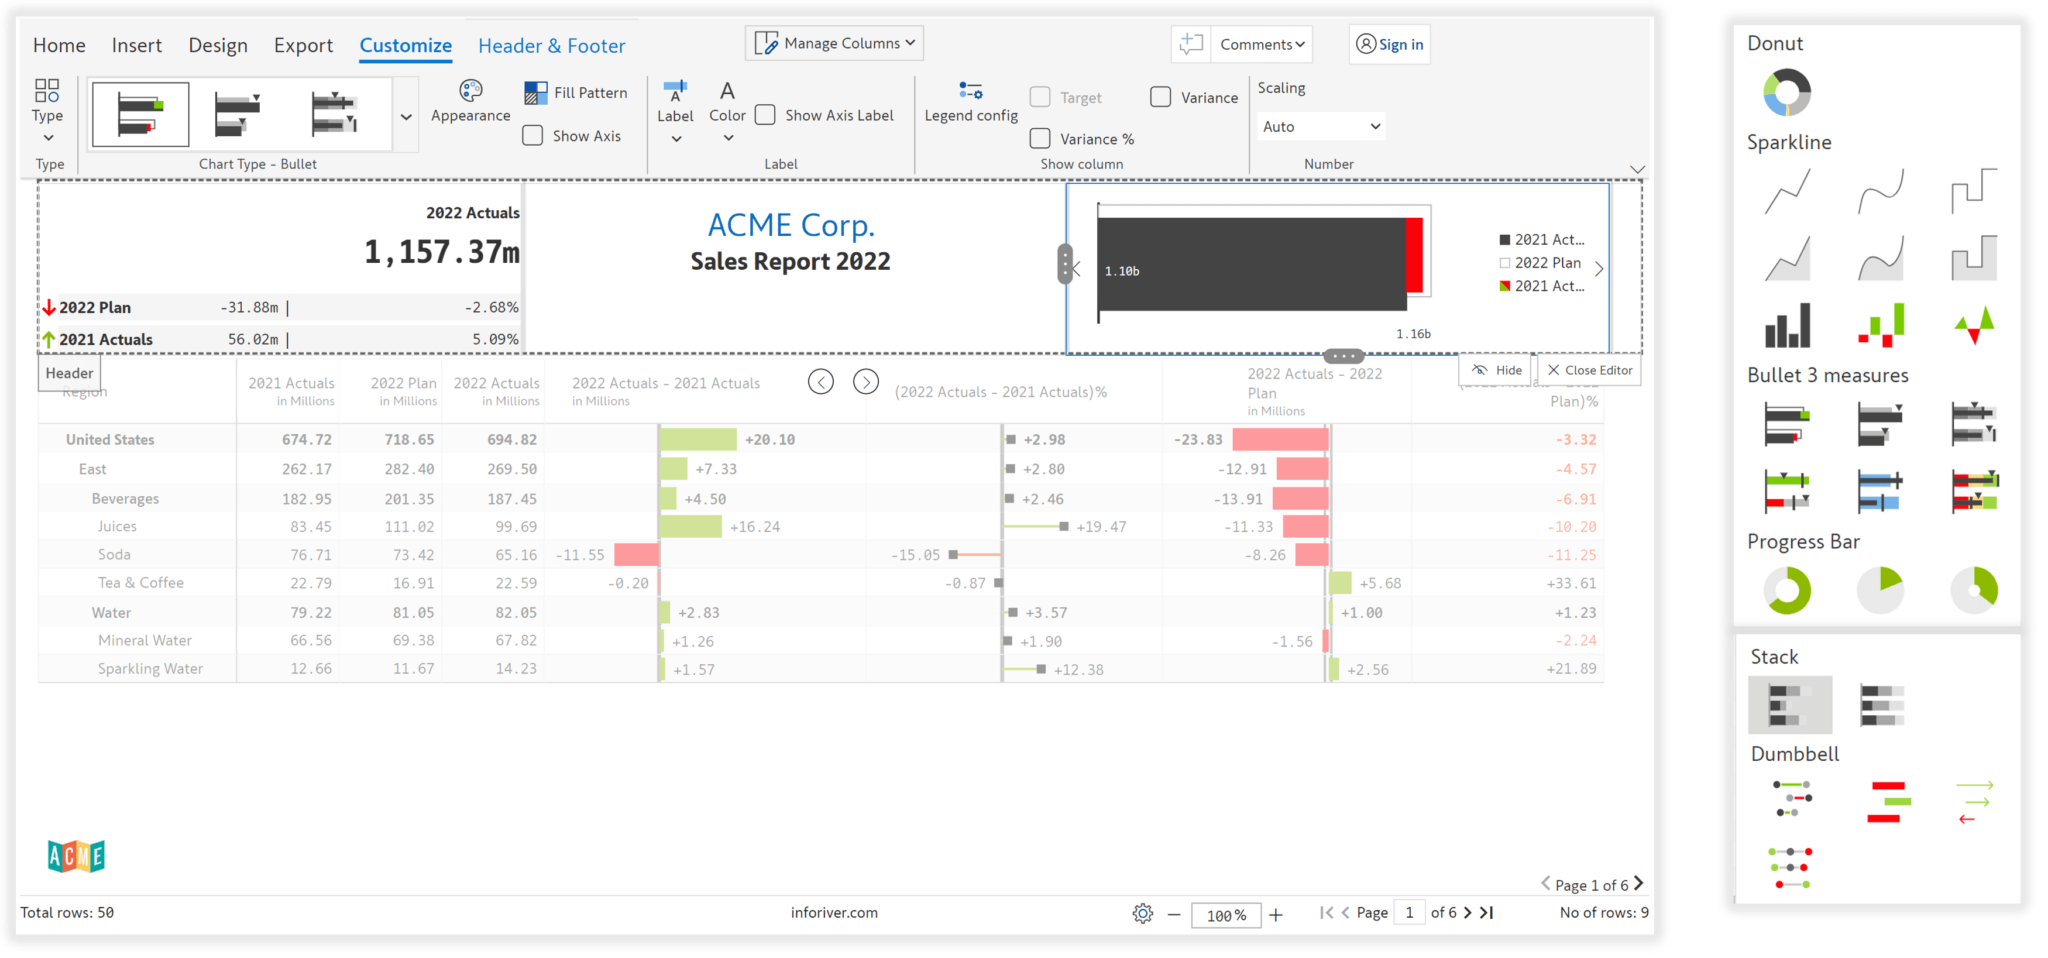
Insert a wide variety of charts in the header and footer; charts can be customized using the ‘Customize’ toolbar shown in the image below.
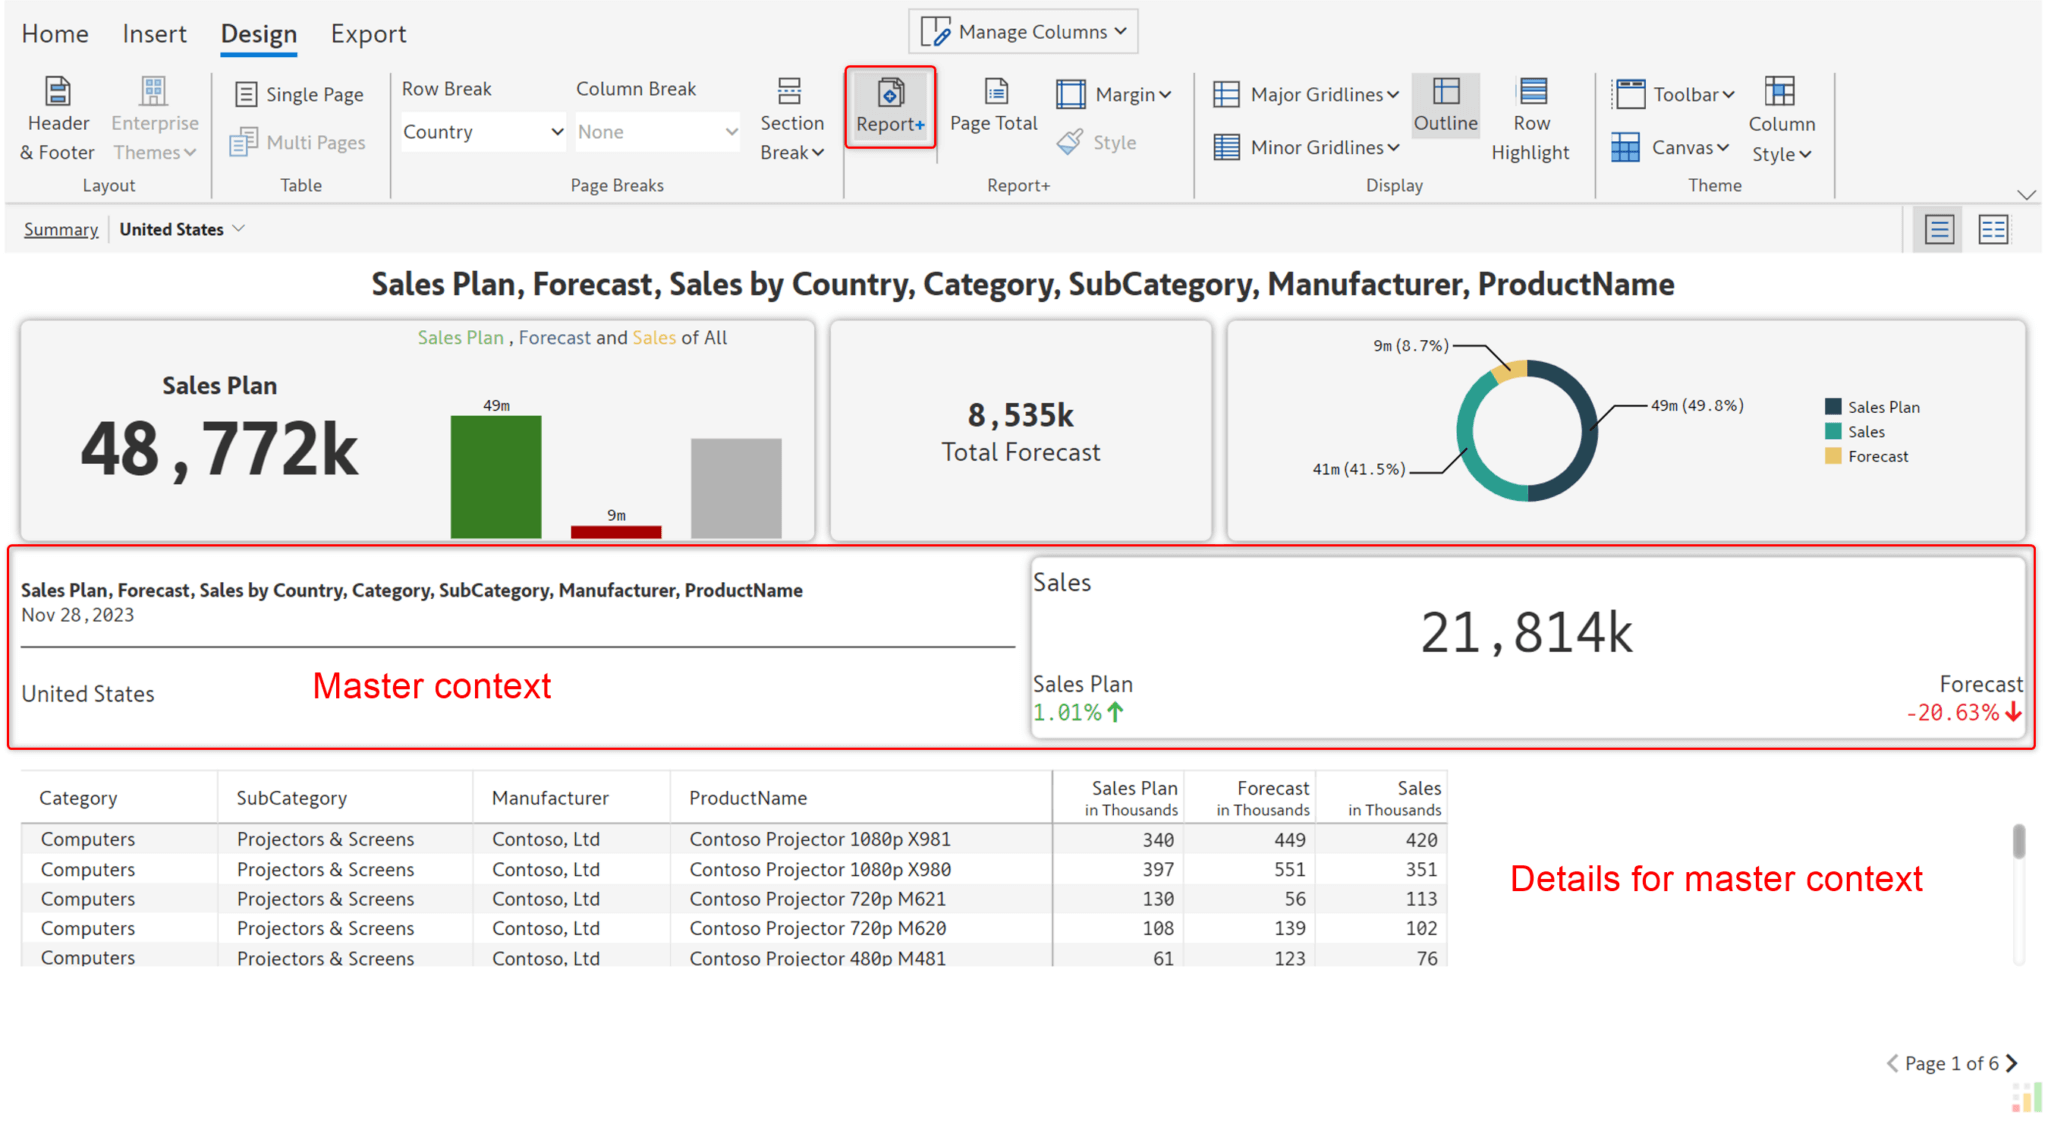
Use Inforiver’s advanced, no-code paginated reporting feature – Report+, to create master-detail reports.
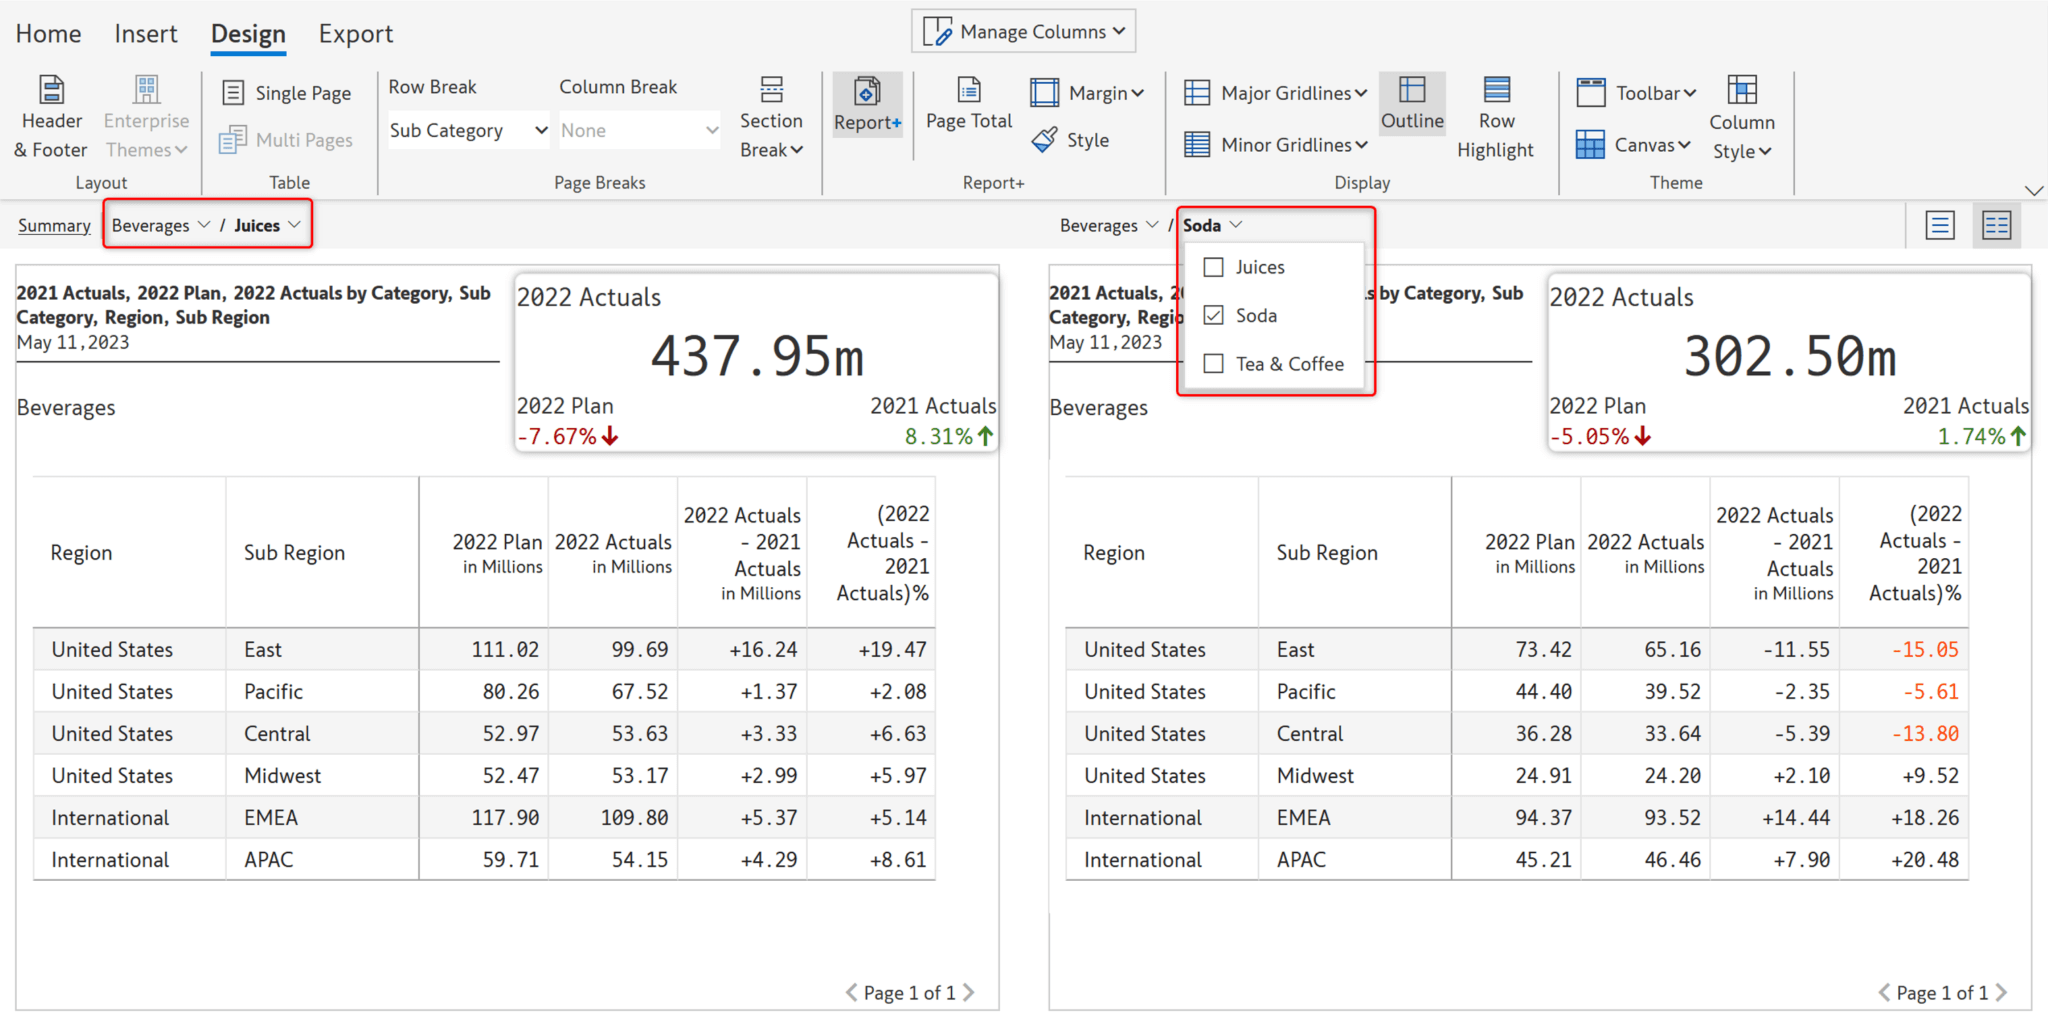
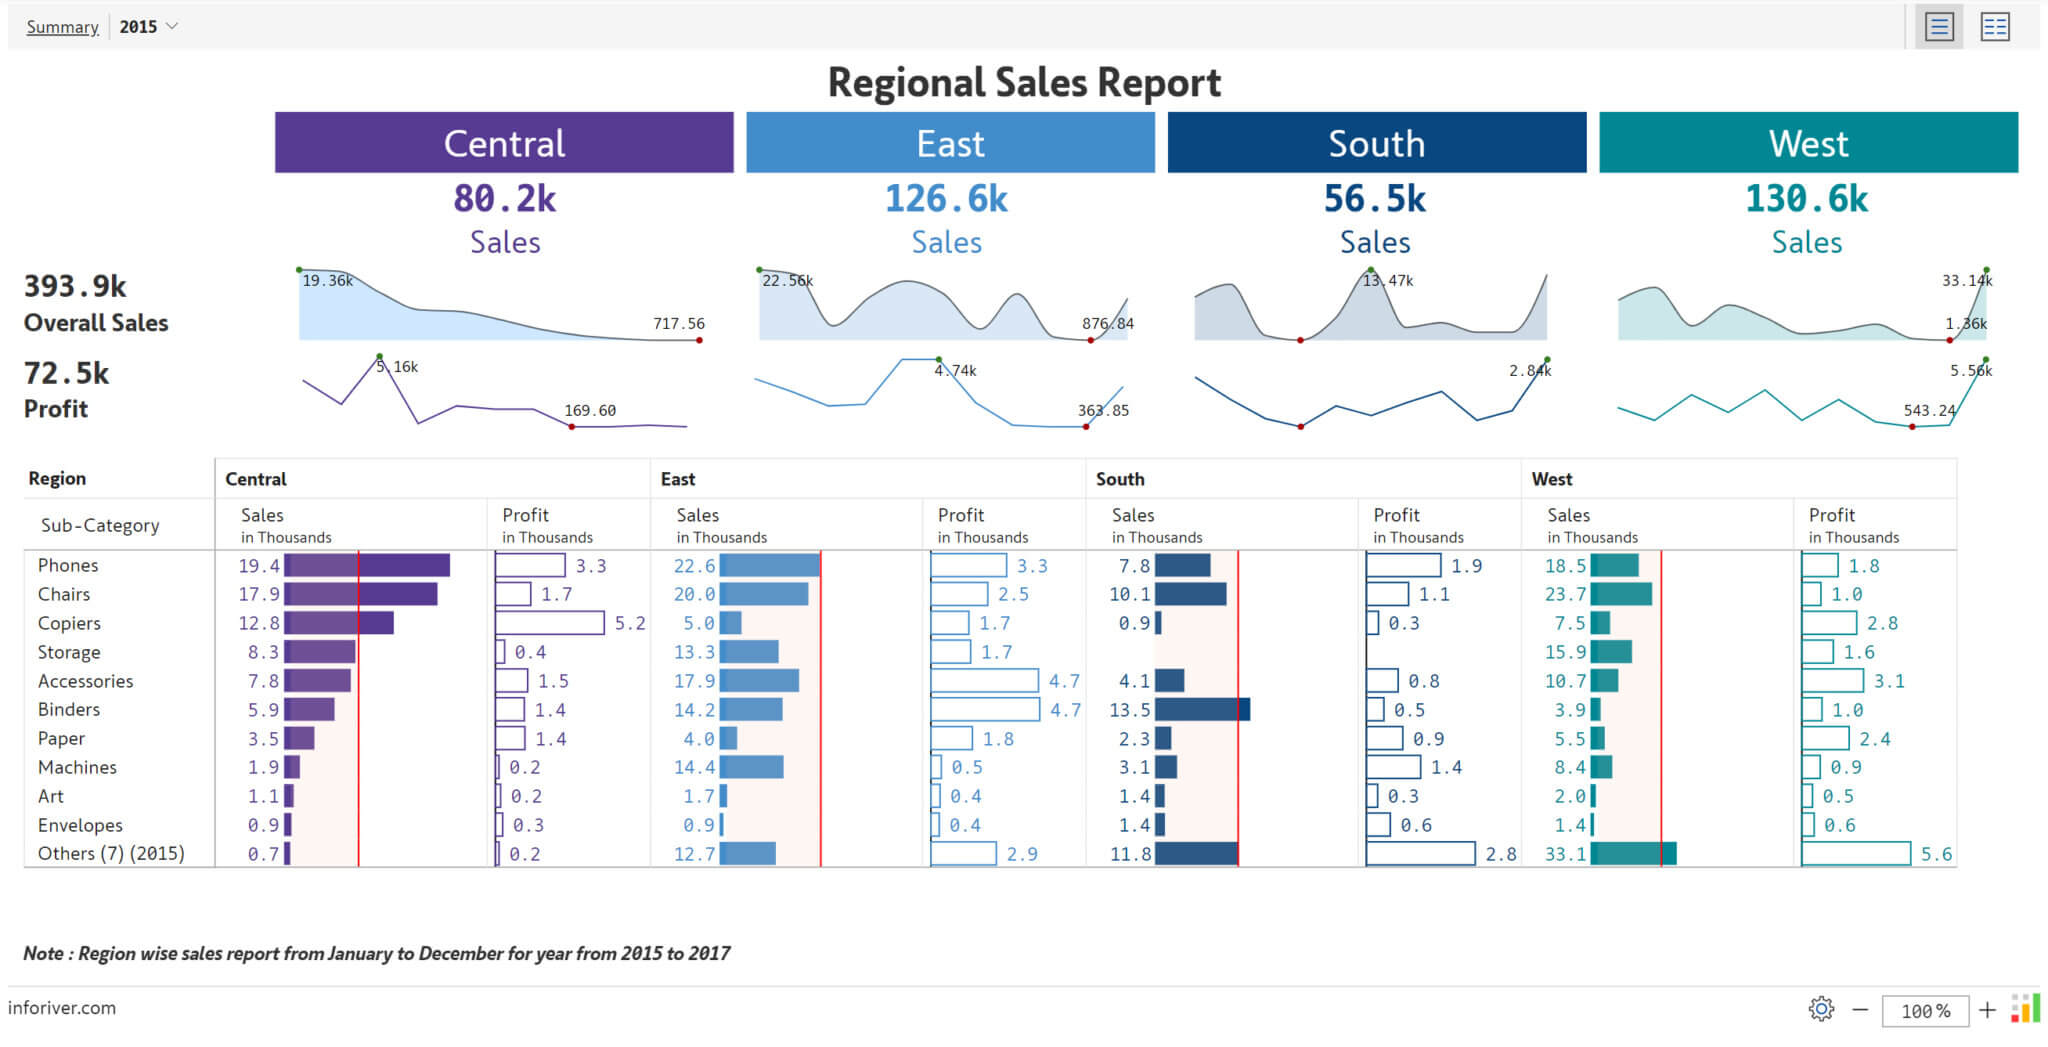
Compare regions or categories side-by-side in a single click using the comparison view in Report+ module.
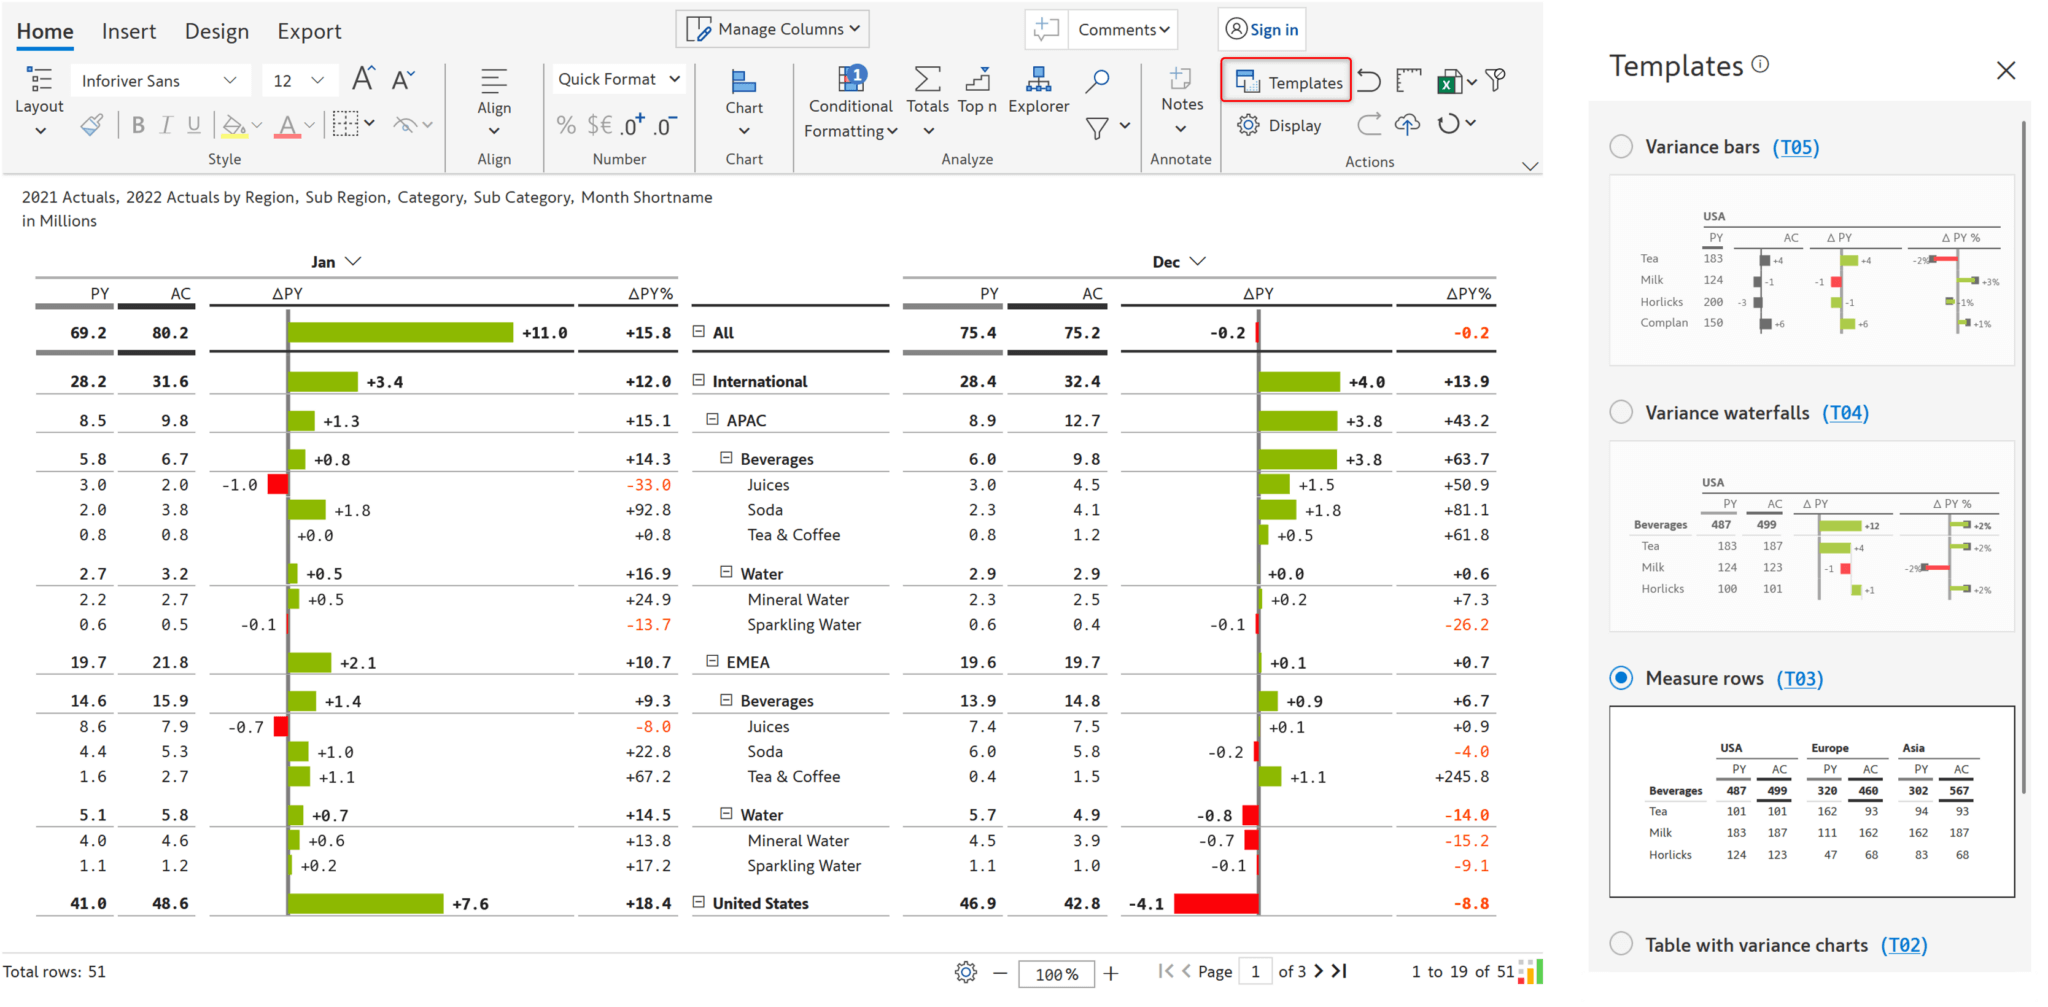
Create paginated reports with categorical data side-by-side across two periods, such as MoM comparison or month vs. YTD comparison, in a single click using IBCS templates.
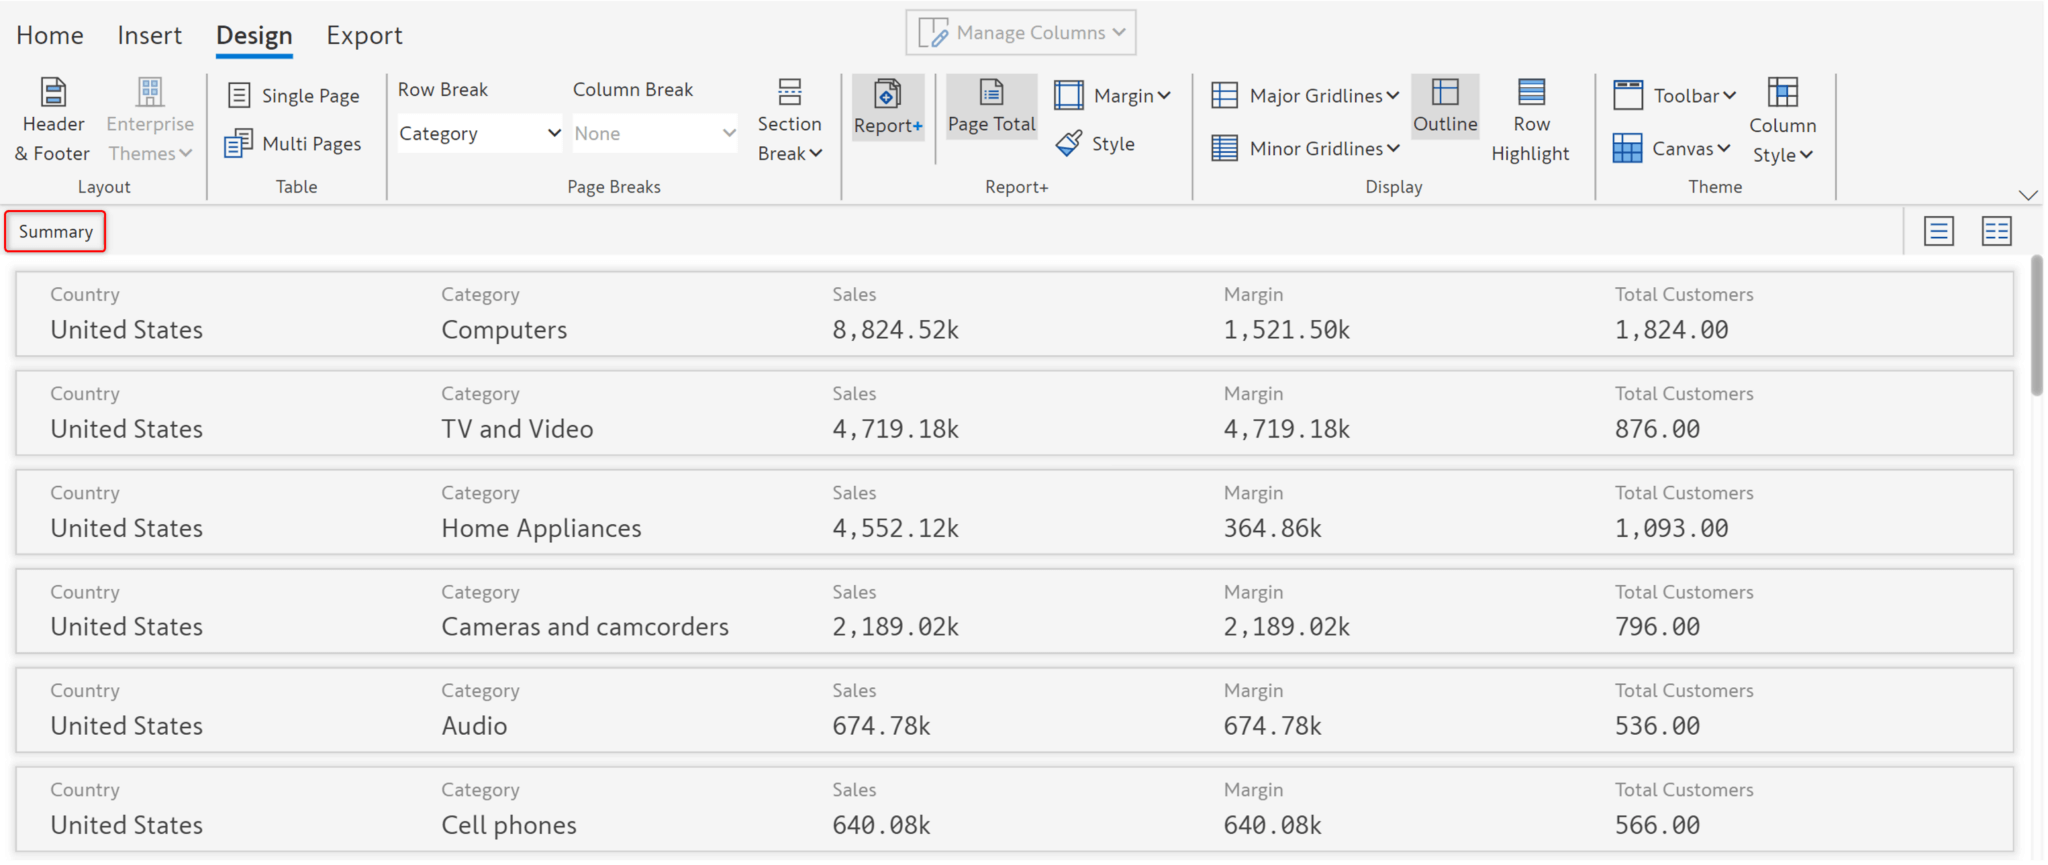
Use the summary layout to view a summary of the categories and the measures in your paginated report.
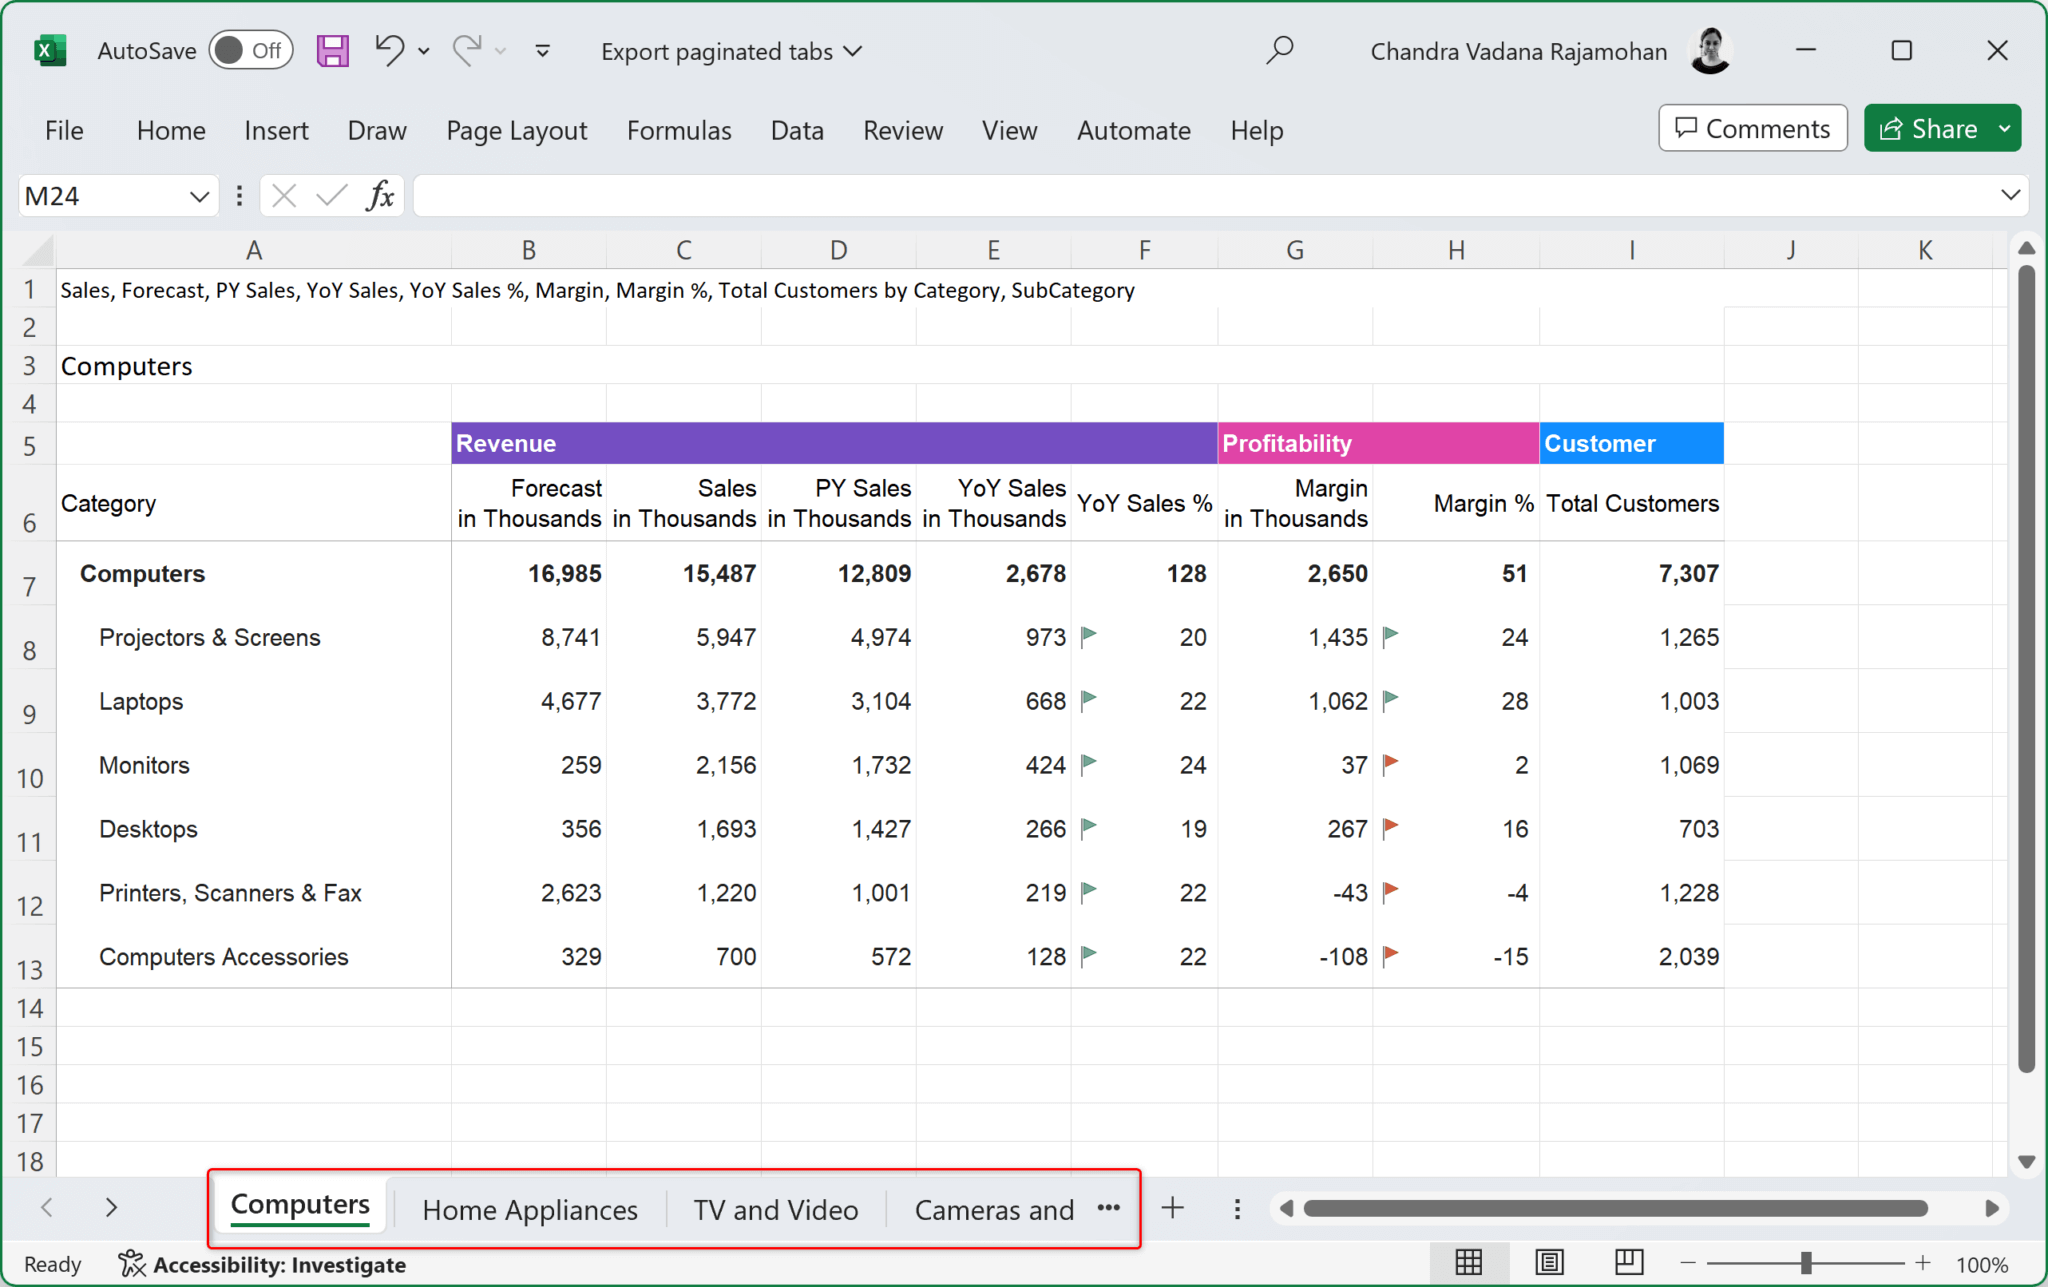
Export each page in a paginated report to a different worksheet in Excel, along with cell and value formatting, charts, conditional formatting, notes, etc.
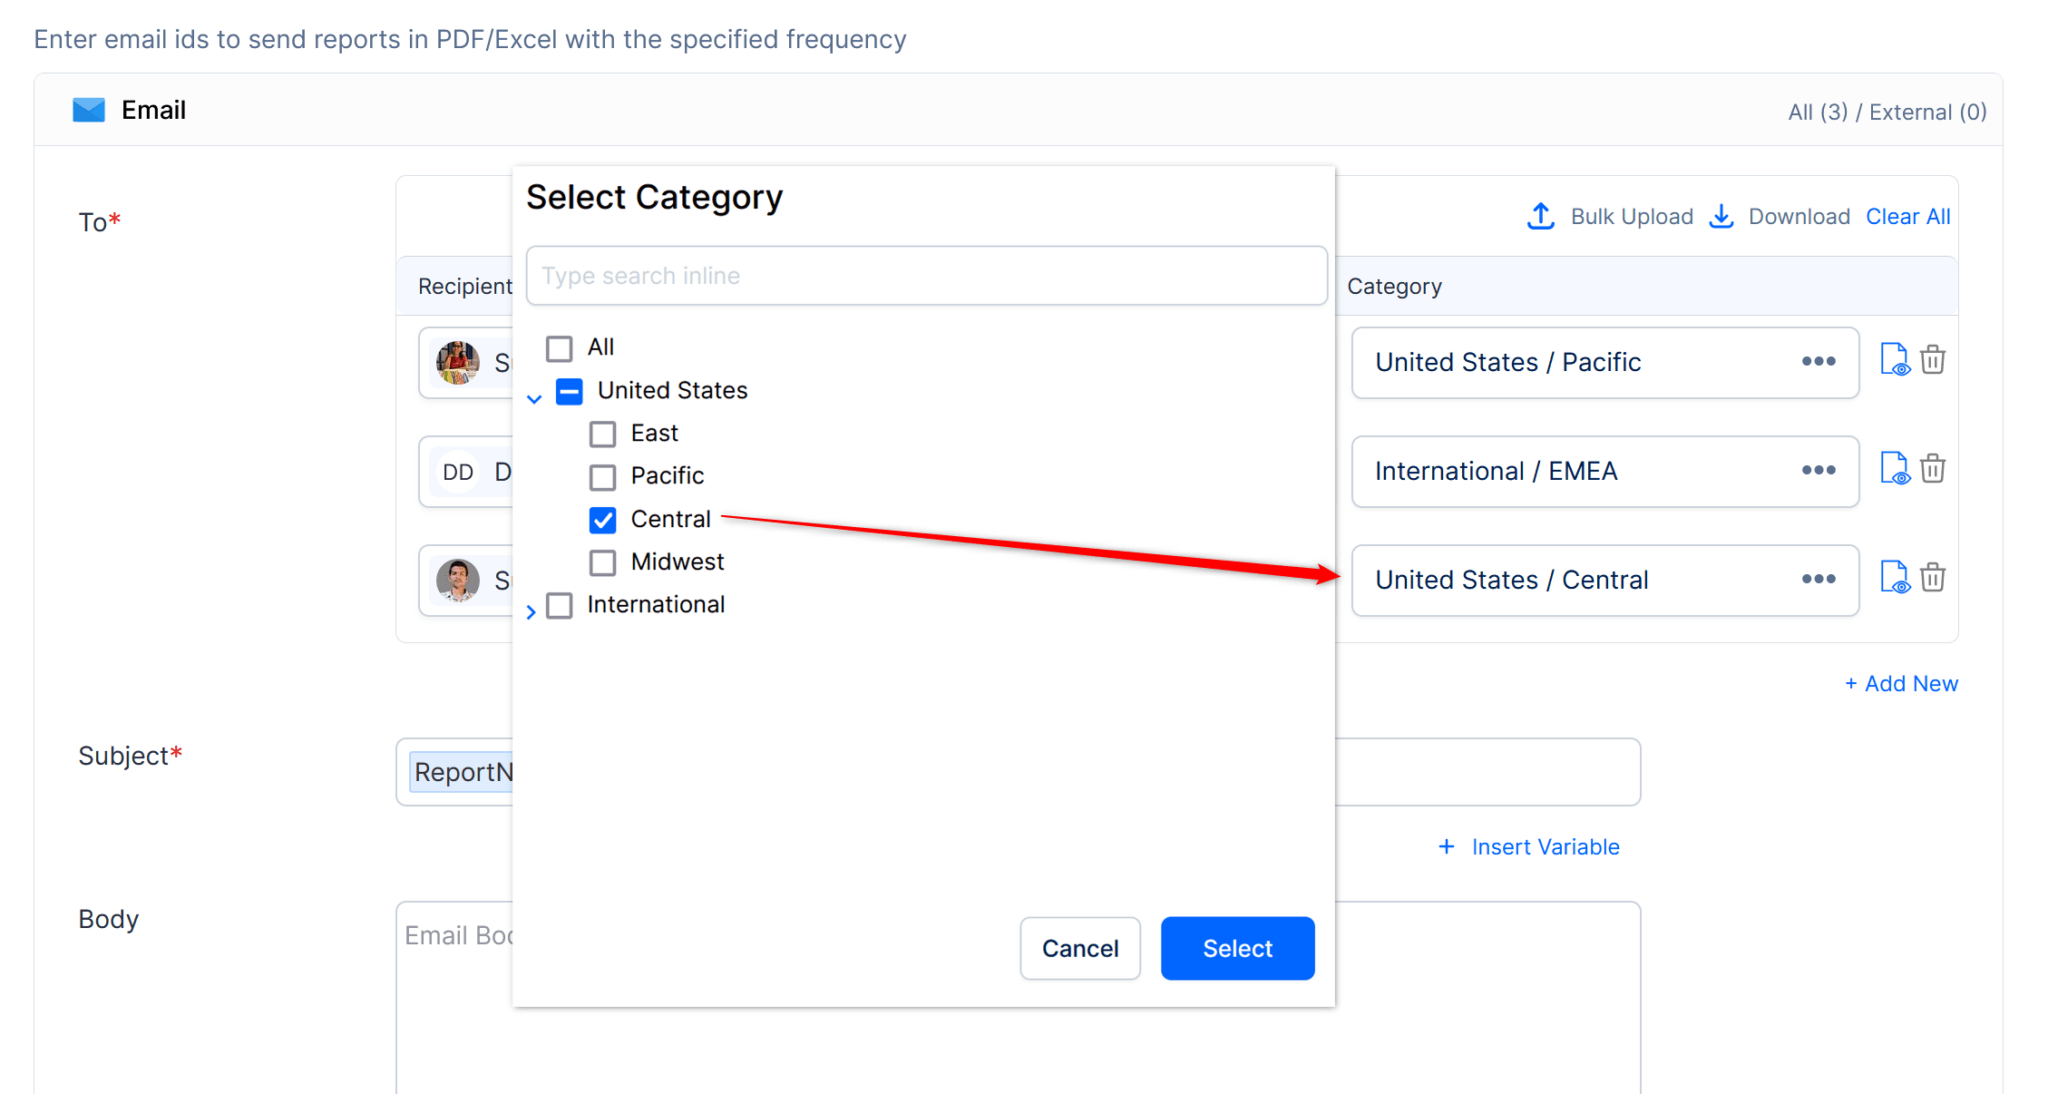
Filter records based on specific category values and schedule paginated reports to particular users (e.g., Send US records to the US Regional Head, EMEA records to the EMEA Regional Manager, etc.).
Check out some of the examples of formatted paginated statements delivered by Inforiver.
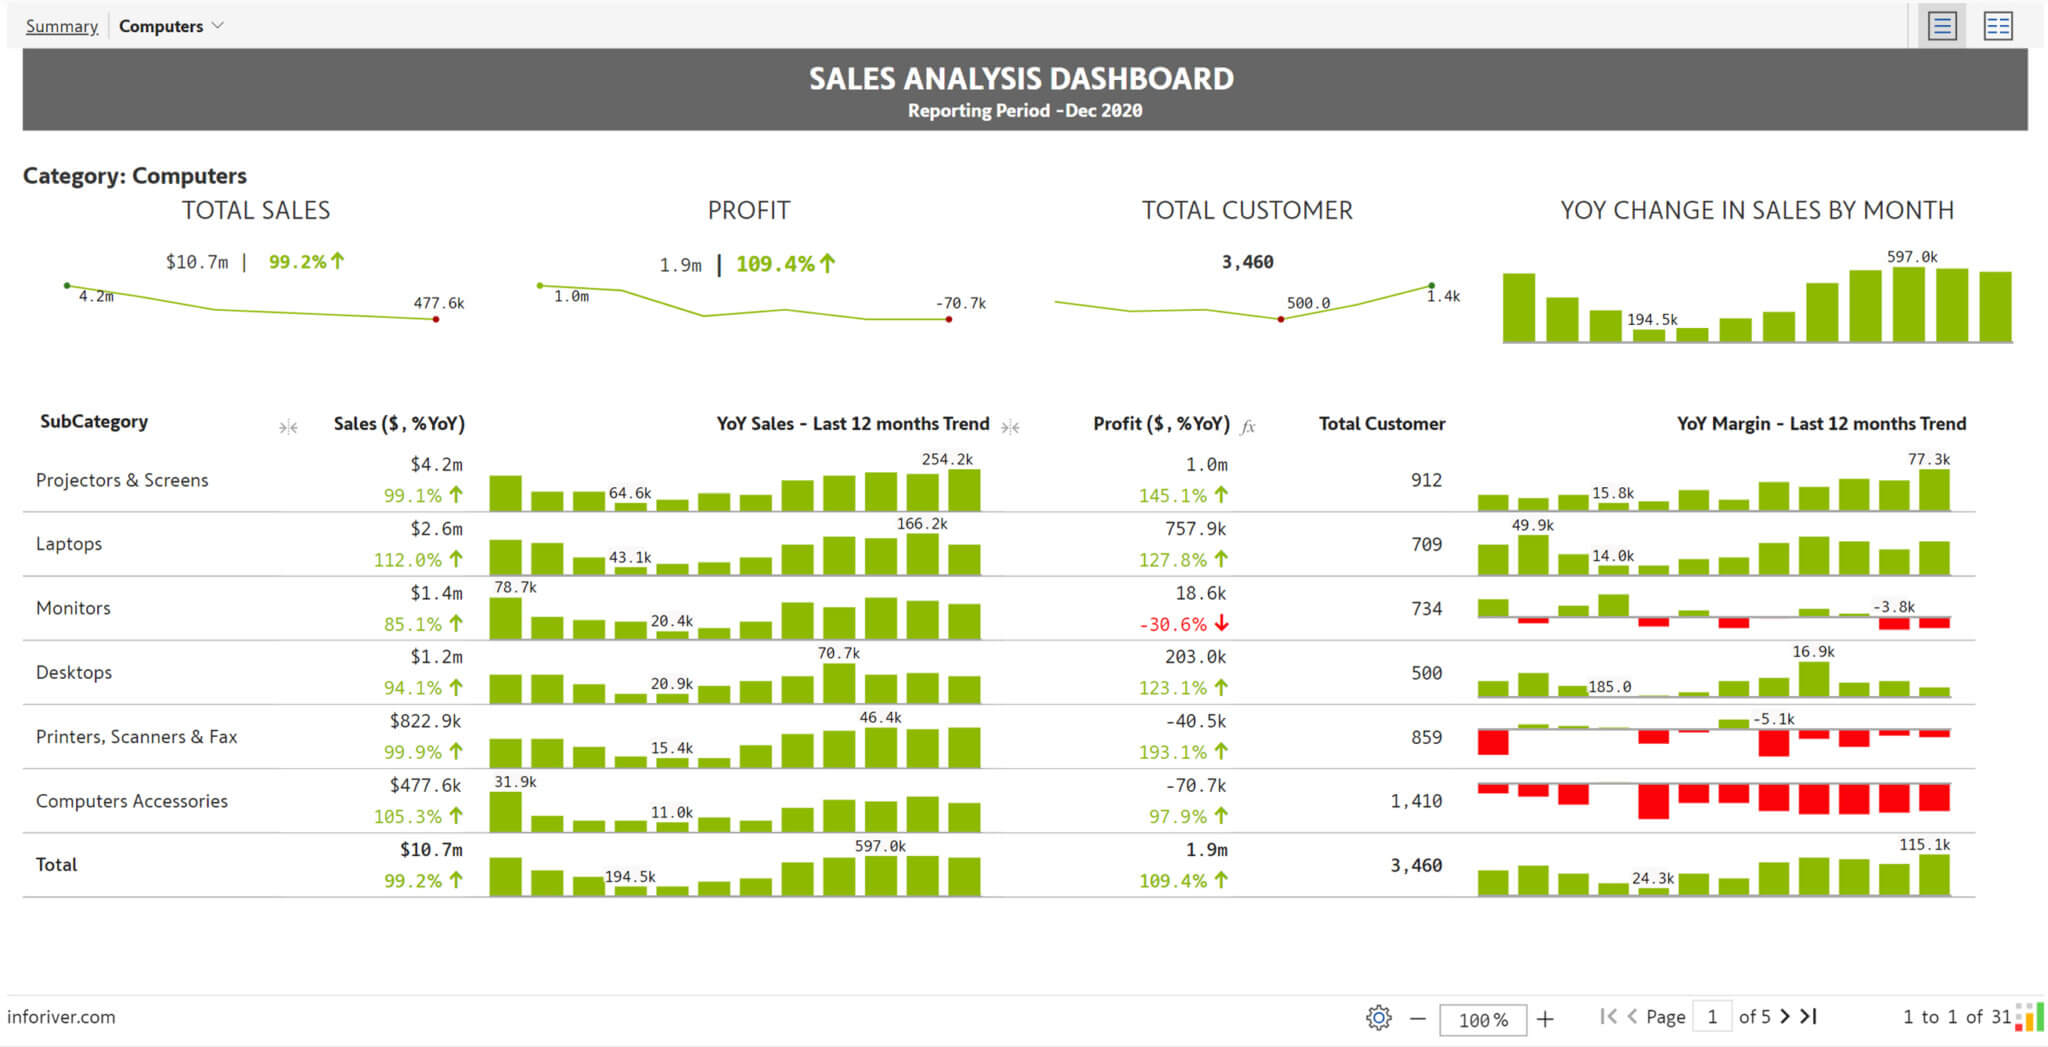
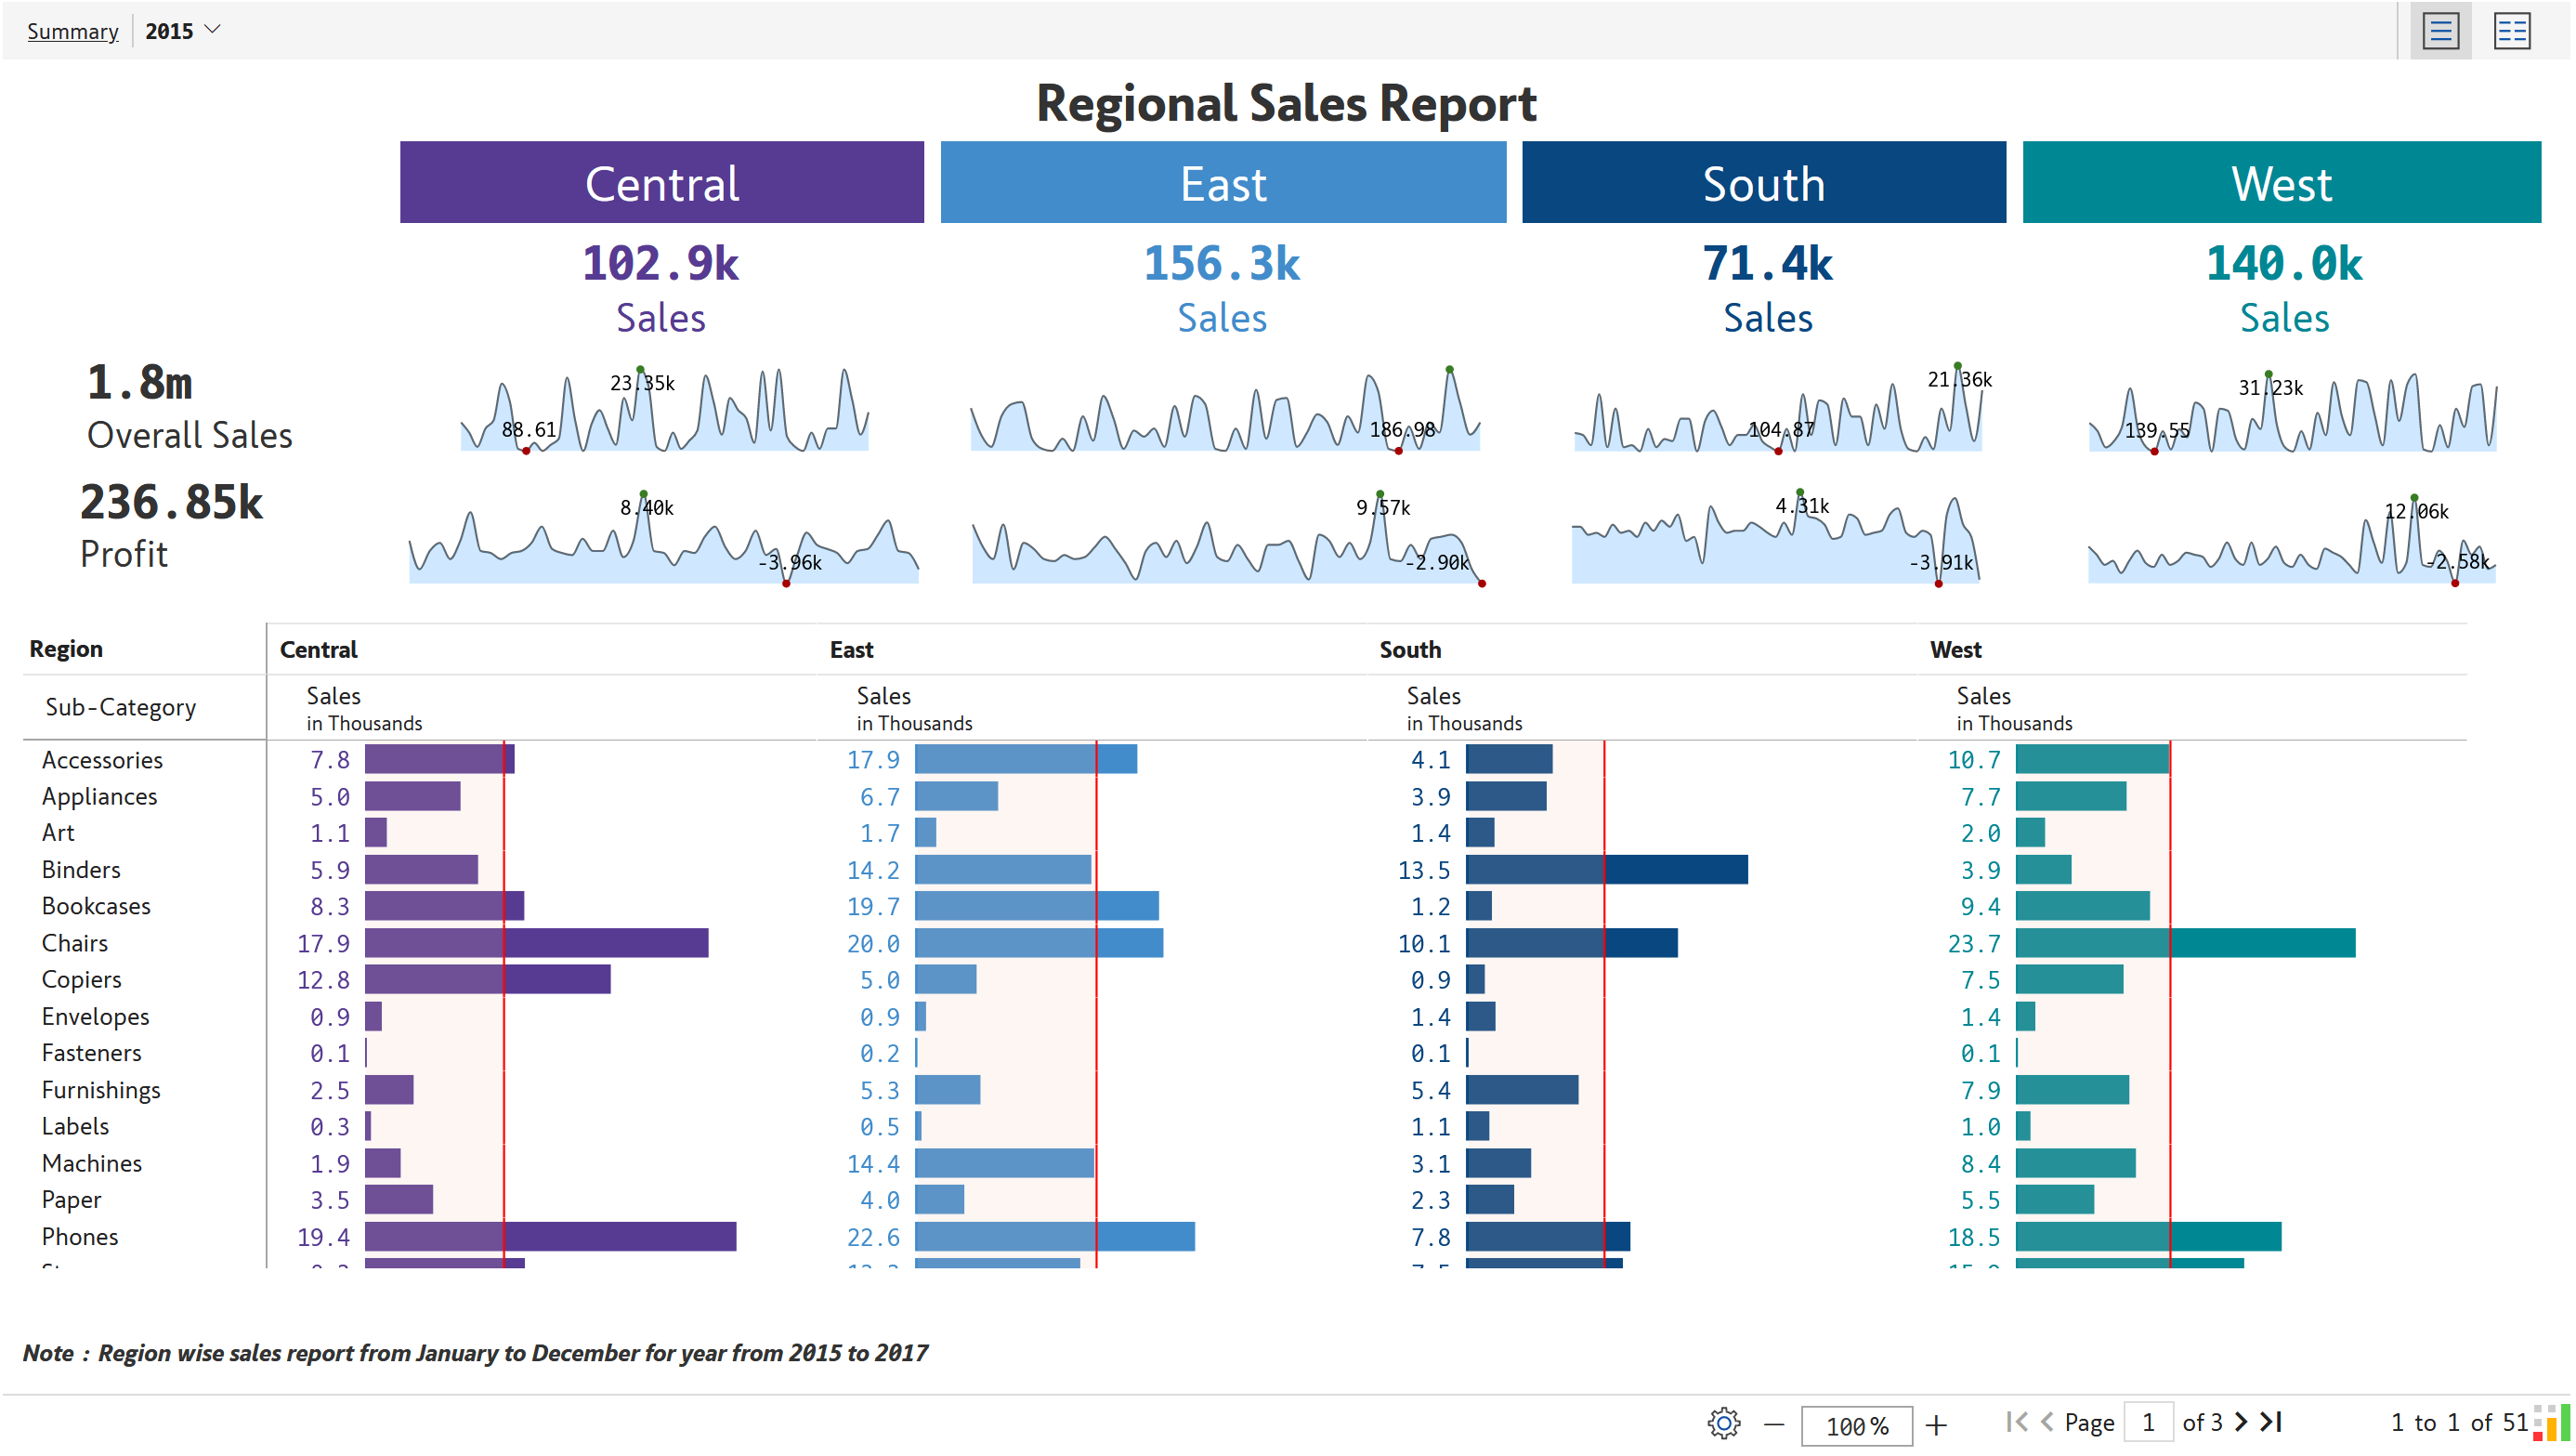
This report displays the monthly sales and profit trends and sub-category level values based on year selection in the dropdown on the top left.
In this report, the header uses charts and KPI cards. Images and text content can also be added from the ‘Design’ tab -> ‘Header & Footer’ option.
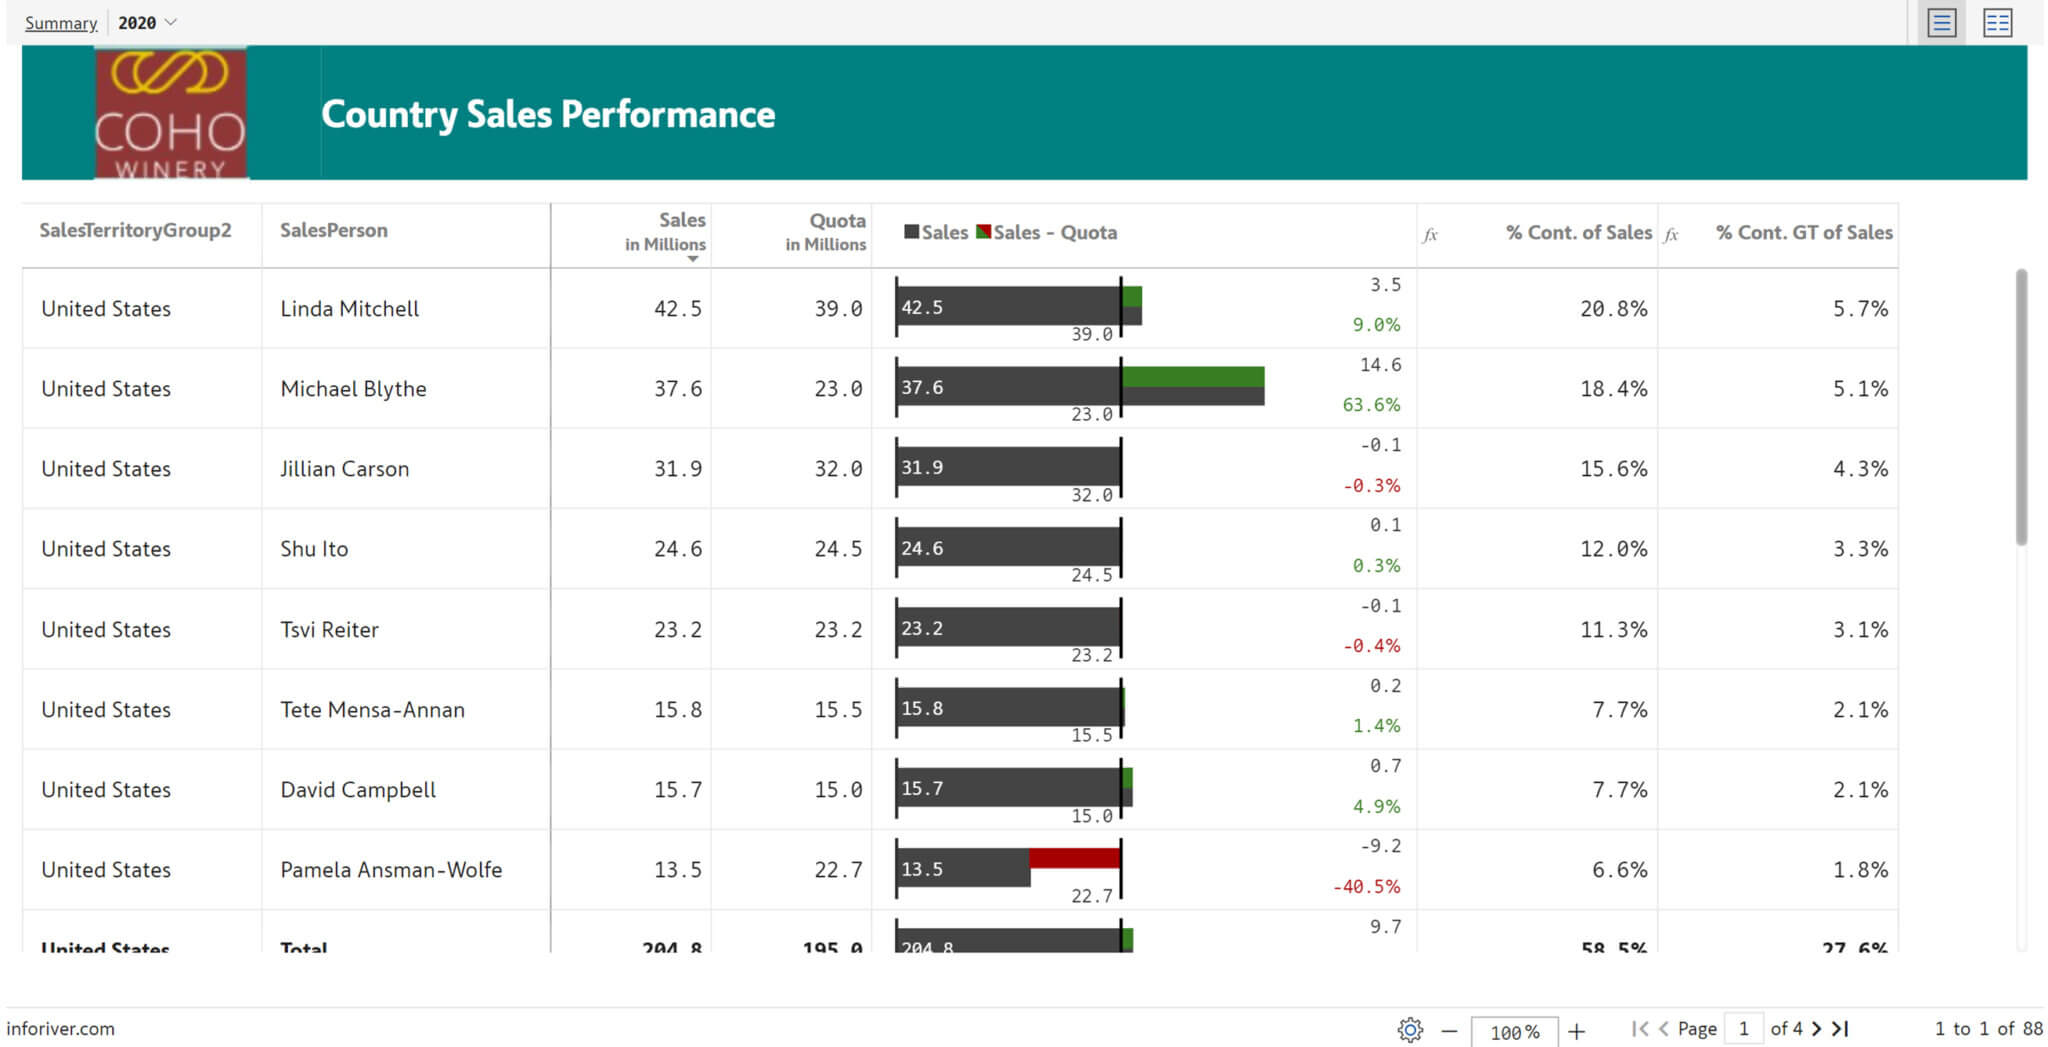
The monthly sales and sales quota are compared using bullet charts. Calculated columns are inserted to show the sales contribution.
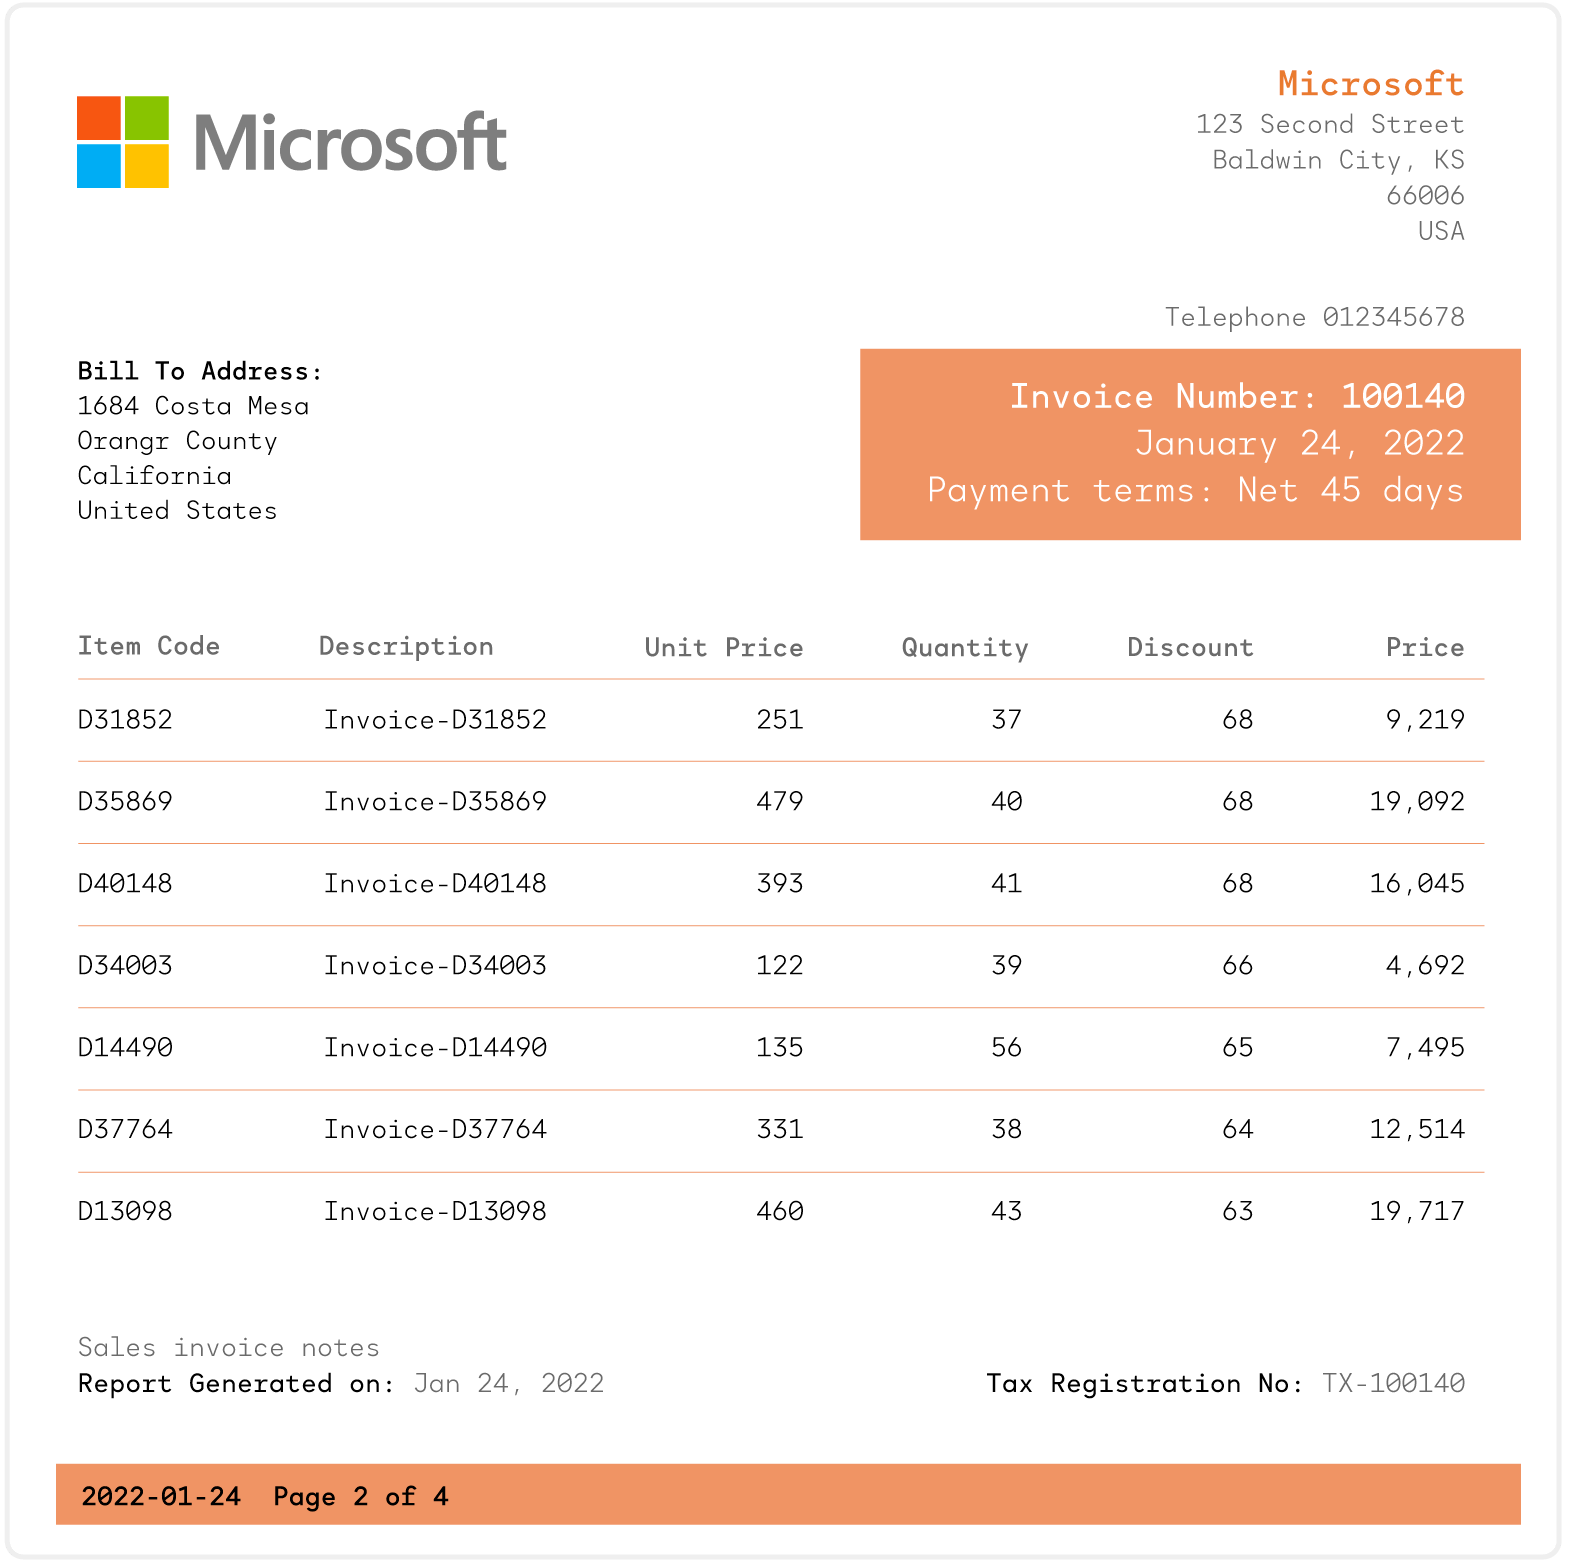
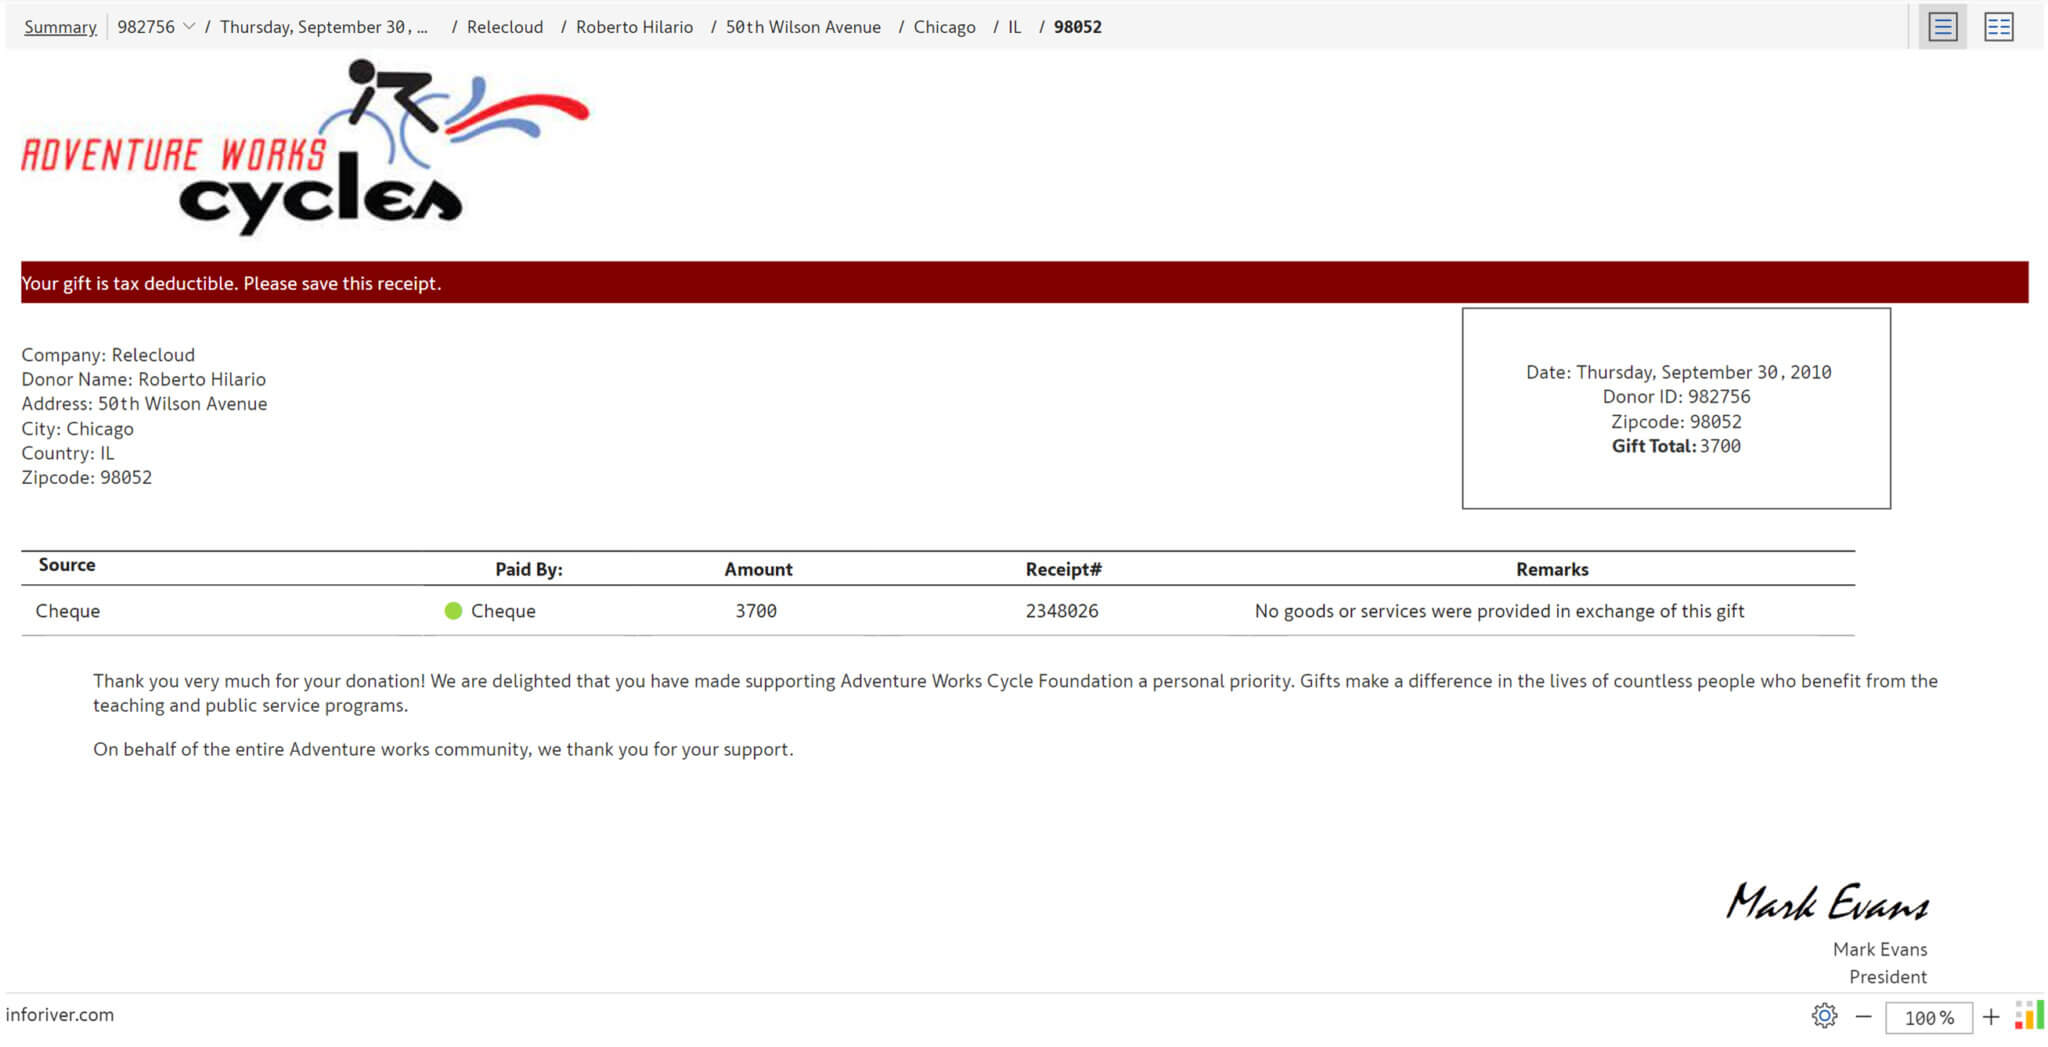
This example shows a highly formatted invoice with multi-line headers, text, and dropdown data input columns.
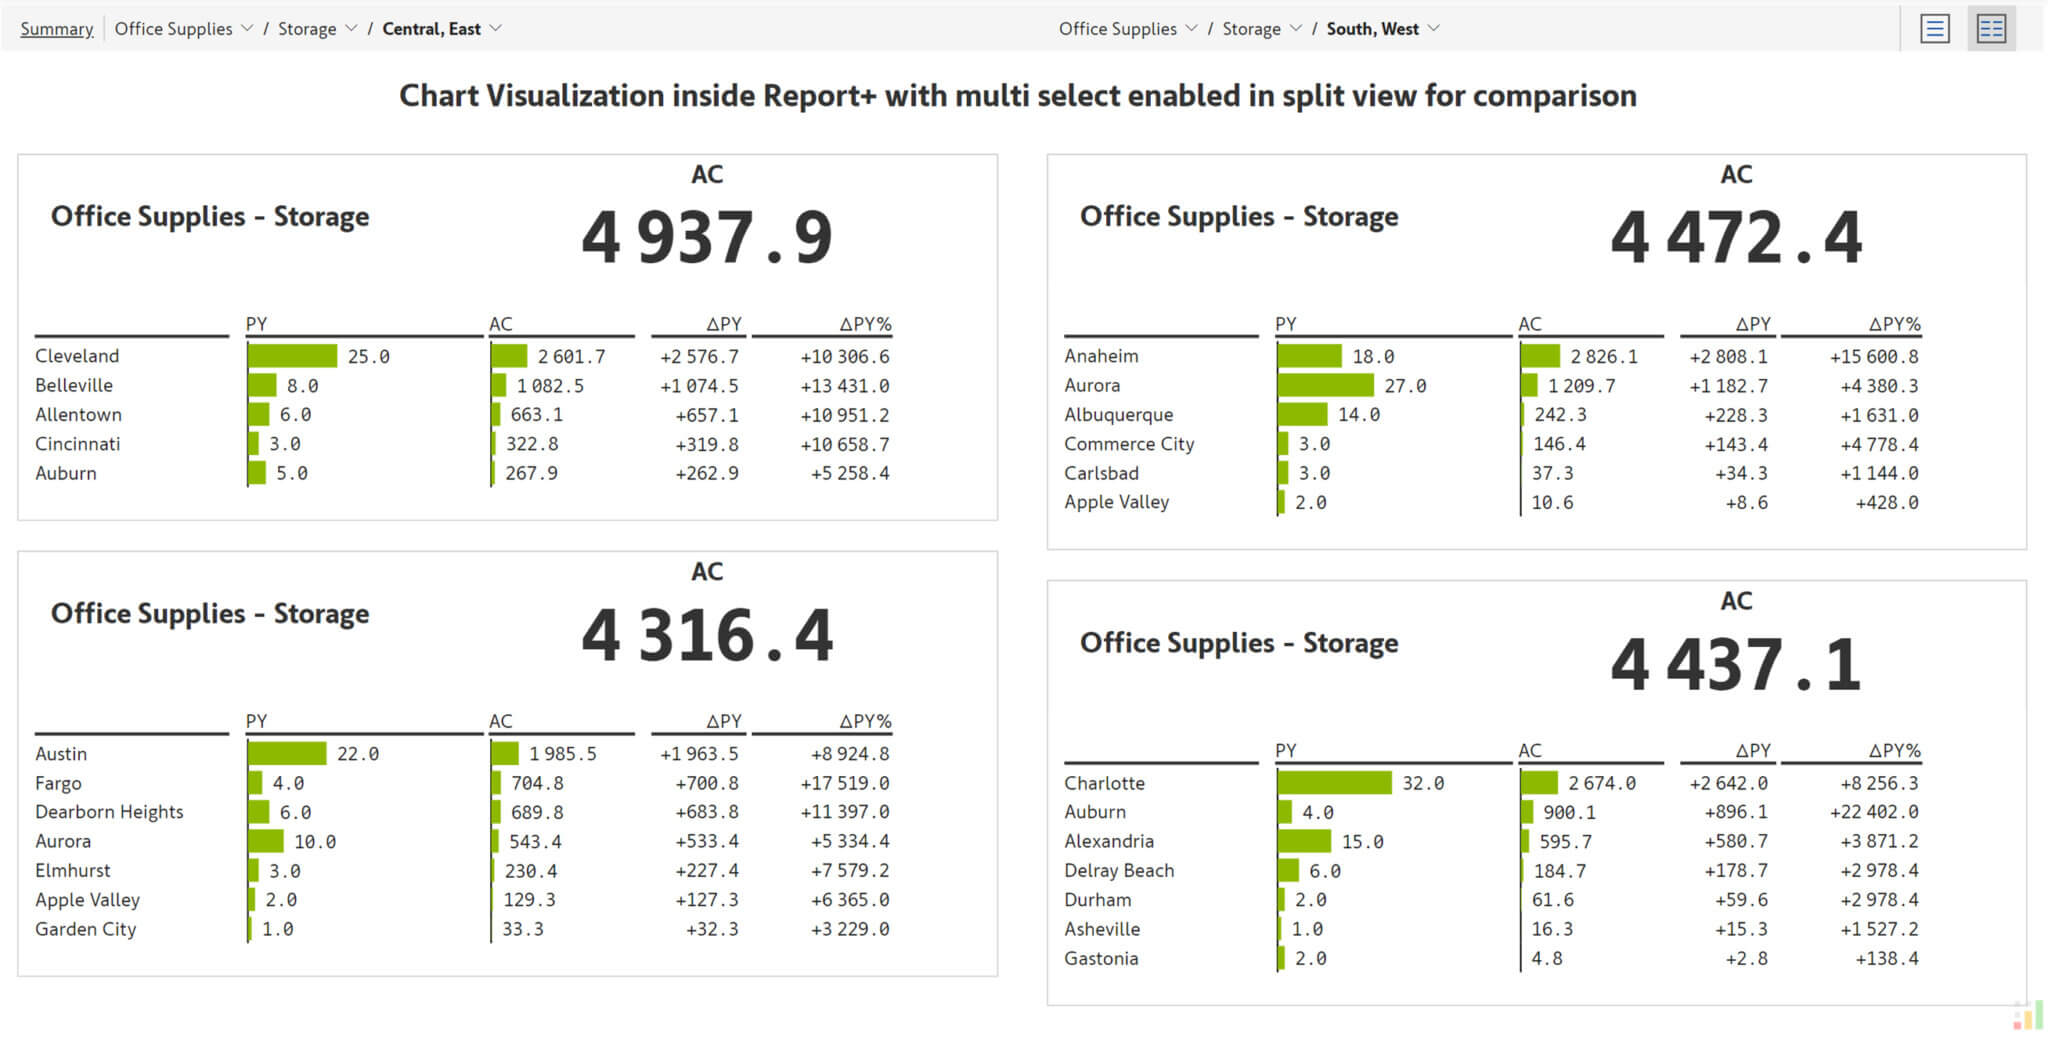
This report compares several product categories using the ‘Comparison’ view in ‘Report+’. The selections can be changed using the dropdowns in the top menu.
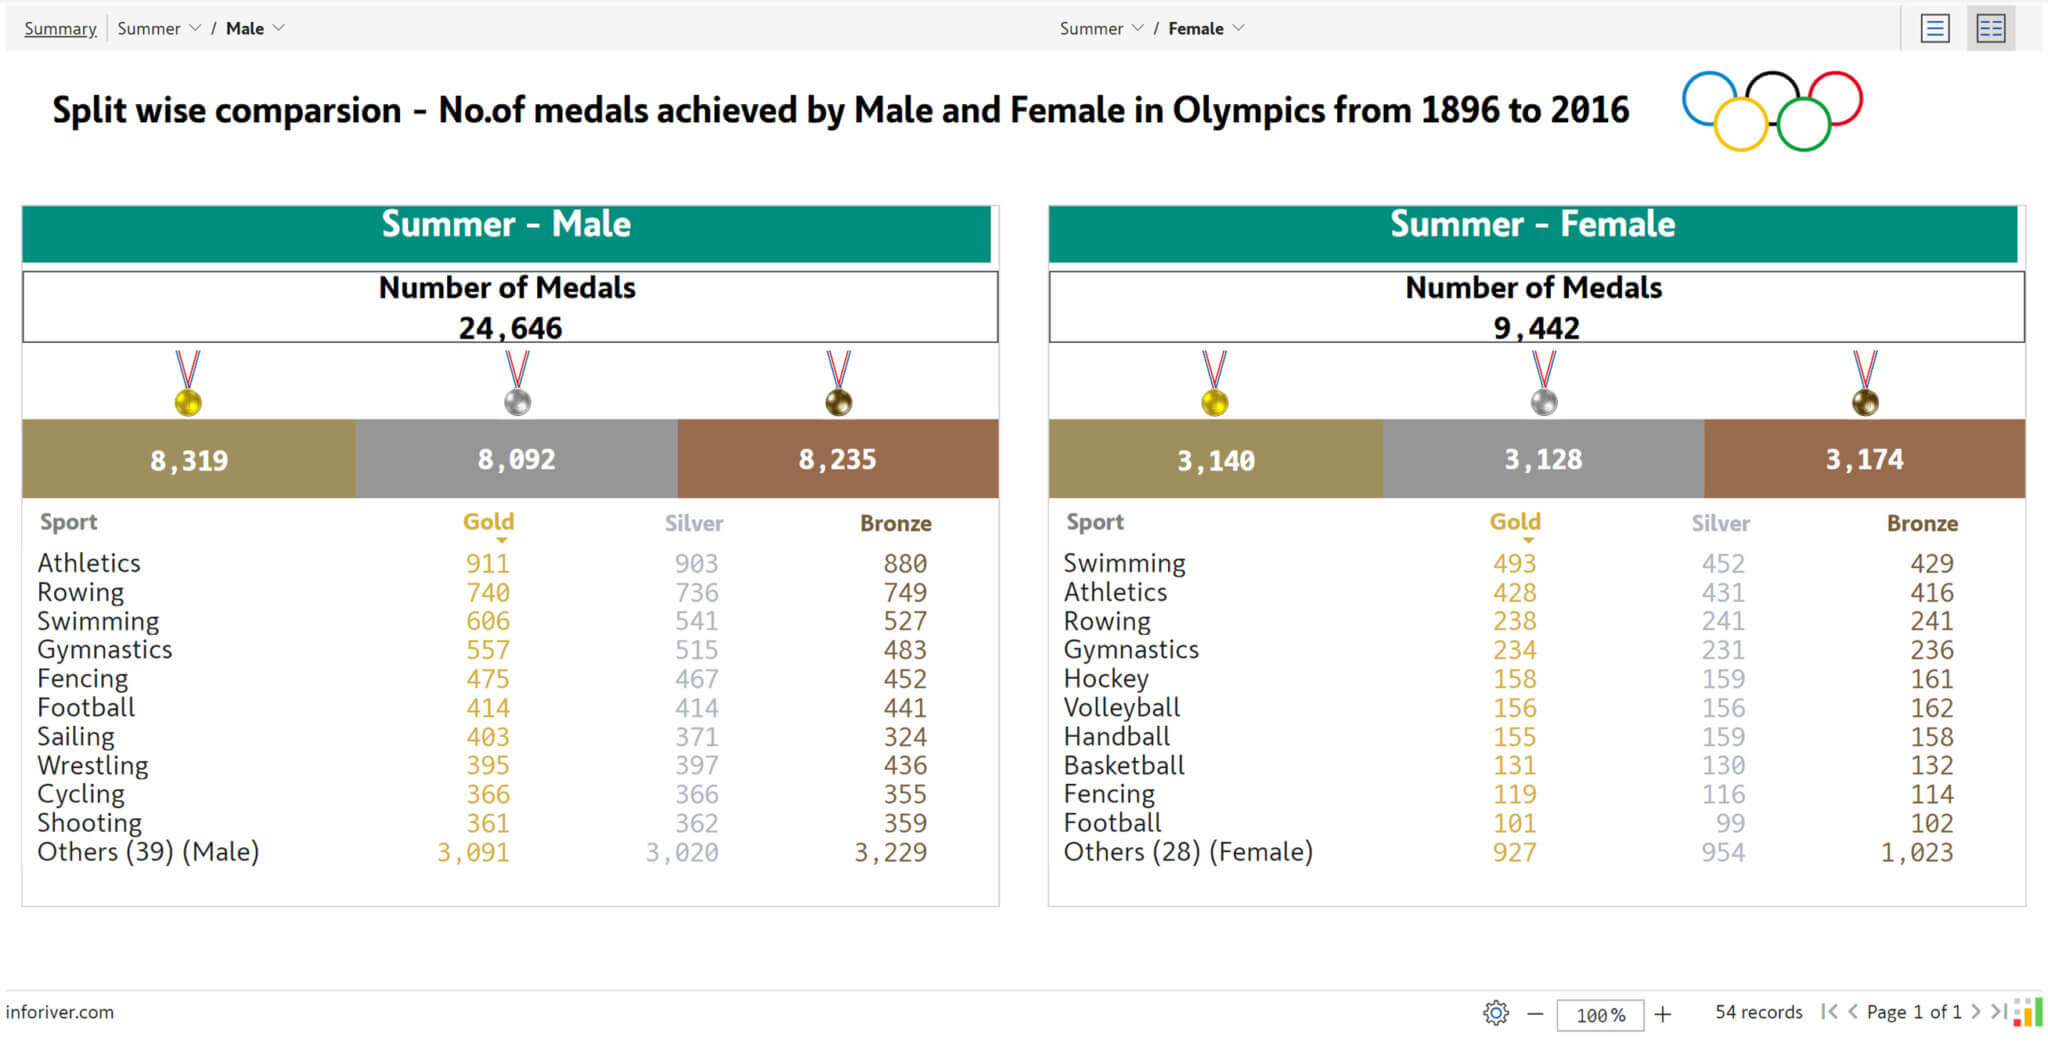
In this report, the number of medals achieved by male and female contestants for each sport are shown side by side. The top N filter has been applied to show only the top 10 sports based on medals.

Inforiver helps enterprises consolidate planning, reporting & analytics on a single platform (Power BI). The no-code, self-service award-winning platform has been recognized as the industry’s best and is adopted by many Fortune 100 firms.
Inforiver is a product of Lumel, the #1 Power BI AppSource Partner. The firm serves over 3,000 customers worldwide through its portfolio of products offered under the brands Inforiver, EDITable, ValQ, and xViz.
