
Upcoming webinar on 'Inforiver Charts : The fastest way to deliver stories in Power BI', Aug 29th , Monday, 10.30 AM CST. Register Now
Upcoming webinar on 'Inforiver Charts : The fastest way to deliver stories in Power BI', Aug 29th , Monday, 10.30 AM CST. Register Now
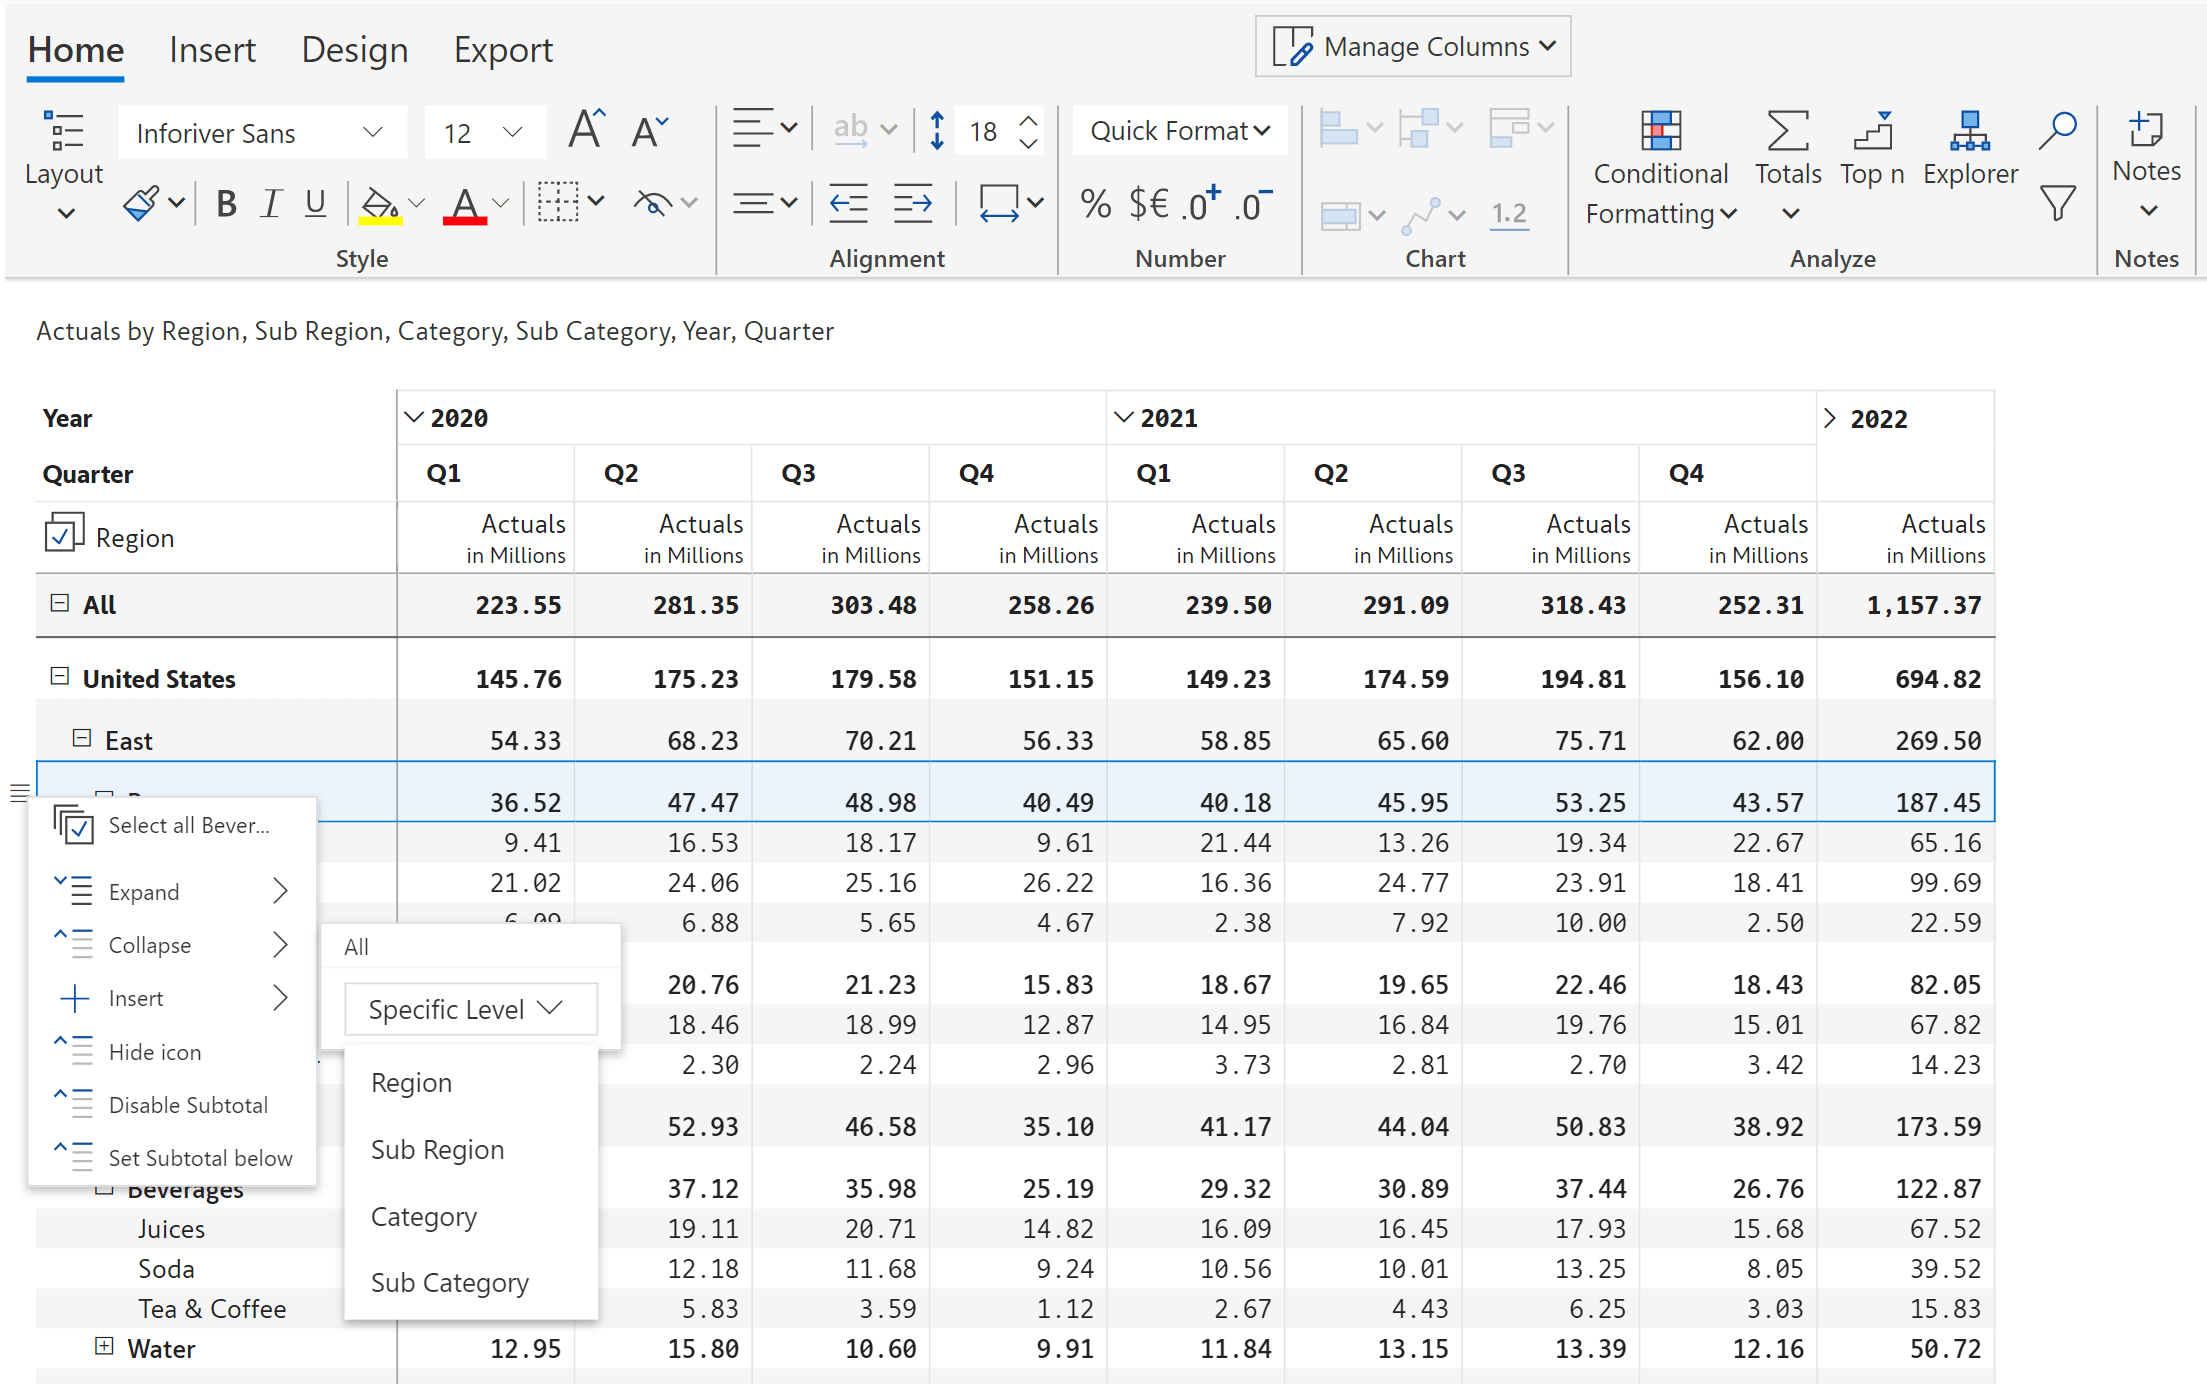
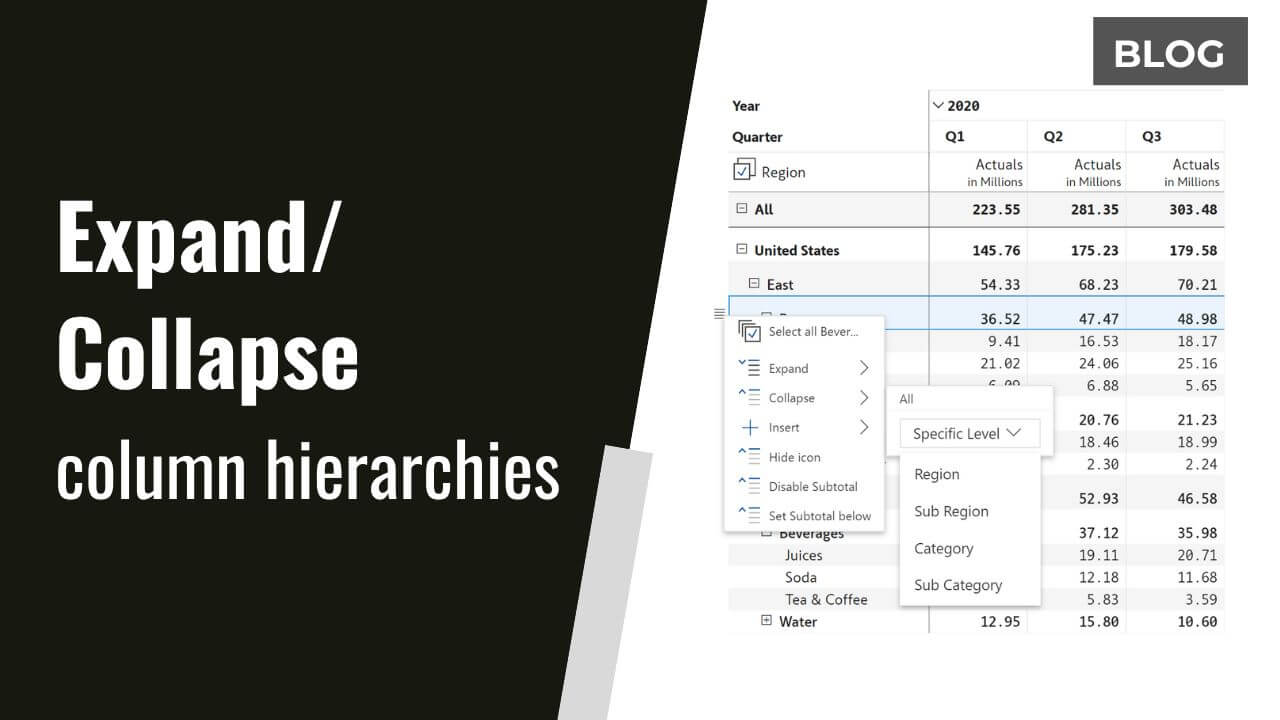
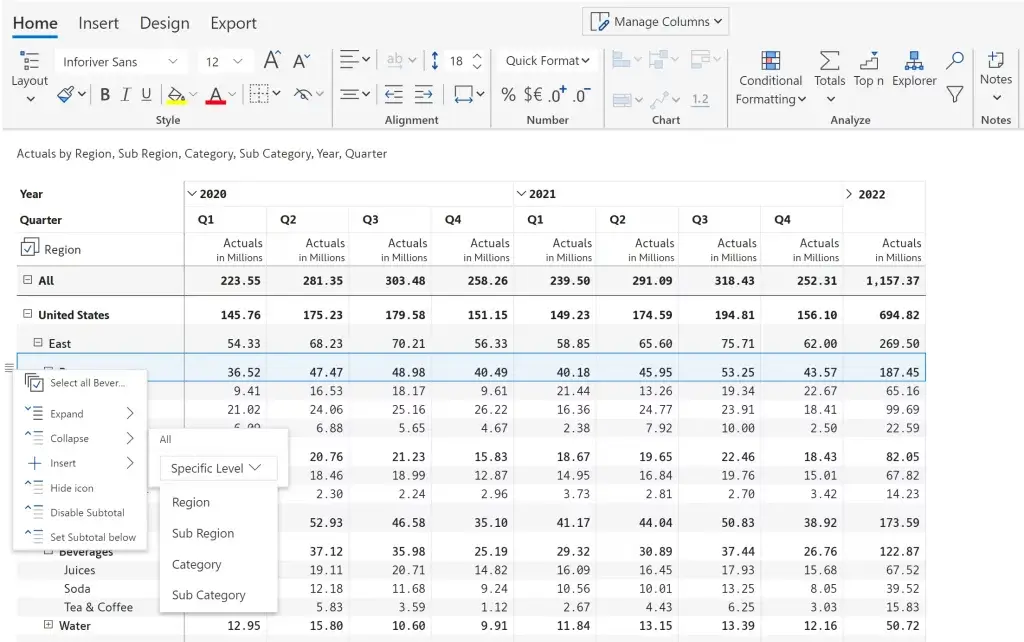
Expand/collapse row and column hierarchies to view all levels of data at once or specific levels without the need to drilldown
Inforiver offers flexible excel-like layouts such as classic, stepped, outline and more

Show measures on rows or columns using the pivot mode. Pivot mode can be applied to hierarchy, outline, table and stepped layouts

Rearrange and move around rows and columns using a click-and-drag action

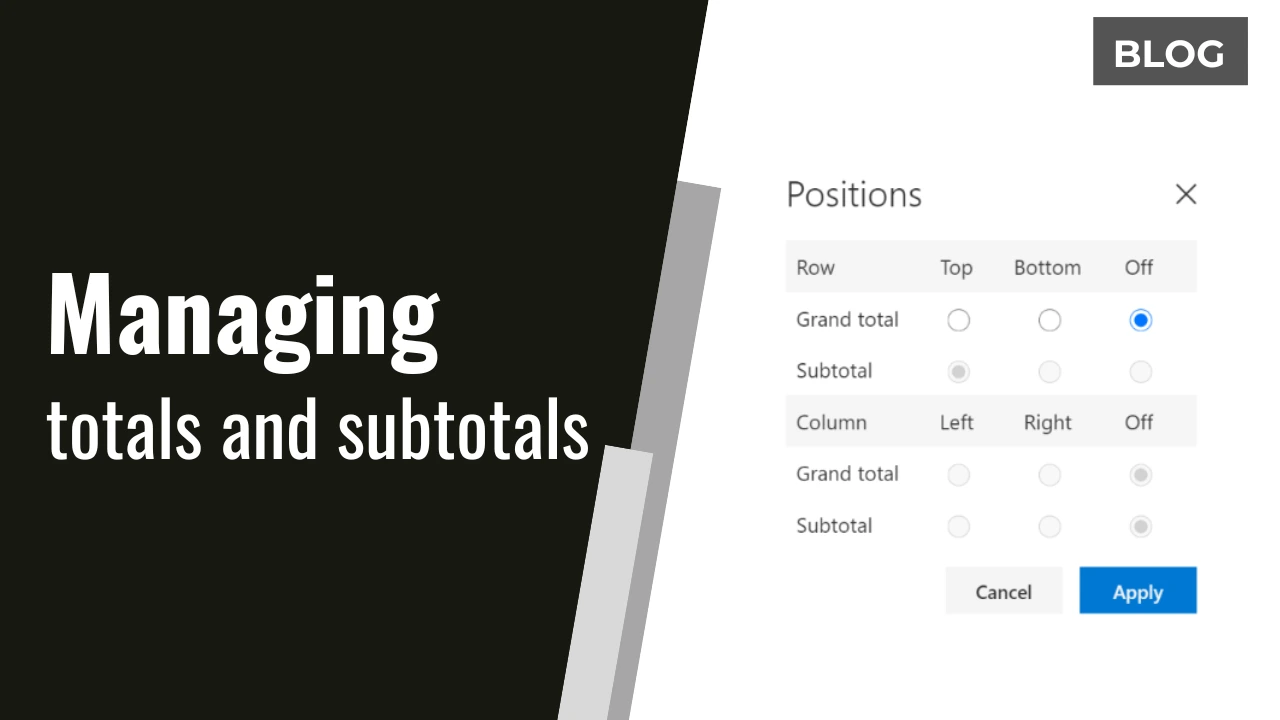
Turn on/off or change the positions of the totals and subtotals using a no-code interface. Inforiver also provides a split subtotals option

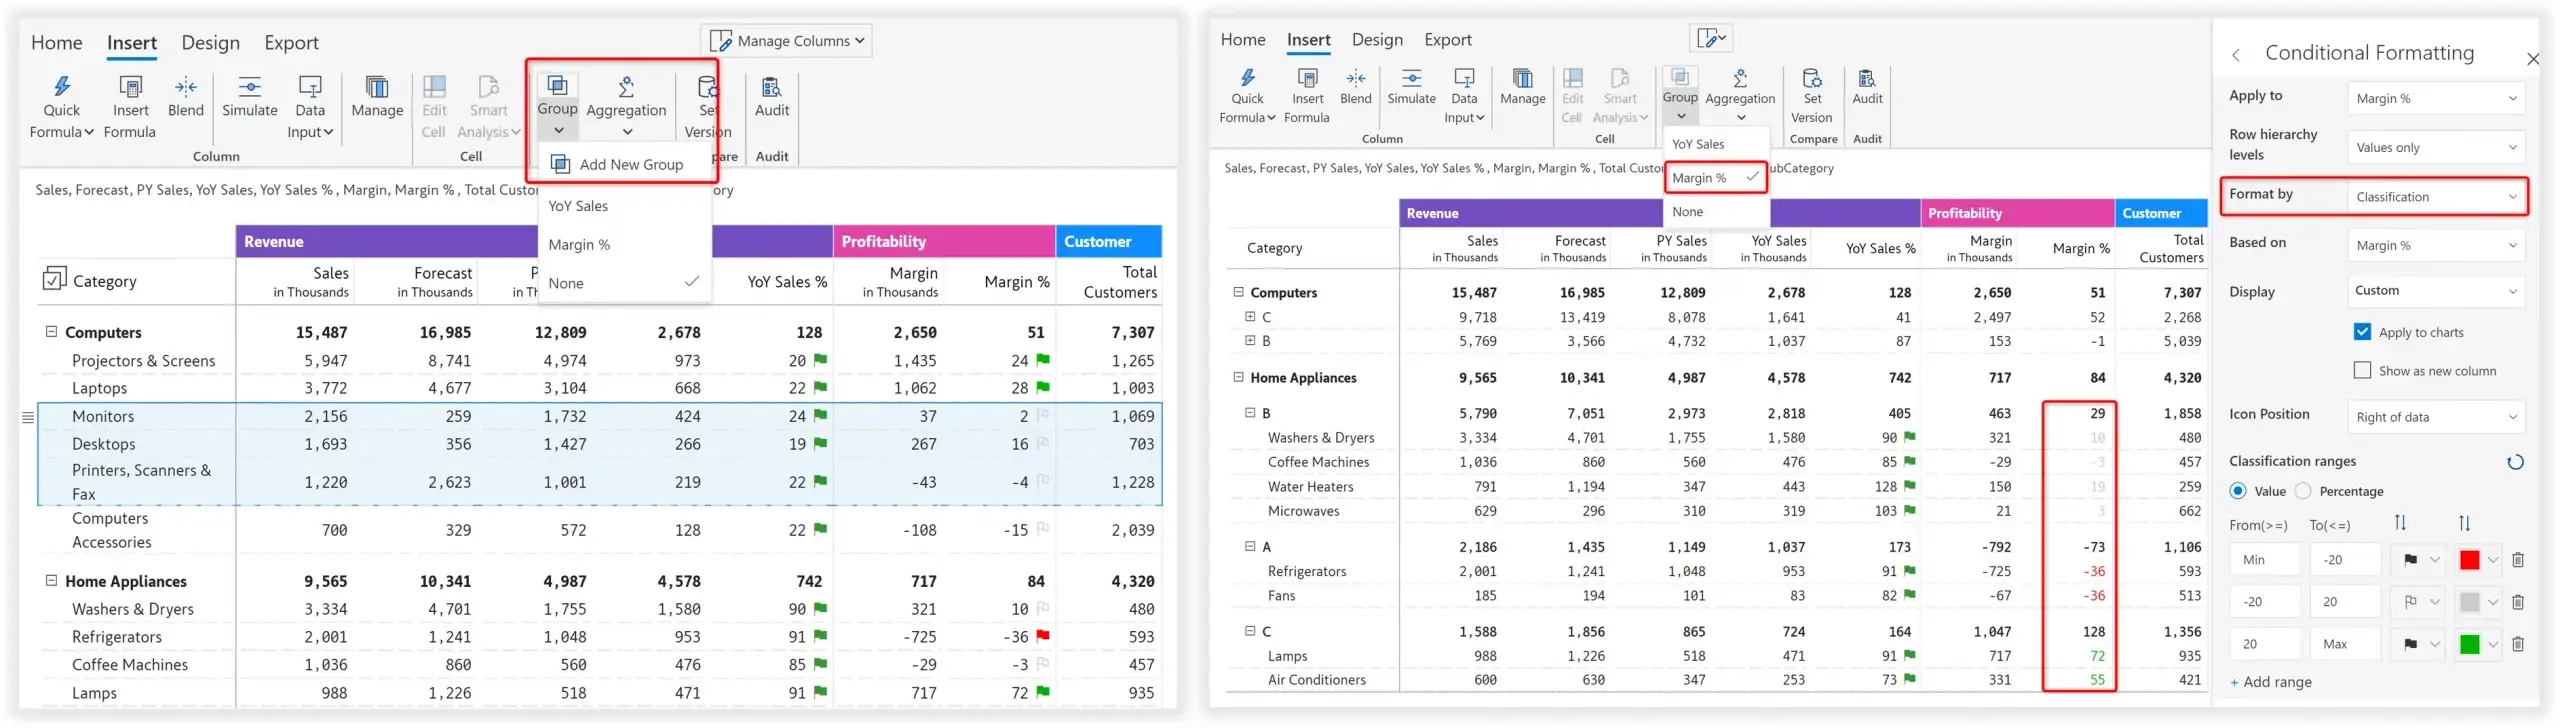
Define aggregations such as sum, average, min, max etc., for totals and subtotals at the visual-level without using DAX

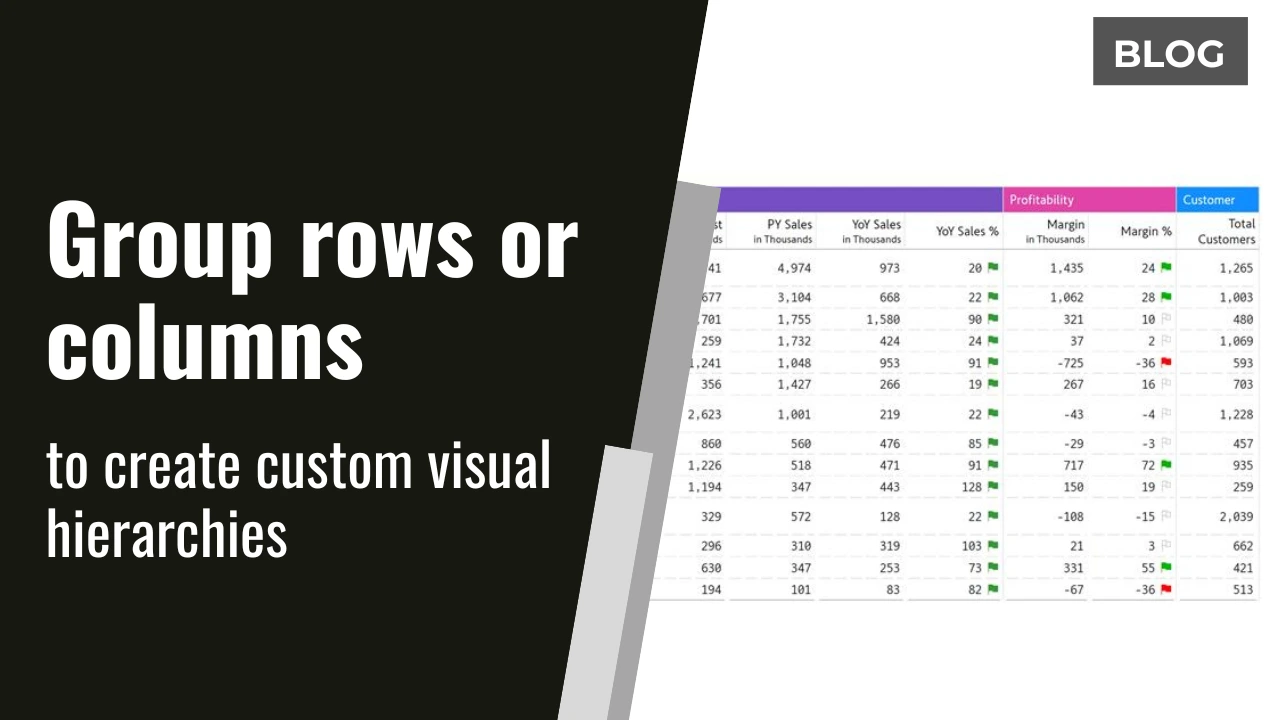
Create row and column hierarchies at the visual level just as you are used to doing in spreadsheets. When you group rows, the subtotal values are calculated automatically. Inforiver also provides auto-grouping of rows based on ABC classification
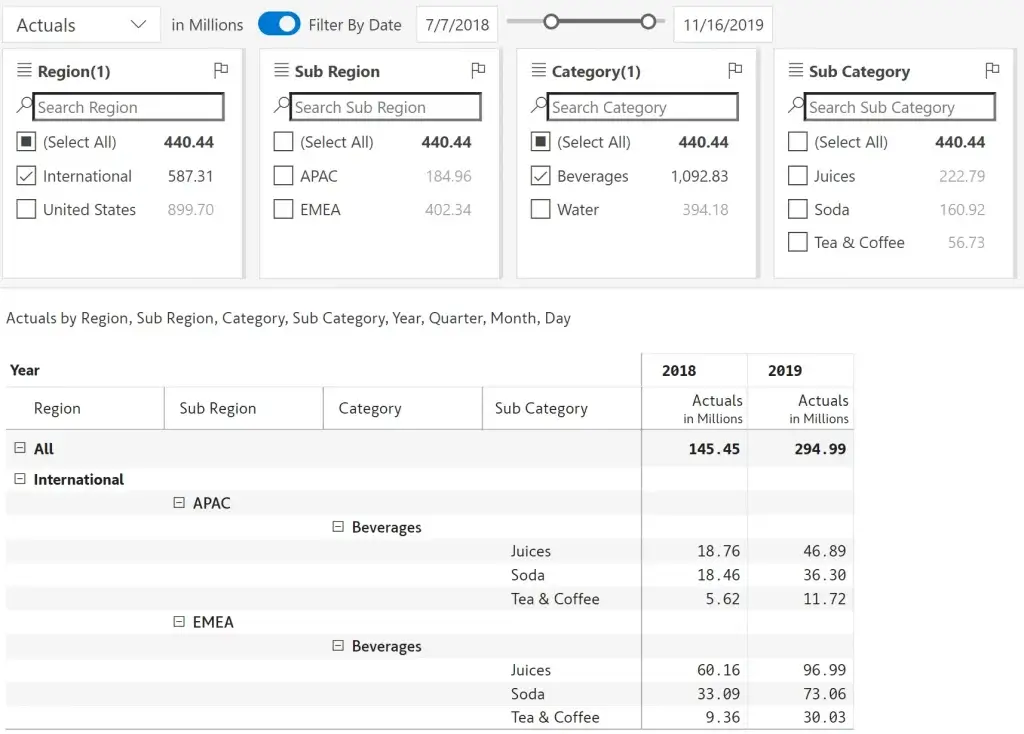
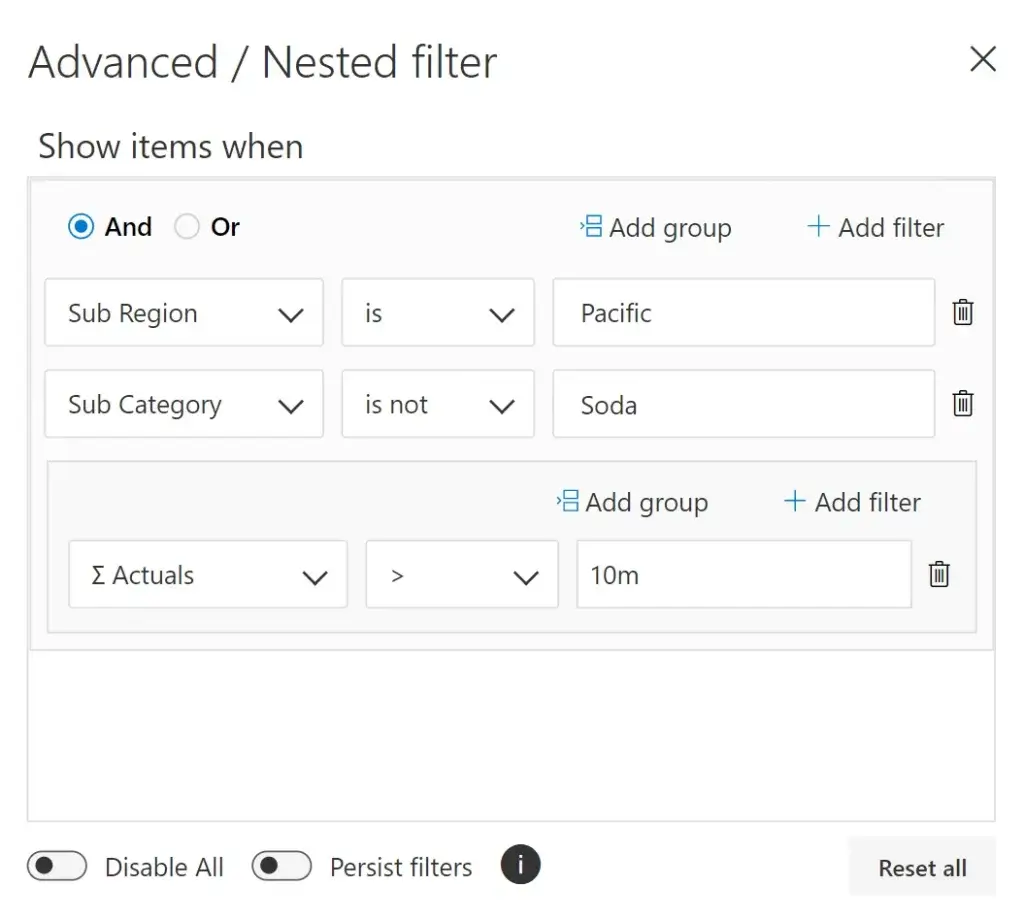
Filter values in columns, rows and measures using the KPI Explorer. Inforiver also provides nested and/or filtering
Insert columns such as % contribution to grand total, running total, ranking within group in just a single click

Sort columns from smallest to largest or largest to smallest


Inforiver helps enterprises consolidate planning, reporting & analytics on a single platform (Power BI). The no-code, self-service award-winning platform has been recognized as the industry’s best and is adopted by many Fortune 100 firms.
Inforiver is a product of Lumel, the #1 Power BI AppSource Partner. The firm serves over 3,000 customers worldwide through its portfolio of products offered under the brands Inforiver, EDITable, ValQ, and xViz.
