Upcoming webinar on 'Inforiver Charts : The fastest way to deliver stories in Power BI', Aug 29th , Monday, 10.30 AM CST. Register Now
Upcoming webinar on 'Inforiver Charts : The fastest way to deliver stories in Power BI', Aug 29th , Monday, 10.30 AM CST. Register Now
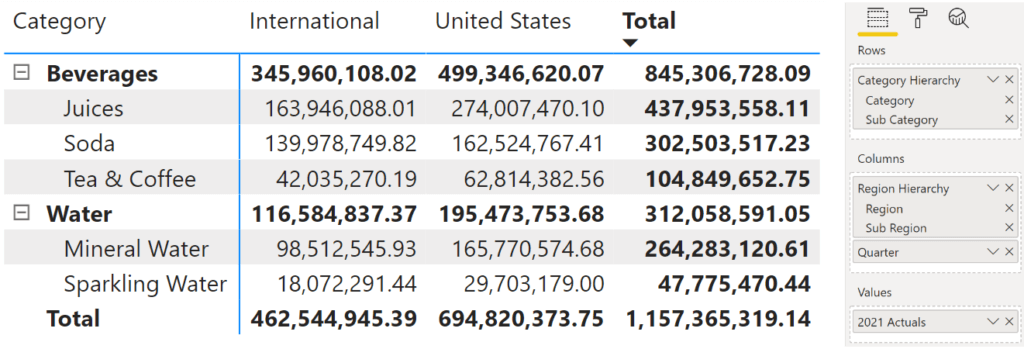
Currently in a native Power BI matrix, you cannot expand or collapse columns freely as you can do with rows. In the example below, even though we have assigned region, sub-region & quarter to Columns, only the region shows up by default, and there is no way to expand a specific region to reveal the sub-region directly, as it is possible to expand Beverages alone in the rows to reveal its children.
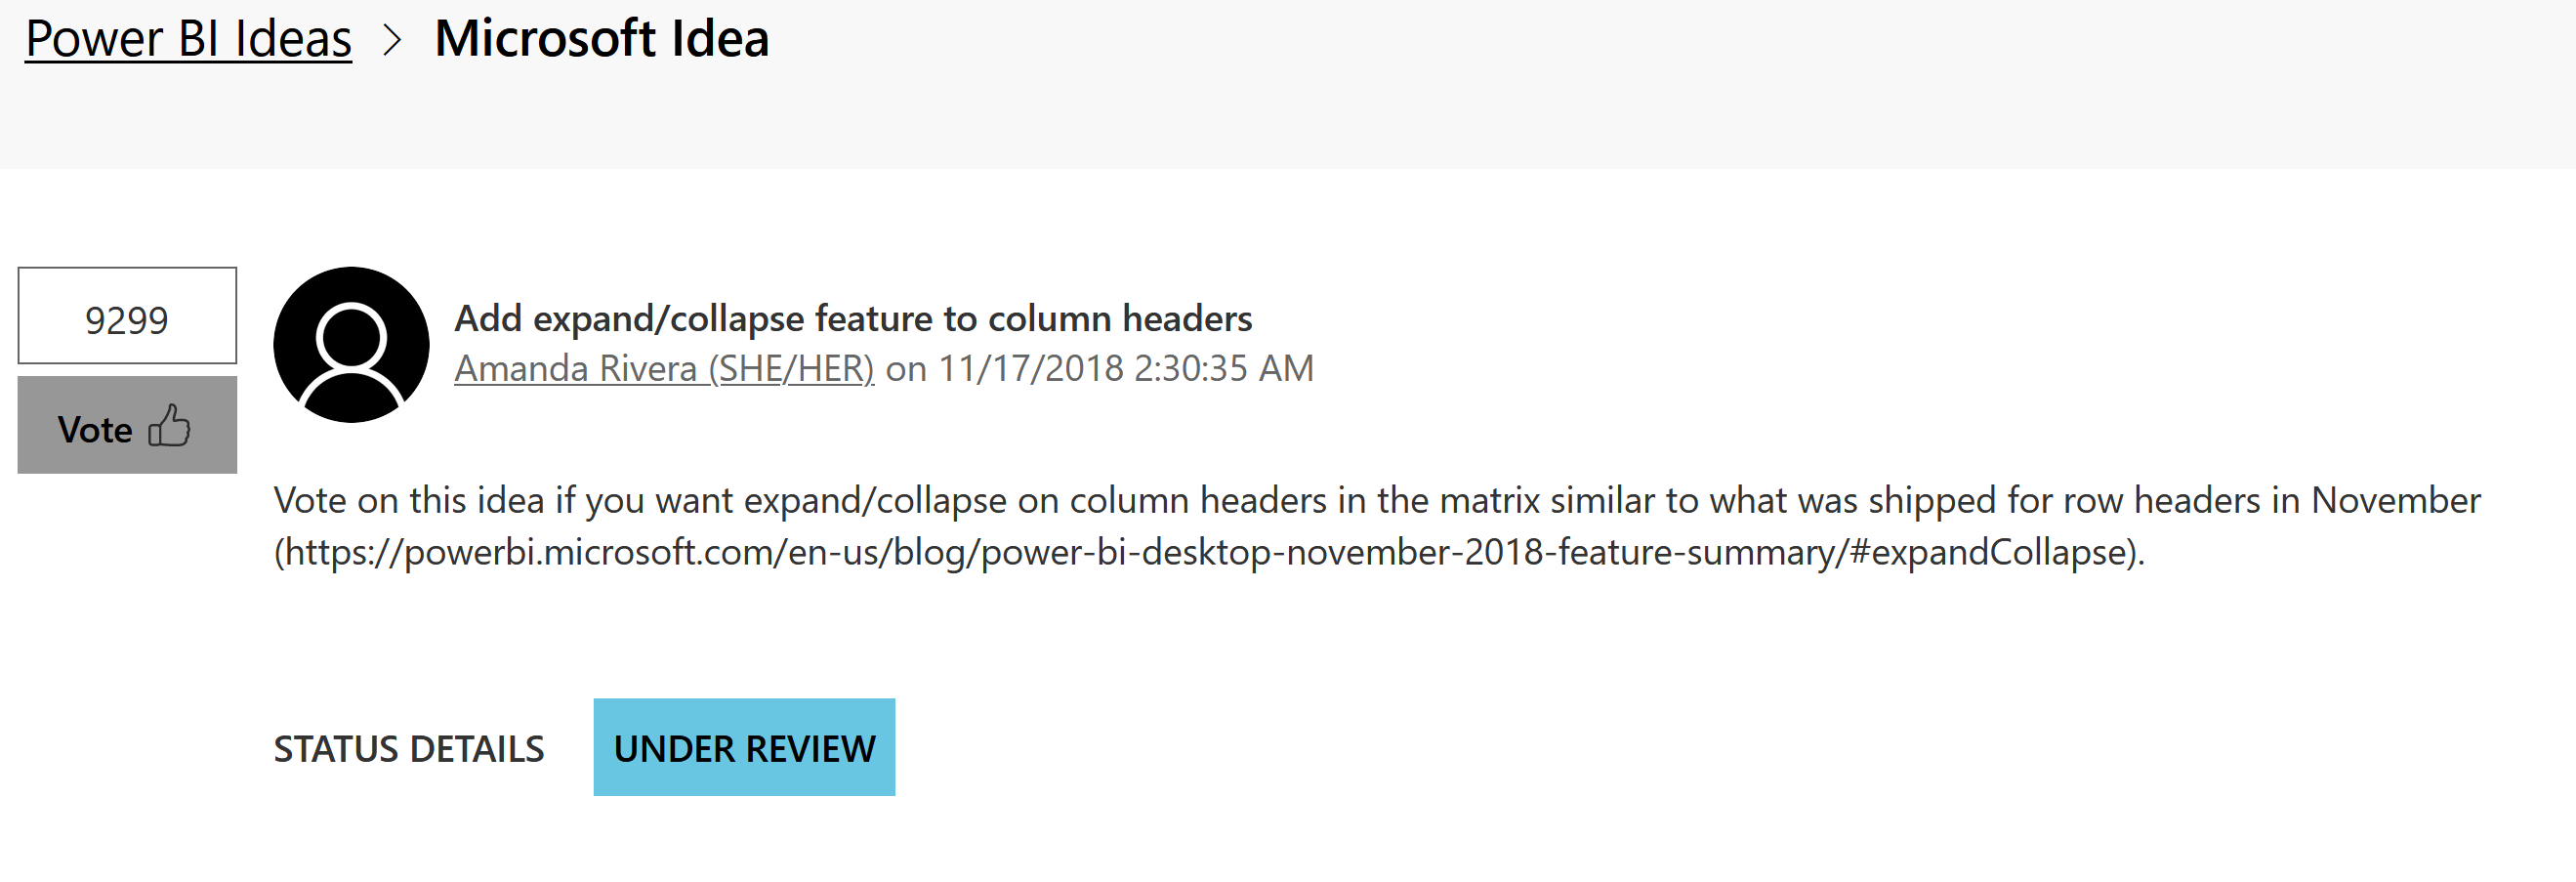
In fact, this request has been a popular upvoted feature in the Microsoft idea place, with more than 9k votes.
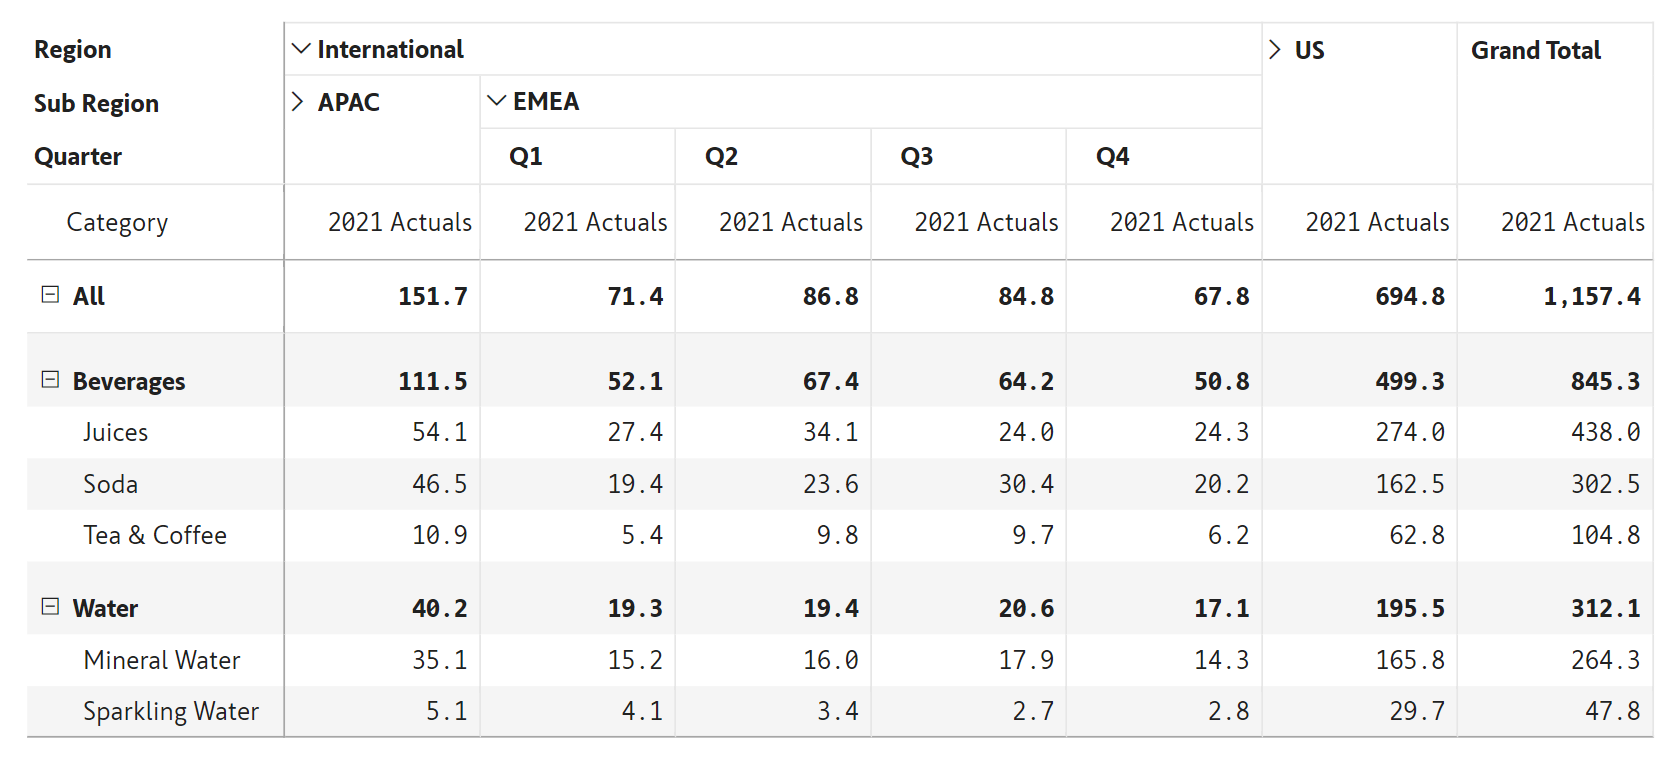
With Inforiver, you can expand/collapse specific columns to reveal its children, just as we can do with the row hierarchies in native Power BI visual. In the sample image below, you can see International Region and EMEA Sub-region in the columns expanding to reveal the four quarters - while the rest of the branches (such as APAC, US, etc.) remain collapsed.
There is more you can do with Inforiver while managing column (and row) hierarchies. When you mouse-over the category names on the top-left of the table (Region, Sub Region and Quarter), a hamburger menu appears.
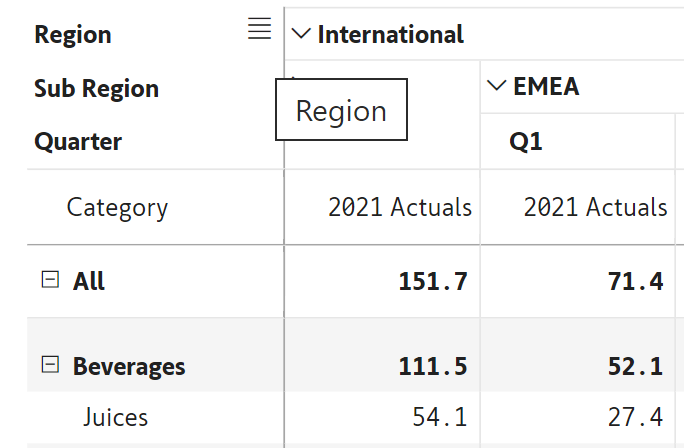
Clicking the hamburger menu will reveal a list of action items.

From this menu, you can perform the following actions:
Curious about Inforiver? Read why Matt Allington (Self Service BI Expert + Microsoft MVP) , Excelerator BI prefers Inforiver over the Analyze in Excel capability that comes with Power BI for ad-hoc analysis.
With Inforiver, learn how to perform actions such as grouping or reordering rows and columns in a few clicks.


Inforiver helps enterprises consolidate planning, reporting & analytics on a single platform (Power BI). The no-code, self-service award-winning platform has been recognized as the industry’s best and is adopted by many Fortune 100 firms.
Inforiver is a product of Lumel, the #1 Power BI AppSource Partner. The firm serves over 3,000 customers worldwide through its portfolio of products offered under the brands Inforiver, EDITable, ValQ, and xViz.