Upcoming webinar on 'Inforiver Charts : The fastest way to deliver stories in Power BI', Aug 29th , Monday, 10.30 AM CST. Register Now
Upcoming webinar on 'Inforiver Charts : The fastest way to deliver stories in Power BI', Aug 29th , Monday, 10.30 AM CST. Register Now
Inforiver delivers a variety of spreadsheet-like capabilities that make it very appealing for Excel fans to embrace Power BI.
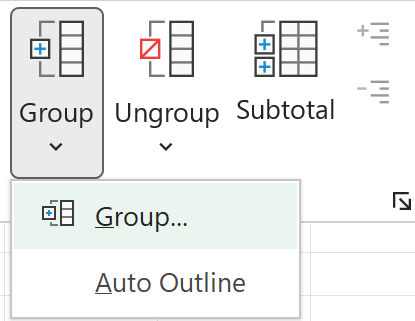
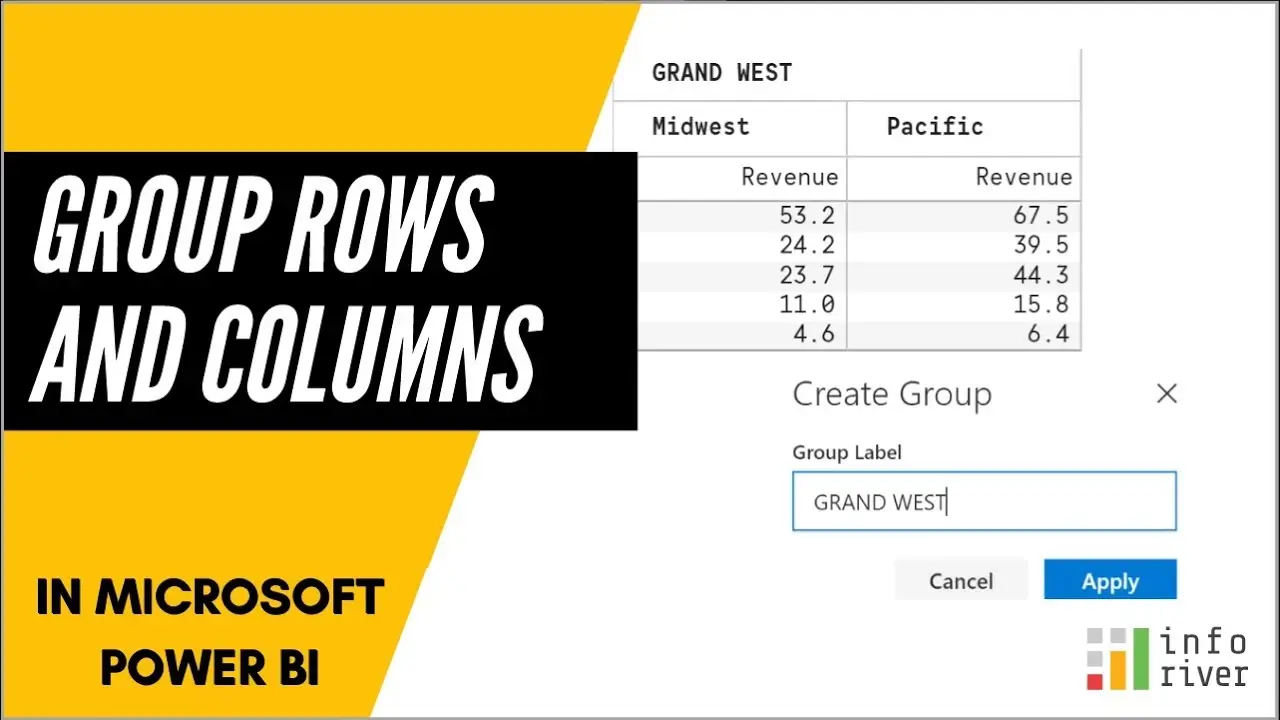
A very popular feature of Excel that is missing in Power BI is the ability to group rows and columns. In Excel, this is accomplished using the Group (outline) settings property.
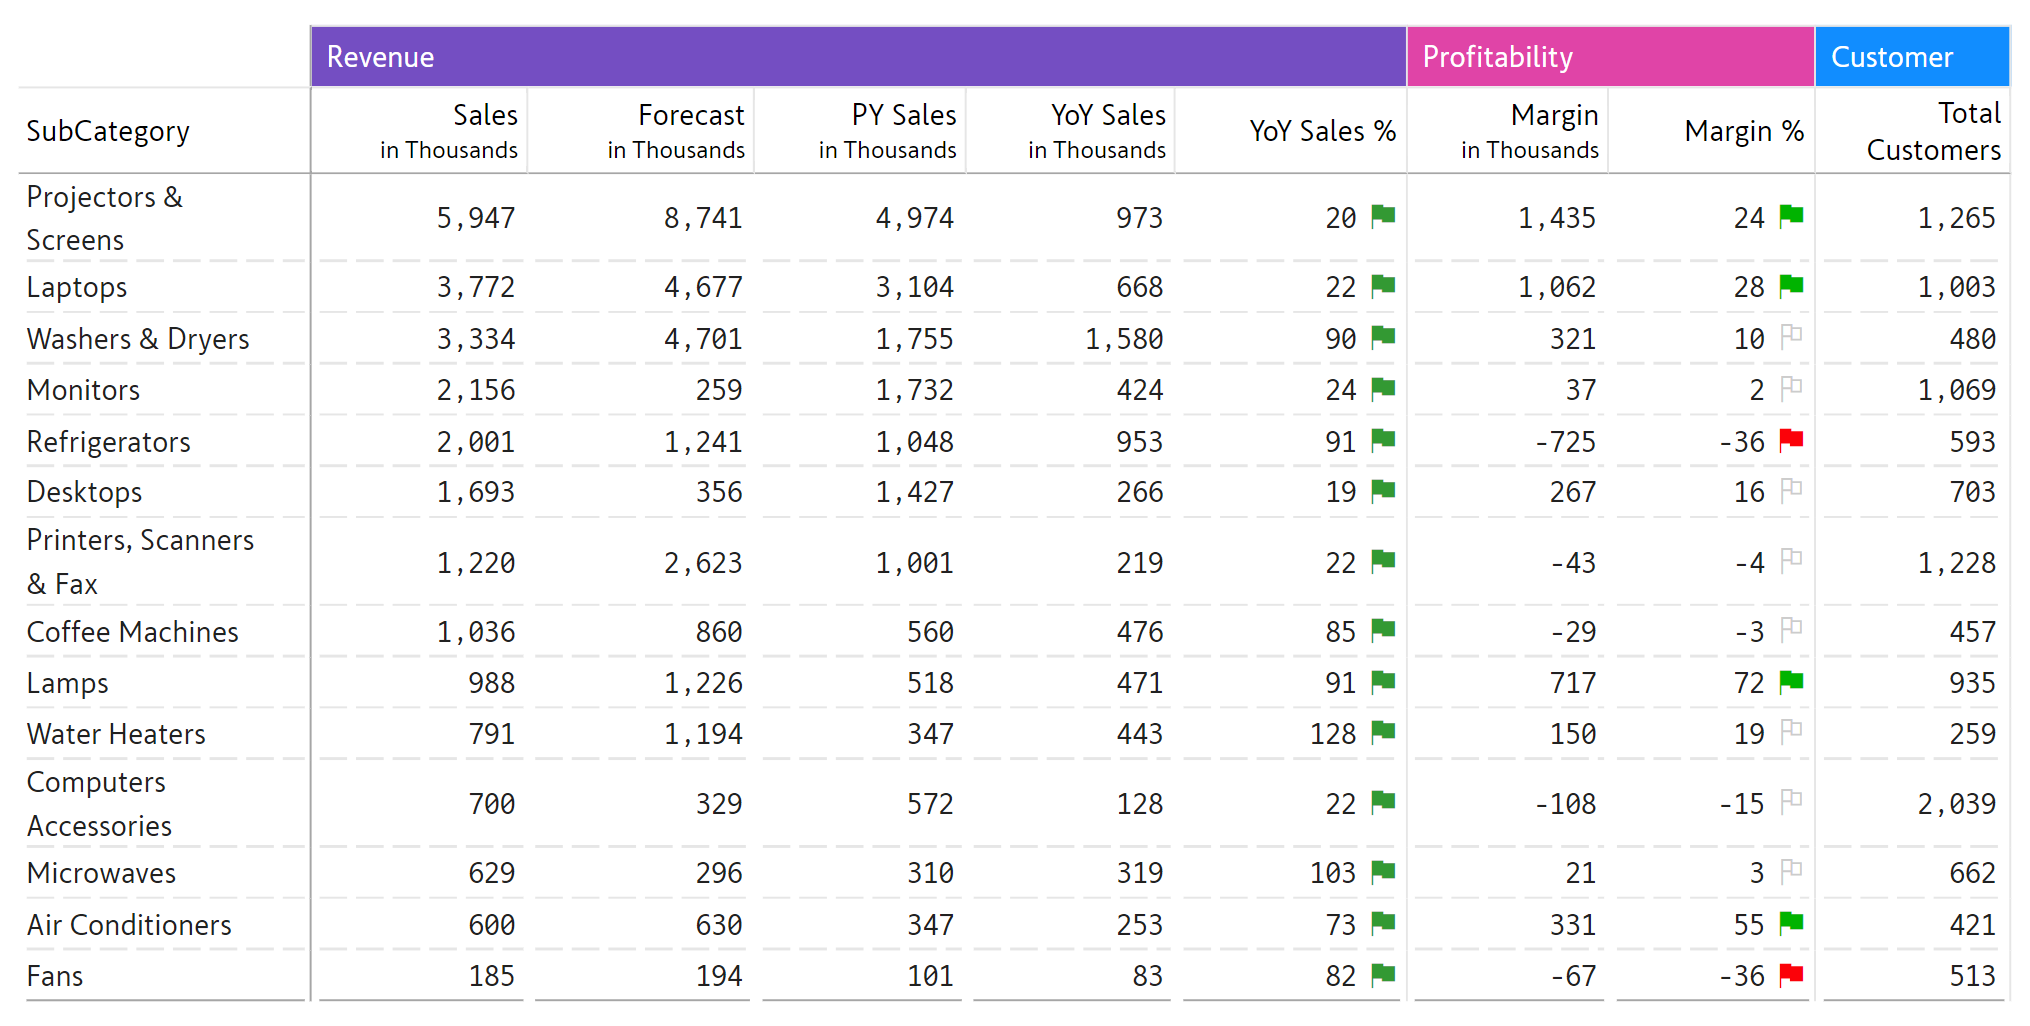
In the sample report shown below, the first four detail records (Projectors & Screens, Laptops, Lamps and Air Conditioners) are grouped to create a new row titled 'Segment A - Cash Flow'. An expand/collapse control governs the grouped row and its children (that belong in that group). Note that Inforiver automatically aggregates the measures at the parent level. Contrast this with Excel where you will need to perform such aggregations manually.
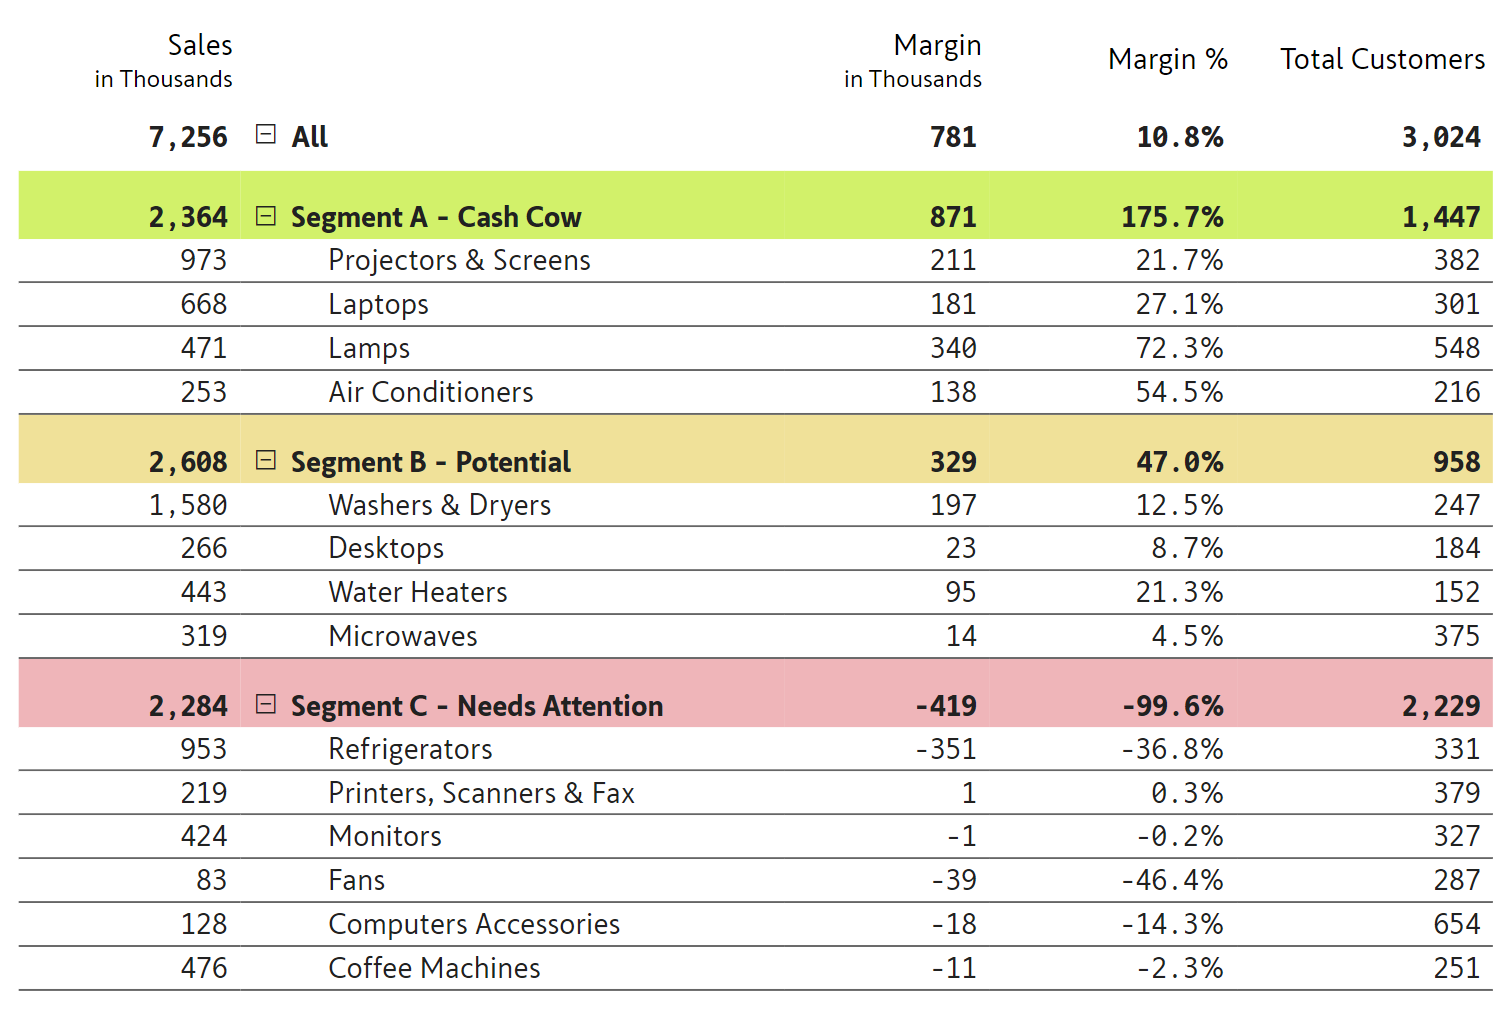
While grouping is a simple & powerful feature, you also need to pay attention to the aggregation type of each measure. In the example above, Margin % field by default would have added all the four percentage values and showed up 175.7% (basically apply a summation for row aggregation).
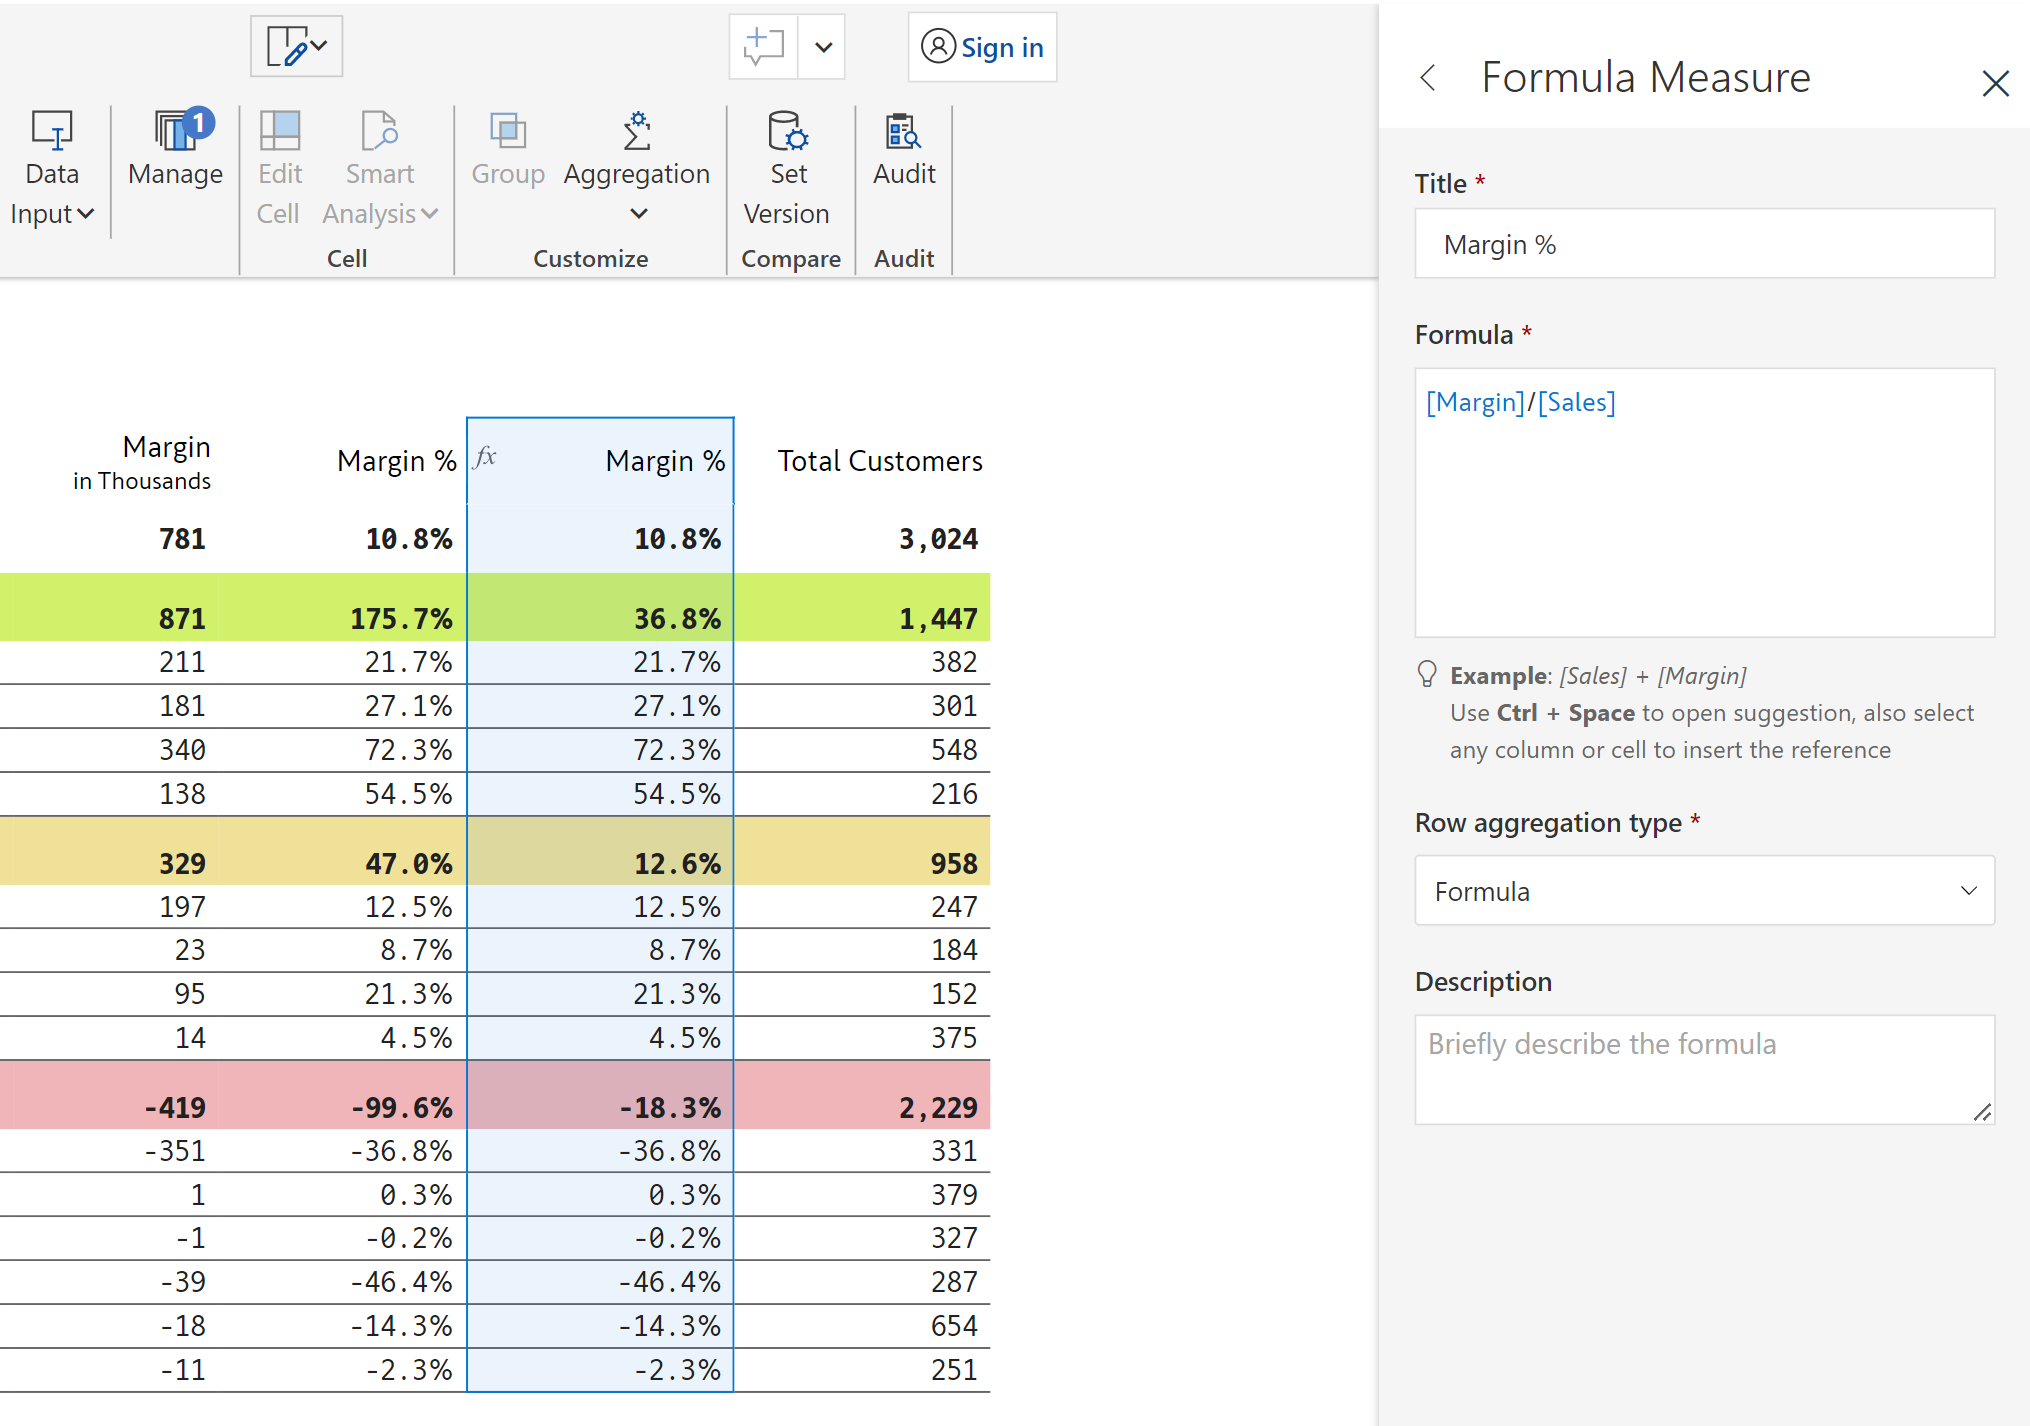
To override this default behavior, you must use the 'Insert Formula' option to recreate that column as shown below, and choose Row aggregation type = Formula. When you choose this type Inforiver calculates the Margin % for the aggregated row by reapplying the same formula it applied to the rows (instead of adding all the individual values).
In the image below, notice the differences in the result rows at the group level for the original Margin % measure (with SUM aggregation type) and the calculated Margin % column (with Formula aggregation type).
Similarly, Inforiver also allows you to group columns. This however works a little bit differently from row grouping. Instead of creating an expand/collapse outline, it pastes a row above and visually groups them. In this example below, the section 'Profitability' groups the columns Margin & Margin %. This feature is very useful while building financial statements like income statement, balance sheet or statement of cash flows.
Watch the quick video here on grouping rows & columns.
Curious about Inforiver? Read why Matt Allington (Self Service BI Expert + Microsoft MVP) , Excelerator BI prefers Inforiver over the Analyze in Excel capability that comes with Power BI for ad-hoc analysis.
Learn more about Inforiver's reporting capabilities.
Related Power BI Ideas: Please add feature to group columns in matrix.

Inforiver helps enterprises consolidate planning, reporting & analytics on a single platform (Power BI). The no-code, self-service award-winning platform has been recognized as the industry’s best and is adopted by many Fortune 100 firms.
Inforiver is a product of Lumel, the #1 Power BI AppSource Partner. The firm serves over 3,000 customers worldwide through its portfolio of products offered under the brands Inforiver, EDITable, ValQ, and xViz.