Upcoming webinar on 'Inforiver Charts : The fastest way to deliver stories in Power BI', Aug 29th , Monday, 10.30 AM CST. Register Now
Upcoming webinar on 'Inforiver Charts : The fastest way to deliver stories in Power BI', Aug 29th , Monday, 10.30 AM CST. Register Now
“As an Excel fan, I love the simplicity, flexibility and power of spreadsheets. I have everything under my control, and I can do what I want whenever I need to. I do like Power BI, but it has its own restrictions. For example, I cannot freely insert a row or edit data directly in the report. I therefore prefer Excel over Power BI for most or all of my reporting needs.”
Does the above accurately reflect your feelings towards Power BI and Excel? If so, you need to take a second look. With Inforiver delivering a variety of the spreadsheet-like capabilities inside Microsoft Power BI, things are not the same anymore.
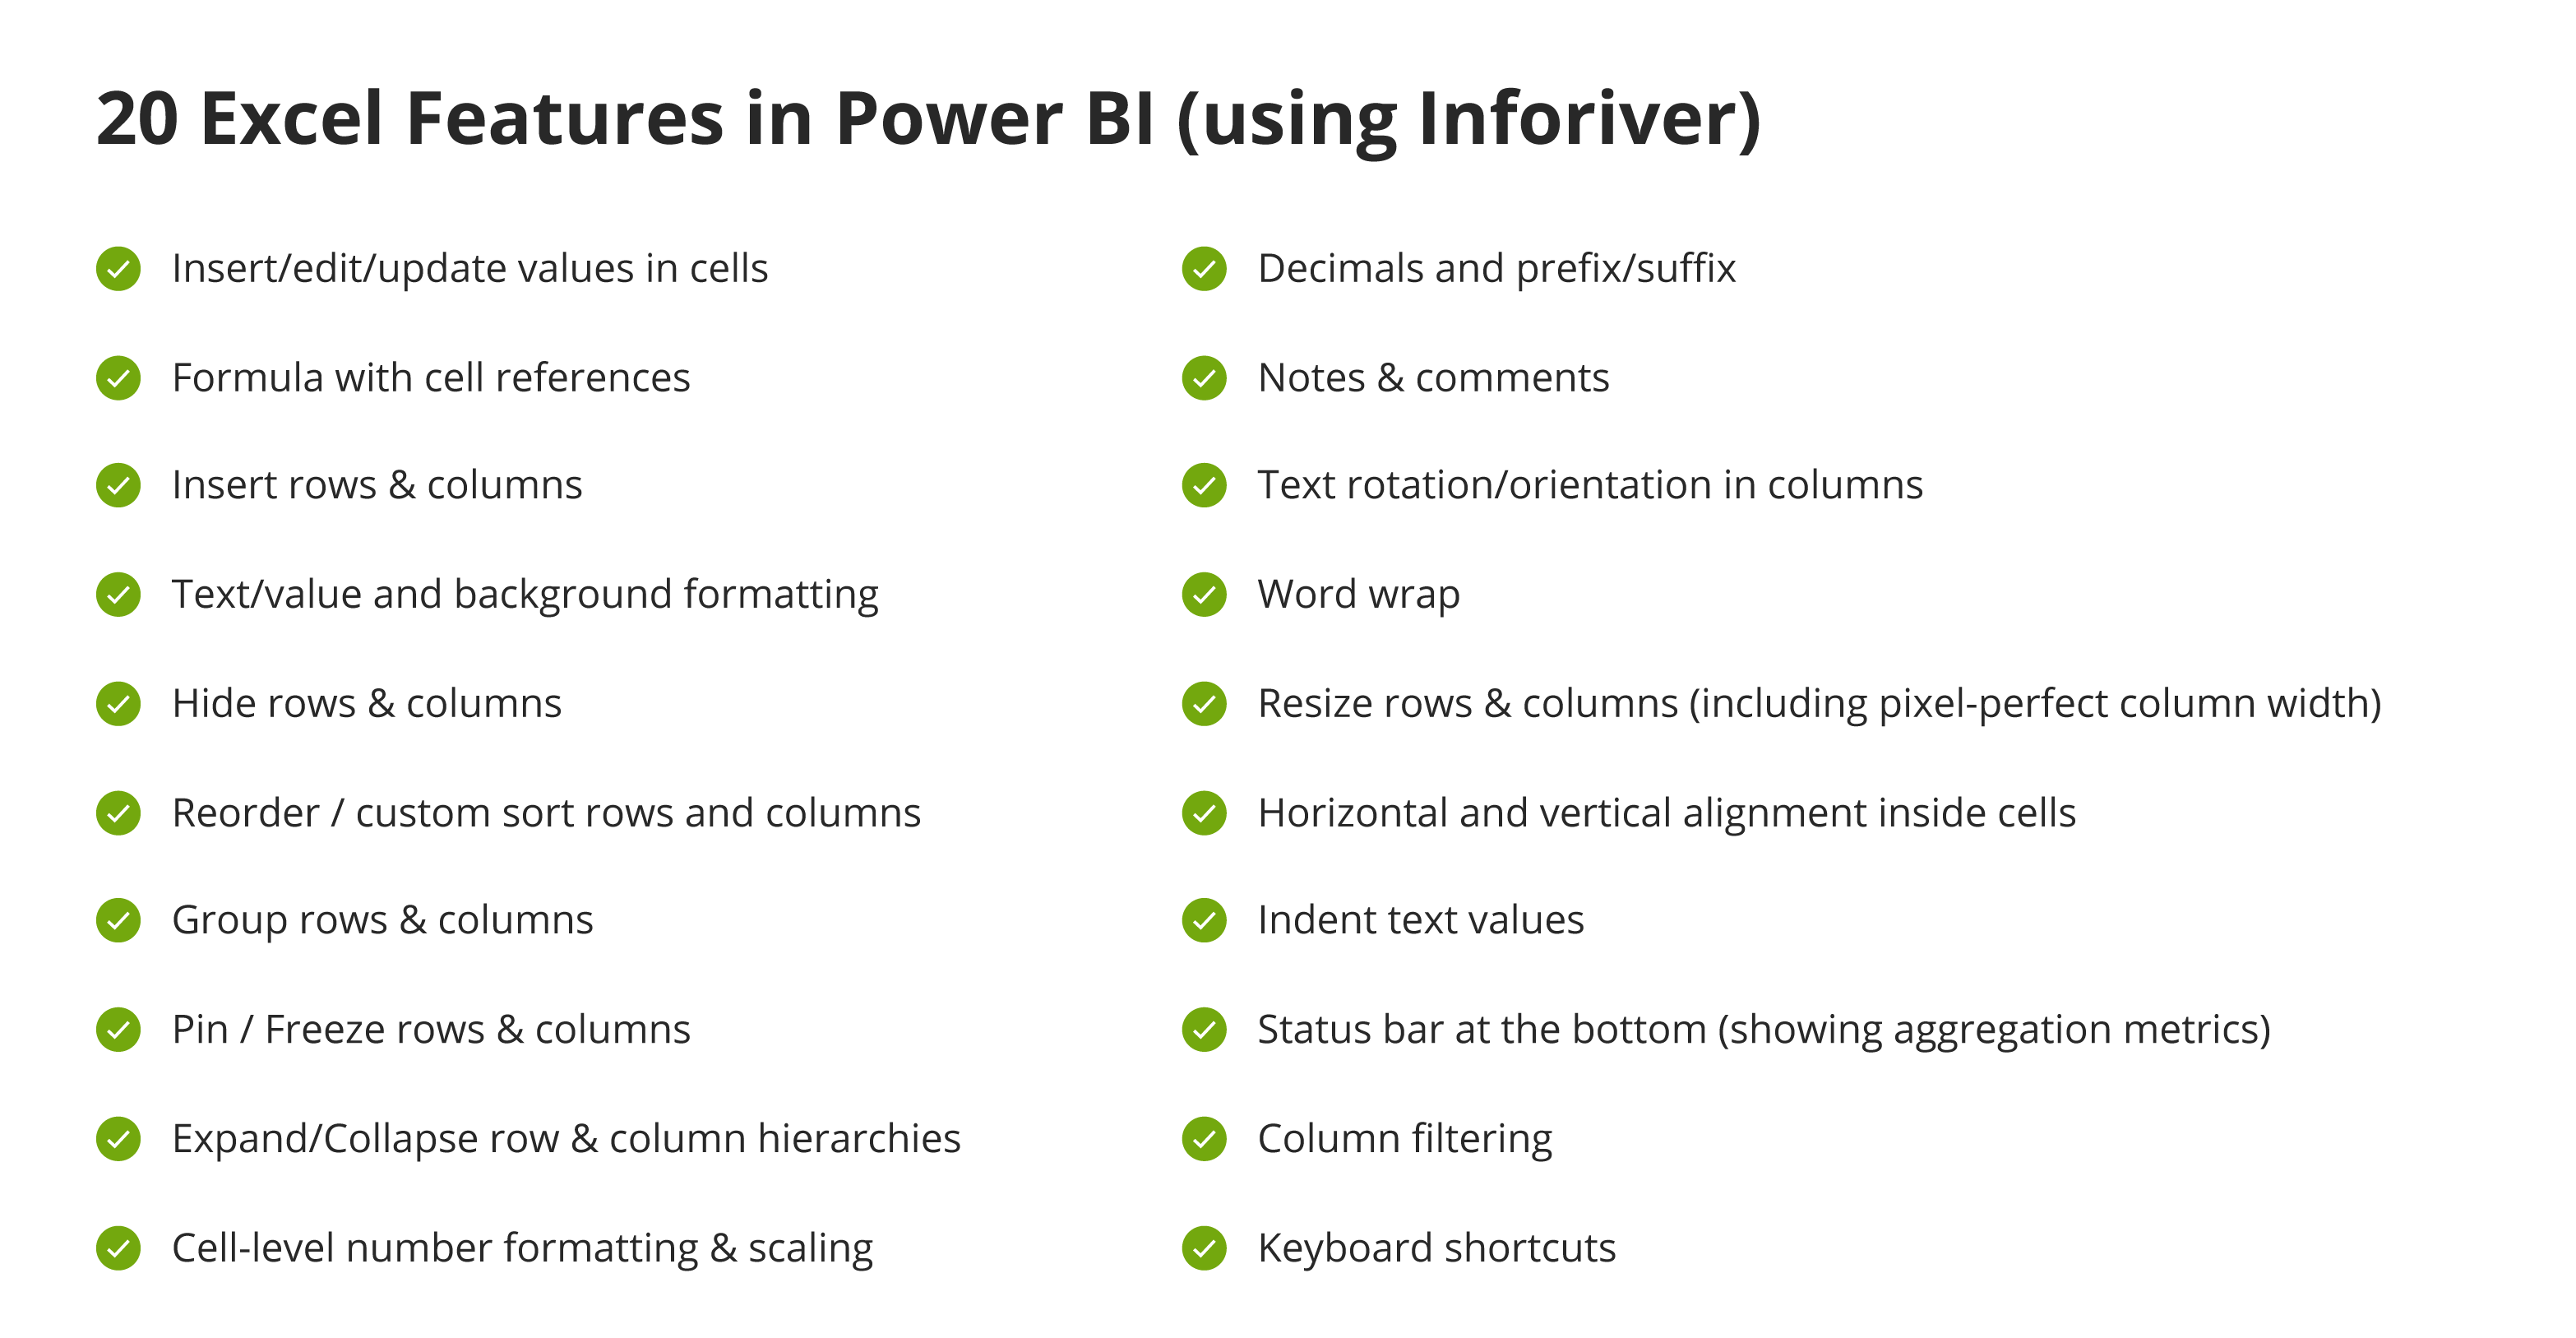
Today we’ll look at twenty (20) features that make it very appealing for Excel fans to embrace Power BI.
With Inforiver, you can update cell values directly in your table or matrix report. After any update, you will also see an edit icon next to the values that you have changed.
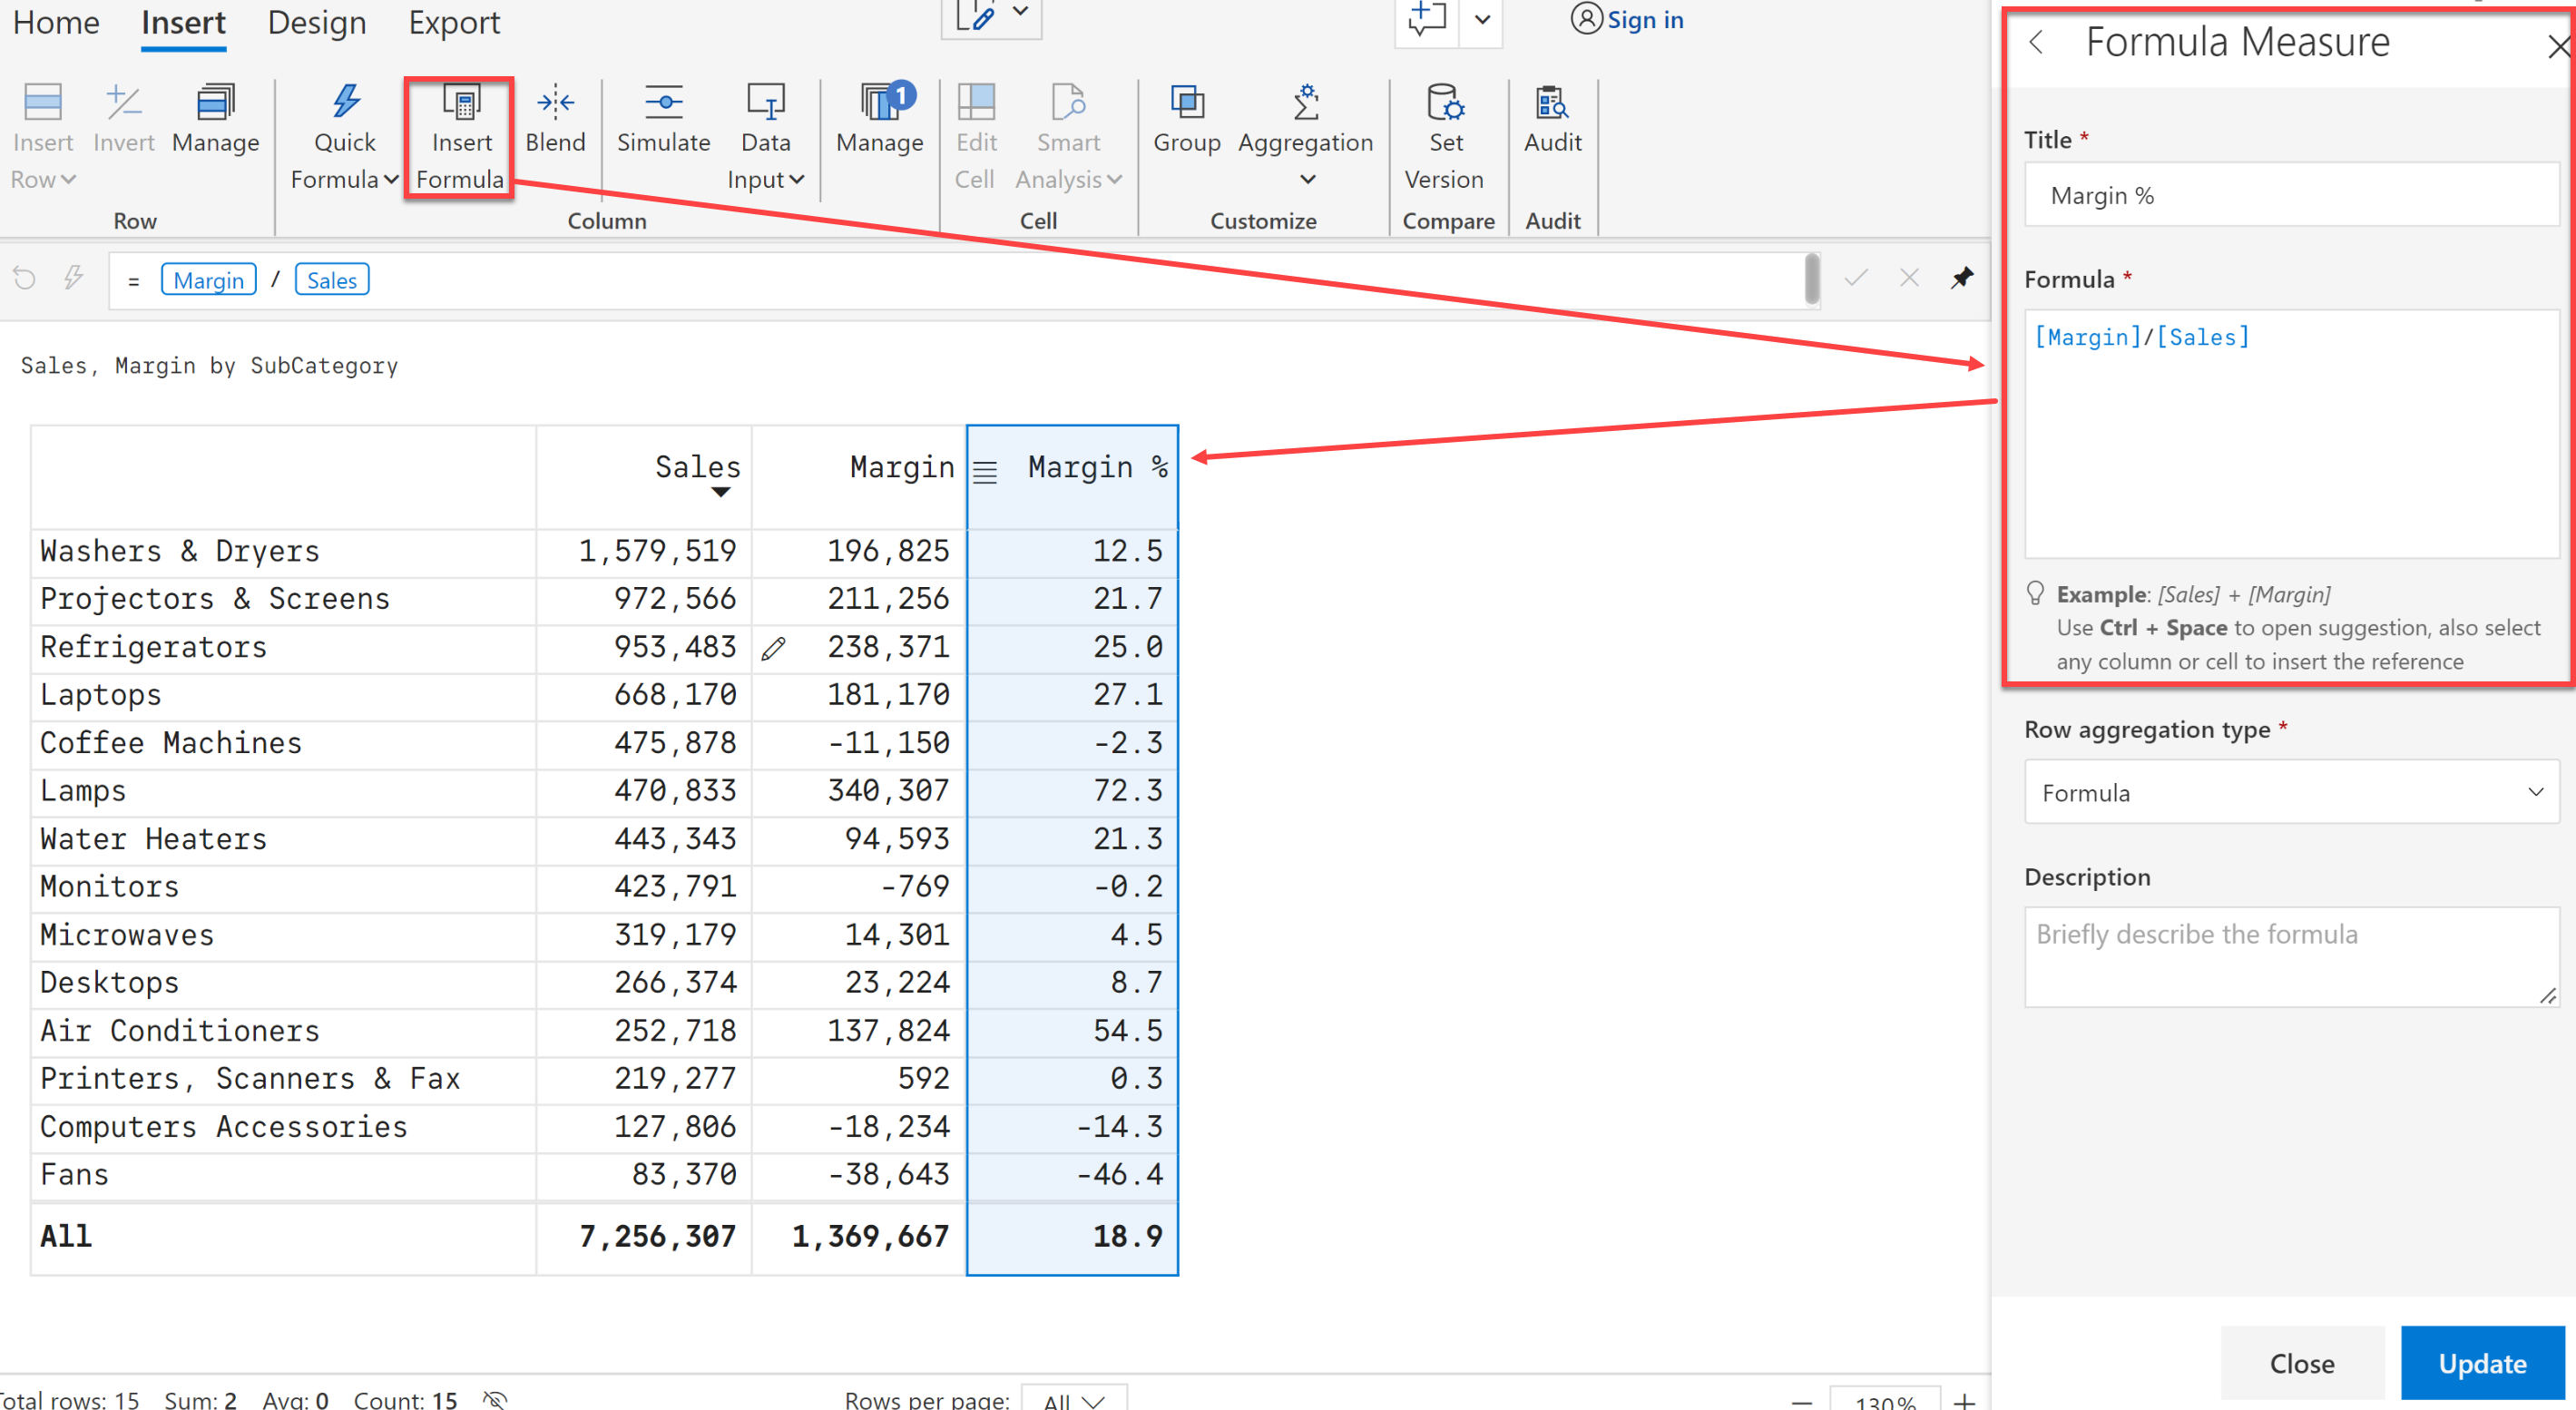
The most popular feature in spreadsheets is now available in Power BI. Insert a formula in a cell that refers to the contents of other cells.
You can insert rows & columns just as you can do with spreadsheets. These inserted rows & columns can be blank – where you manually type in values one cell at a time – or calculated using an advanced formula editor.

Note that as you type in the formula, the autocomplete feature looks up possible matches from the other rows. When I type in ‘La’, it shows Lamps and Laptops. The formula engine supports logical, Boolean, math functions and more.
Adding a calculated column follows a similar procedure. In this case we have created a Margin % column using a formula.
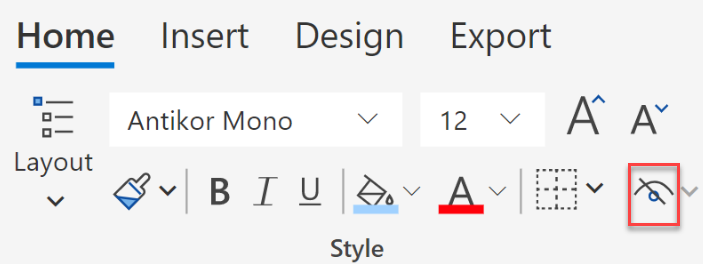
Apply cell, row or column-level formatting using the toolbar options. You can increase or decrease font sizes, and even add custom borders.

You can hide rows or columns from the toolbar in a single click.
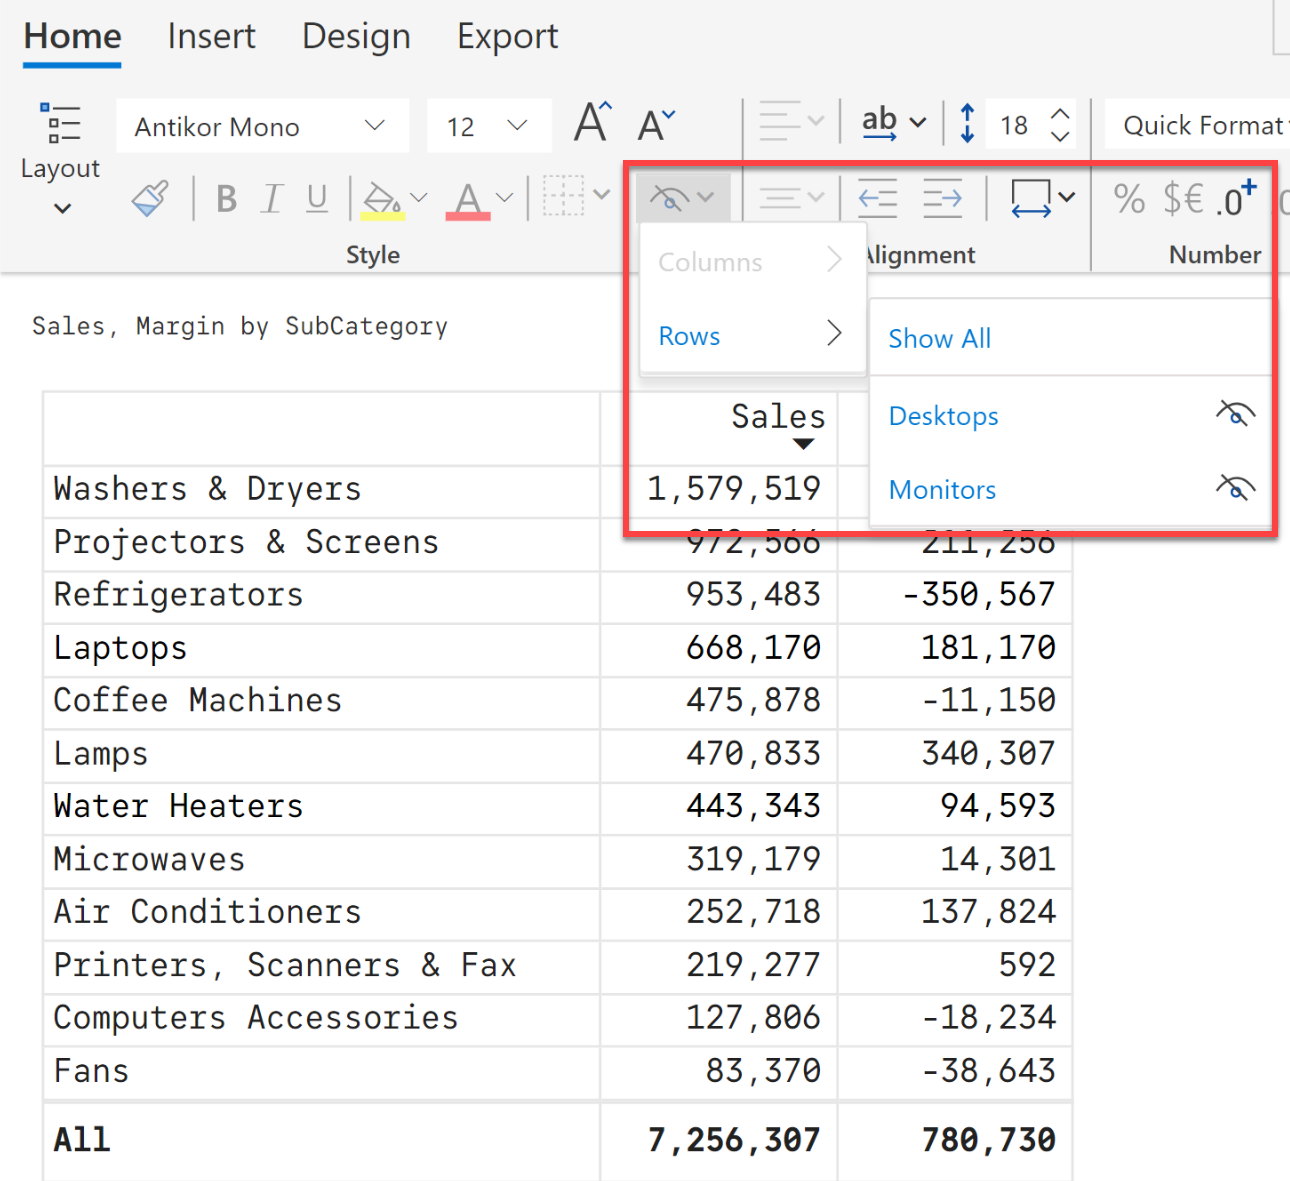
Once hidden, you can unhide them from the menu.
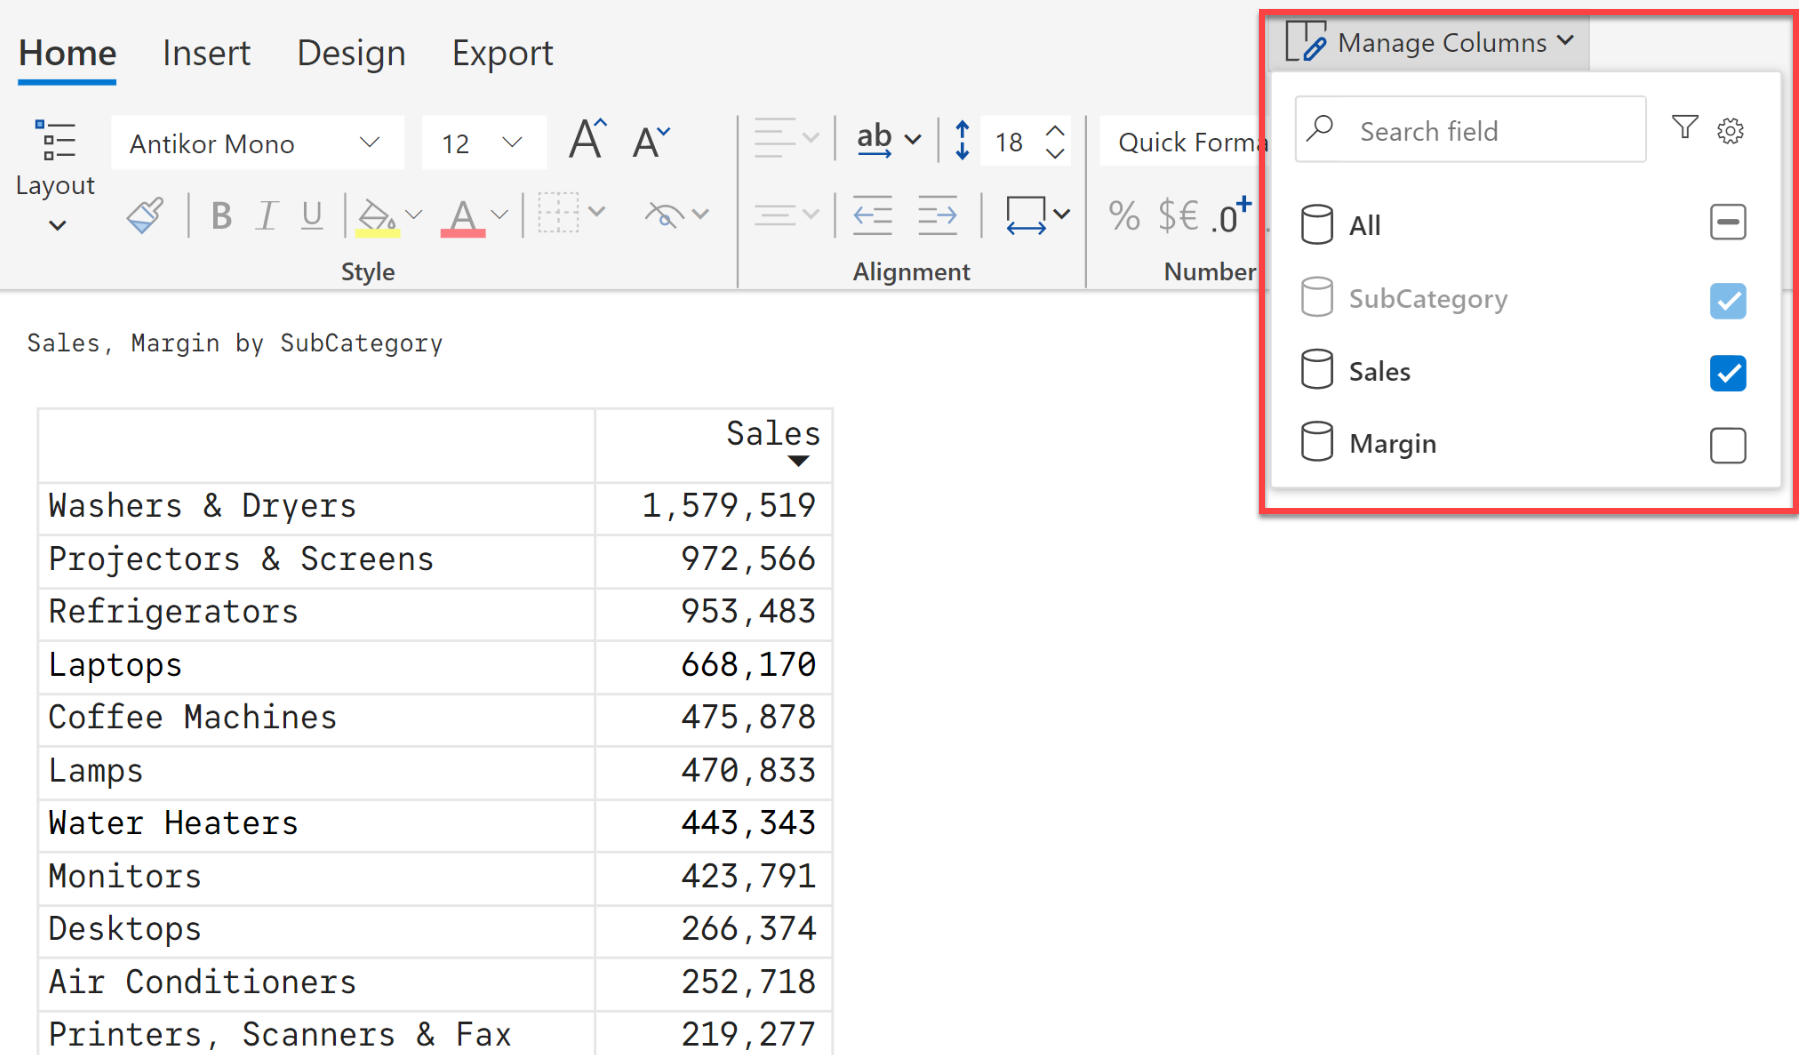
Another way to hide or unhide columns is to use the ‘Manage Columns’ options.
In Excel, you can cut and paste a row or a column and relocate it elsewhere. Inforiver does it better. Just click and drag the row or the column.
Create visual hierarchies in rows & columns by selecting multiple items and grouping them. When you group rows, the subtotal values are calculated automatically.
This is very helpful when you have too many rows or columns in your report. Pin any row or column and freeze them respectively at the top or left.
With Inforiver, you can expand and collapse both row and column hierarchies. Note that the expand/collapse for columns is not supported by the native matrix visual delivered by Power BI.
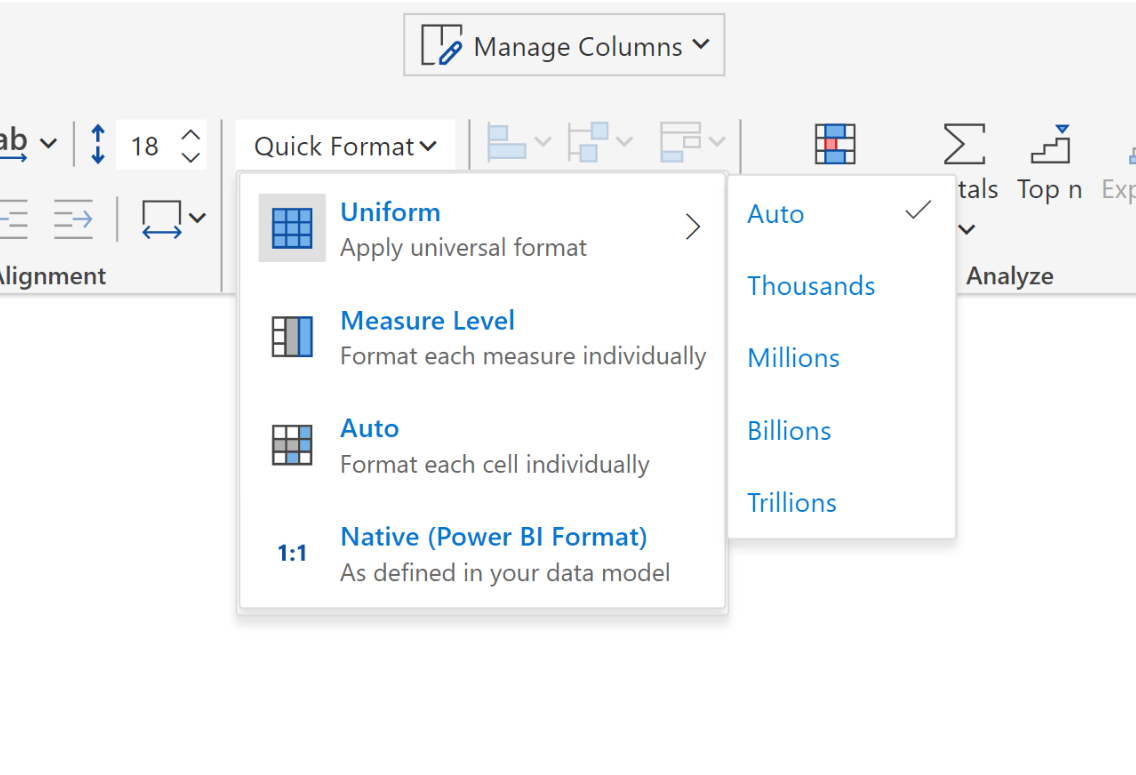
Inforiver takes number formatting to a different level than what Excel or other BI tools like Tableau or Qlik can accomplish. You can apply any one of the scaling formats to your data in tabular or matrix reports in a single click.
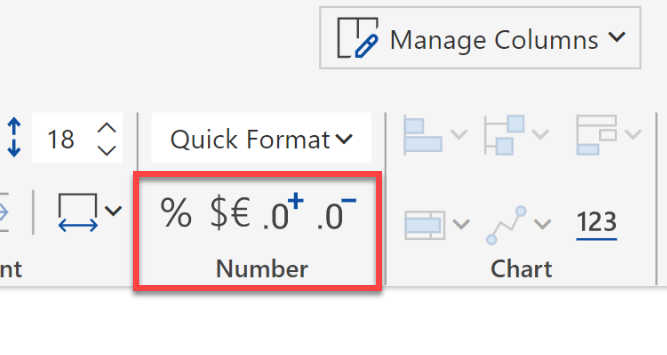
While this is a simple feature in Excel, it is typically not easy to format values in a specific cell (or a range of cells) in Power BI. With Inforiver, you can select cells and use the toolbar options to increase/decrease decimals. You can also add prefix / suffix – something that brings parity with Excel’s accounting and currency formatting properties - which are not available in native Power BI.
You can add cell, row and column-level notes in Inforiver. These can show up on hover, or as a footnote below the table. The hover option is shown below.

The comments feature works in a similar fashion except that it can facilitate conversations & interactions with your peers. When a user is tagged in a comment, an email notification is triggered.

This is very helpful when you have a lot of columns in your report. You do not have to miss this Excel feature in Power BI anymore.

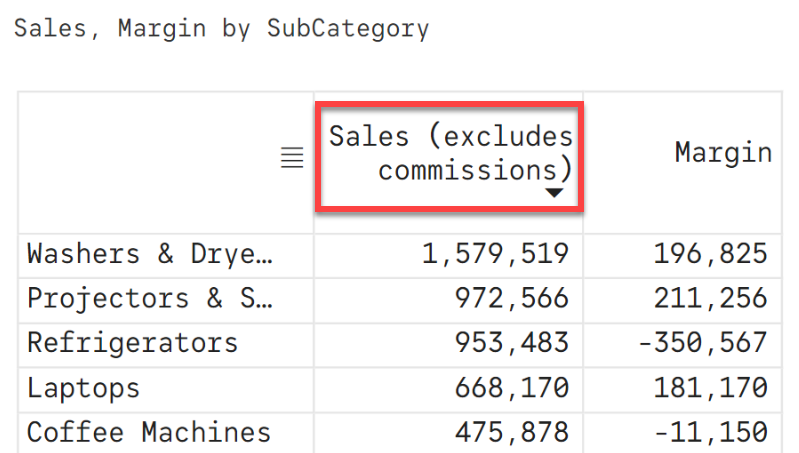
Word wrap column headers to keep the column width optimized. This is very helpful when you have long column names or have too many columns.
In Power BI, you can resize row height and column widths, just as you are used to doing in Excel. Inforiver’s Rails feature reveals spreadsheet-like borders that you can click and drag to resize rows and columns.
You can also perform pixel-perfect column widths, something that is missing in native Power BI table and matrix visuals.
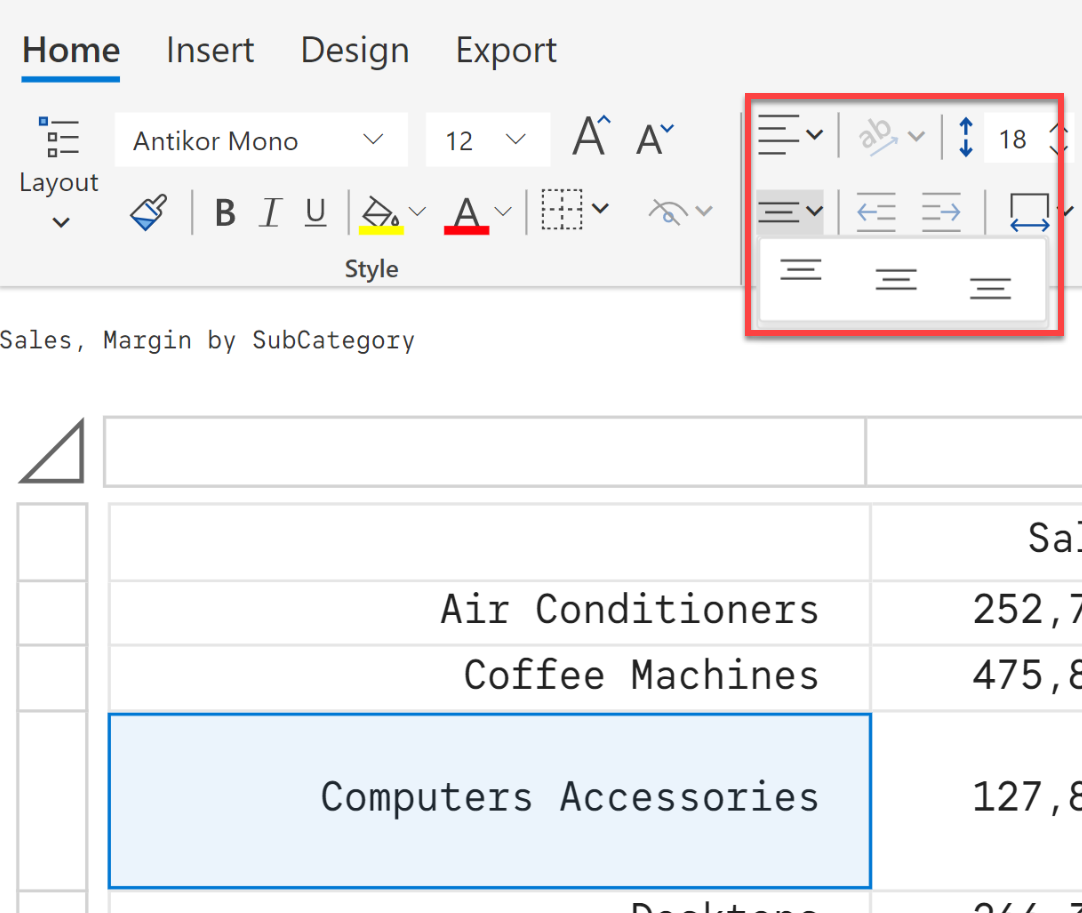
Align values horizontally or vertically within a cell. Both options are available in the toolbar.
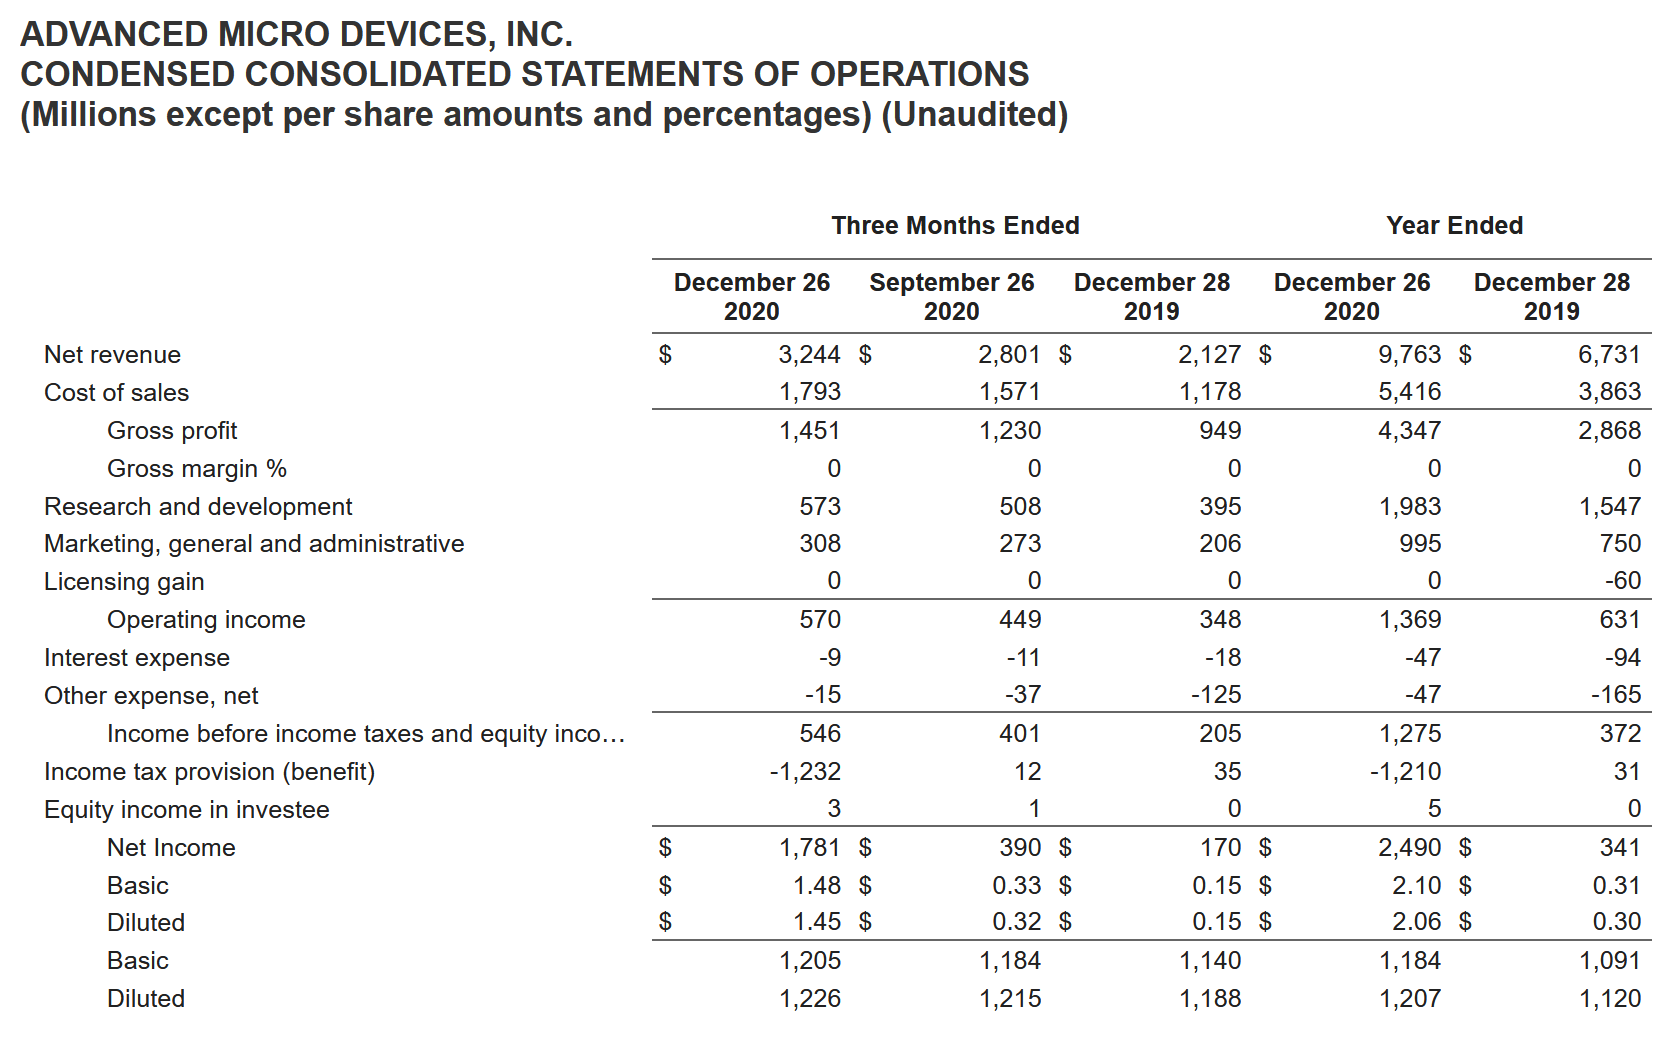
Use the indentation icon from the toolbar to indent specific values. This feature makes creating financial statements a breeze. Check out the first column containing indented values.
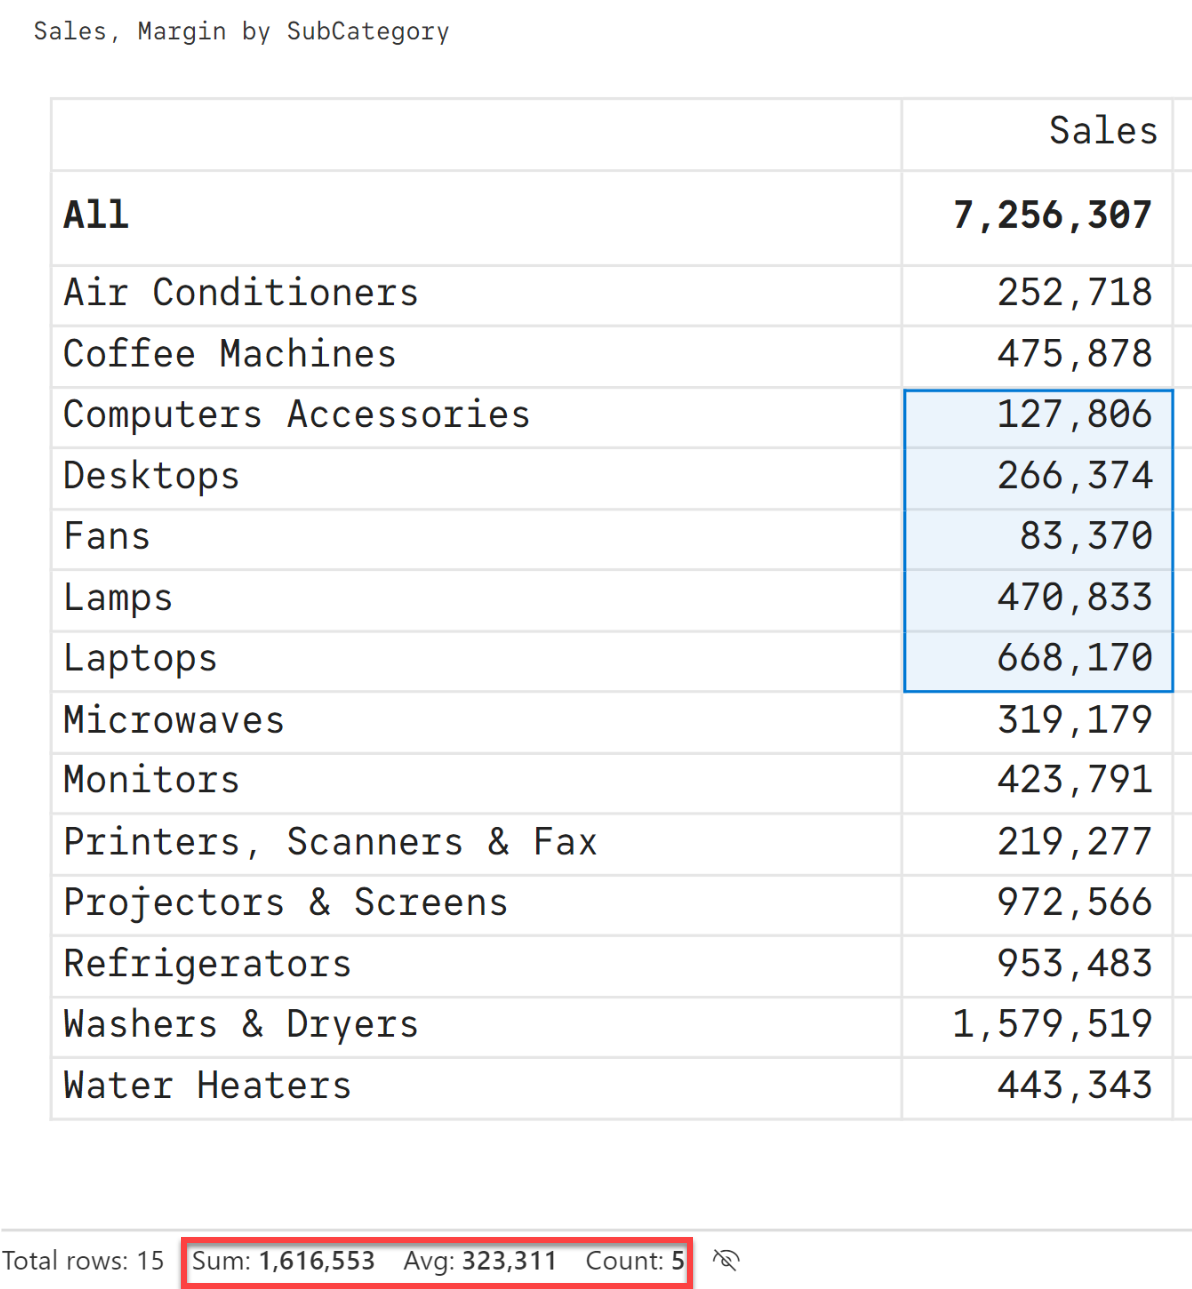
Similar to Excel, you can use the status bar to quickly check aggregated metrics such as sum, average and count for a selected range of cells.
A key feature that many Excel users have come to miss in Power BI is the ability to perform data filtering for each column independently. Inforiver goes a step further, and provides filtering for columns, rows and measures too.

Inforiver also delivers a set of keyboard shortcuts:
There are many other Excel features that Inforiver delivers, but we will stop here. If you are looking to migrate your Excel reports to Power BI, give it a try with Inforiver today. Inforiver can also be purchased directly from Microsoft AppSource.

Inforiver helps enterprises consolidate planning, reporting & analytics on a single platform (Power BI). The no-code, self-service award-winning platform has been recognized as the industry’s best and is adopted by many Fortune 100 firms.
Inforiver is a product of Lumel, the #1 Power BI AppSource Partner. The firm serves over 3,000 customers worldwide through its portfolio of products offered under the brands Inforiver, EDITable, ValQ, and xViz.