Upcoming webinar on 'Inforiver Charts : The fastest way to deliver stories in Power BI', Aug 29th , Monday, 10.30 AM CST. Register Now
Upcoming webinar on 'Inforiver Charts : The fastest way to deliver stories in Power BI', Aug 29th , Monday, 10.30 AM CST. Register Now
With Inforiver, it is possible to insert a new calculated row, column or a measure at the visual-level in your Power BI table / matrix style reports, without writing DAX. The rows, measures and columns so created can also be formatted, rearranged, and utilized for downstream calculations.
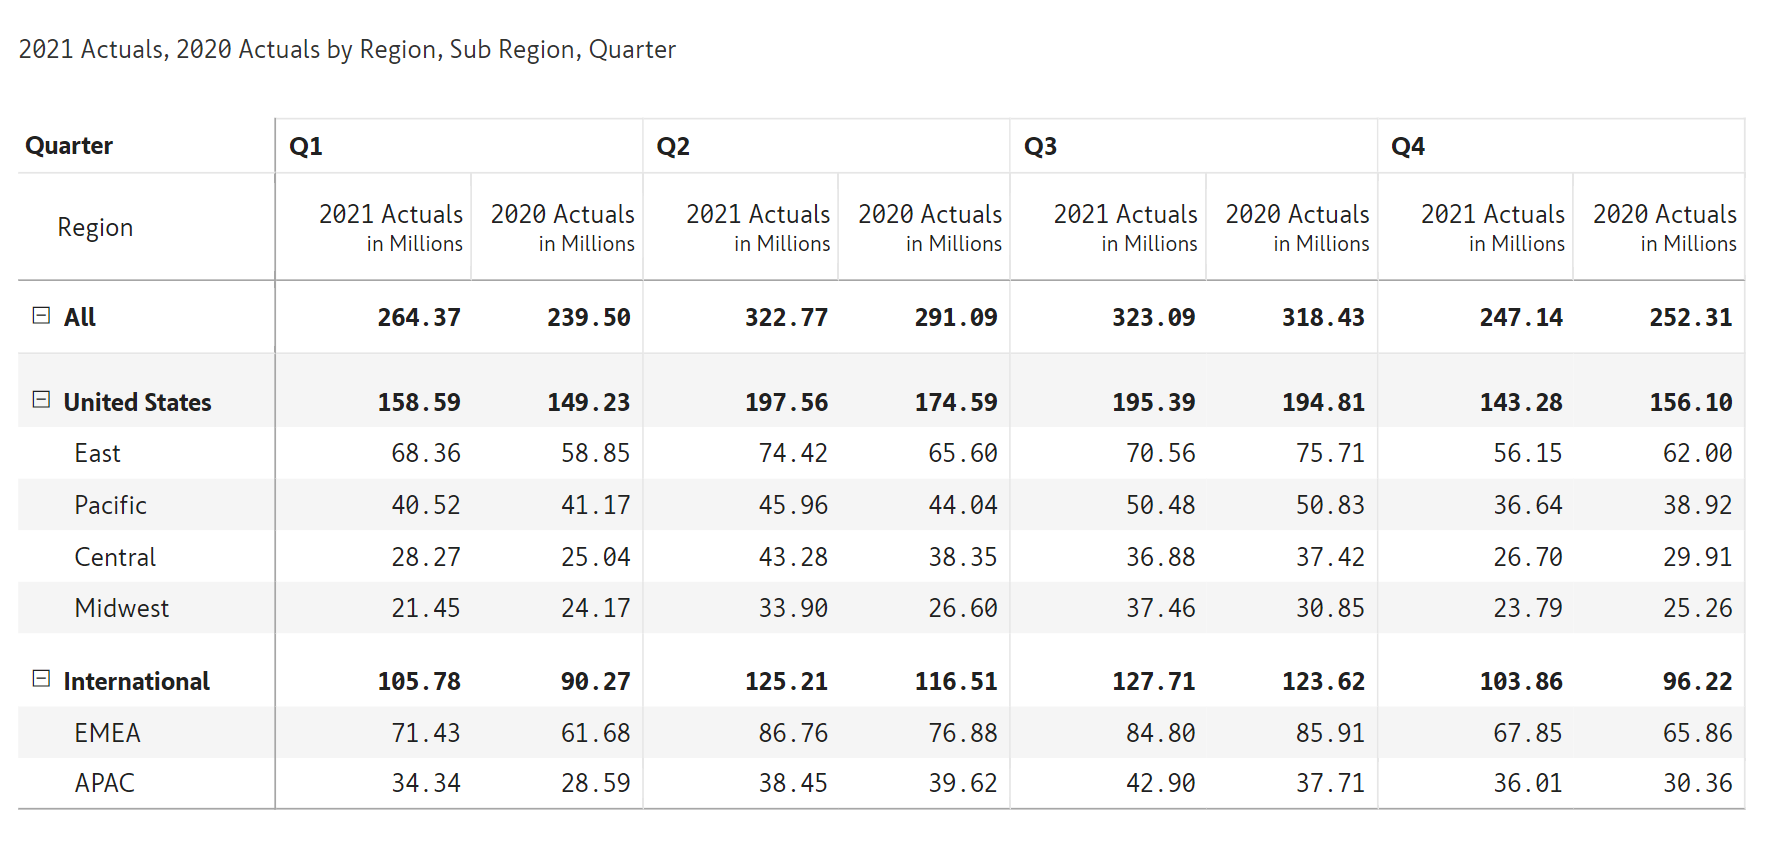
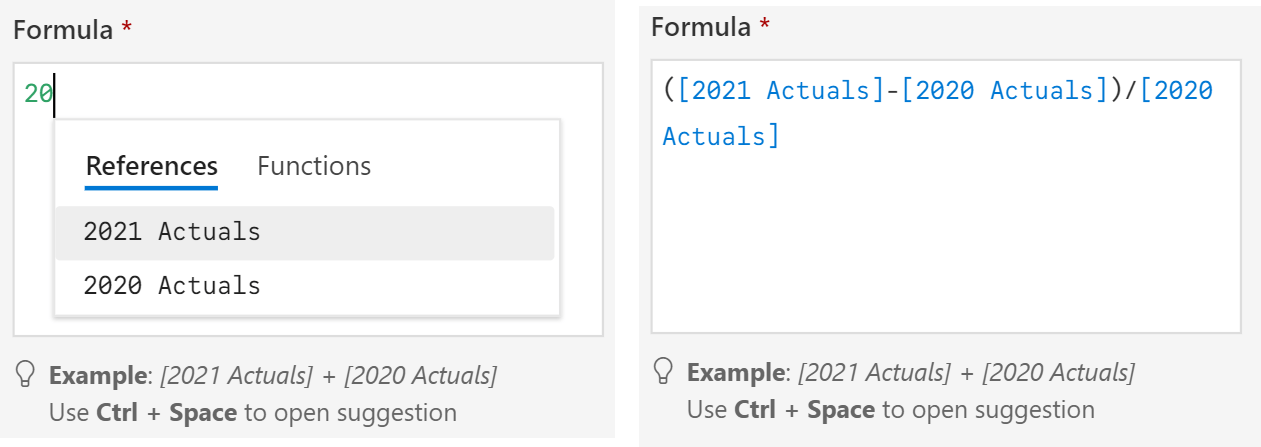
Let us take this example, where we have sales data for two years, 2021 and 2020, by quarter. We will now try to insert a measure that calculates the percentage variance using the formula (2021 Actuals - 2020 Actuals) / 2020 Actuals.
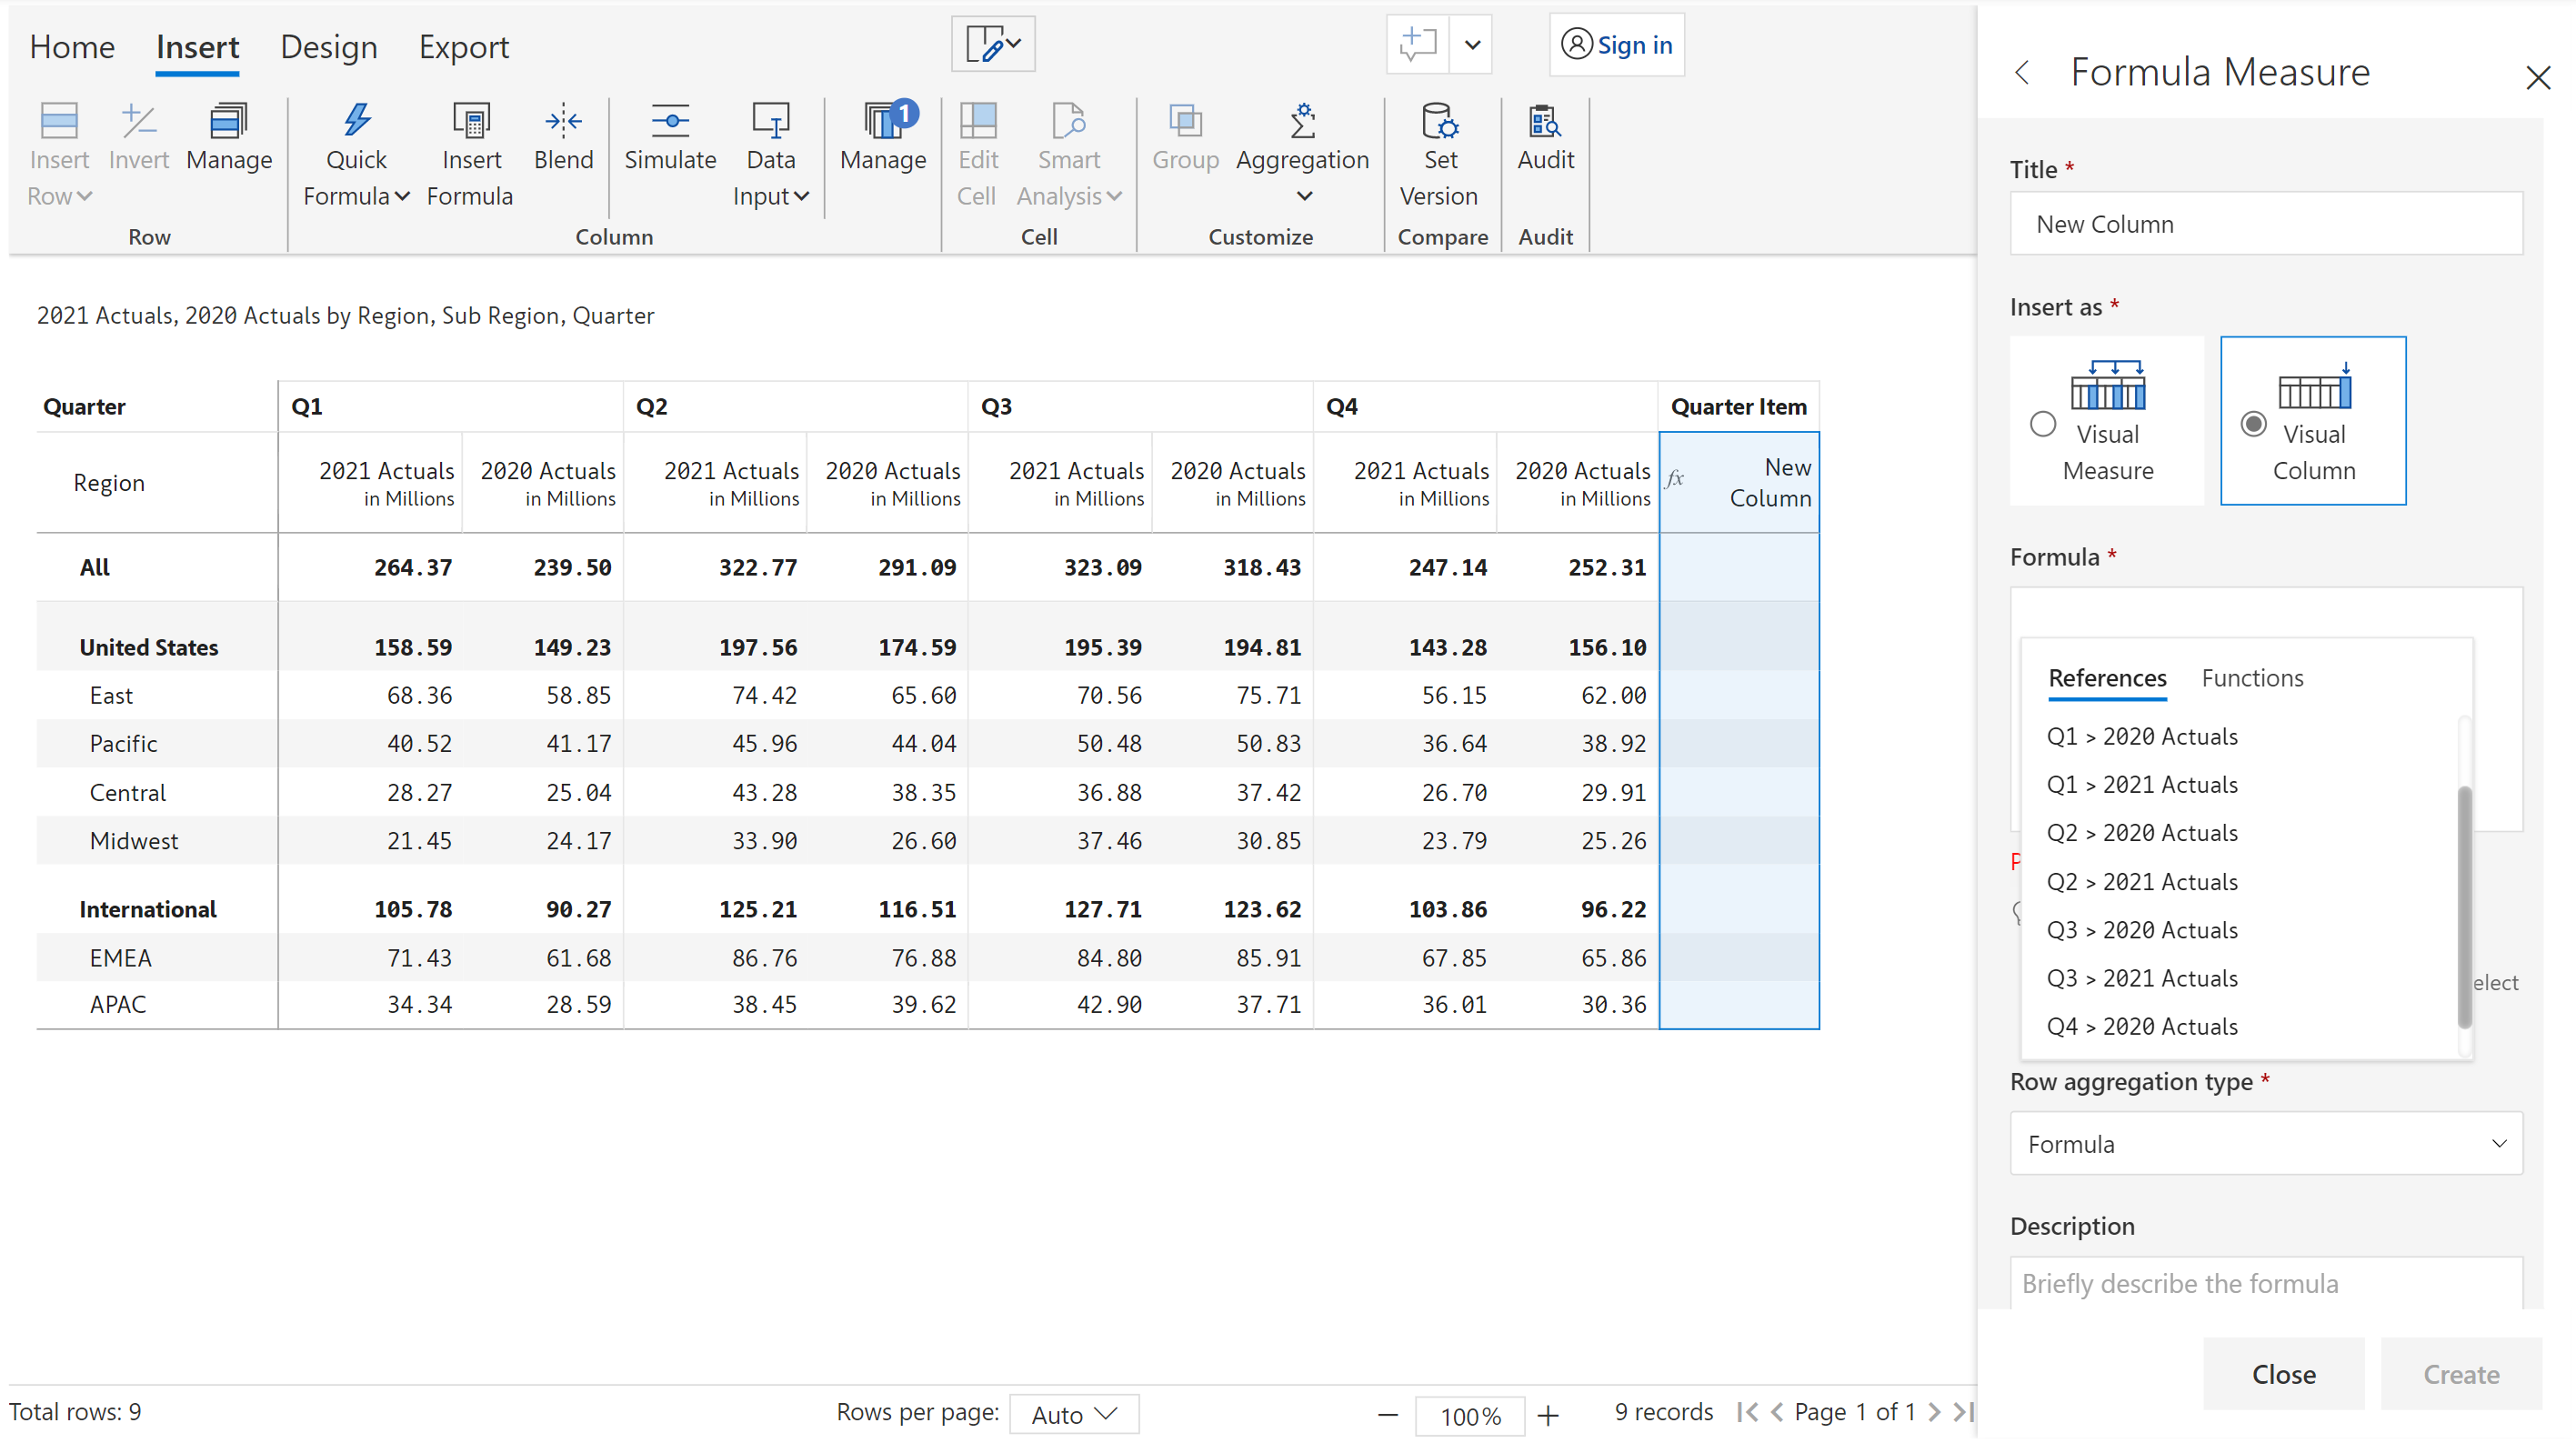
To insert a measure, select Insert --> Insert Formula from the ribbon toolbar. You will see two options: Visual Measure (the default) and Visual Column. Let us go ahead with the default option - the visual measure.
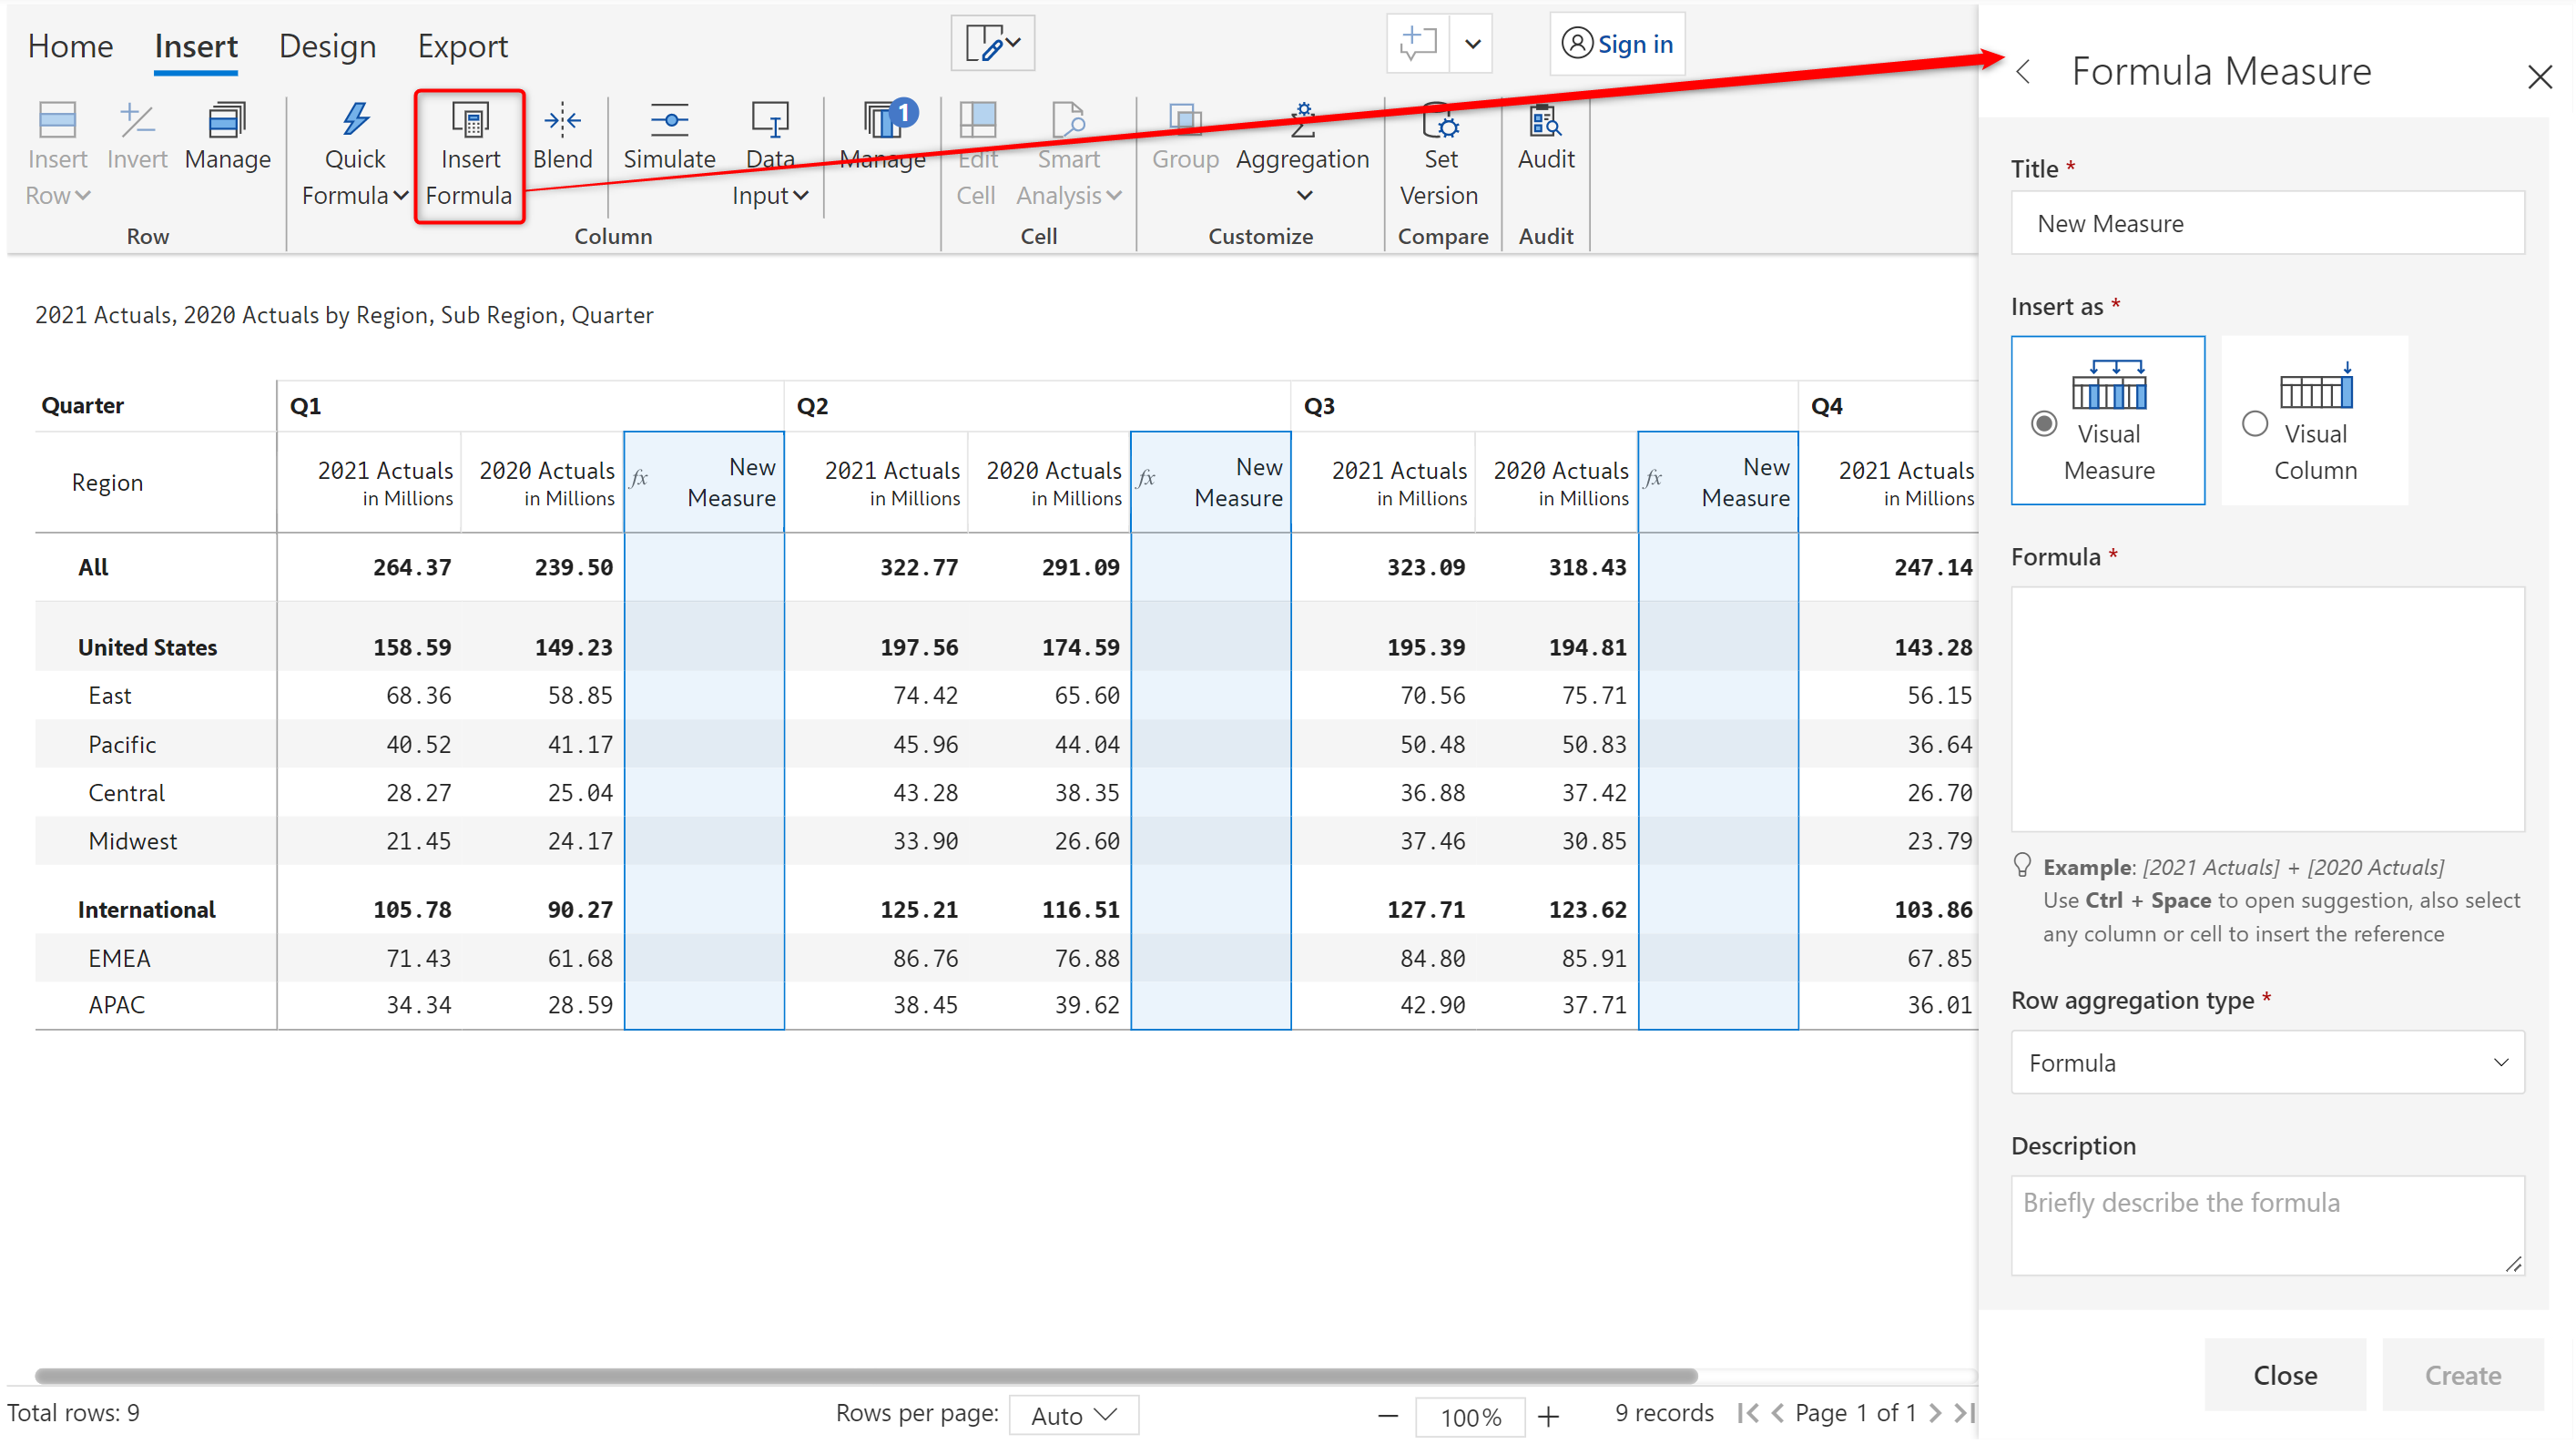
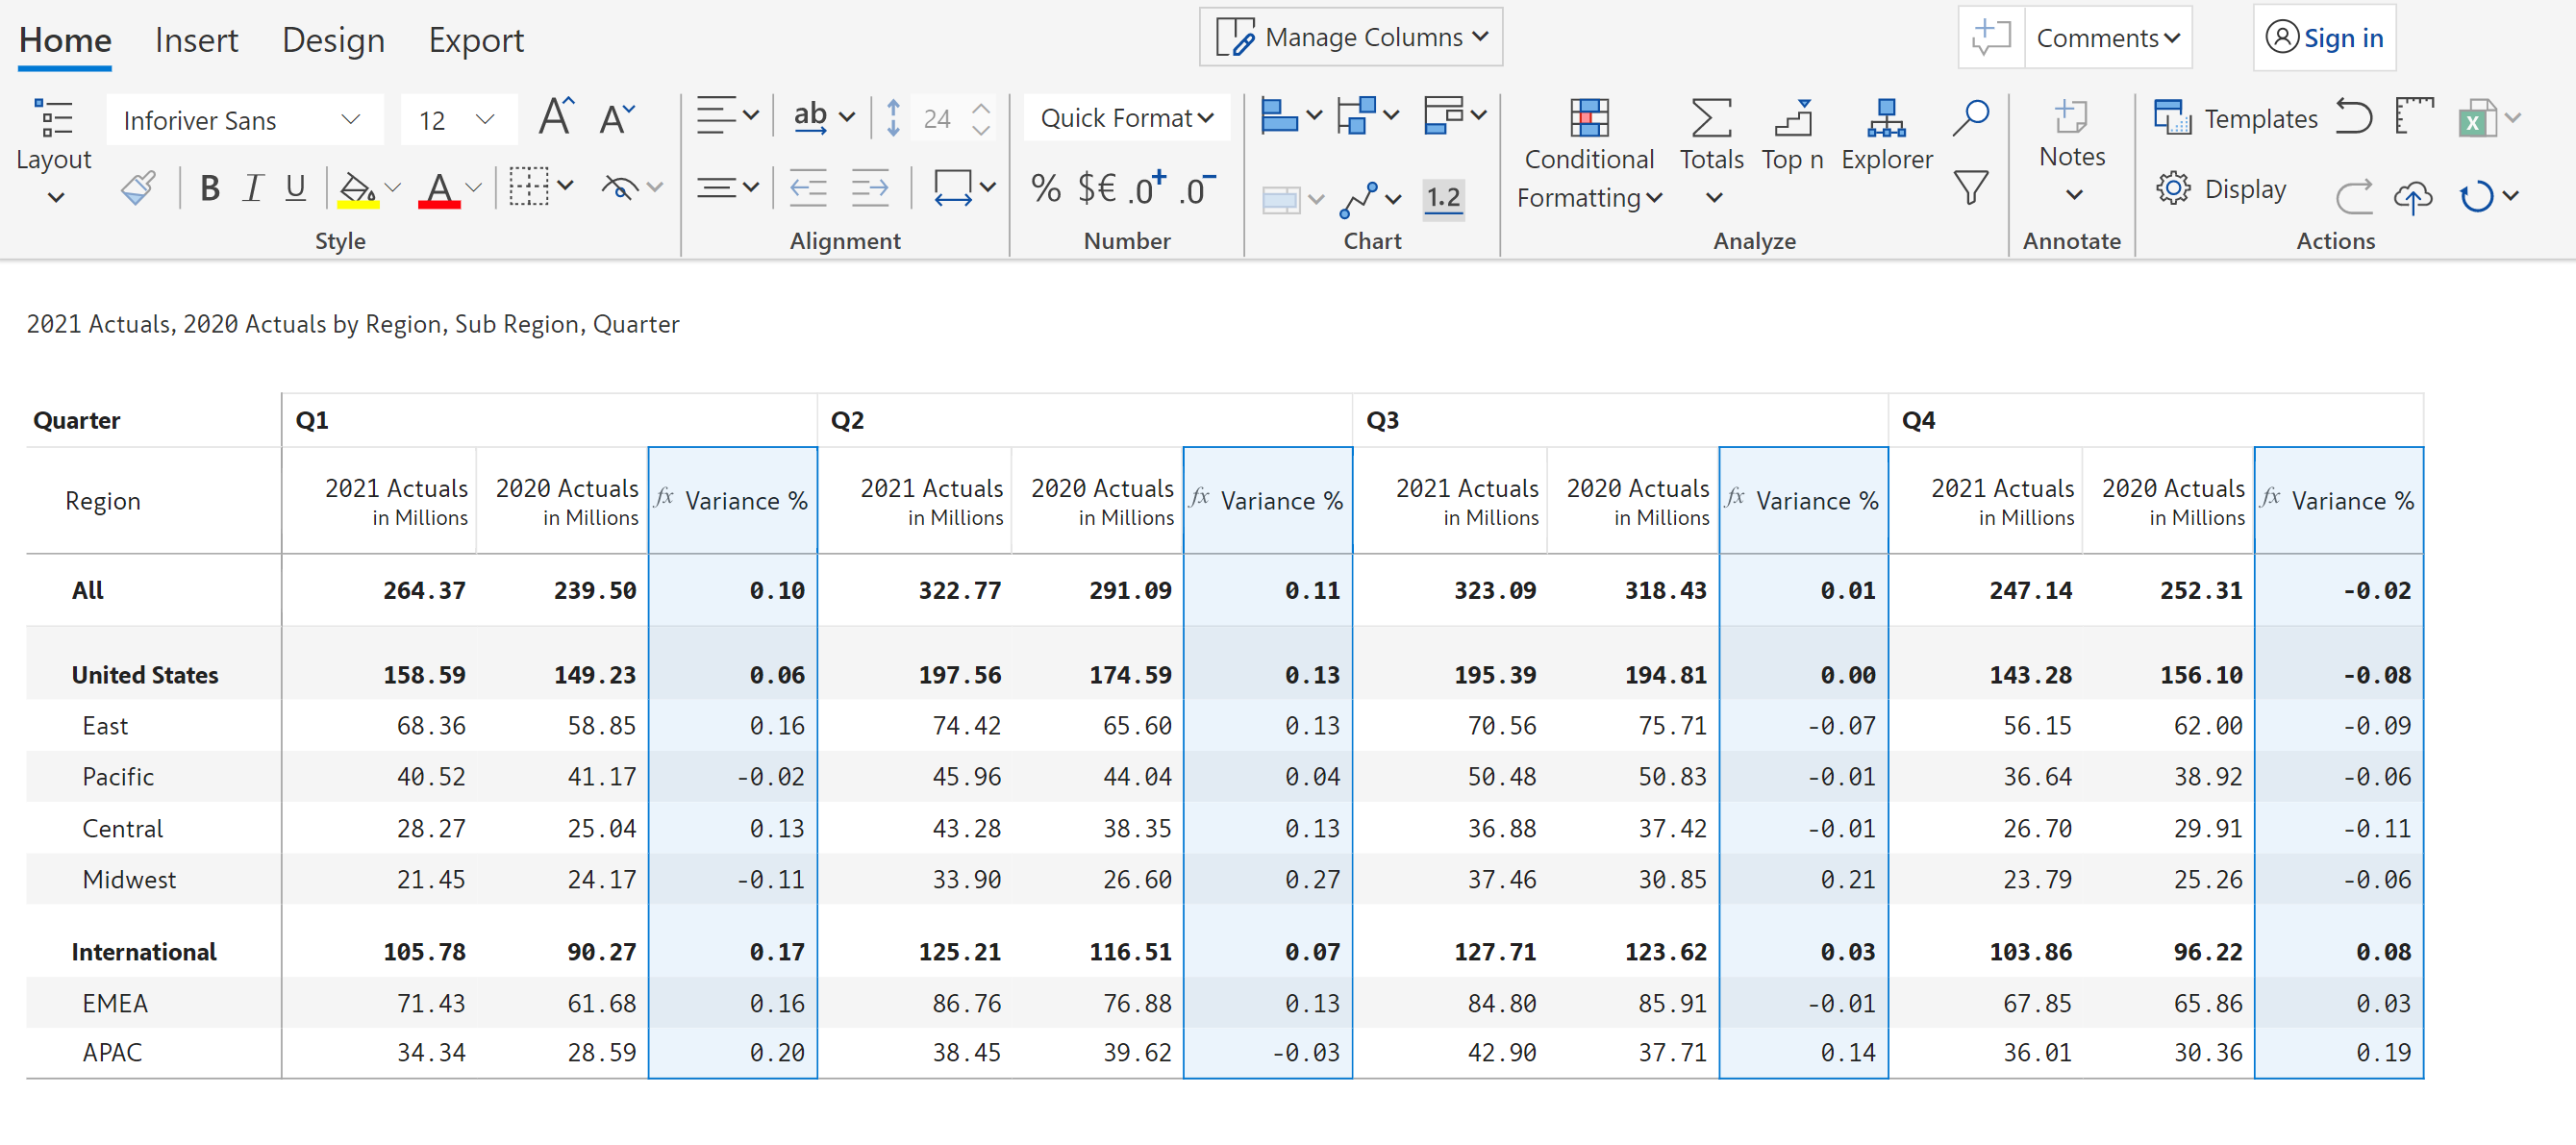
The visual measure behaves like a measure, except that it is inserted directly in your visual (bypassing the data model). In the image above, note that this new measure is inserted under each quarter.
Once you place the cursor inside the formula editor, you will see a context assistant pop up. You can access other references or functions through this context assistant.
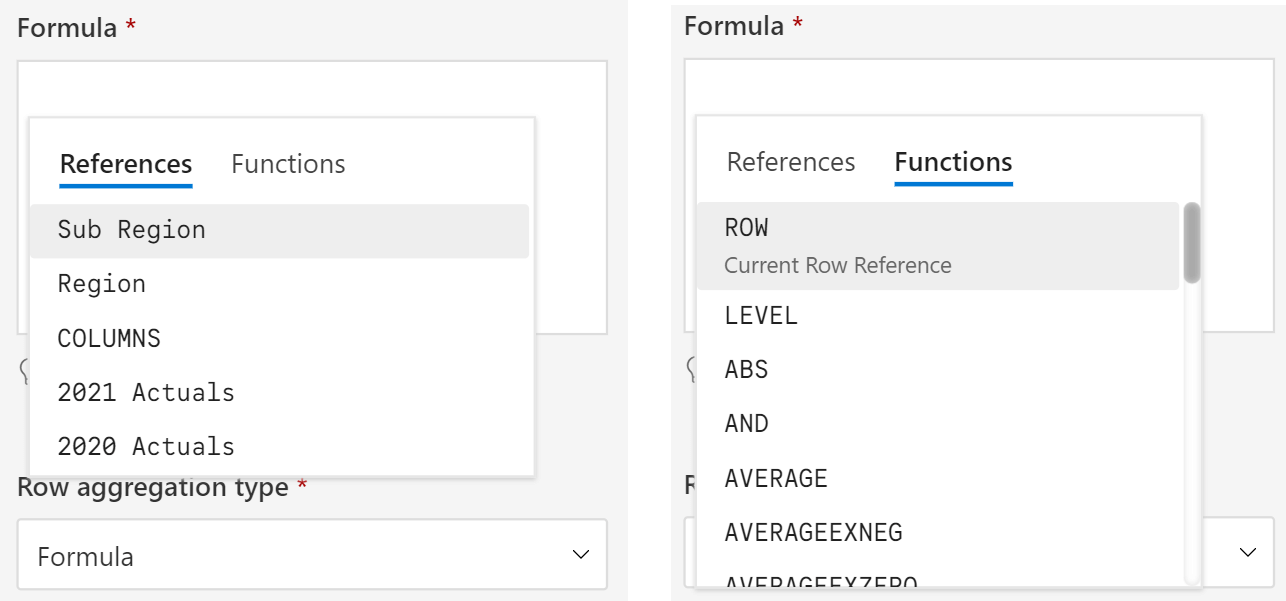
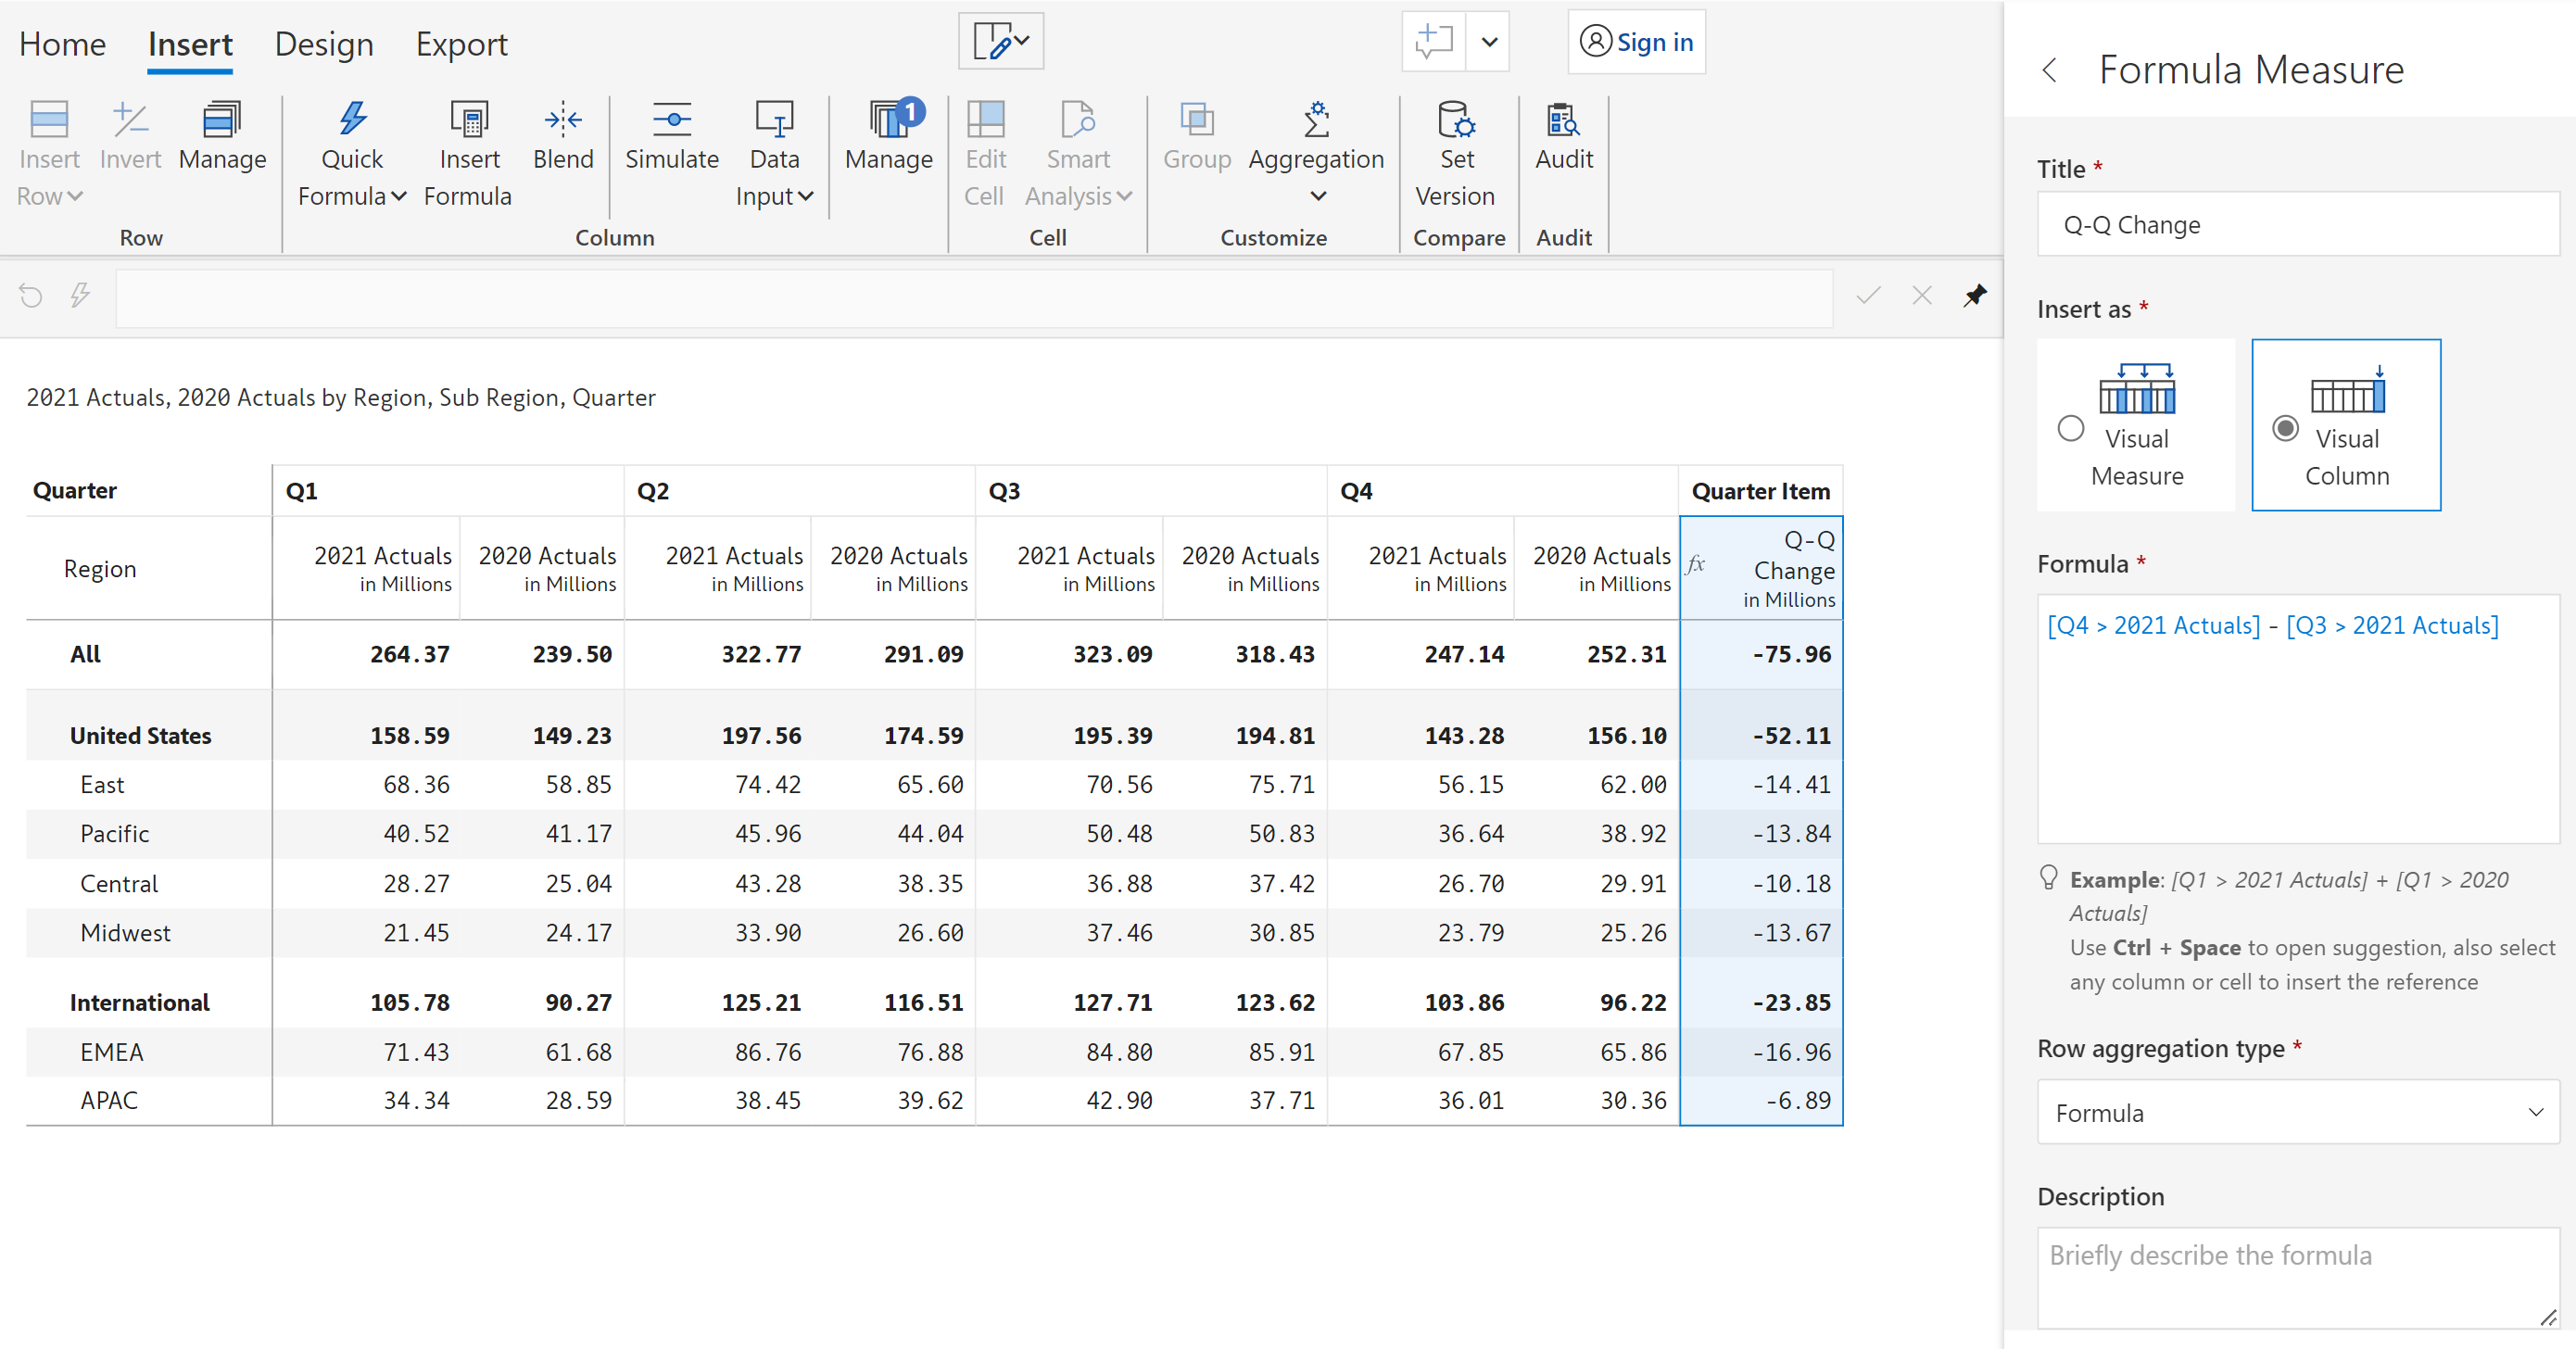
Let us go ahead and start typing in values. As you key in a formula, the References list automatically refreshes to show a narrower set of options. We will go ahead and complete the formula as shown below. The rectangular parentheses in the formula indicate that these are not normal text but references to other measures.
Give the calculated measure a proper name, say 'Variance %', and save it. You would have now inserted a calculated measure in your report. However, you will notice that the values are in absolute numbers and not in percentage terms.
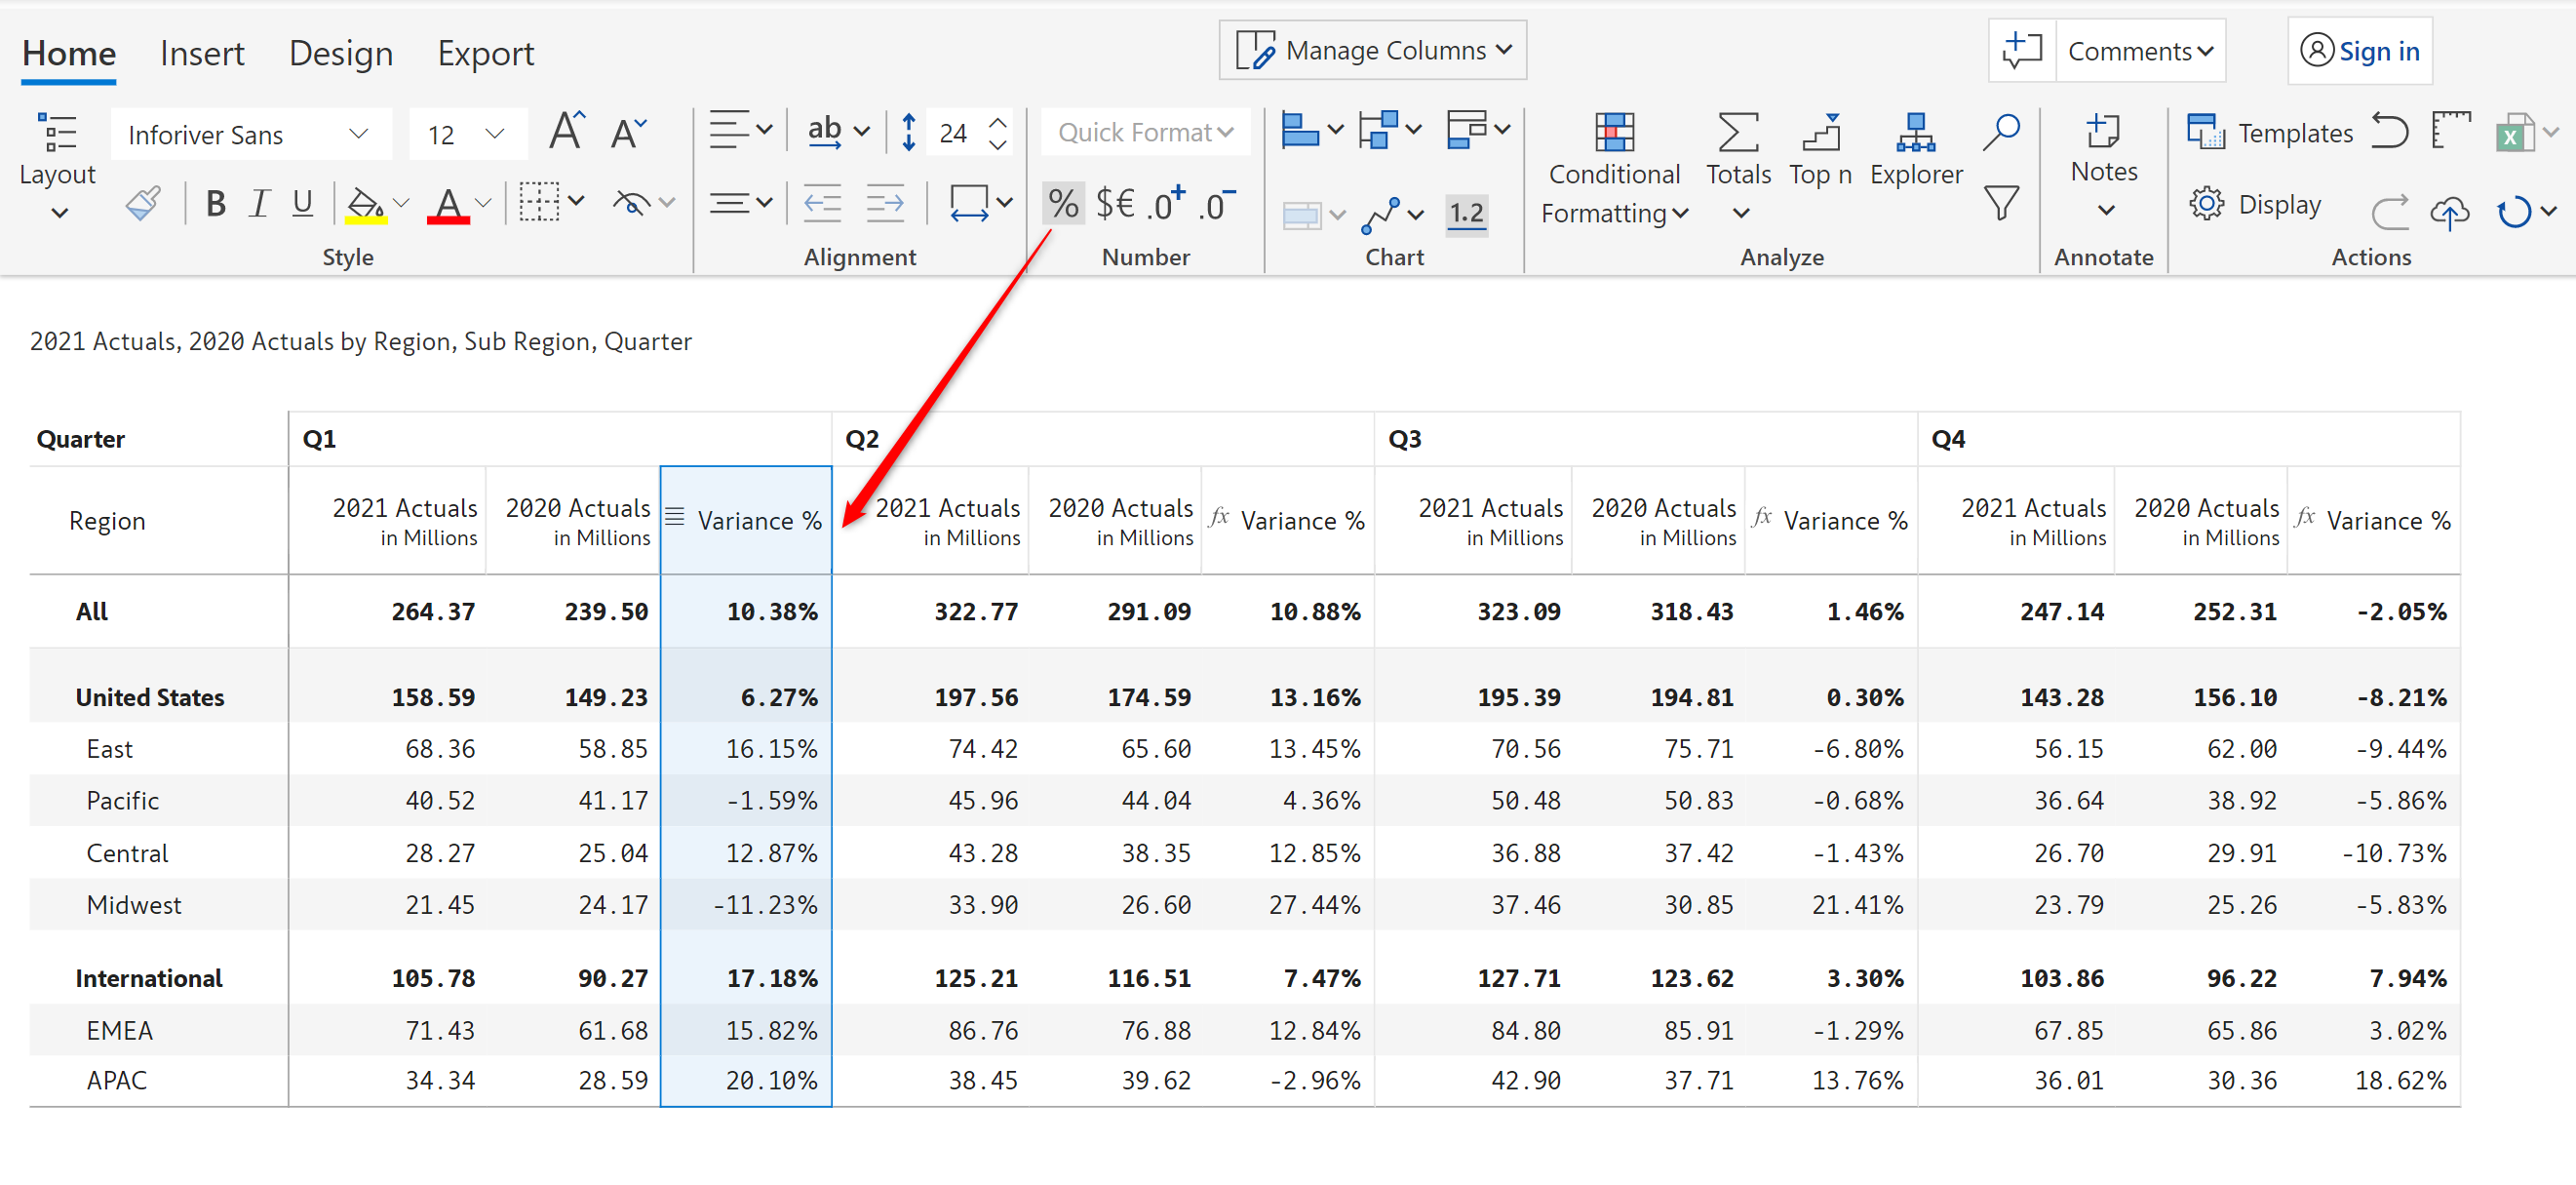
Convert the values to a percentage format by clicking on the % icon from the toolbar (refer image below). As you do this, you will also notice that the formula bar at the top of the matrix shows how the measure is calculated.
We have successfully inserted a calculated measure at the visual level in our Power BI matrix report. Watch a quick video showcasing another example for inserting a calculated measure.
A calculated column works differently from a calculated measure.
I have hidden the Variance % column that we just created (using the 'Manage Columns' feature). Now let us proceed to add a Visual Column this time.
Note that a visual column always appears at the very last, outside any category or category hierarchies seen in columns. In addition, you will also notice that the References section is a bit different. While creating a new measure, the References section was just listing other available measures (2021 Actuals and 2020 Actuals). This time, it shows every instance of the every individual measure (e.g. Q2 - 2021 Actuals, Q3 - 2021 Actuals etc.). Using this, you can traverse right up to the leaf node of any column hierarchy.
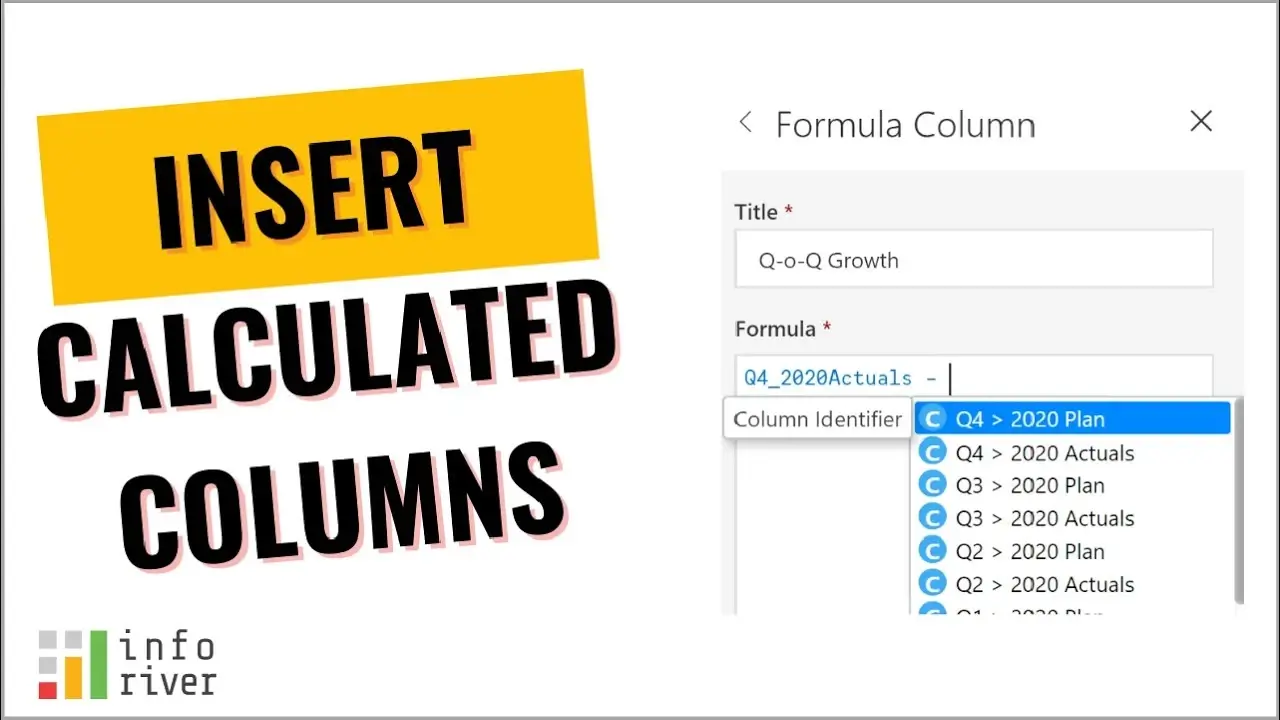
Let us now calculate quarter-on-quarter change from Q3 to Q4 as shown below. Give it a title and click 'Update' and you will see the values updated in the report.
We have now learnt how to insert a calculated column in a Power BI matrix or a table report using Inforiver. Watch a quick video demonstrating another example.
Hope you found this informative & fun. What types of interesting formulae were you able to implement using Inforiver?
Share your experiences in the community.
Related Power BI Ideas: In Matrix Table Chart Can we have option to add additional Custom column?

Inforiver helps enterprises consolidate planning, reporting & analytics on a single platform (Power BI). The no-code, self-service award-winning platform has been recognized as the industry’s best and is adopted by many Fortune 100 firms.
Inforiver is a product of Lumel, the #1 Power BI AppSource Partner. The firm serves over 3,000 customers worldwide through its portfolio of products offered under the brands Inforiver, EDITable, ValQ, and xViz.