Upcoming webinar on 'Inforiver Charts : The fastest way to deliver stories in Power BI', Aug 29th , Monday, 10.30 AM CST. Register Now
Inforiver Matrix visual has been renamed to Reporting Matrix. This change will be reflected in Microsoft AppSource from the next release.
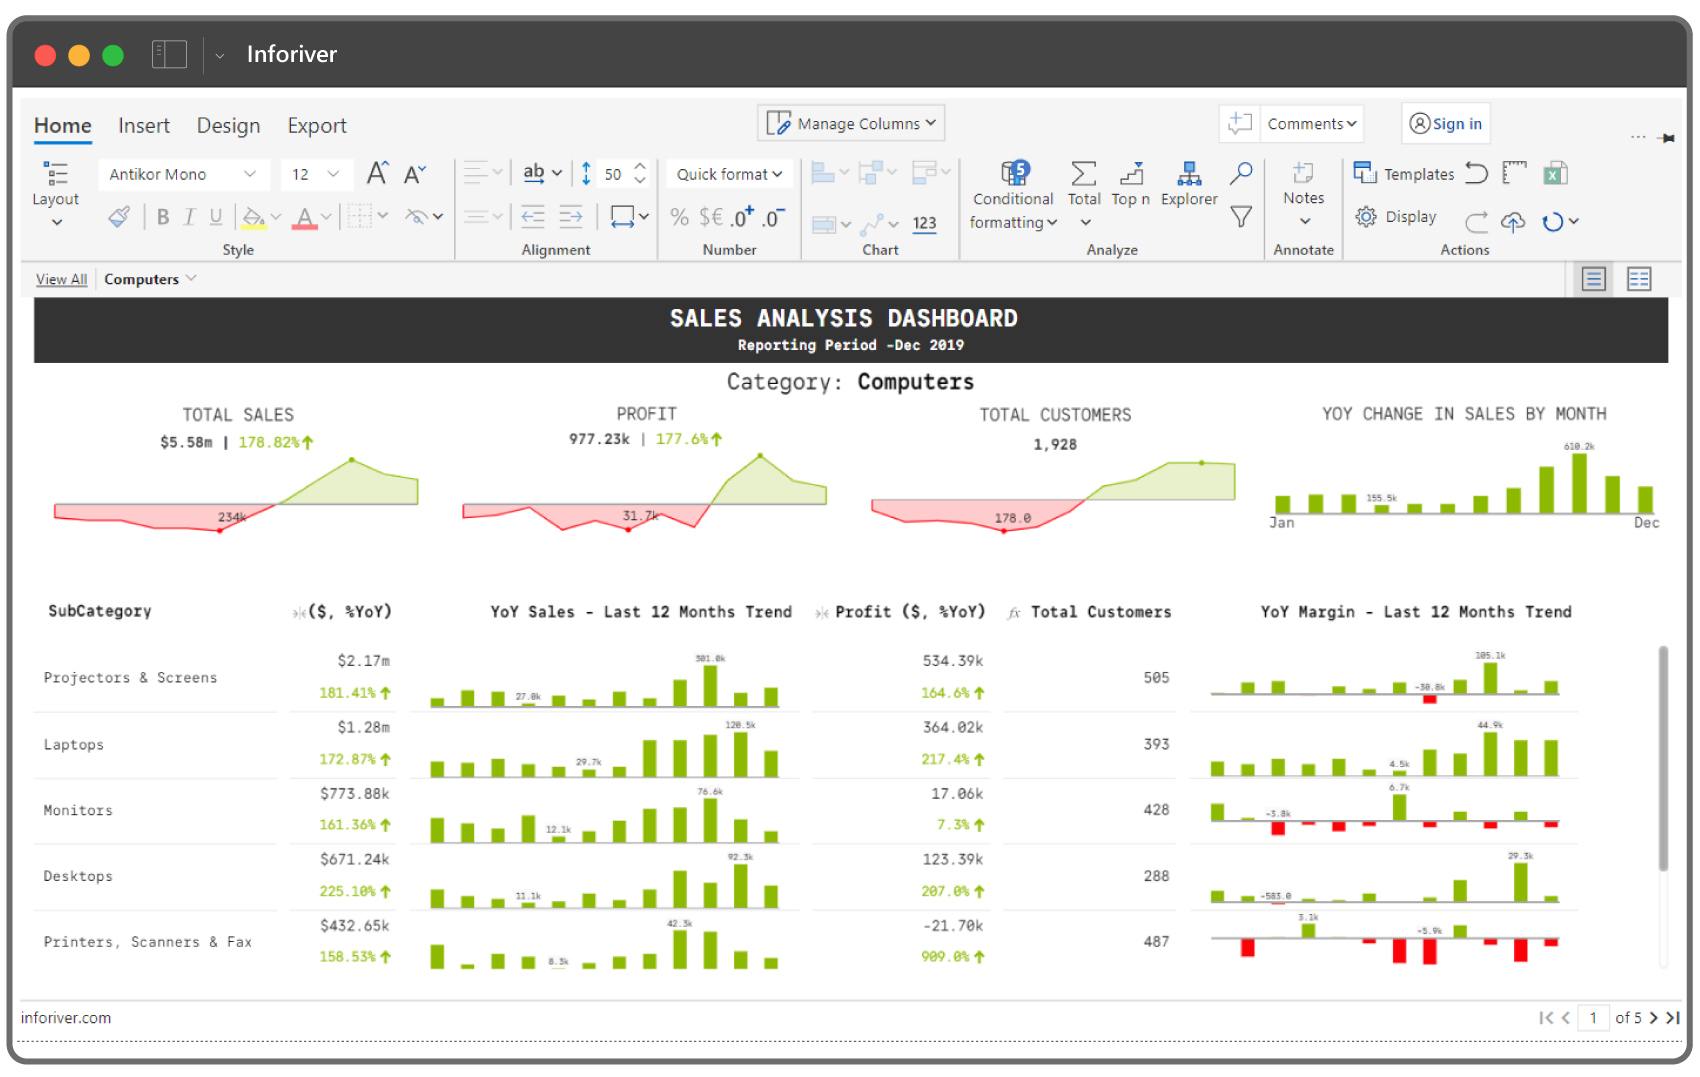

Build highly formatted & interactive paginated reports
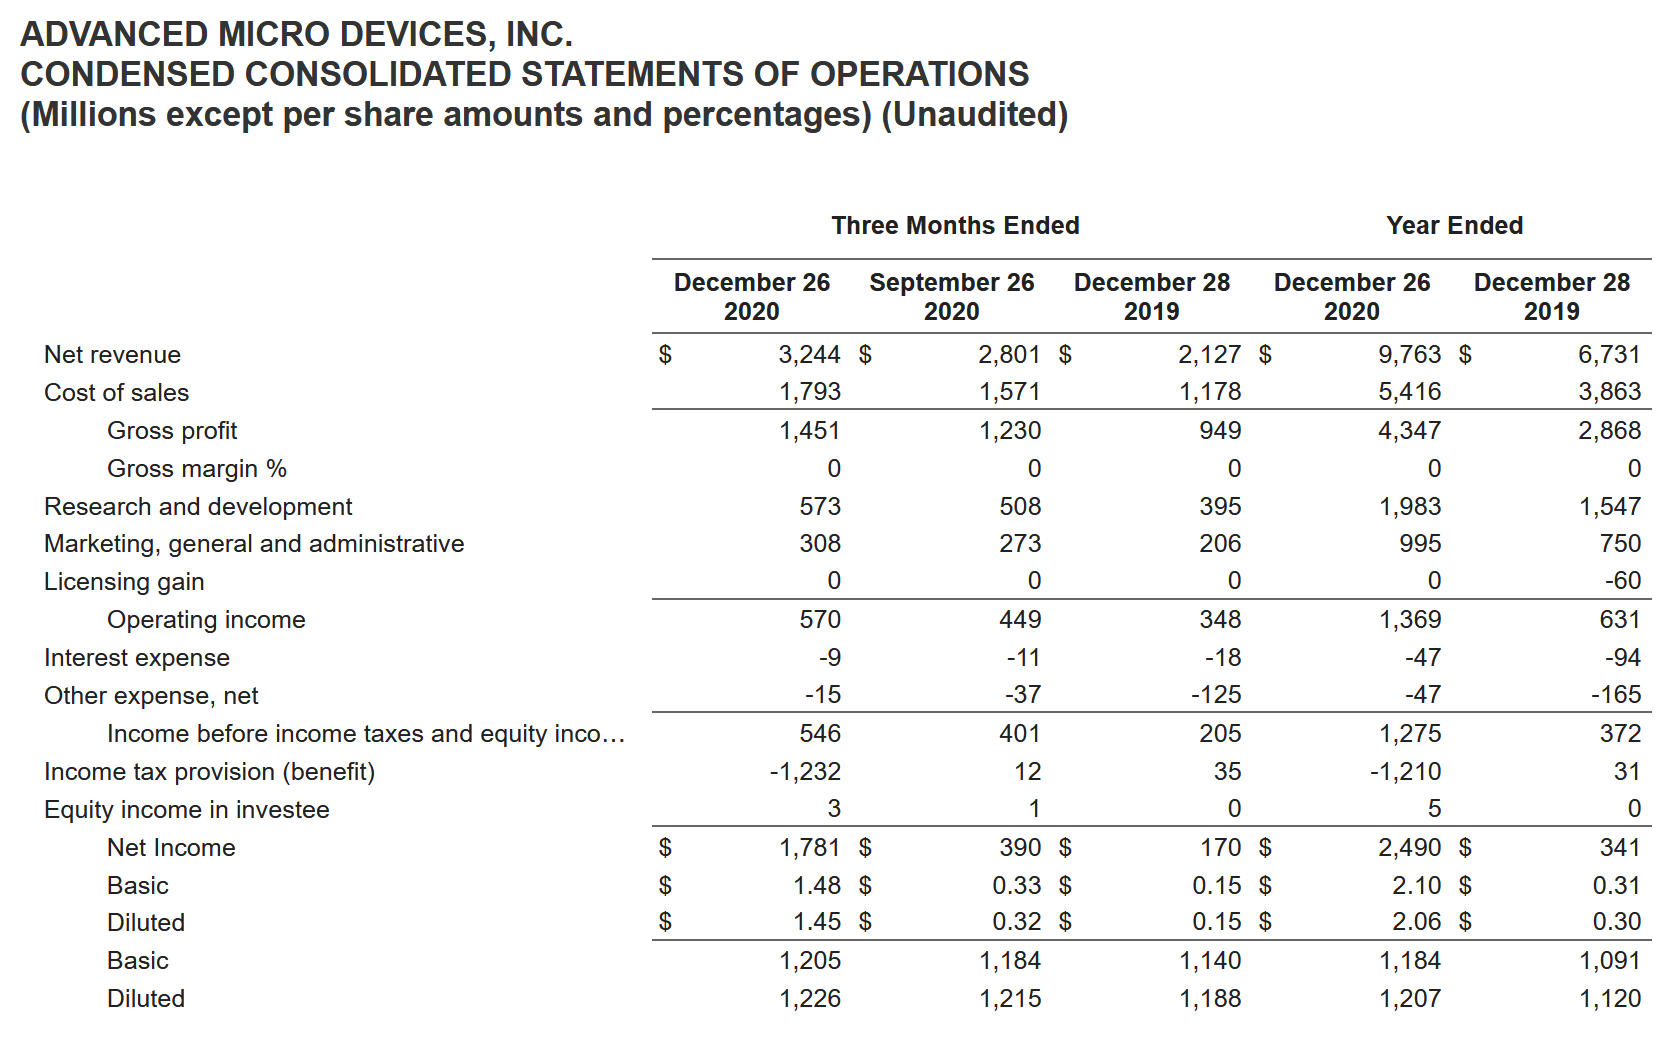
Deliver highly formatted income statements, balance sheets, cash flow statements, and more
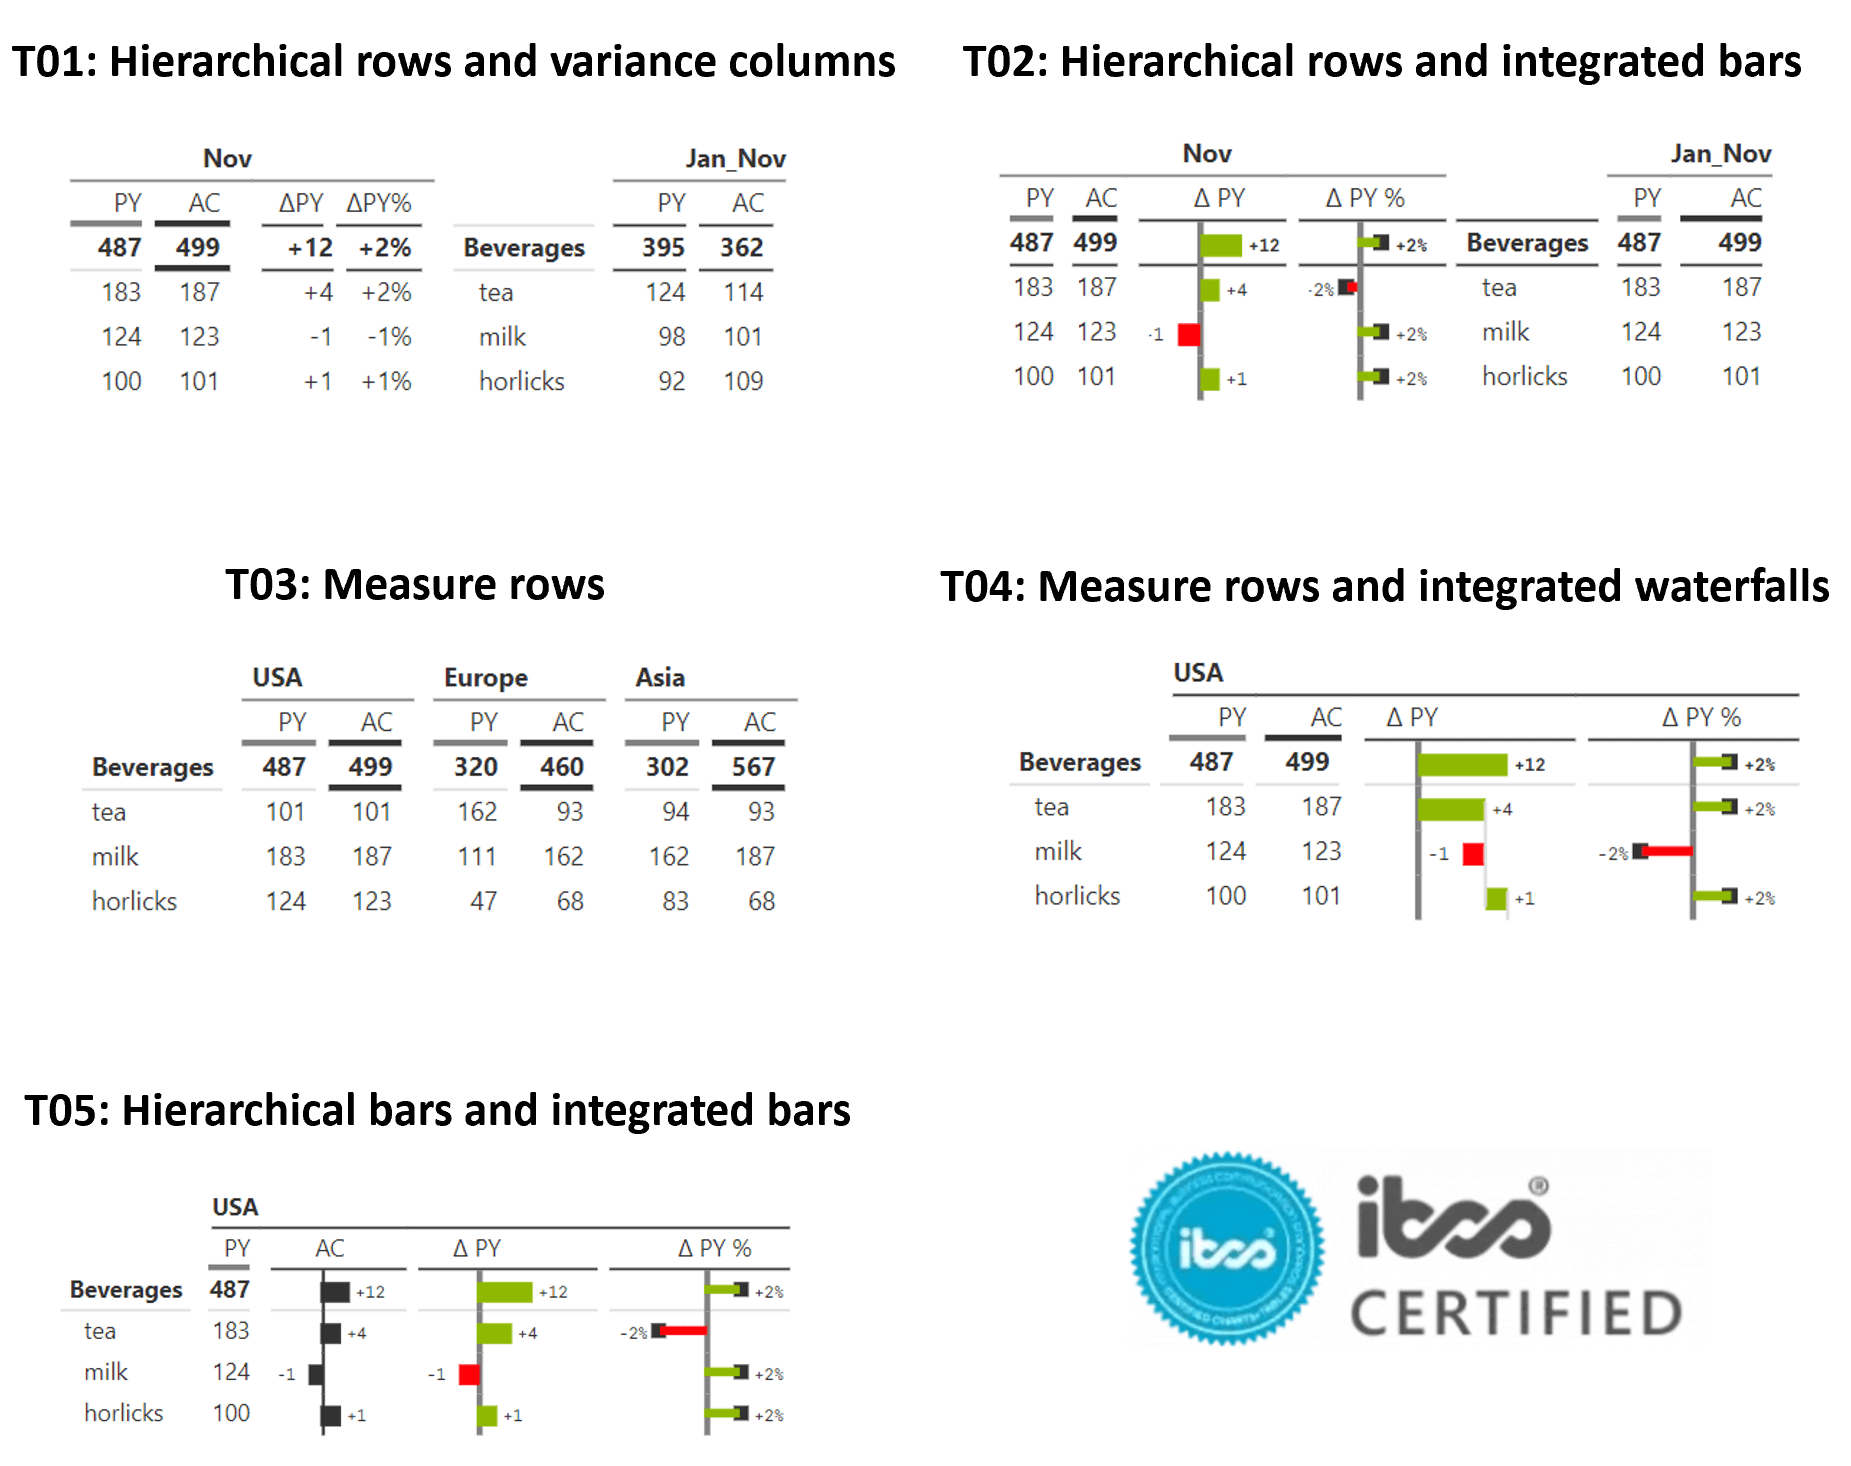
Deliver performance & variance reporting using 1-click International Business Communication Standards (IBCS) templates


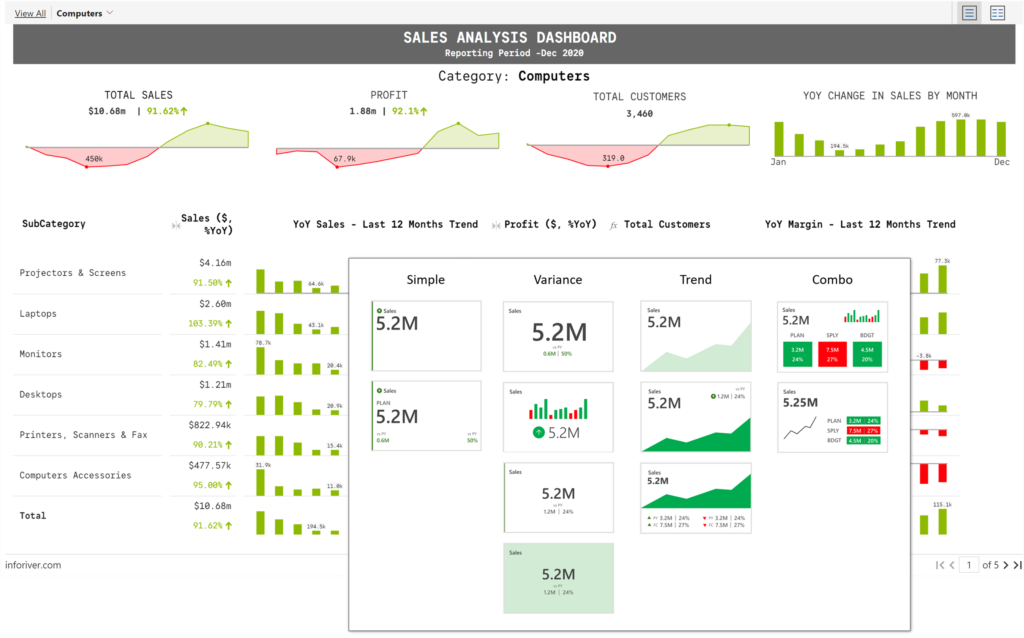
Deliver a range of charts and visualizations in your matrix reports in a single click
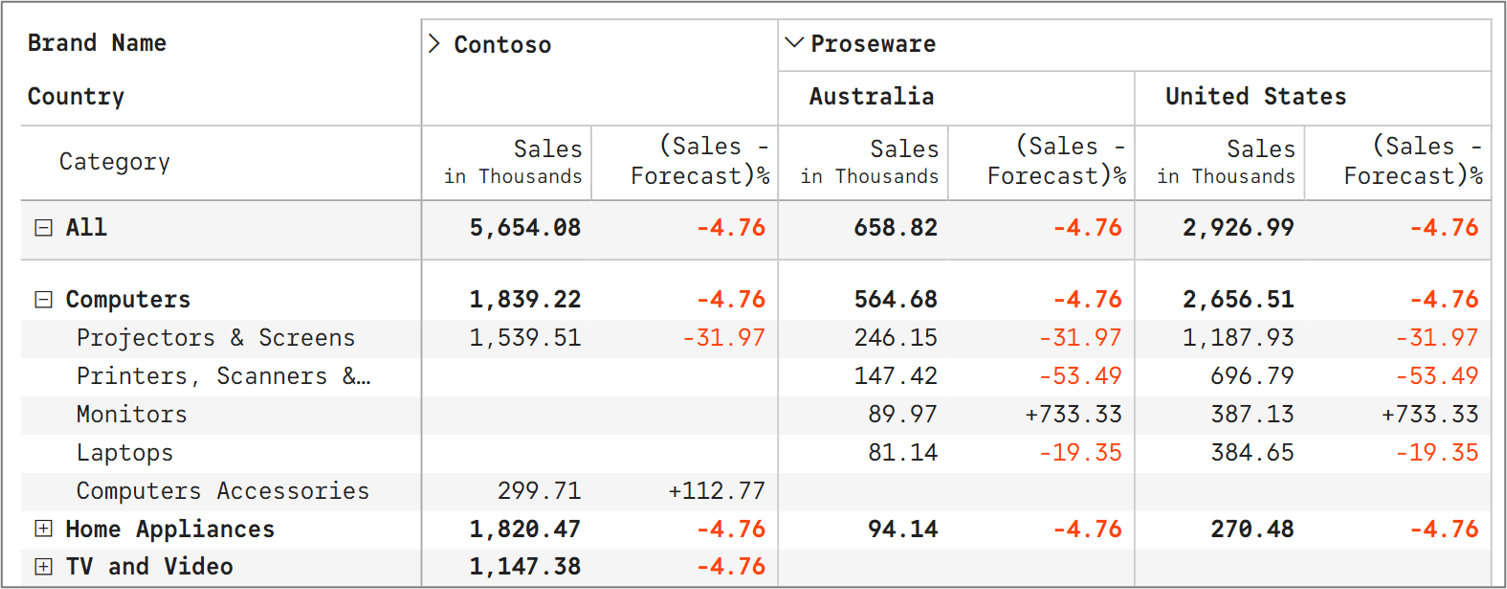
Enrich your analysis & decision-making by applying pivot-table like capabilities inside Power BI
Insert, edit or update cell values using values or formula; supports formula references to other cells
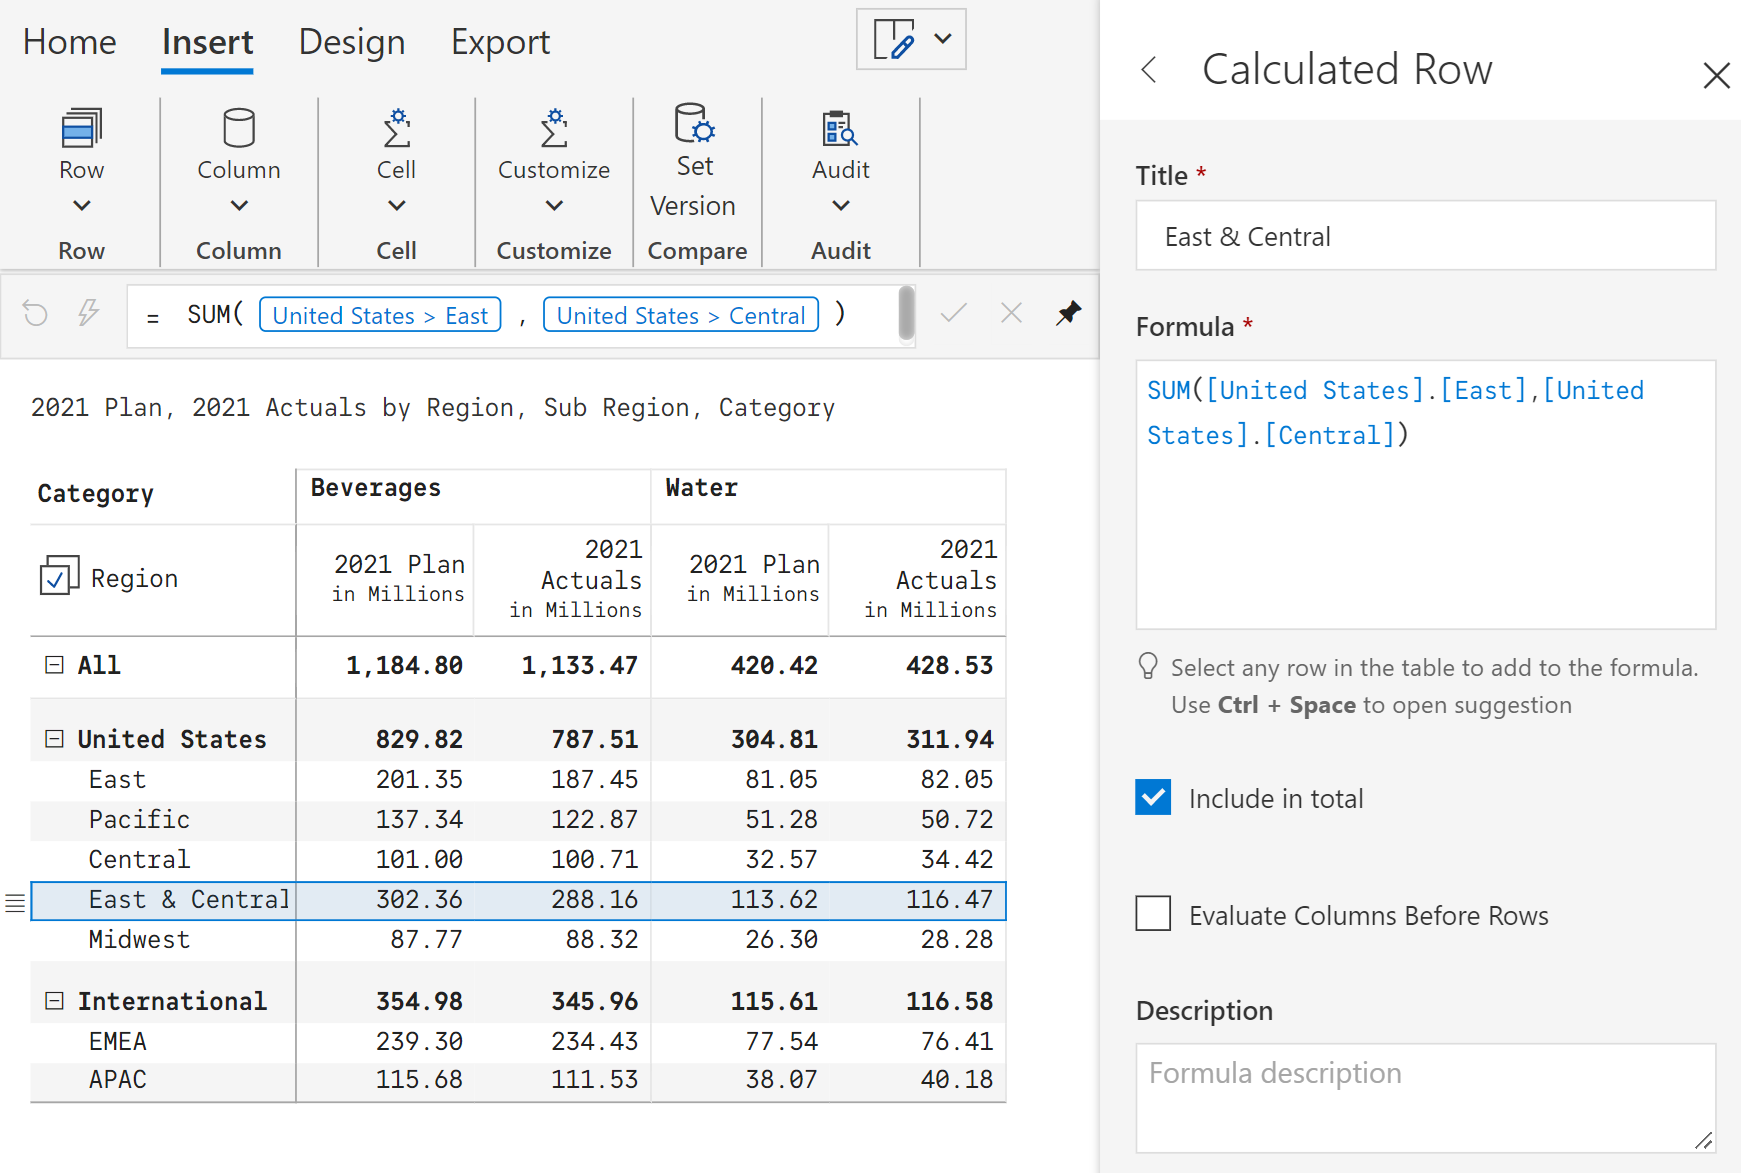
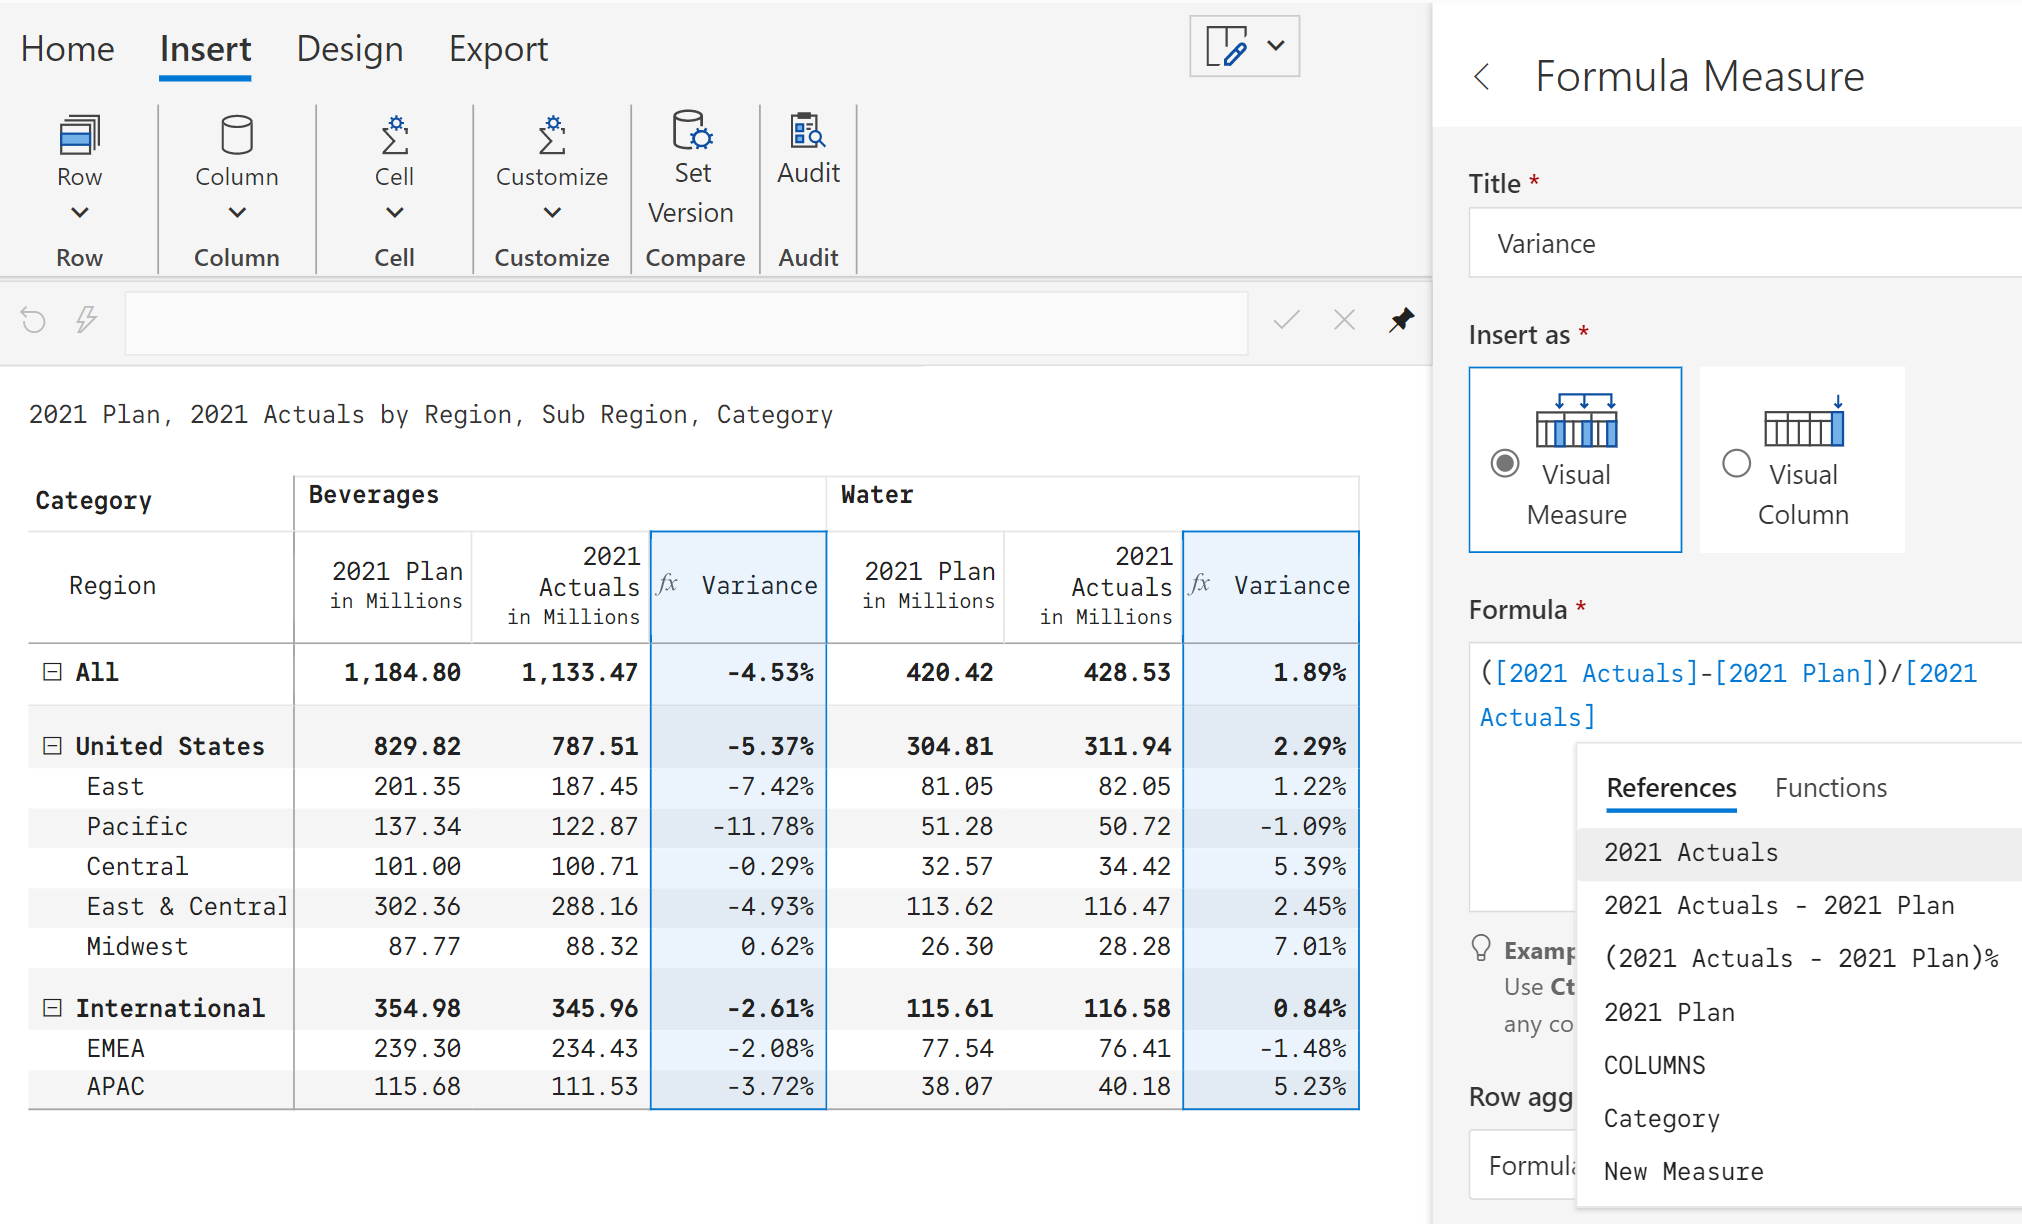
Leverage powerful formula engine to insert rows, columns and measures at the visual-level
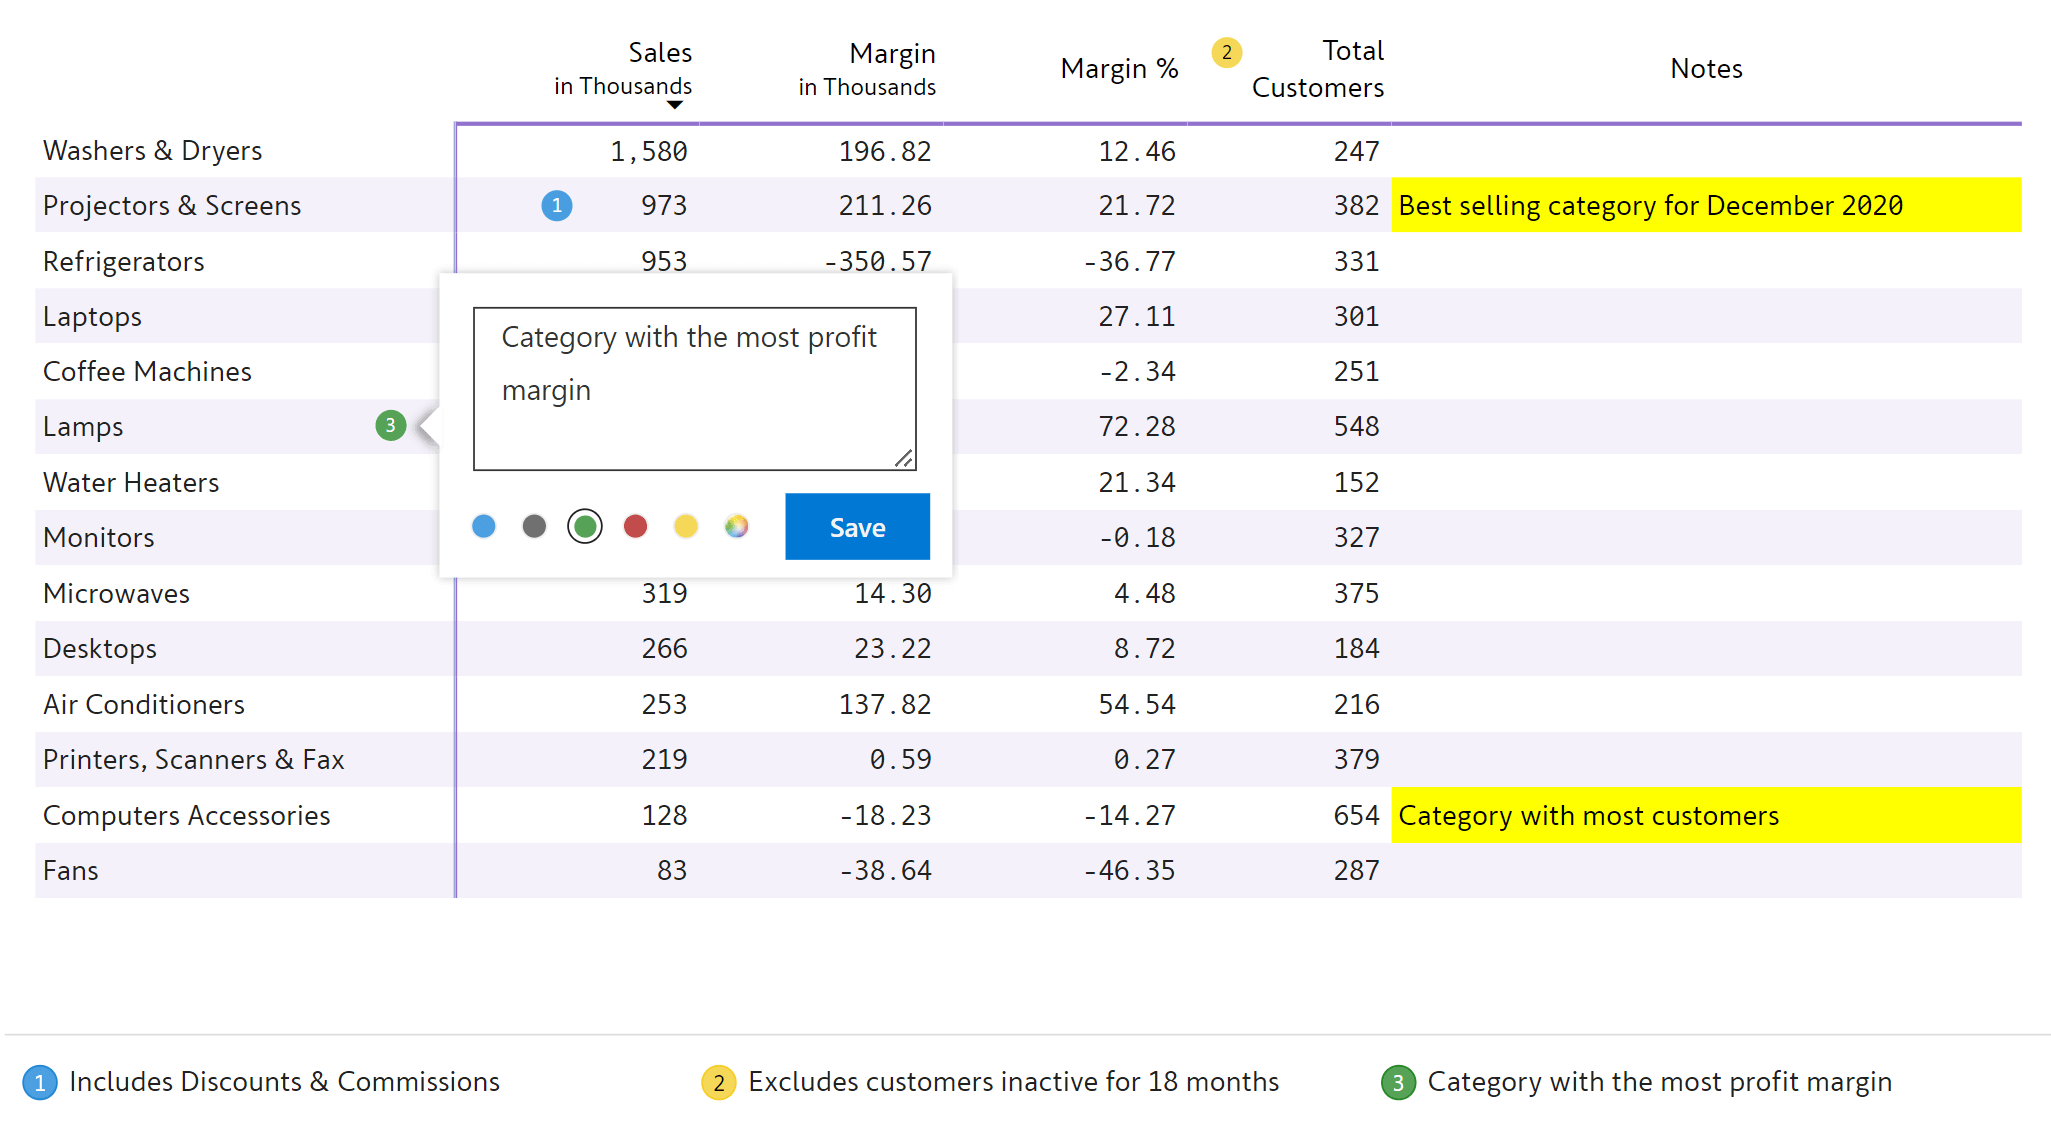
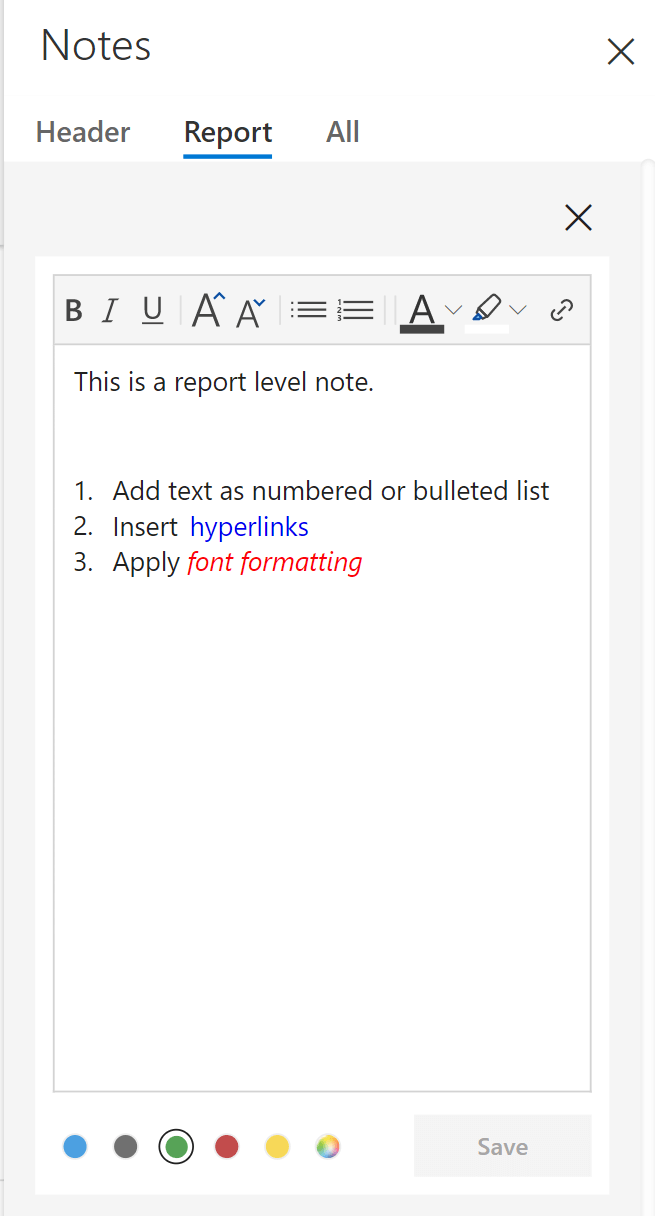
Enhance your data stories with cell, row & column-level notes/footnotes & annotations. Report level notes and marker mode are also available
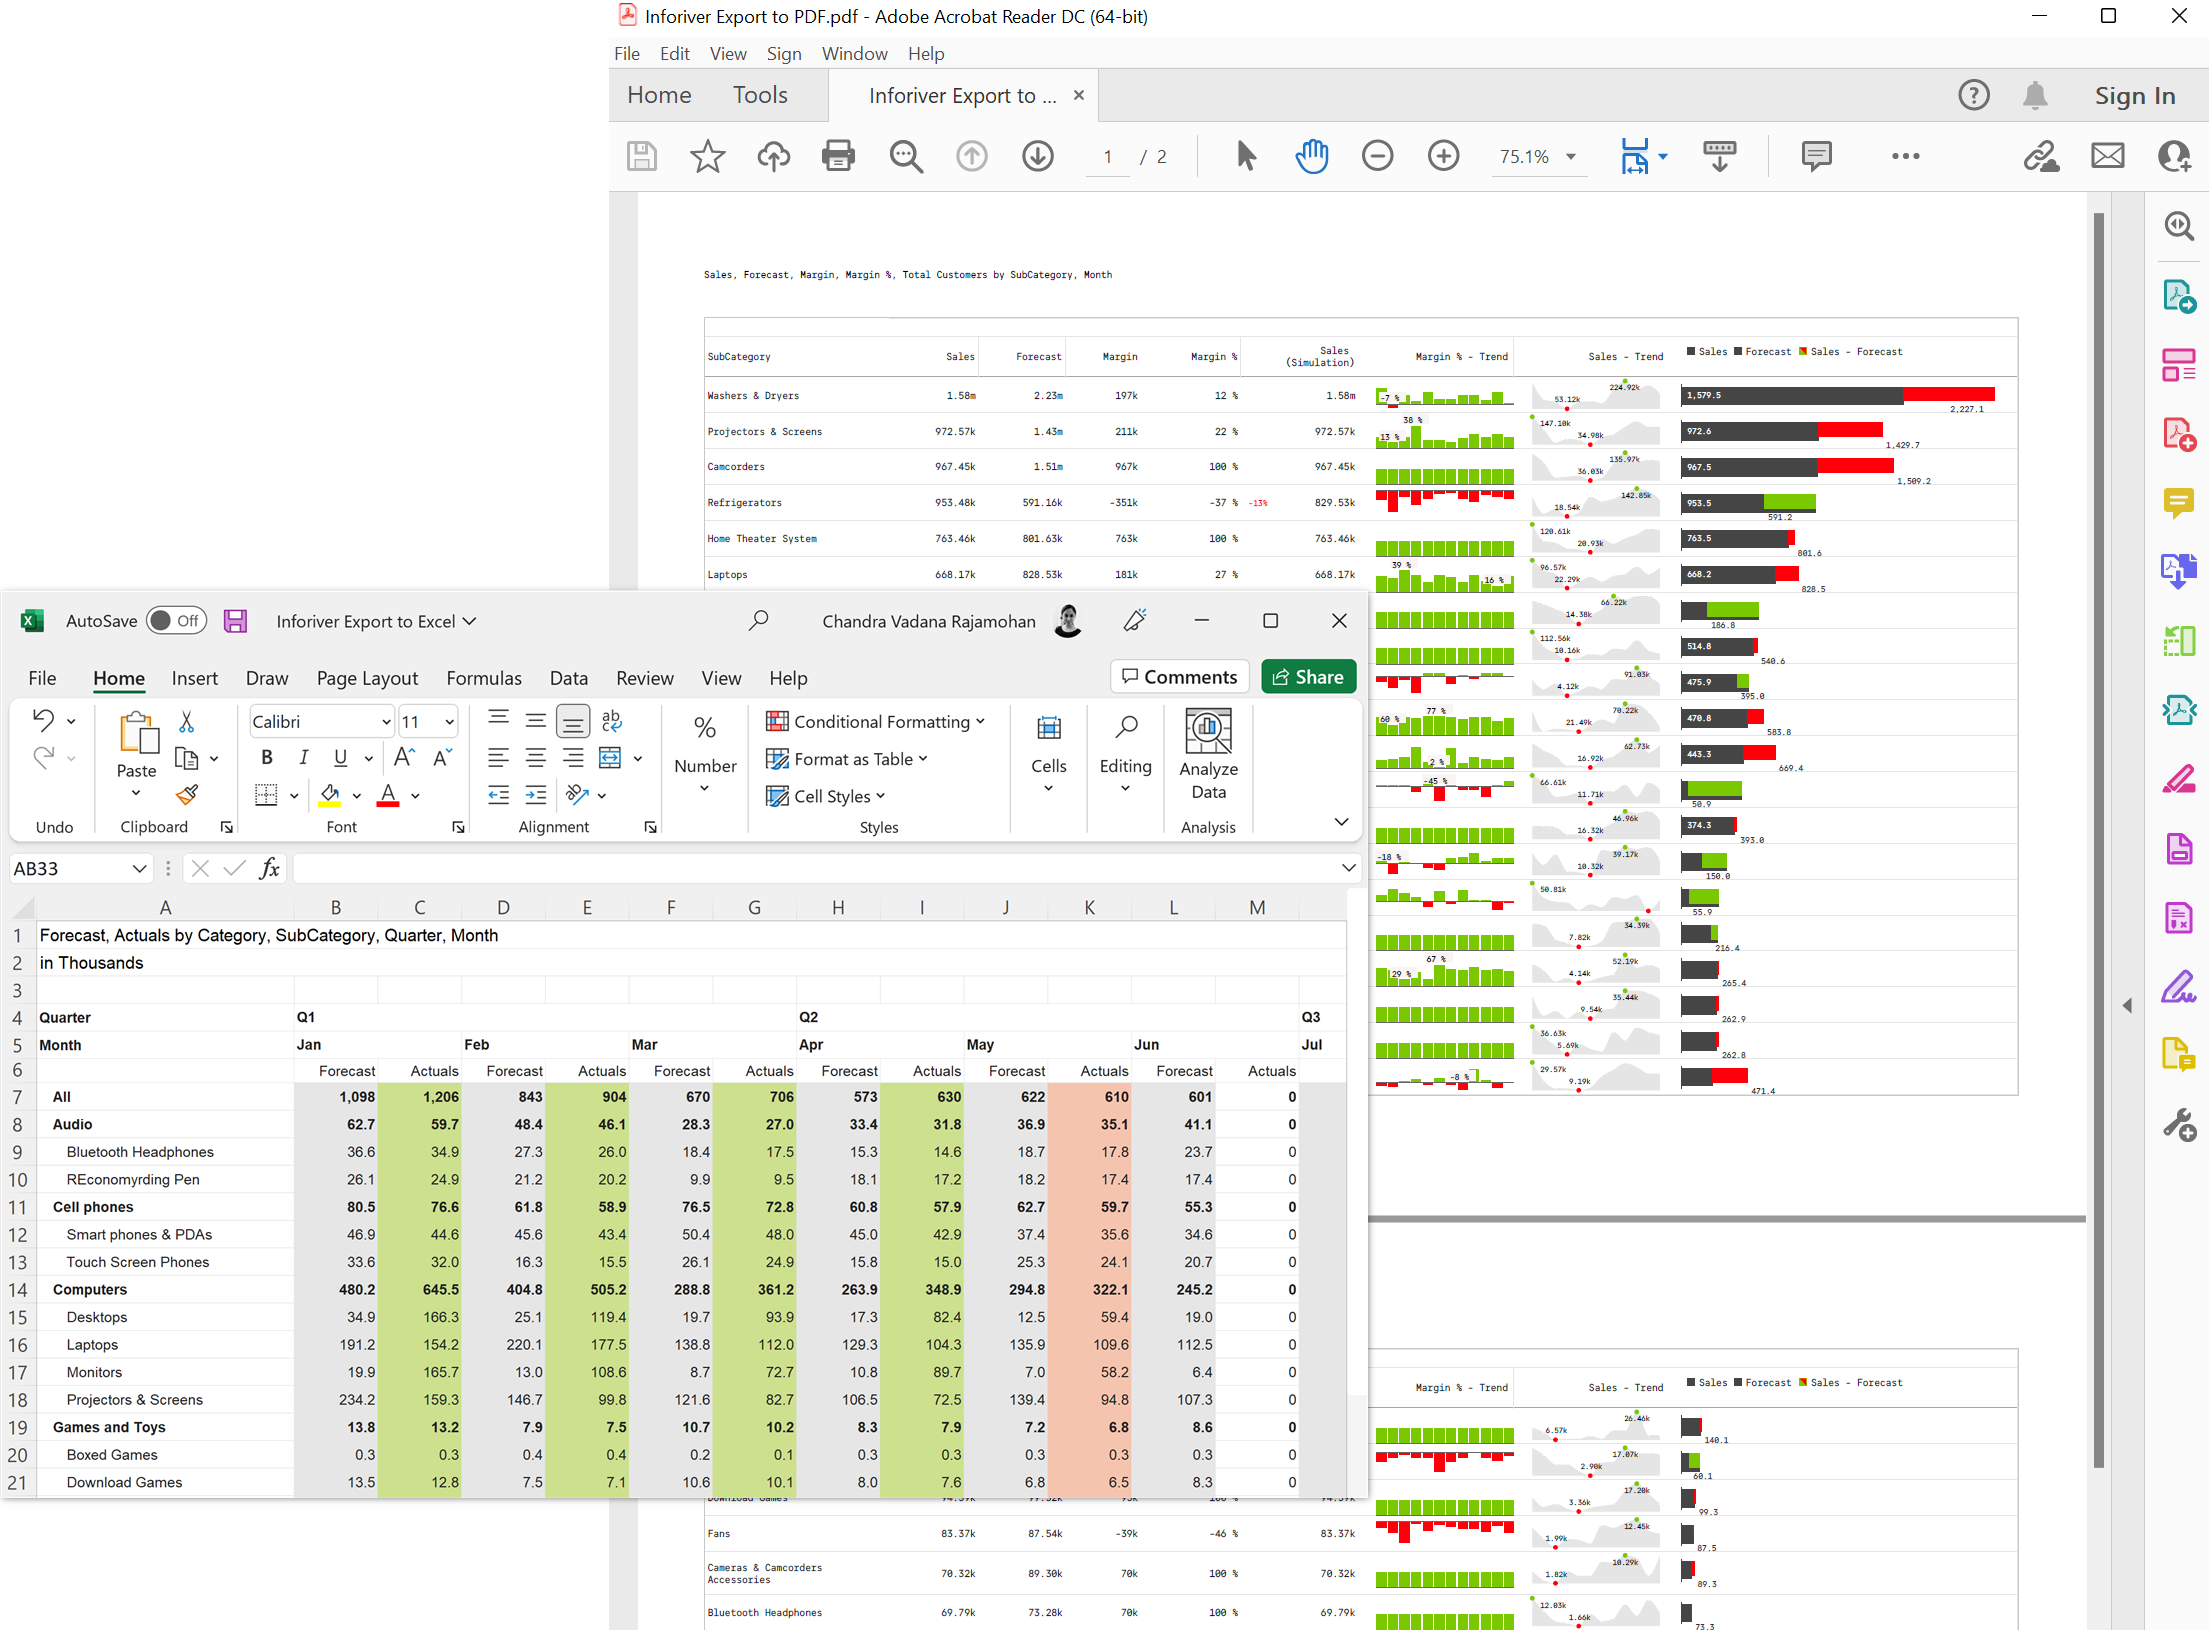
Export to Excel or PDF without losing formatting
The industry-leading export capability delivers the following:
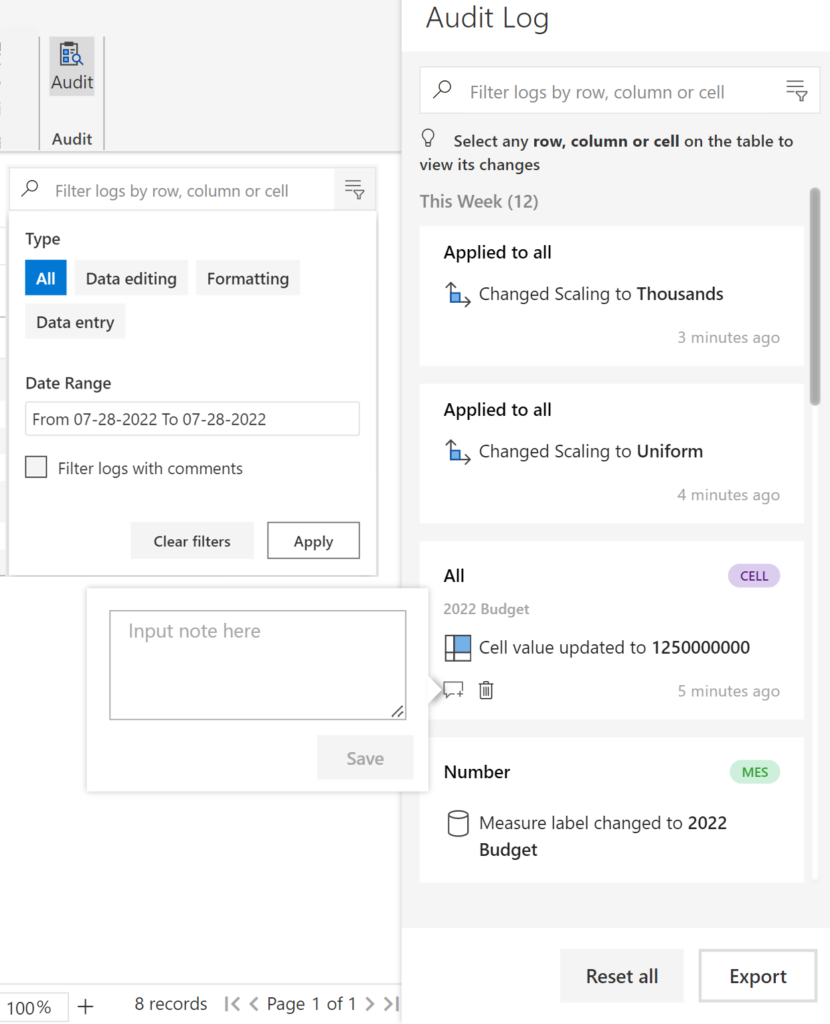
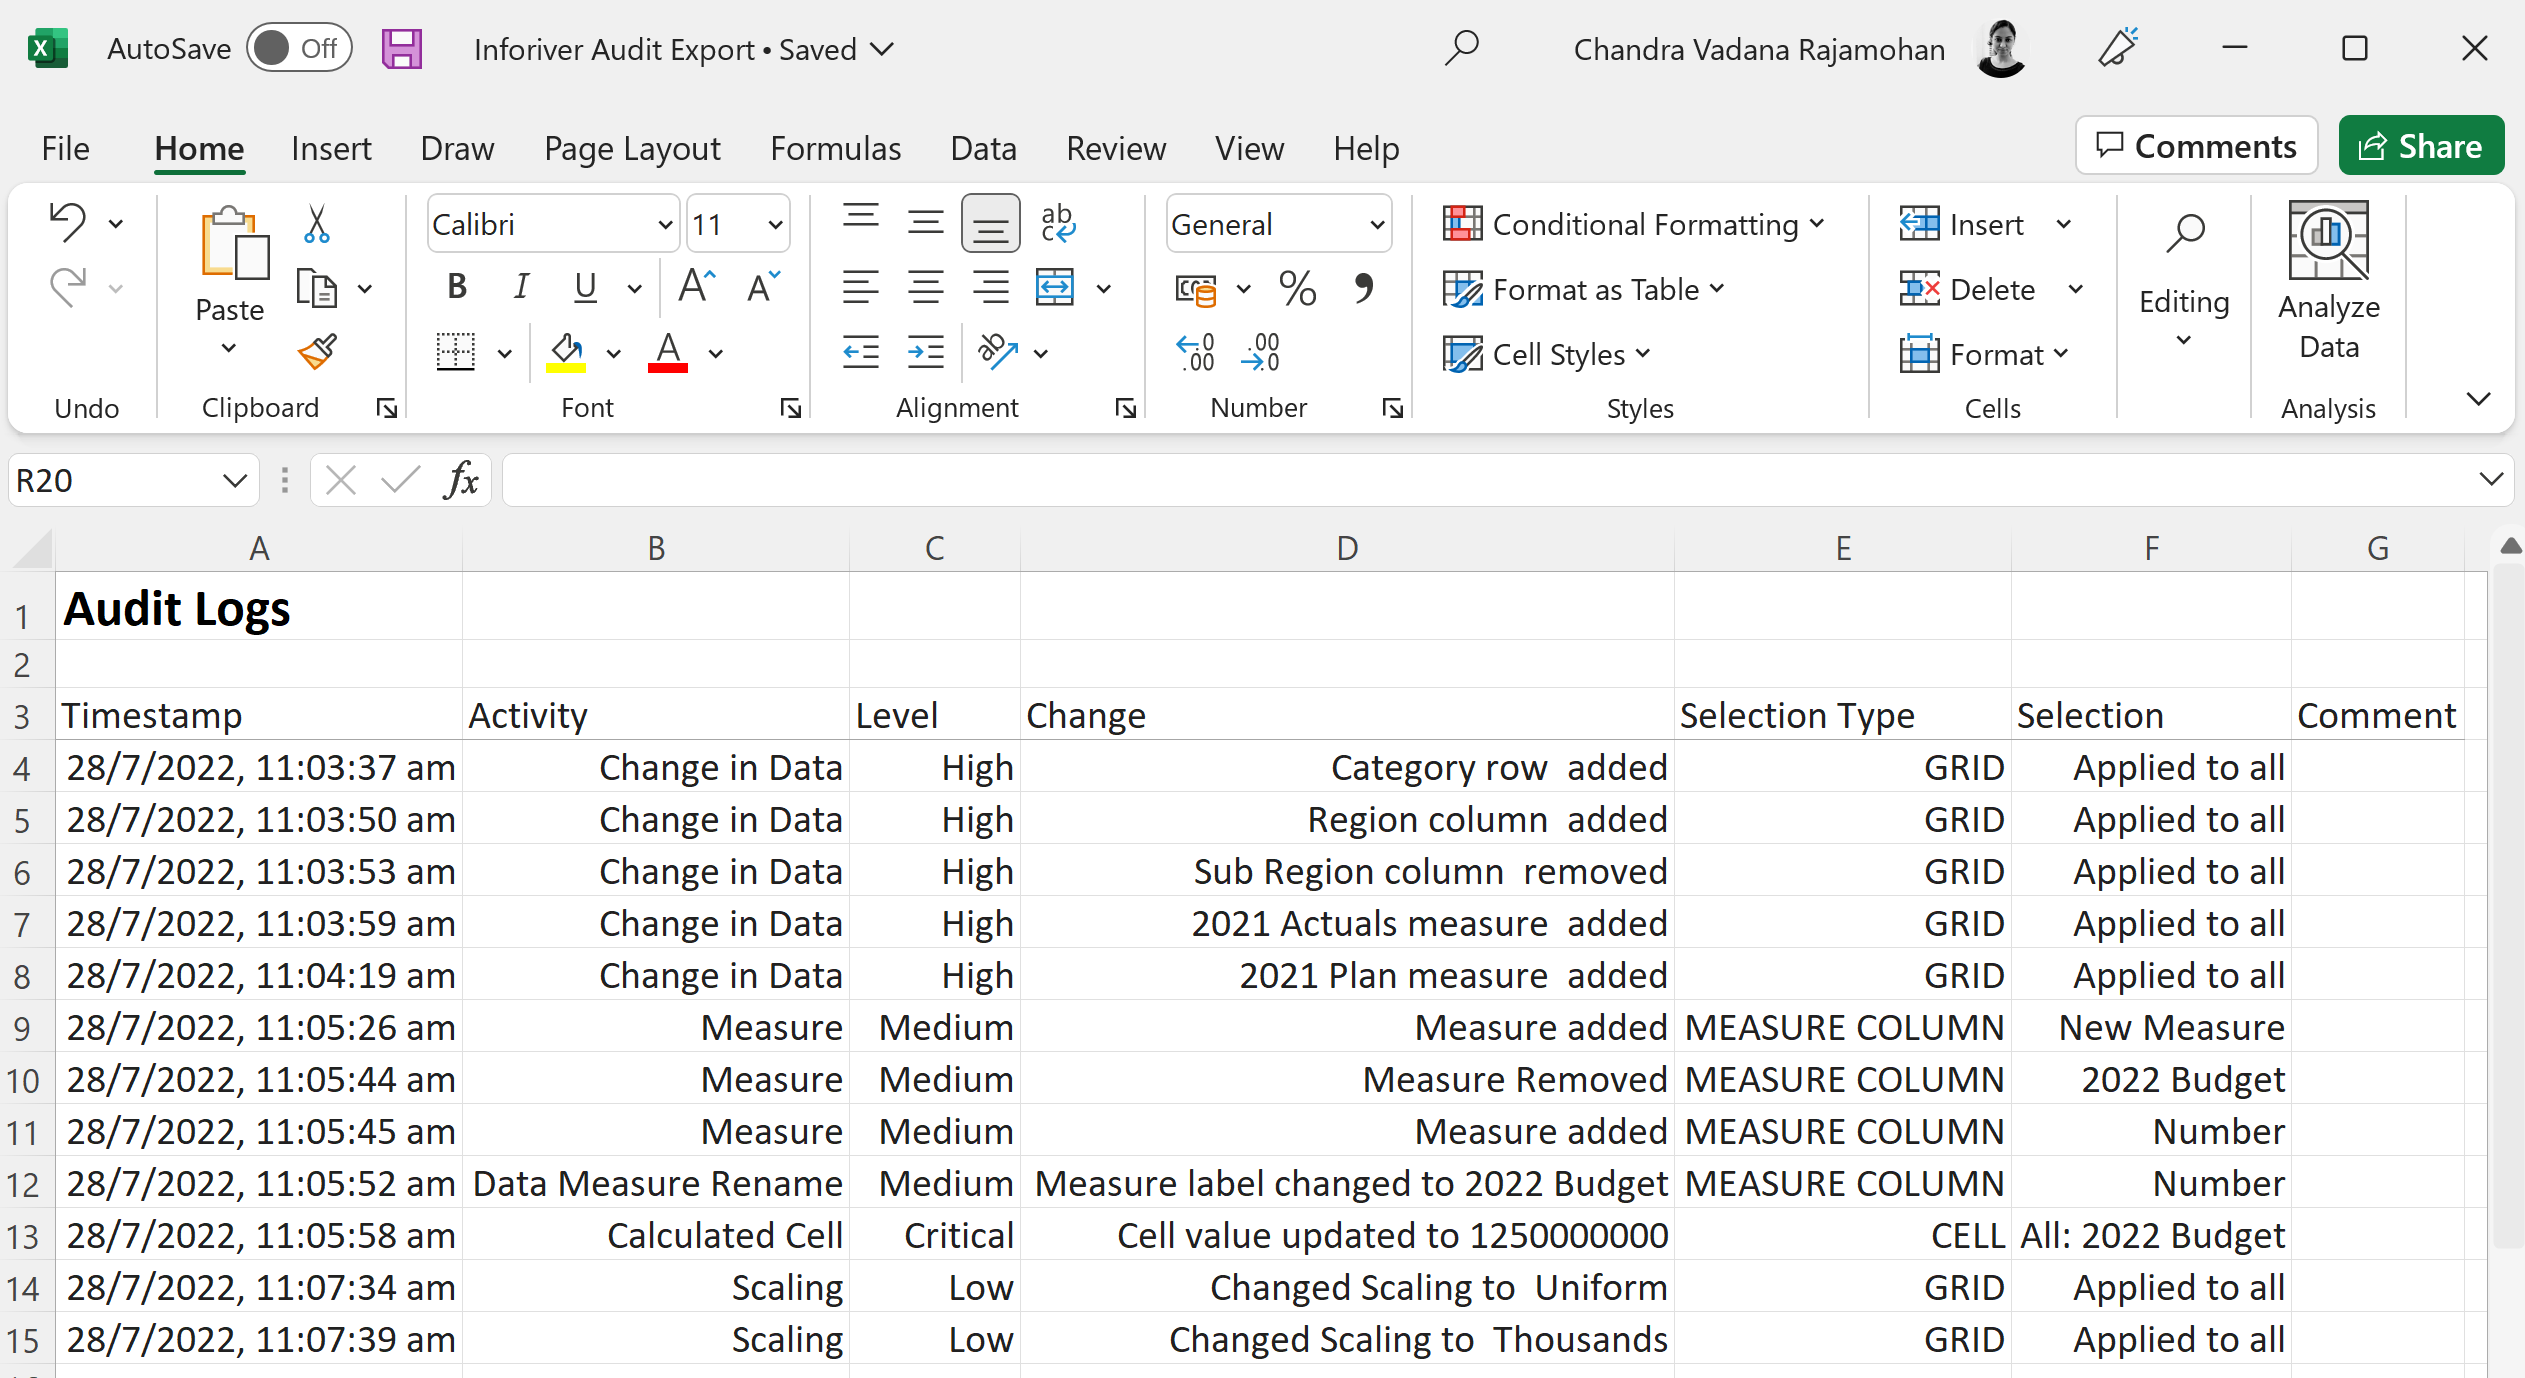
Track changes to your report using an interactive, filterable, exportable and comment-enabled audit log
Register here for a FREE 6-month exclusive access to Reporting Matrix