
Upcoming webinar on 'Inforiver Charts : The fastest way to deliver stories in Power BI', Aug 29th , Monday, 10.30 AM CST. Register Now
Upcoming webinar on 'Inforiver Charts : The fastest way to deliver stories in Power BI', Aug 29th , Monday, 10.30 AM CST. Register Now
Everyday business decision-making involves stakeholders asking a lot of ‘what-if’ questions.
For example, what if oil prices go up to a certain level? What if our suppliers increase their costs by 4%? What if our attrition increases by more than the permissible limit?
However, typical business intelligence and reporting tools fail to provide this very capability that decision-makers and analysts need most. As a result, users end up exporting report data to Excel to create their own models for offline analyses.
In Power BI, there are 5 ways in which you can do model & simulate outcomes for your ‘what-if’ questions. Let us look at them one by one.
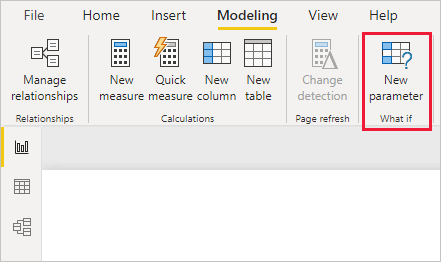
The most common and widely known method in Power BI to model outcomes is to use a what-if parameter. Under the modeling tab, you can create a new parameter...
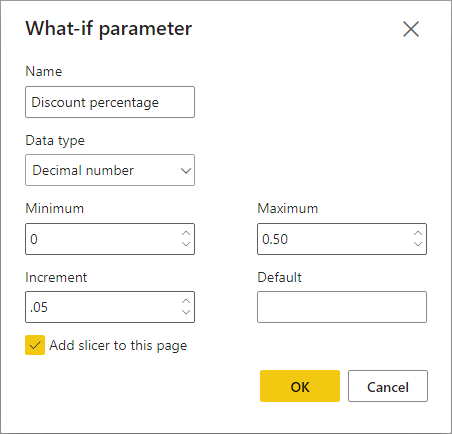
…and define the parameter variable as shown below.
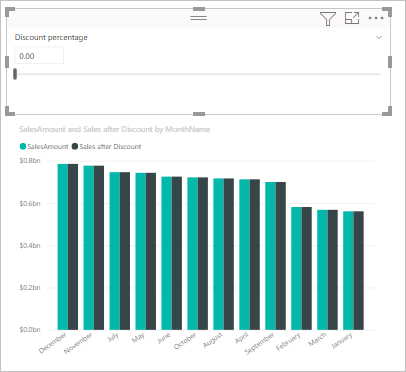
You then create a new DAX measure based on this input parameter – in this case, the outcome Sales after Discount is based on the parameter Discount Percentage that we just created.

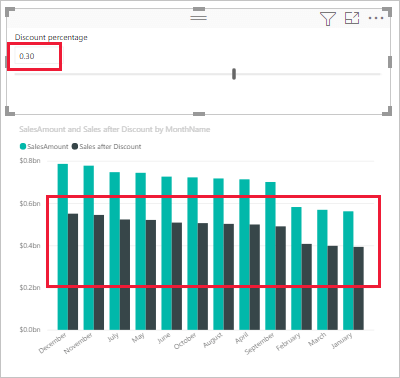
Finally, you use the slider to simulate the input parameter, which updates the outcome on the fly.
This approach is basic, and it suffers some limitations too – as explained in this Microsoft help article.
This method involves overwriting existing data in your report directly. However, Business Intelligence & Analytics tools typically do not provide this capability as there is no standard option to persist or write back data modified data.
With Inforiver, you receive the option to not only edit data directly – but also to write back to a database, or export the data to Excel/PDF files.
To simulate outcomes in Inforiver by editing data, you select a specific cell…

…and start typing in a new value. Just as with Excel, a cell editor shows up just over the value.
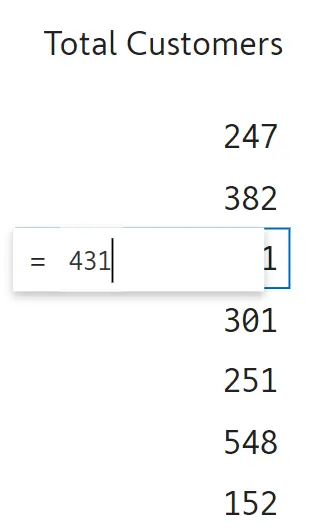
Type in the new value and press enter to update the value and table totals automatically. There is also an edit icon that appears next to the value indicating that the cell has been edited.
An alternate method to achieve the same outcome is to double click a specific cell. This opens a formula bar at the top where you can make similar adjustments.
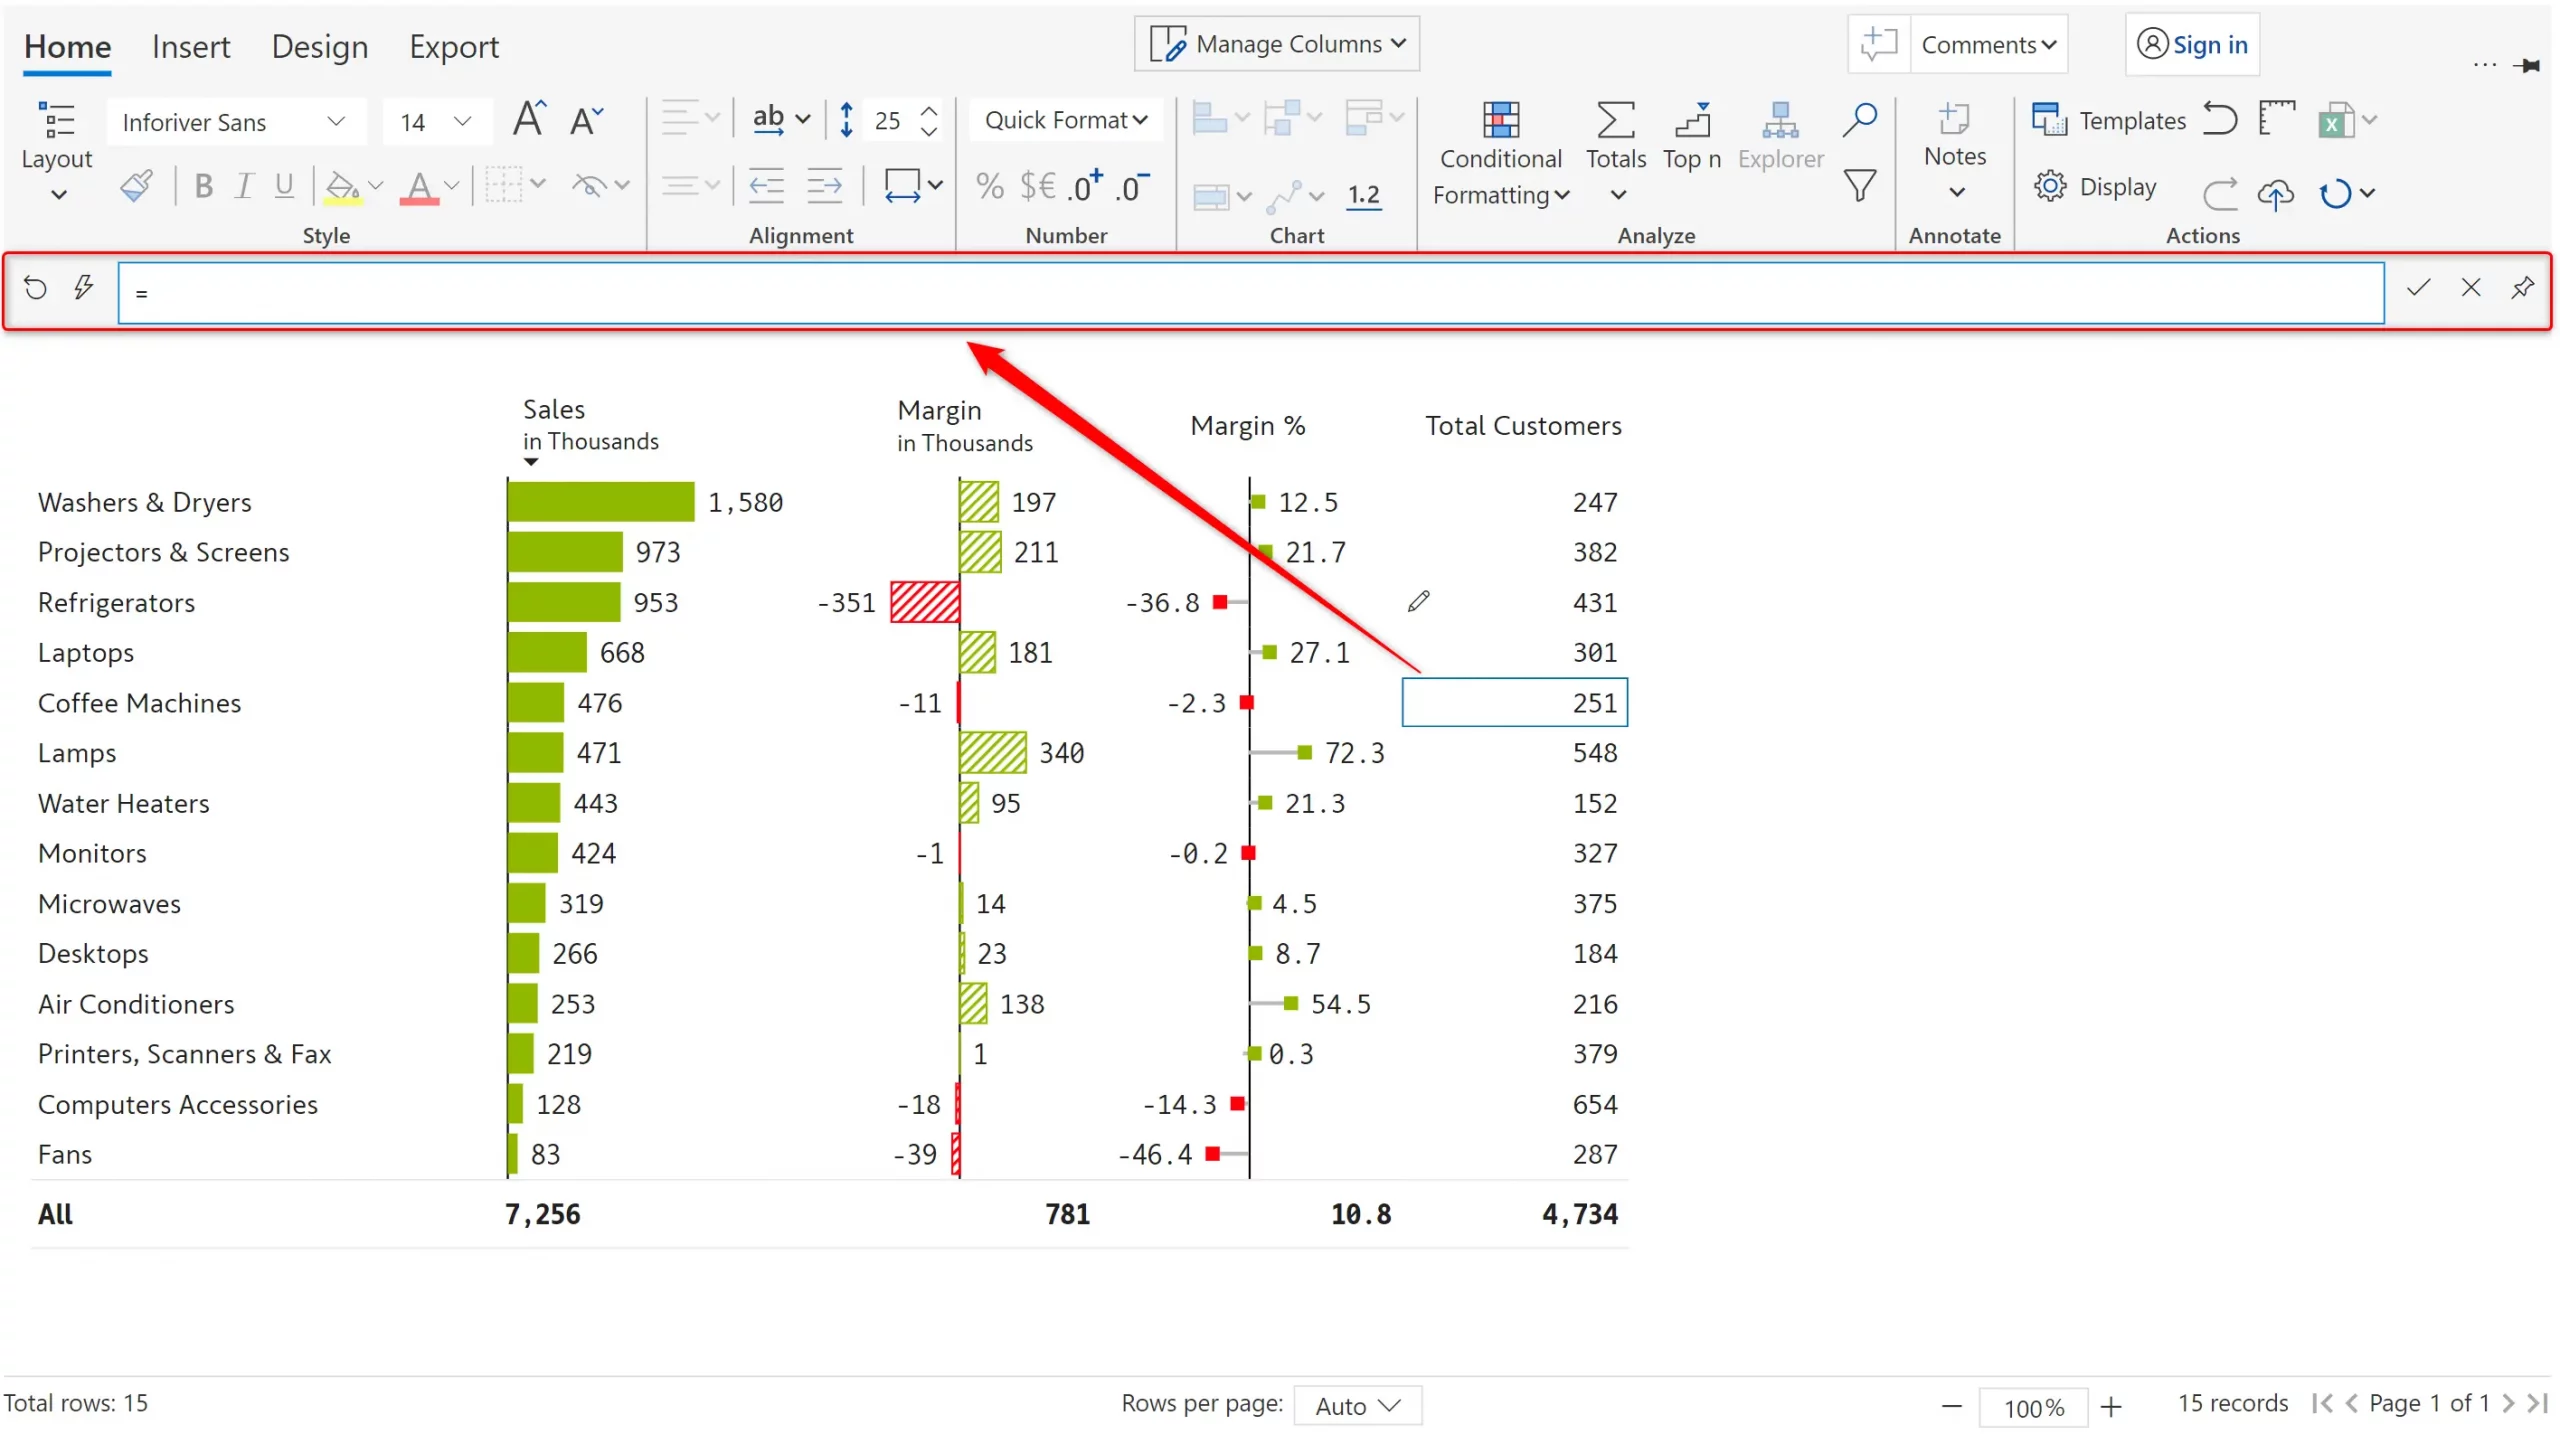
Inforiver also allows you to use expressions with scaled values (e.g., 11250 + 0.5k) and percentages (e.g., 11250 + 10%). You can use this in both the in-cell editor and the formula bar.
You can update even cells/columns that display charts/graphs using the above method. After the update, the charts or graph renders again based on the updated value.
This approach is useful in many practical situations. E.g., a sales manager can update the forecasts directly during the weekly team meeting. He doesn't need to record it separately outside the weekly sales Power BI report (i.e., an Excel file).
A key benefit of this approach is that you need not use any DAX formula to create the projections.
Another method to create projections in Power BI is to use the intuitive simulation capability offered by Inforiver. Compared to the previous method, this approach has the benefit of automatically tracking variances for each record.
To use this feature, select the Sales field and click on the ‘Simulate’ icon in the menu. This creates a simulation output field based on the input field (Sales, in this case).
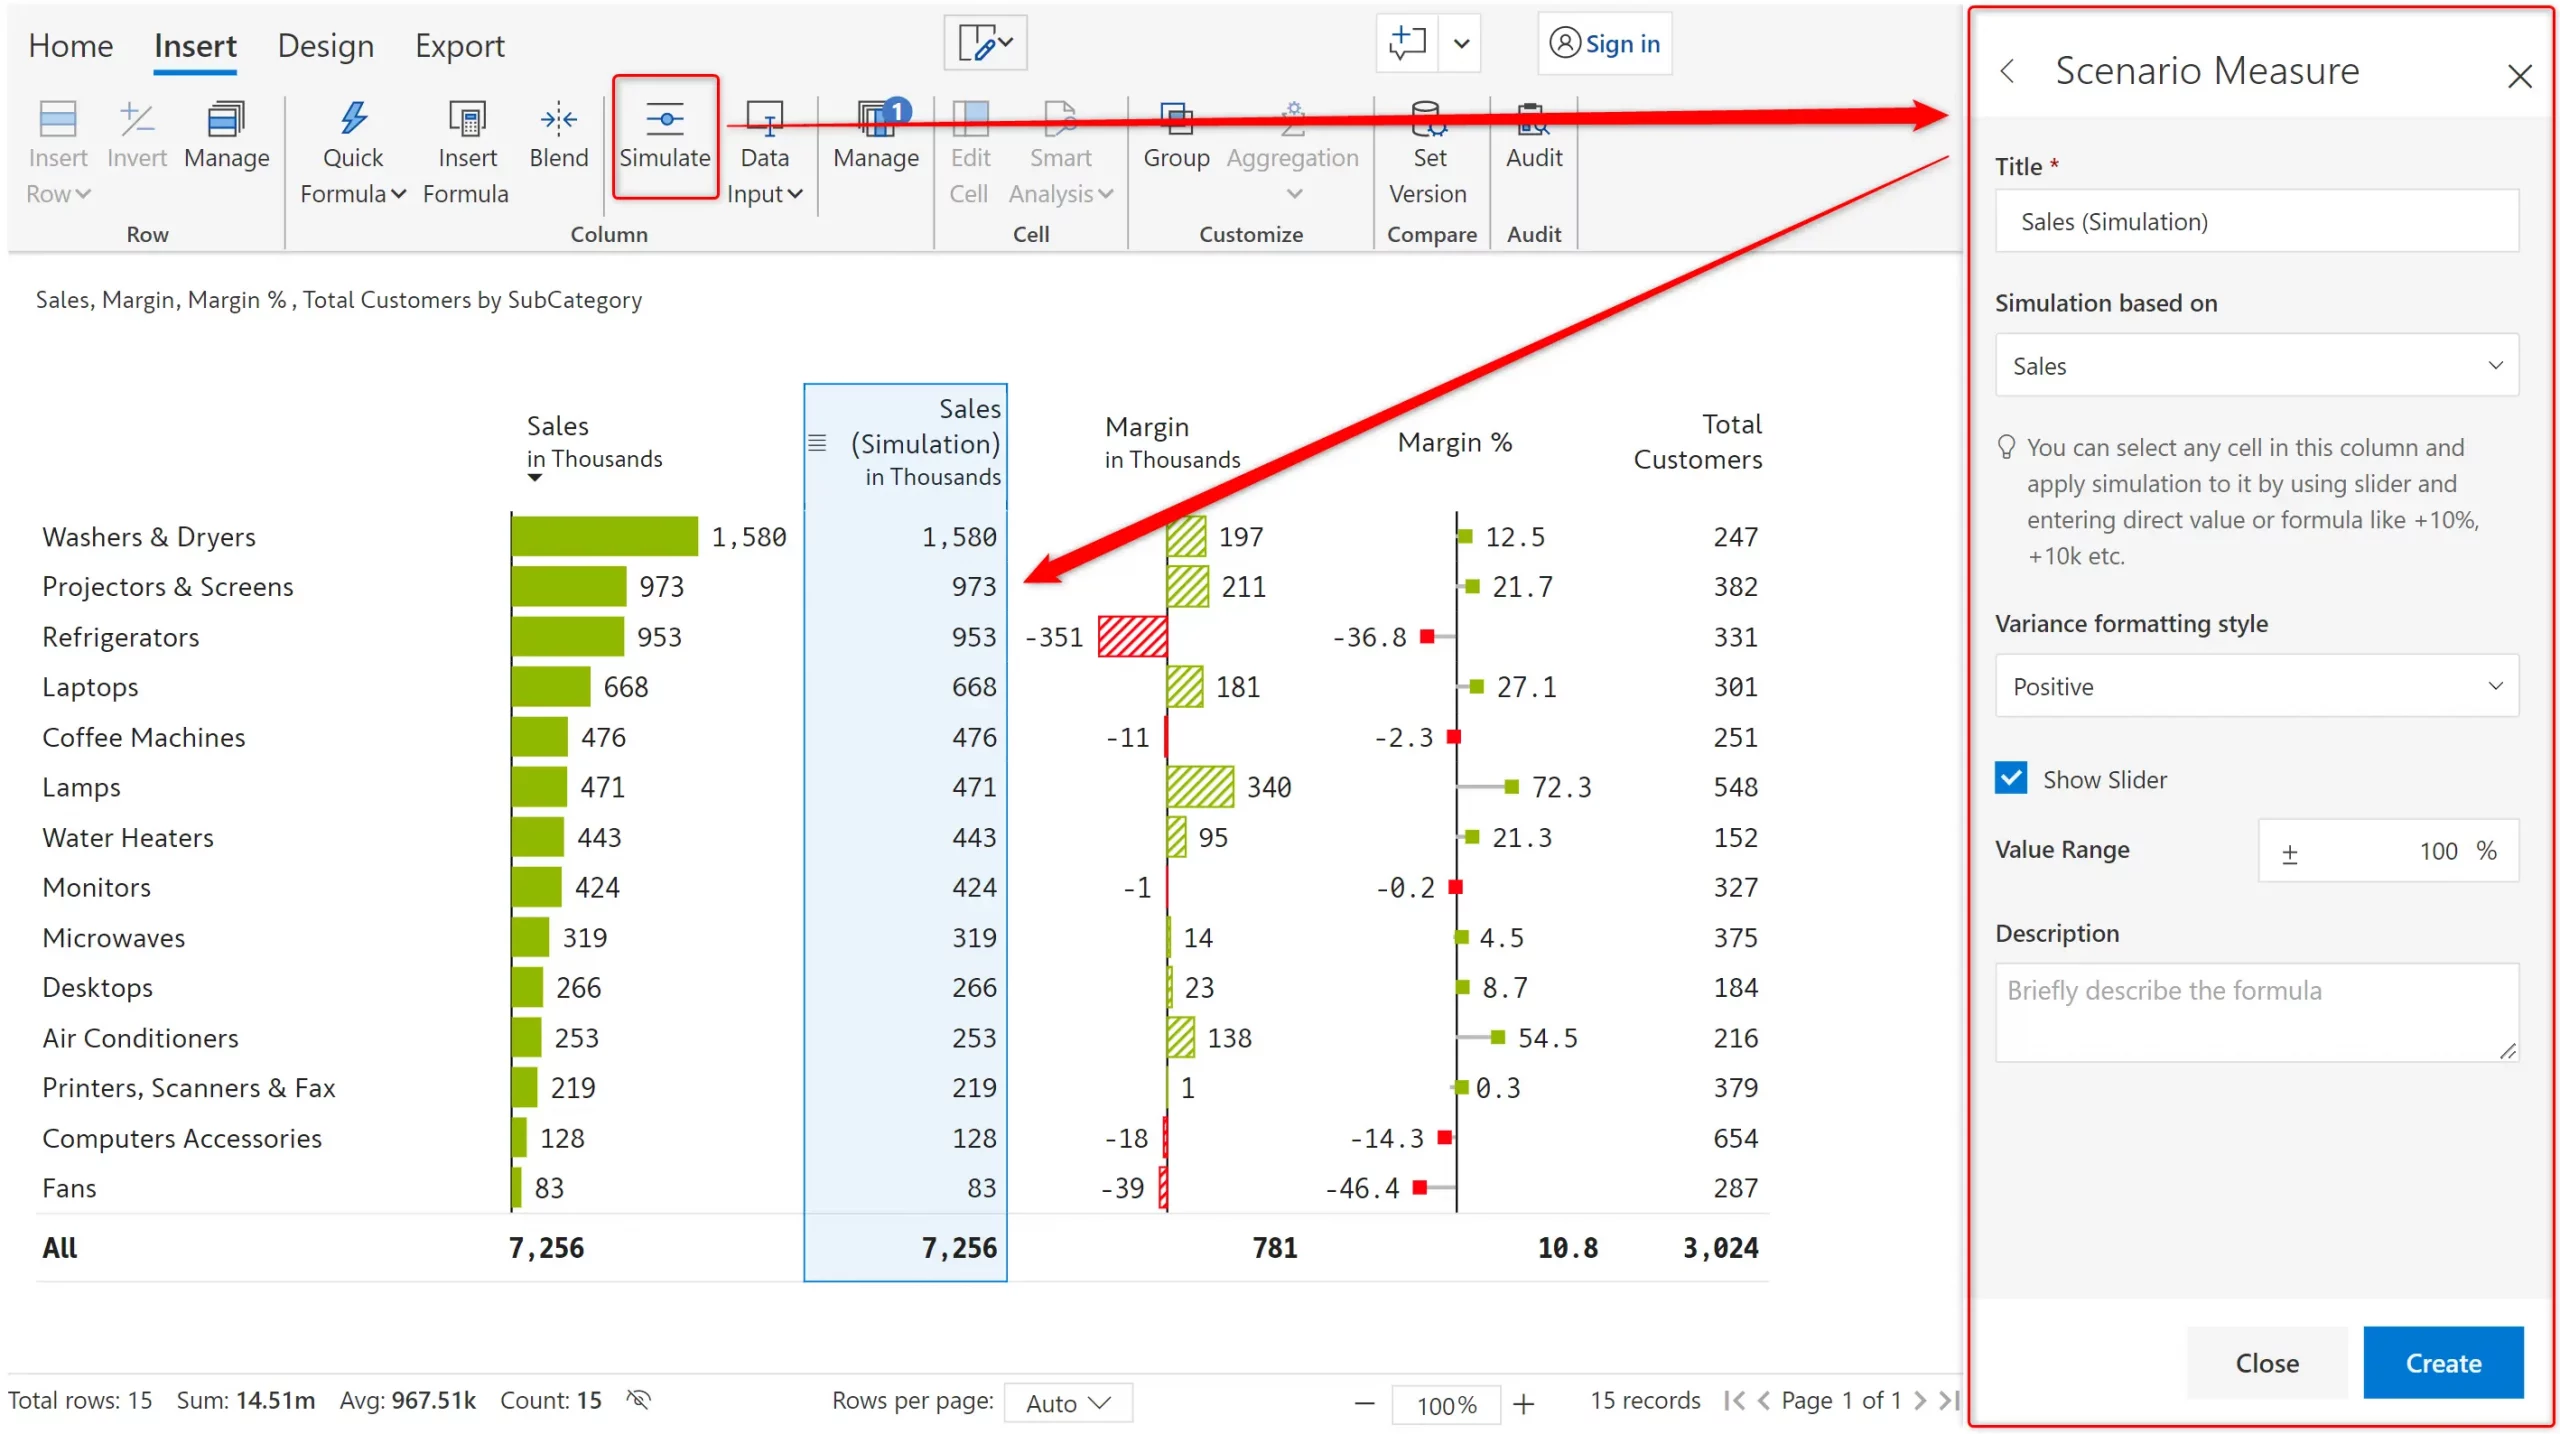
Once the field has been created, you can click on any cell in this new simulation-enabled field. This will display a small slider icon next to it.
Hovering over this icon reveals a slider.
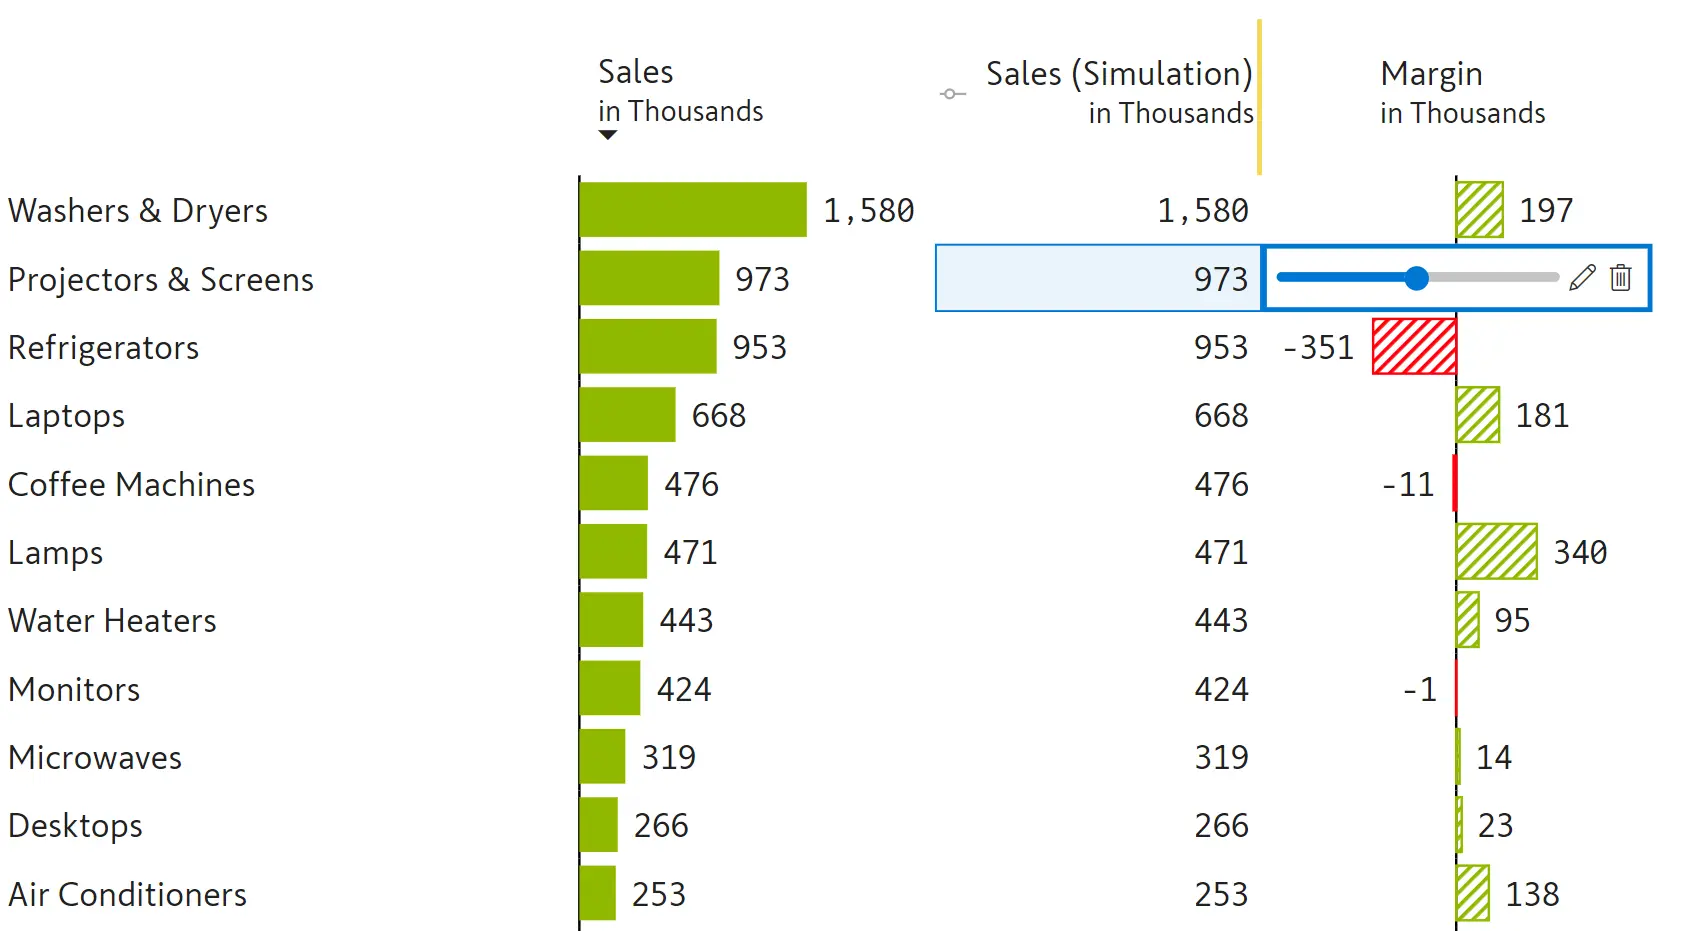
Clicking and dragging the slider changes the value in the cell. It also shows a percentage change as you keep moving the slider to the right or to the left.
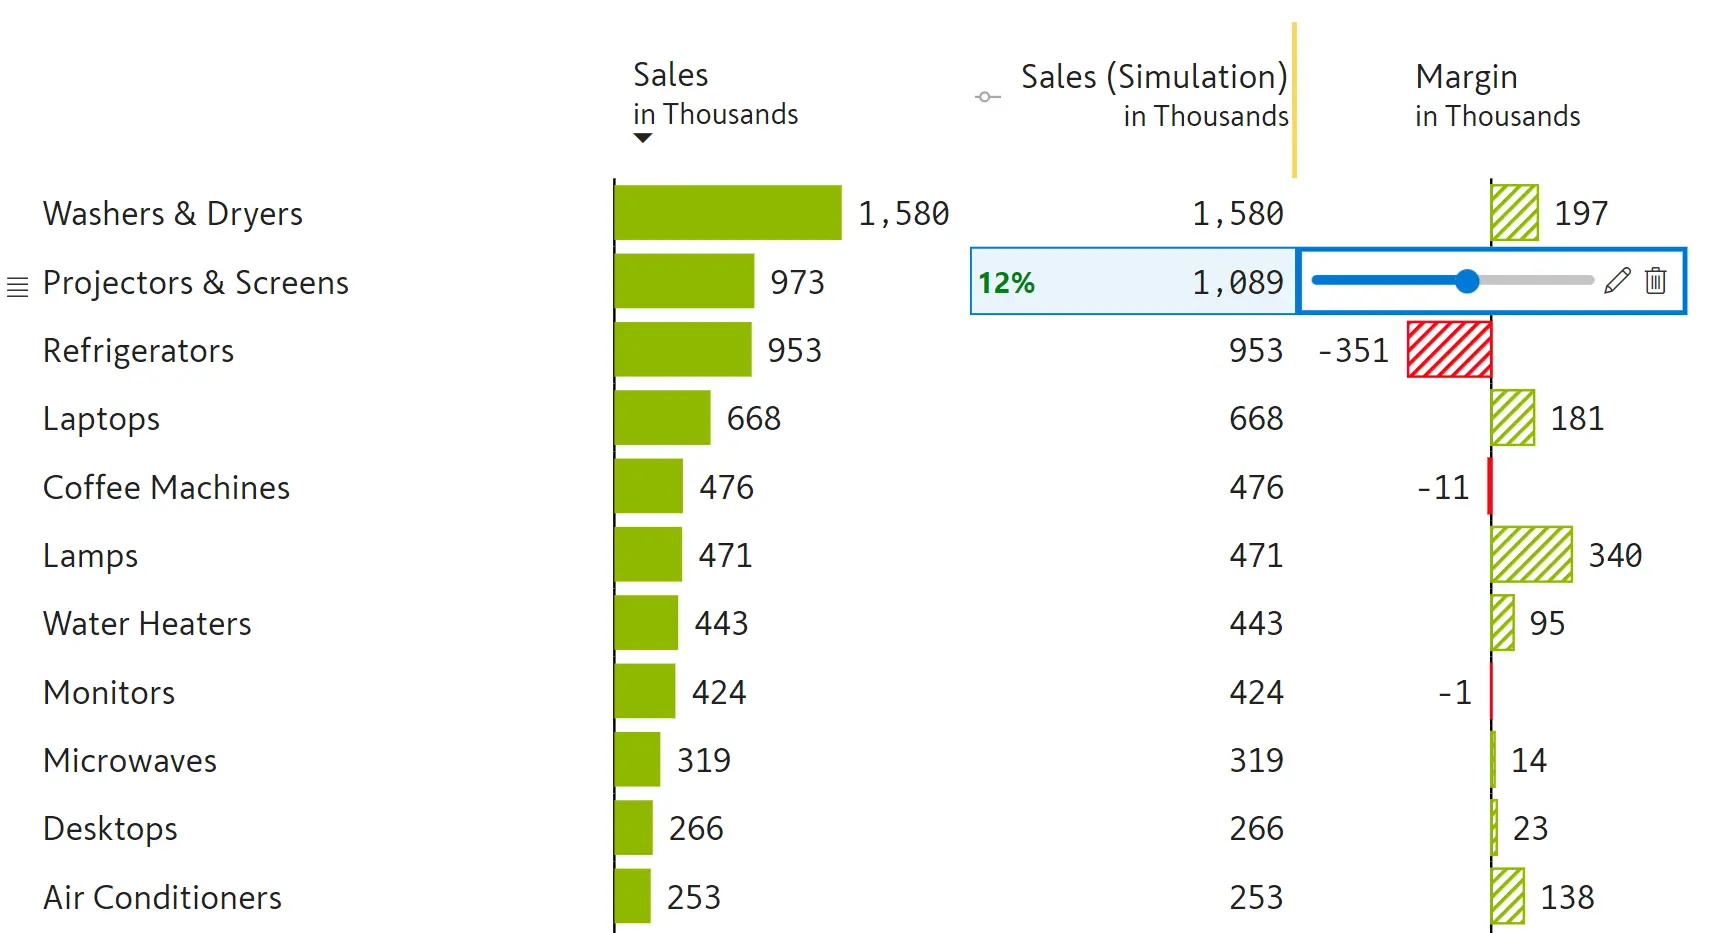
You can update the value & totals once you release the slider. In this example below, we have adjusted the Sales values for three records, which results in the overall sales decrease by 1%.

You can use the simulation slider to track the % variances. Unlike the previous method of editing data directly, using the simulation slider retains the older value as well. This is helpful when you want to use the original value for your calculations or just have it in your report for reference.
Another method to perform what-if simulations using Power BI is to use the ‘Data Input’ feature.
Using this option creates a measure that you can populate by manually entering data.
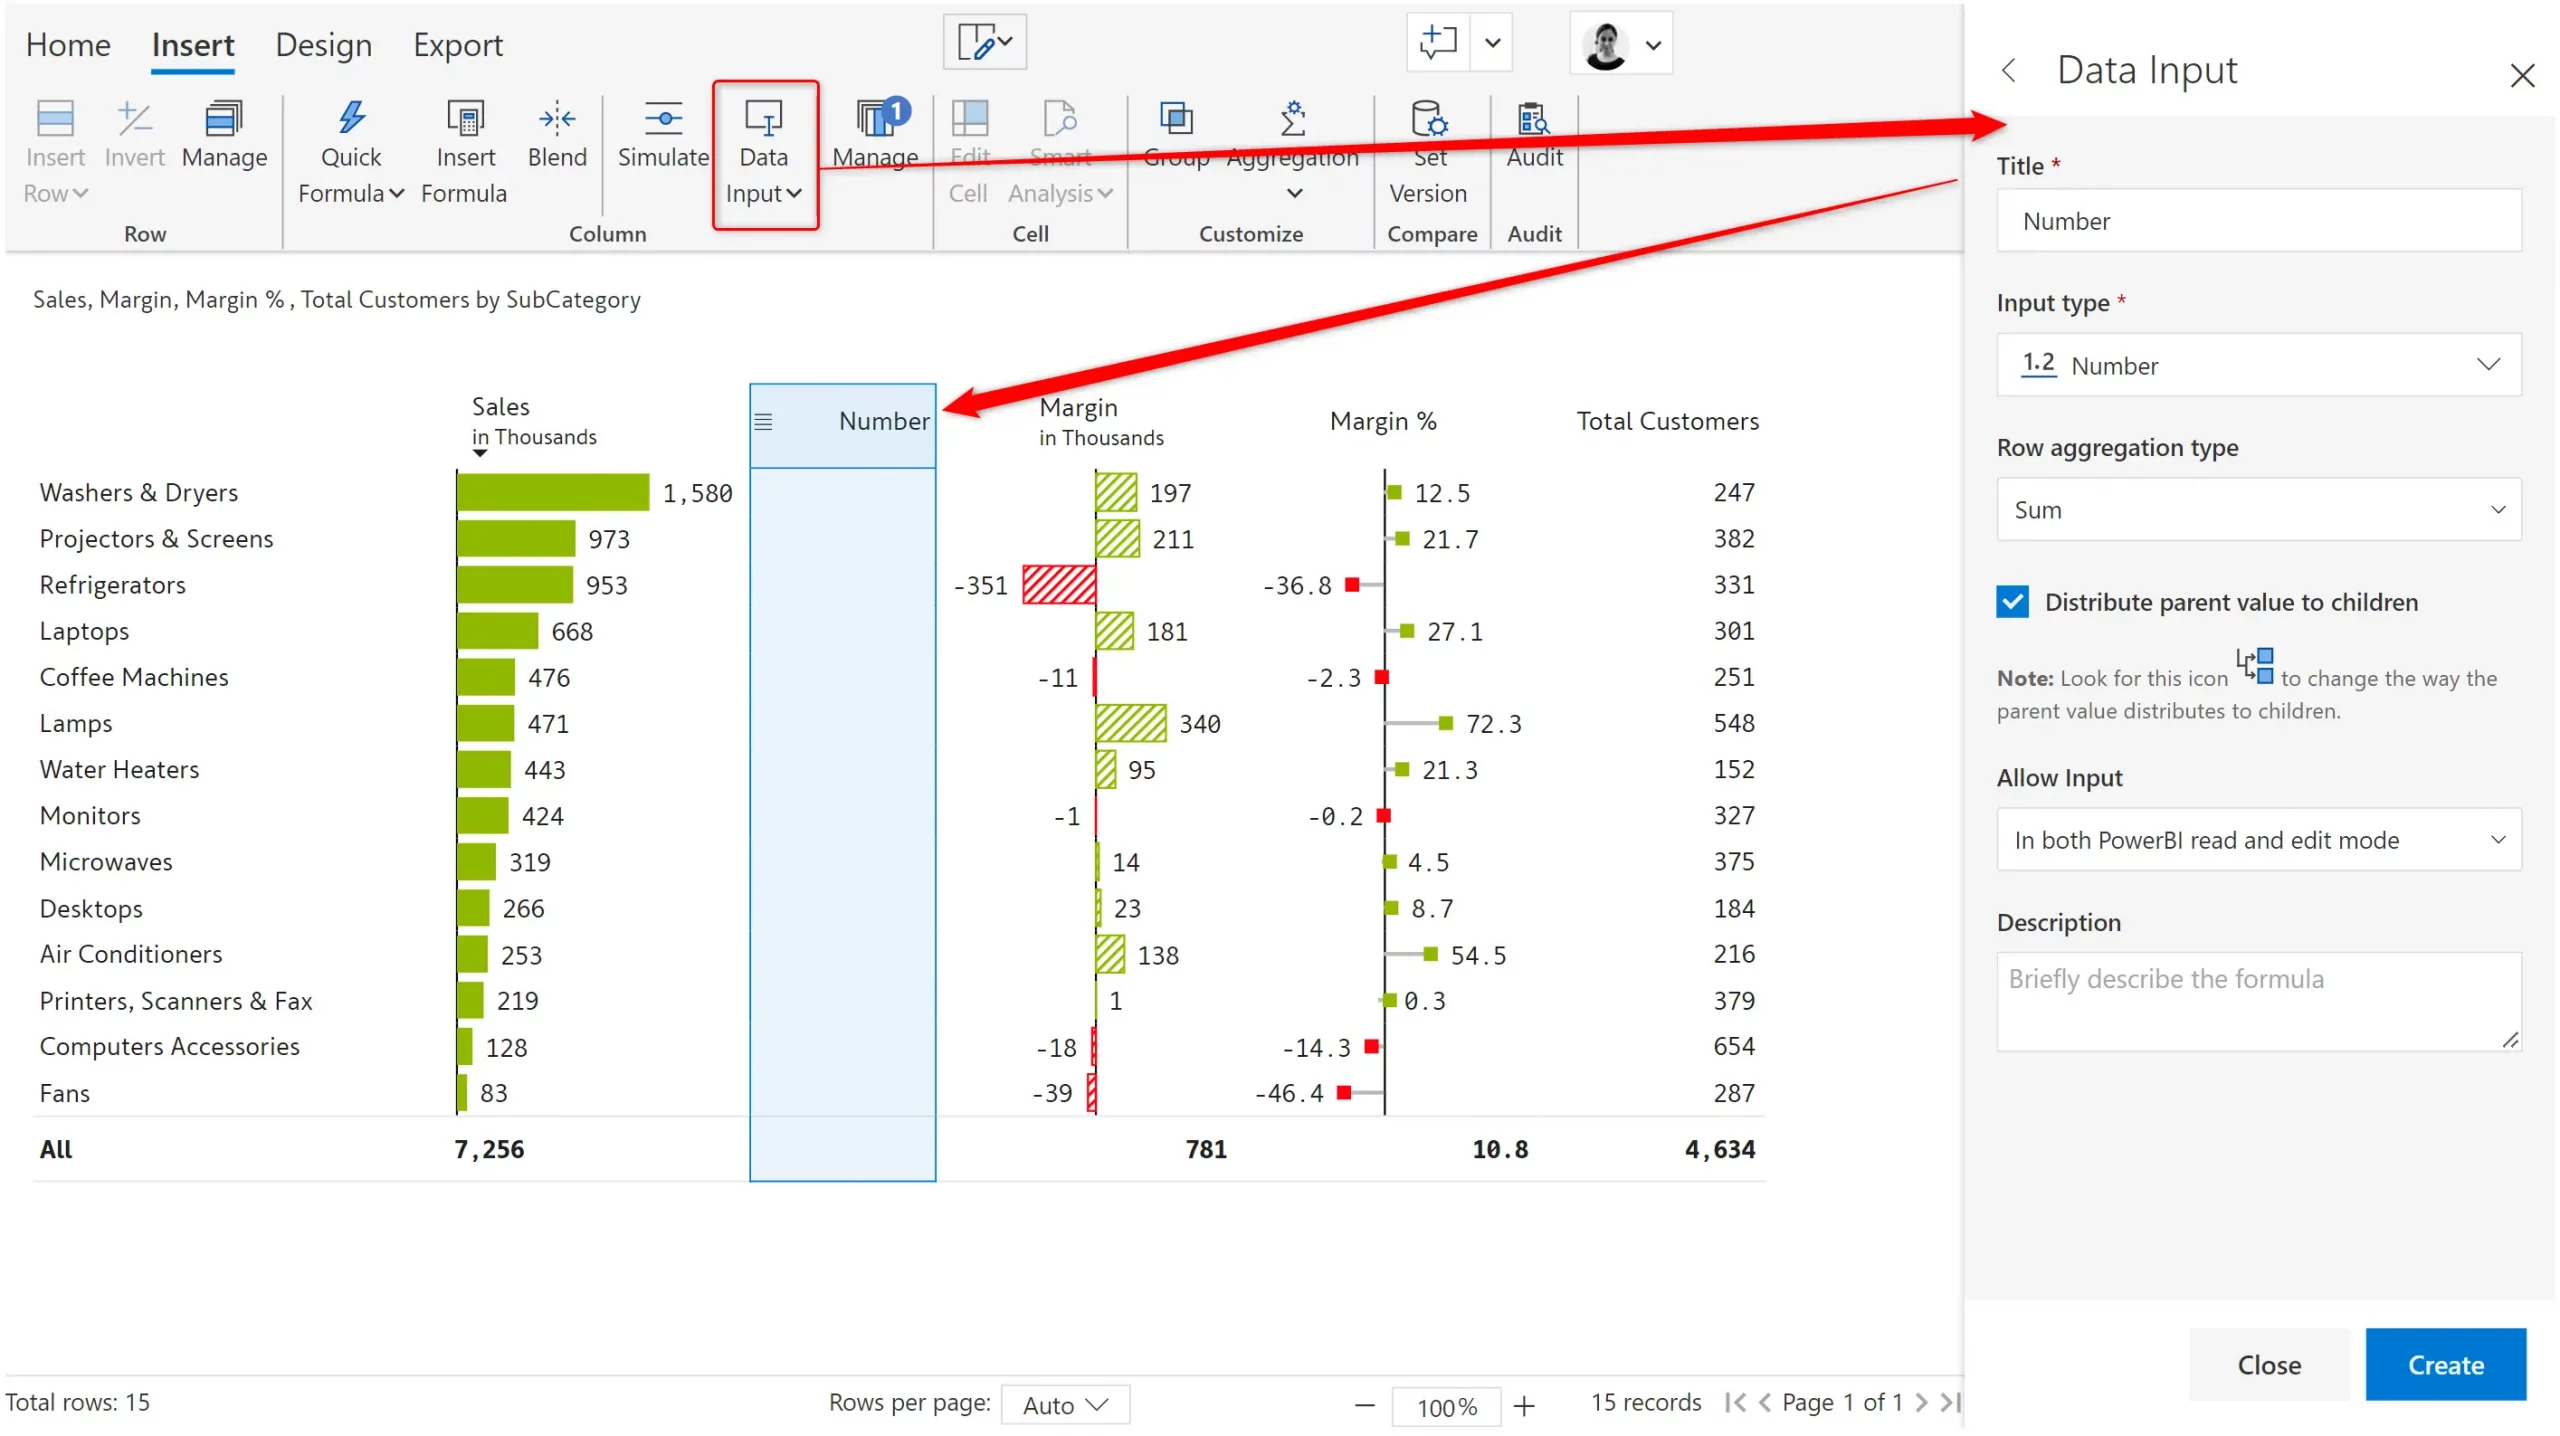
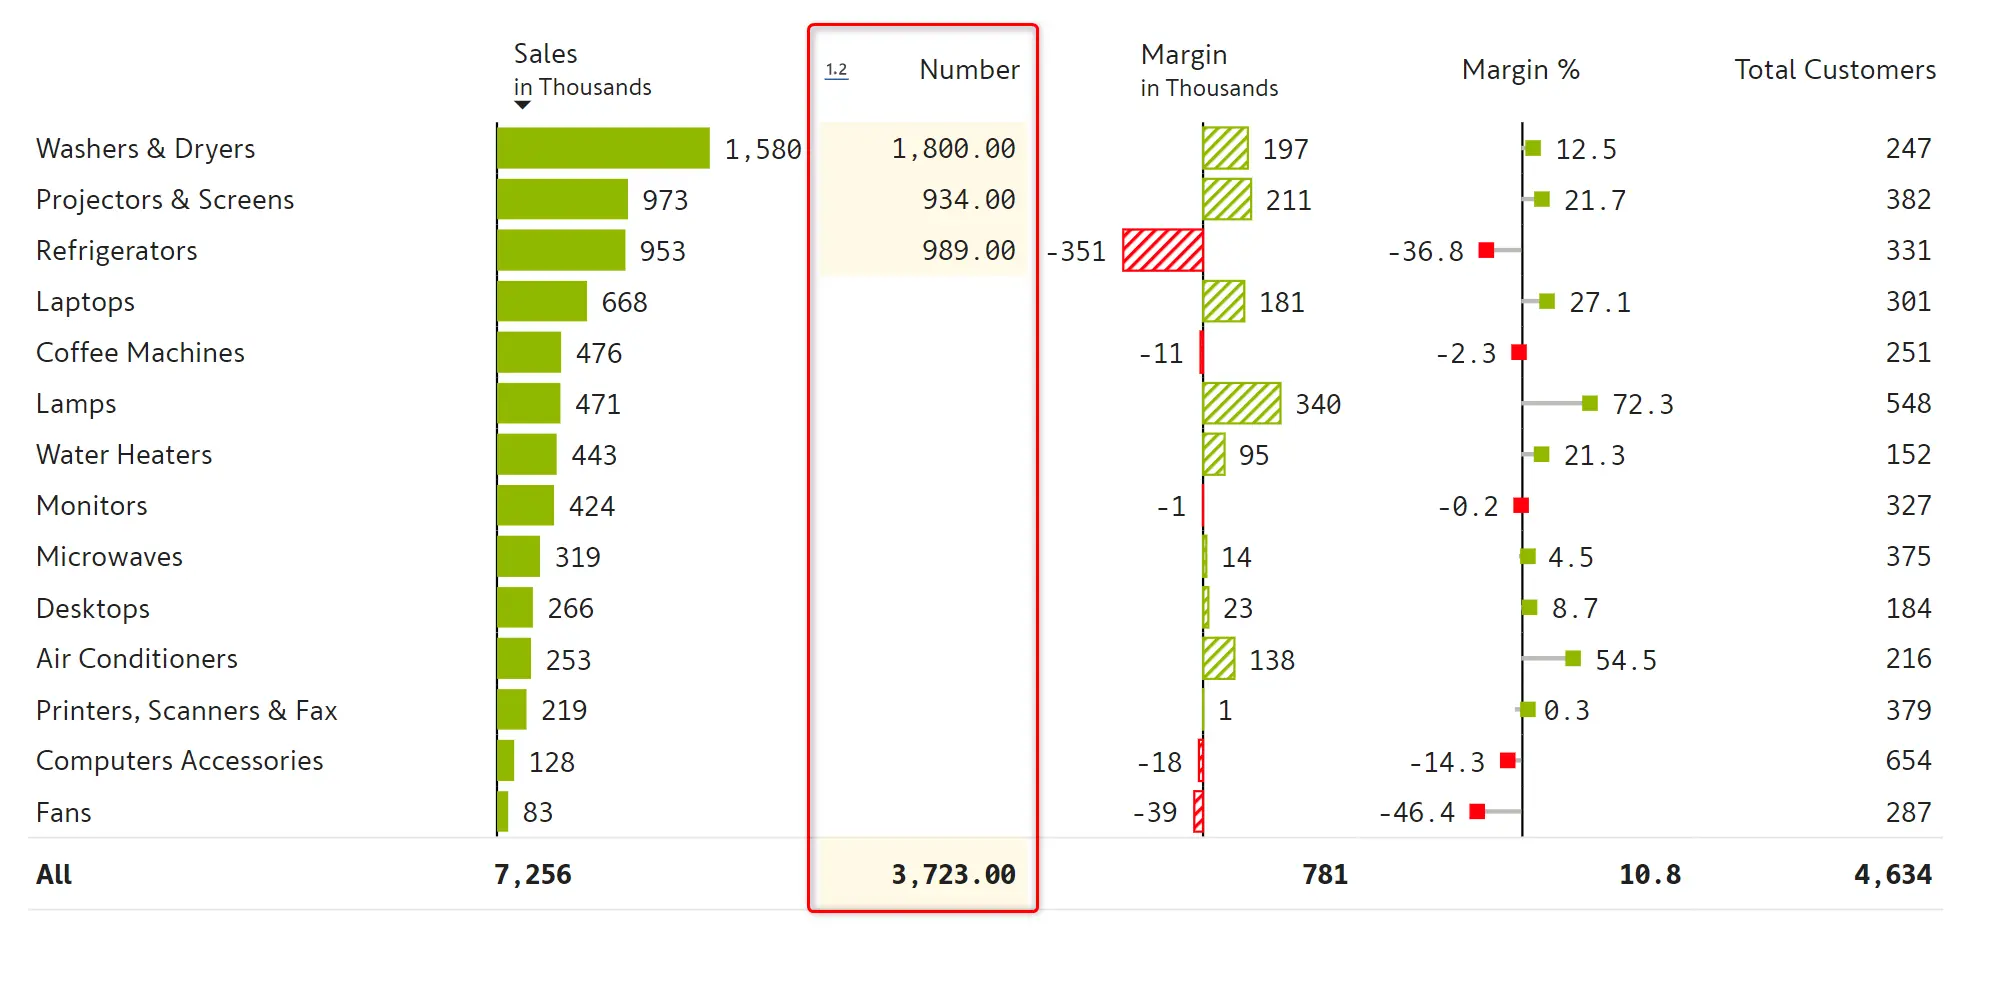
Once you create the field, you can start entering the values directly. Any change in values automatically updates the total.
But why would you need this option when you already have methods #2 and #3?
Well, there are scenarios where you need to key in data that is independent of other measures in your model (e.g., GDP or population by country). You may then use this measure to calculate derivative KPIs (e.g., sales per million population). You can view this in additional columns in your report.
Another great advantage of using manual input is the ability to have the field behave like a measure that supports both bottom-up aggregation as well as top-down distribution (bidirectional behavior). Given its transformational ability which is not found in any other tools such as Tableau, Spotfire or MicroStrategy – it deserves a closer look. It is handled separately in the next section below – bidirectional simulations.
In many real-world scenarios, business forecasts or projections are done in a top-down manner. For example, a company decides to improve sales by 10%, and then tries to figure out how each region or product category should contribute to this growth.
However, when you think about it - even Excel doesn't support this realistic approach (and this is even lacking in some planning tools). Inforiver supports this top-down approach using the same ‘manual input’ feature discussed above. (In the previous example, we only looked at how changing a sale projection for a specific category updated sales projection for the overall company. This is the bottom-up approach)
Let’s look at the report below for an example. It captures 2021 sales for categories and subcategories by month. Note that the company did close to 1.15 billion in sales in that year.
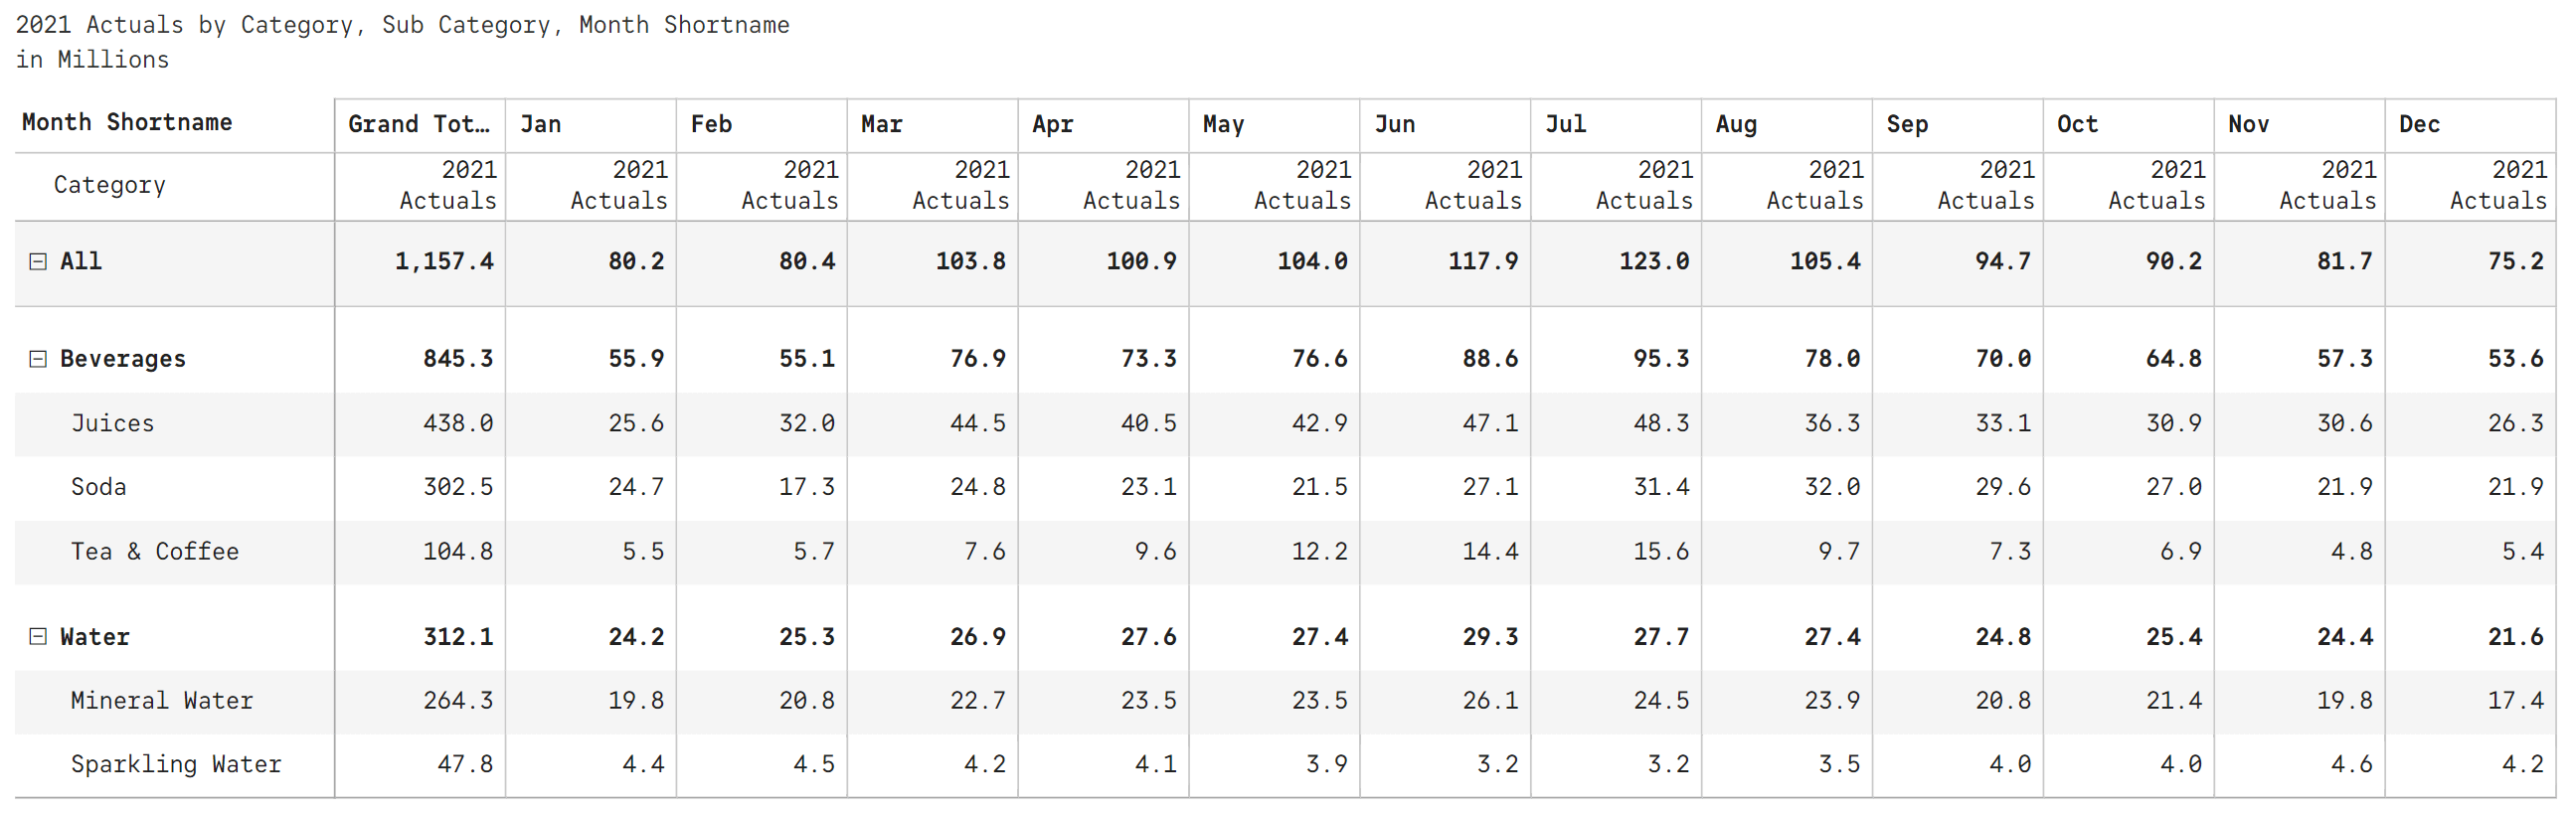
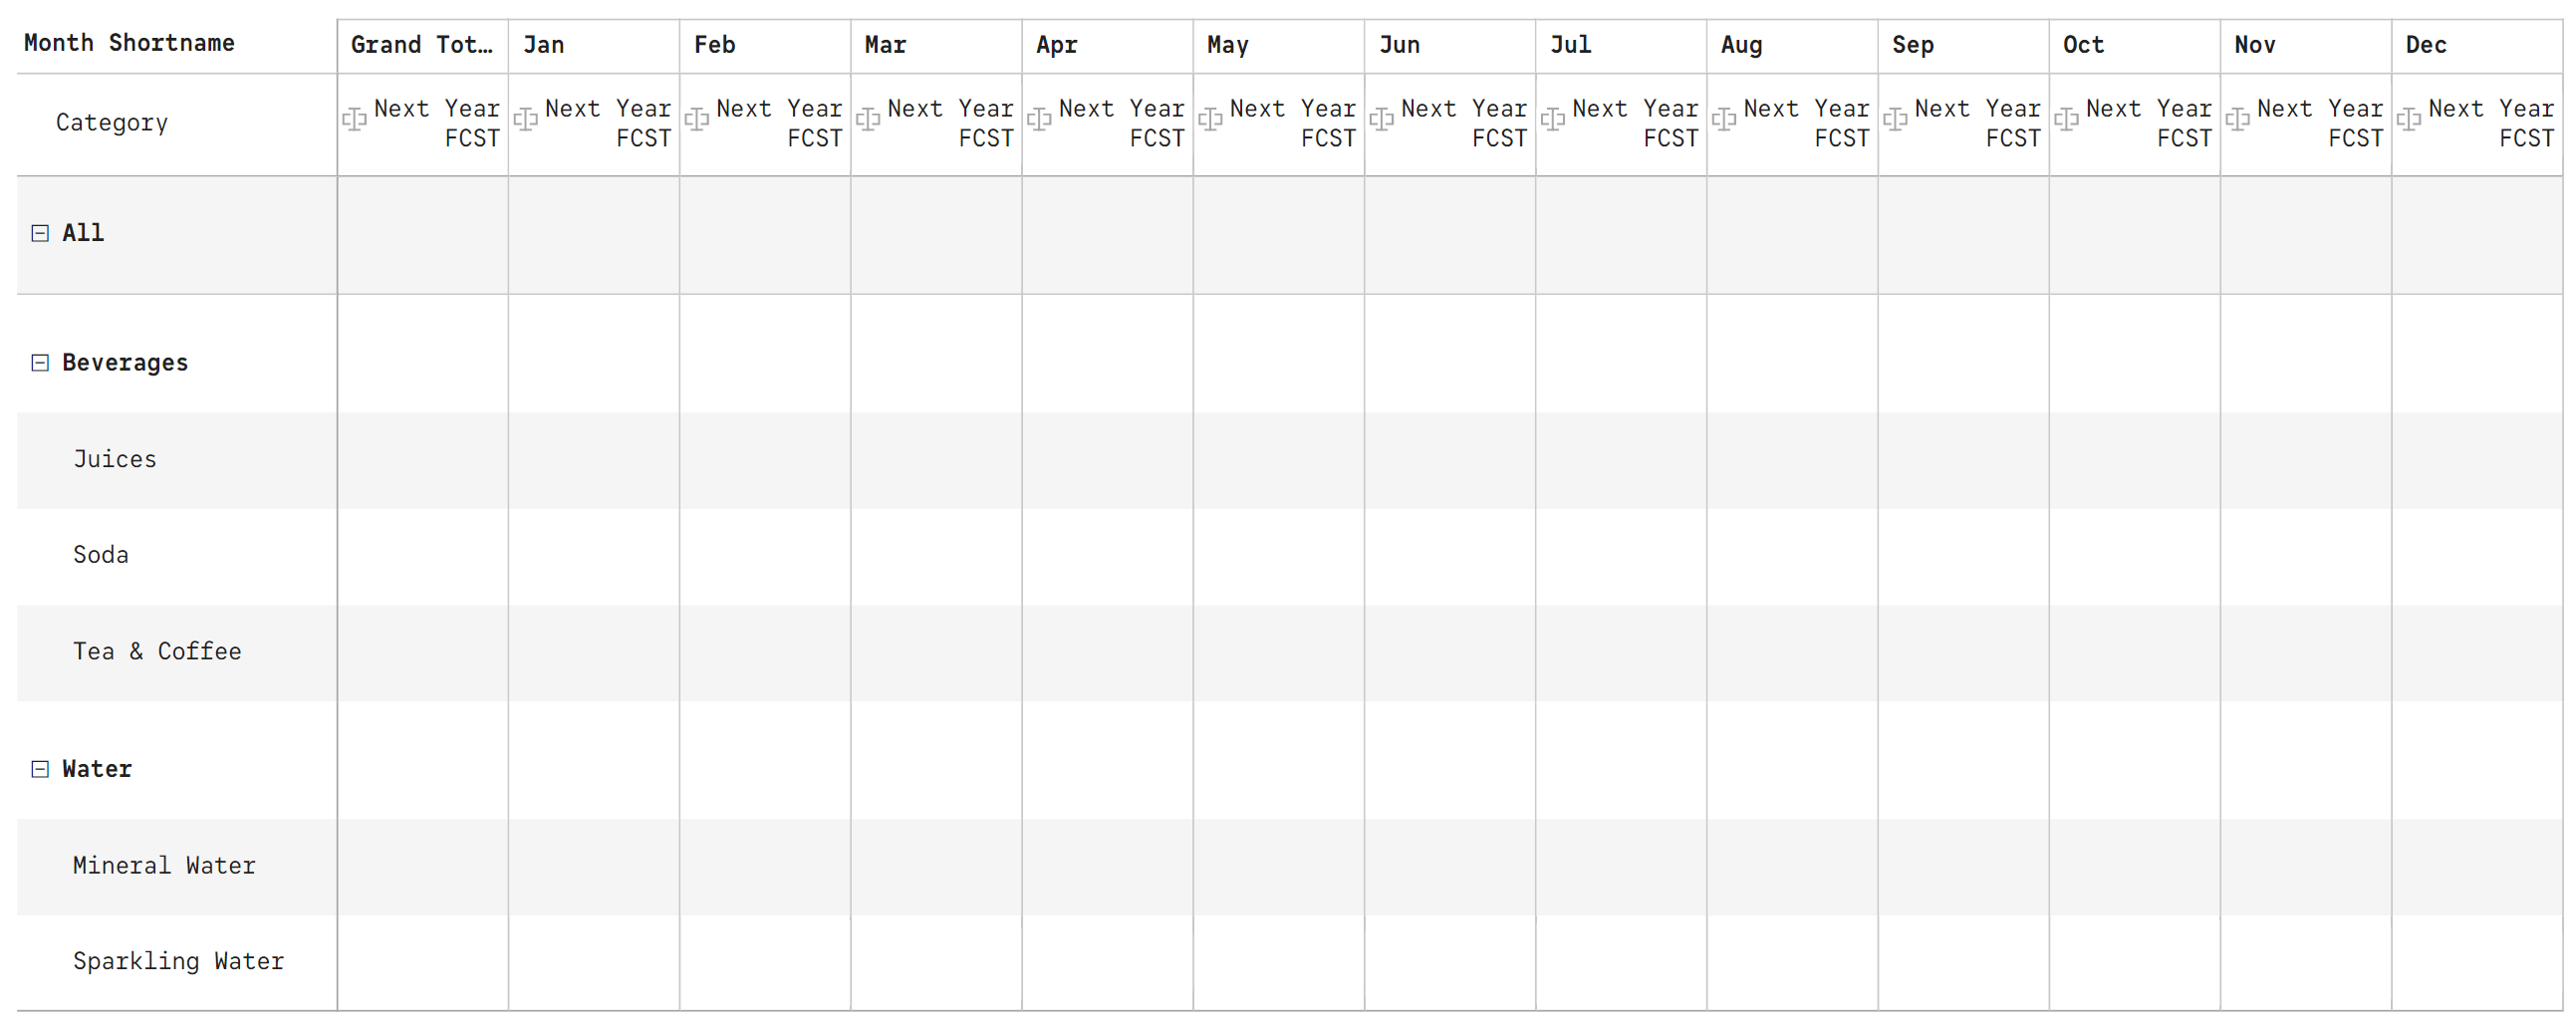
We now need to create projections for the next year, 2022. A quick way to get started is to create a manual input field (as outlined in section #4) under the name Next Year FCST. We then hide the original measure tracking 2021 sales within Inforiver. We then end up with a blank template with only Next Year FCST as follows.
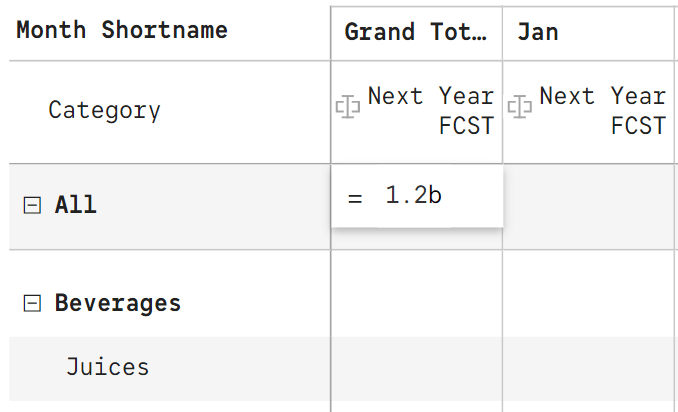
Let’s assume the company wants to achieve 1.2 billion in sales next year. Type in 1.2b under the row All and the column Grand Total …
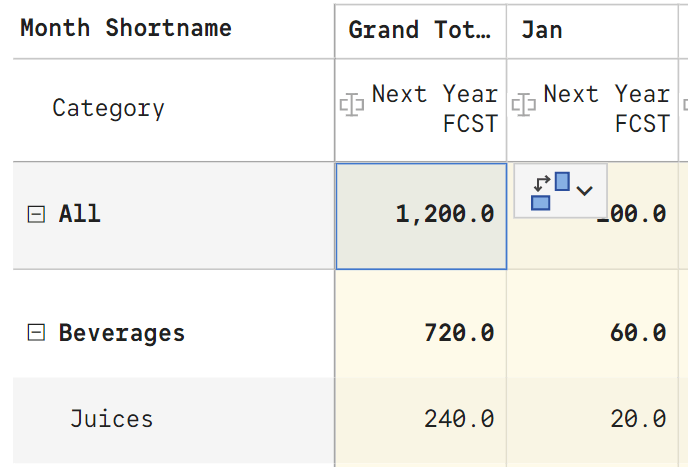
… and press enter. The amount gets equally distributed across months and subcategories. Note that the table is still scaled in millions. Hence, the 1.2b shows up as 1200.

But this equal distribution is not realistic. If we had seasonal revenue in 2021, we expect the next year to follow the same trend. Similarly, the sales by category and subcategory also need to be in similar proportions as previous year.
In essence, we need the distribution to follow the pattern of 2021 Actuals.
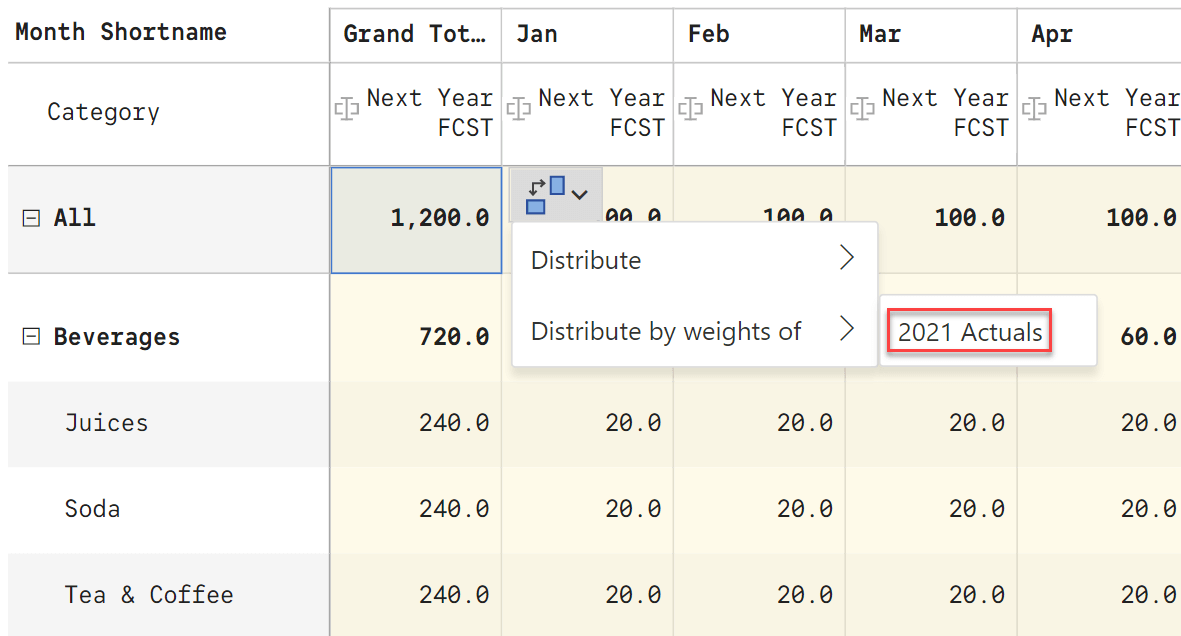
We now select the total value of 1.2b. This enables a small context menu next to it.
Clicking on the context icon that appears next to the cell reveals a menu. Select ‘2021 Actuals’ – the weights of which we would like to use to redistribute the 1.2b across categories and months.
The values are now redistributed based on the 2021 actuals weights.

From here you can proceed to make finer adjustments. For example, decrease Water’s budget by 20%...
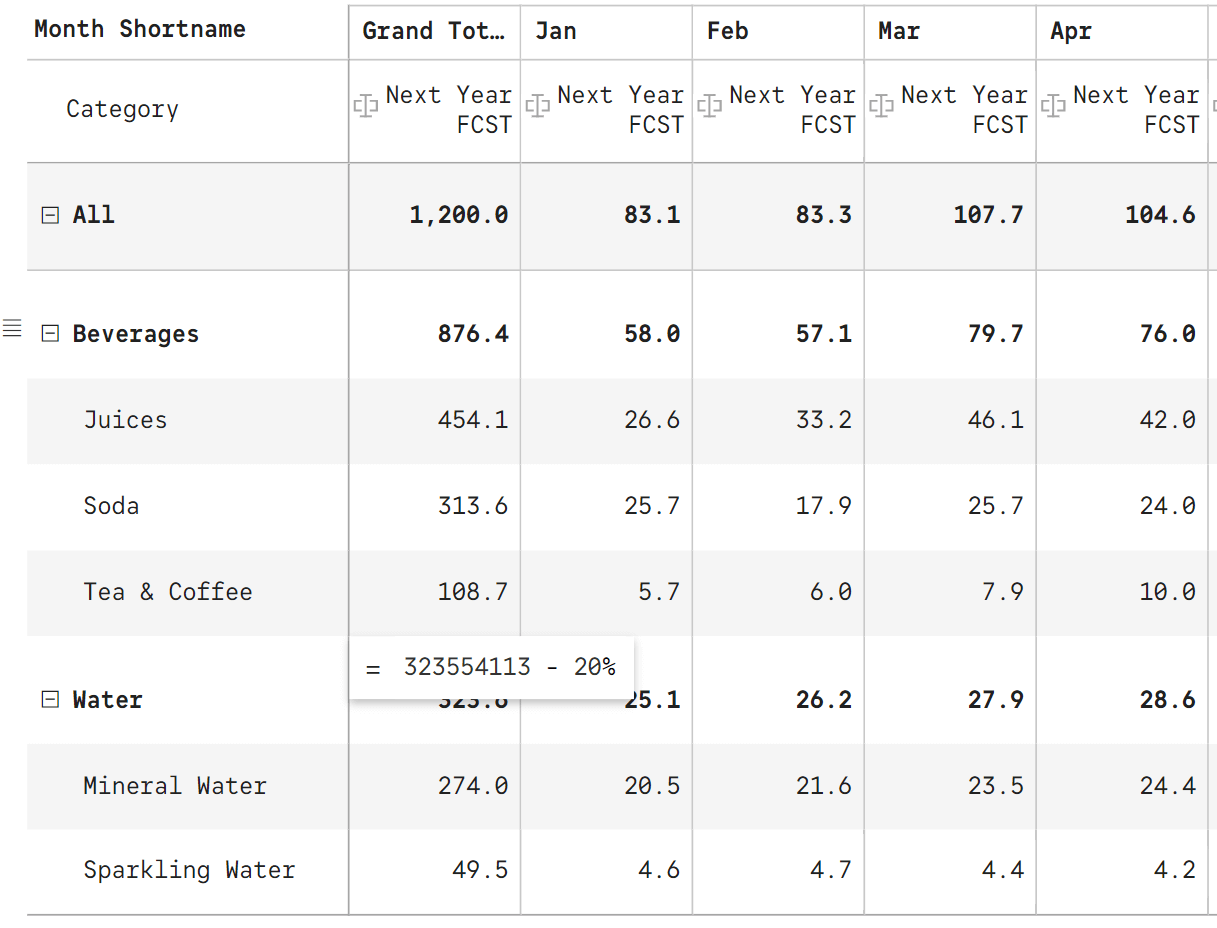
…which updates the projections for the overall company as well as its subcategories Mineral Water and Sparkling Water.

Similarly, increasing the projections for beverages in April by 20M reflects in the overall company sales for April, and it also breaks down the beverages category projection across its descendants – Juices, Soda and Tea & Coffee.

Note that in both the last two modifications, we updated both the ancestors (totals and grand total) and the descendants (all the way till the leaf node/rows). In essence, the Manual Input can create a measure that is self-balancing. This approach offers the fastest way to put together a quick simulation for a business across multiple dimensions (time, product, geography, sales rep, time etc.). This approach is best suited amongst all the approaches outlined here when hierarchies are involved.
***
Some Frequently Asked Questions
Here are some common questions we encounter, along with brief answers. We will explore these topics individually in detail in our upcoming blogs.
To learn more about Forecasting in Power BI, press here
***
Overall, we looked at five different ways in which you could create what-if simulations in Power BI. Which one is your favorite? Do let us know by sharing your thoughts in Inforiver community.
Curious about Inforiver? Read why Matt Allington (Self Service BI Expert + Microsoft MVP) , Excelerator BI prefers Inforiver over the Analyze in Excel capability that comes with Power BI for ad-hoc analysis.

Inforiver helps enterprises consolidate planning, reporting & analytics on a single platform (Power BI). The no-code, self-service award-winning platform has been recognized as the industry’s best and is adopted by many Fortune 100 firms.
Inforiver is a product of Lumel, the #1 Power BI AppSource Partner. The firm serves over 3,000 customers worldwide through its portfolio of products offered under the brands Inforiver, EDITable, ValQ, and xViz.
 Transform Power BI dashboards into decision-driving tools. Discover data visualization best practices tailored for Power BI users.