Upcoming webinar on 'Inforiver Charts : The fastest way to deliver stories in Power BI', Aug 29th , Monday, 10.30 AM CST. Register Now
Upcoming webinar on 'Inforiver Charts : The fastest way to deliver stories in Power BI', Aug 29th , Monday, 10.30 AM CST. Register Now
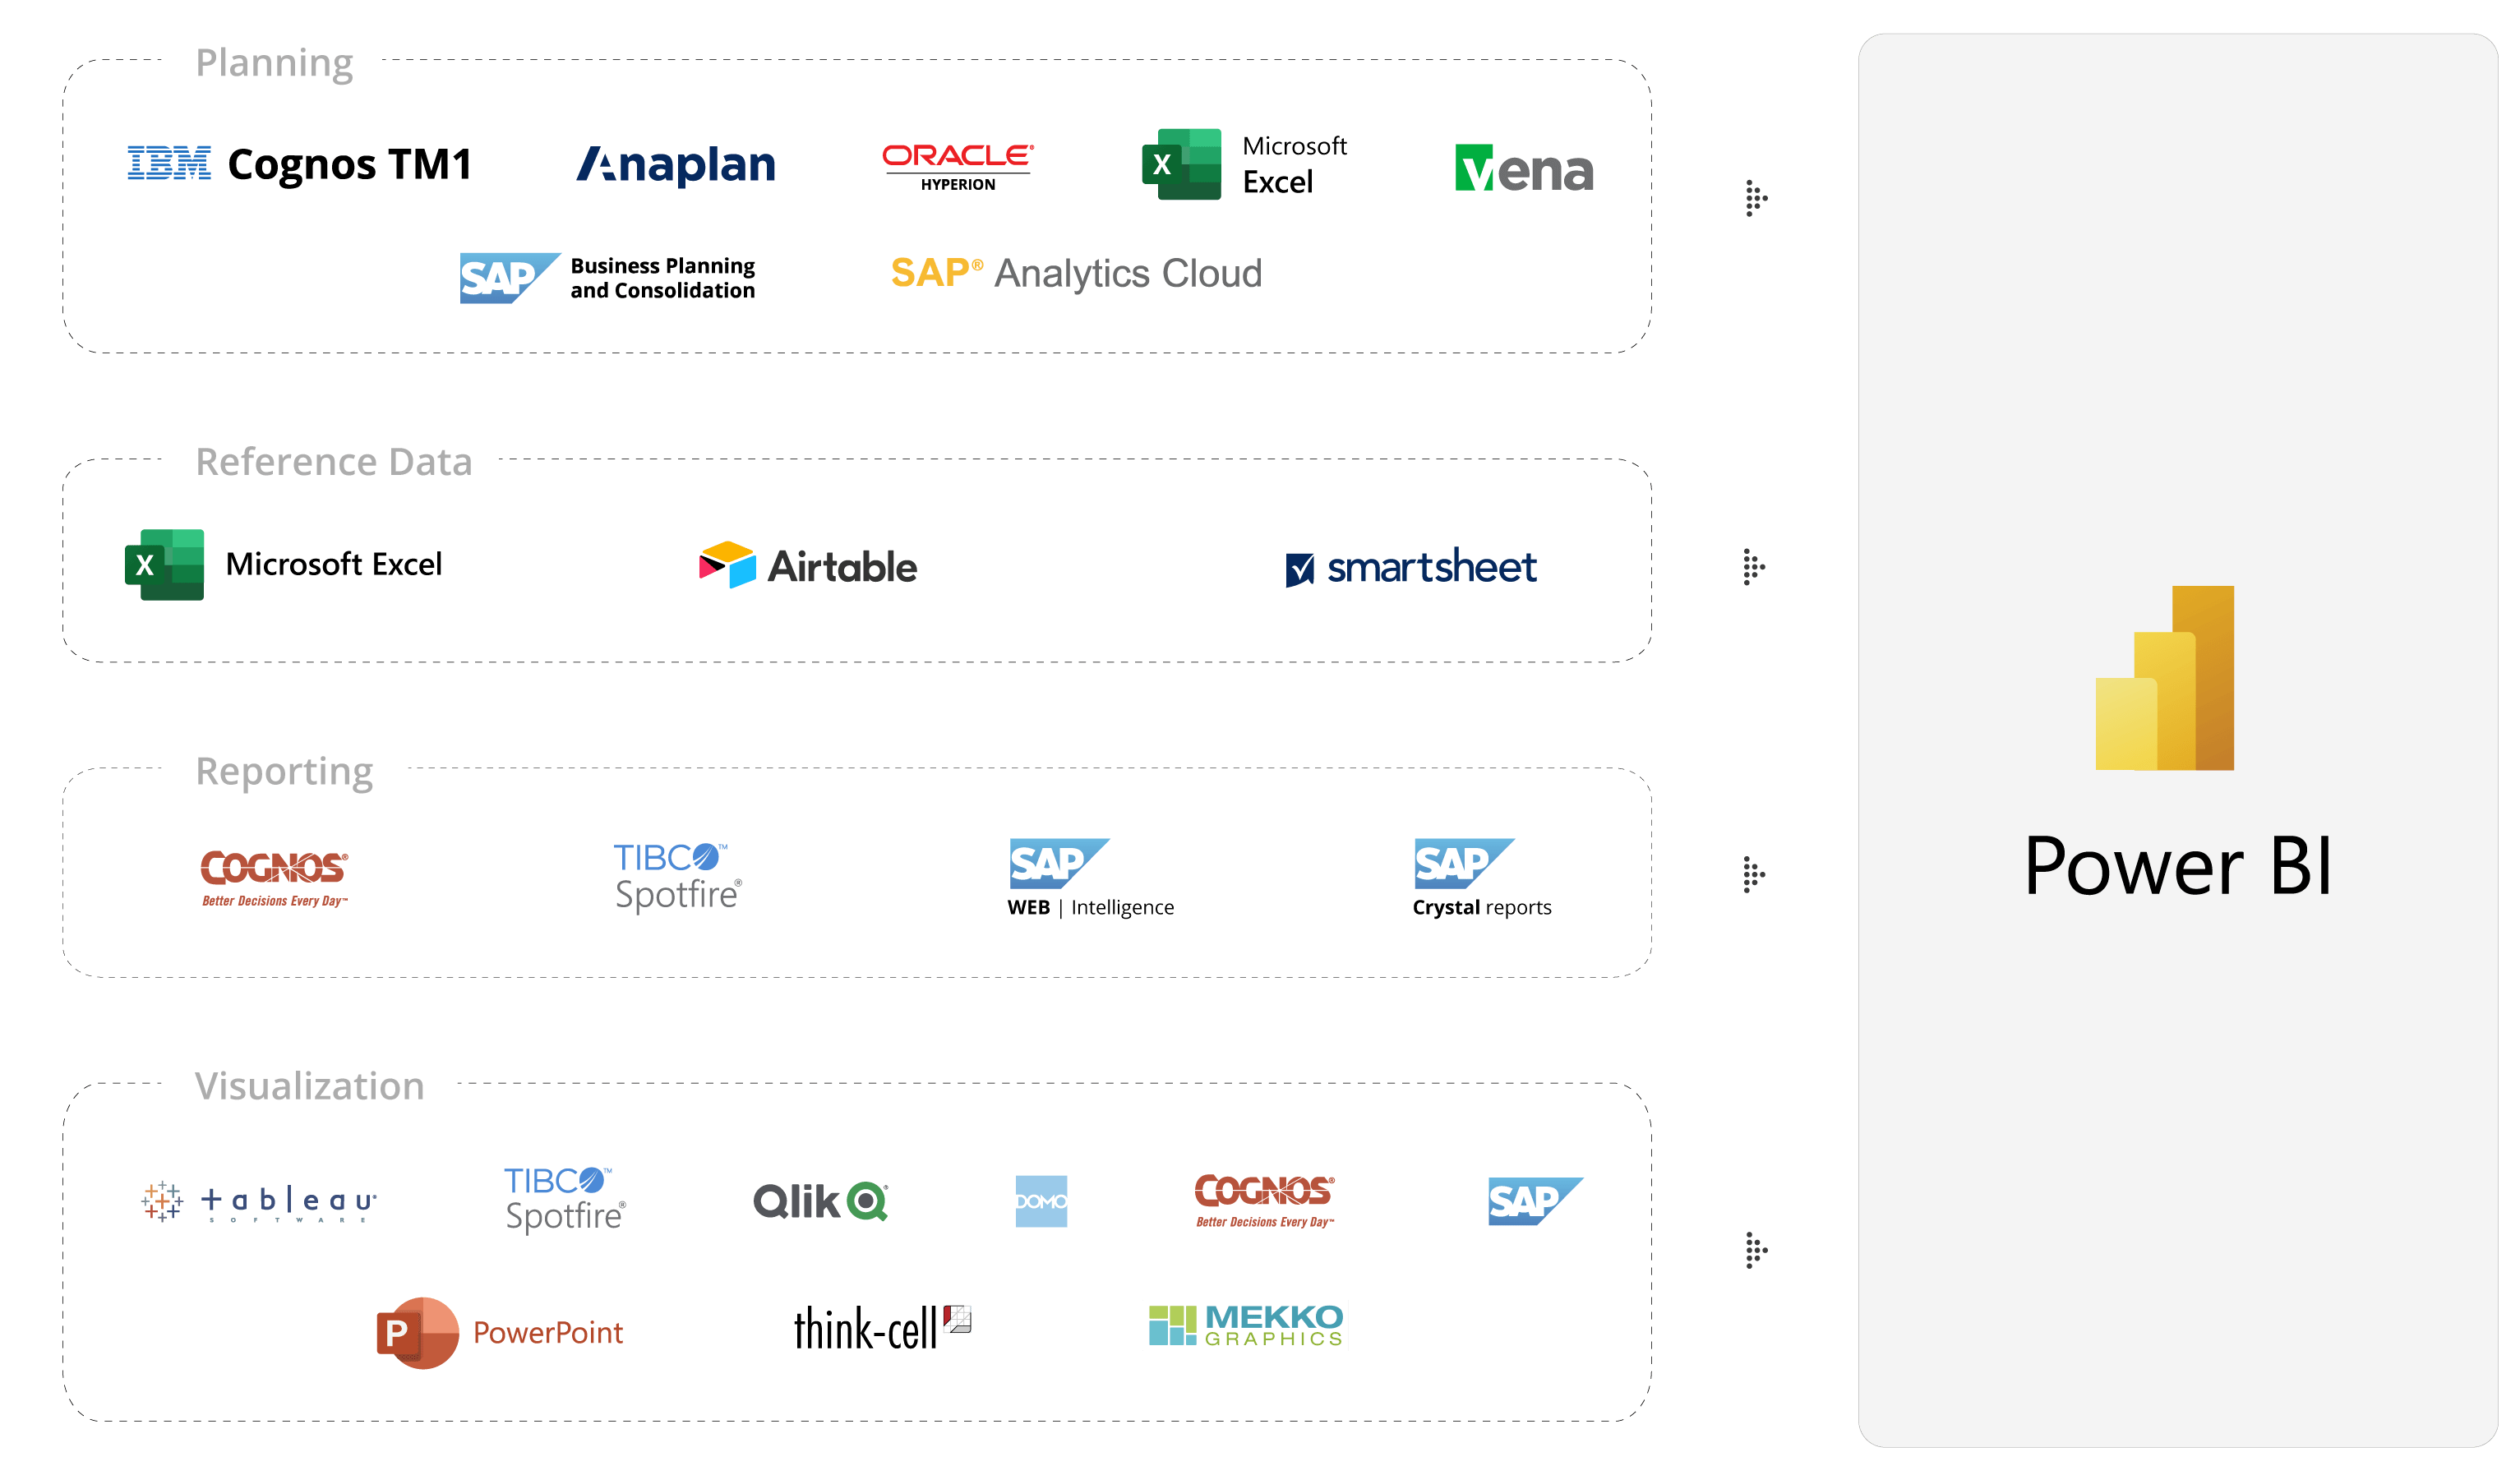
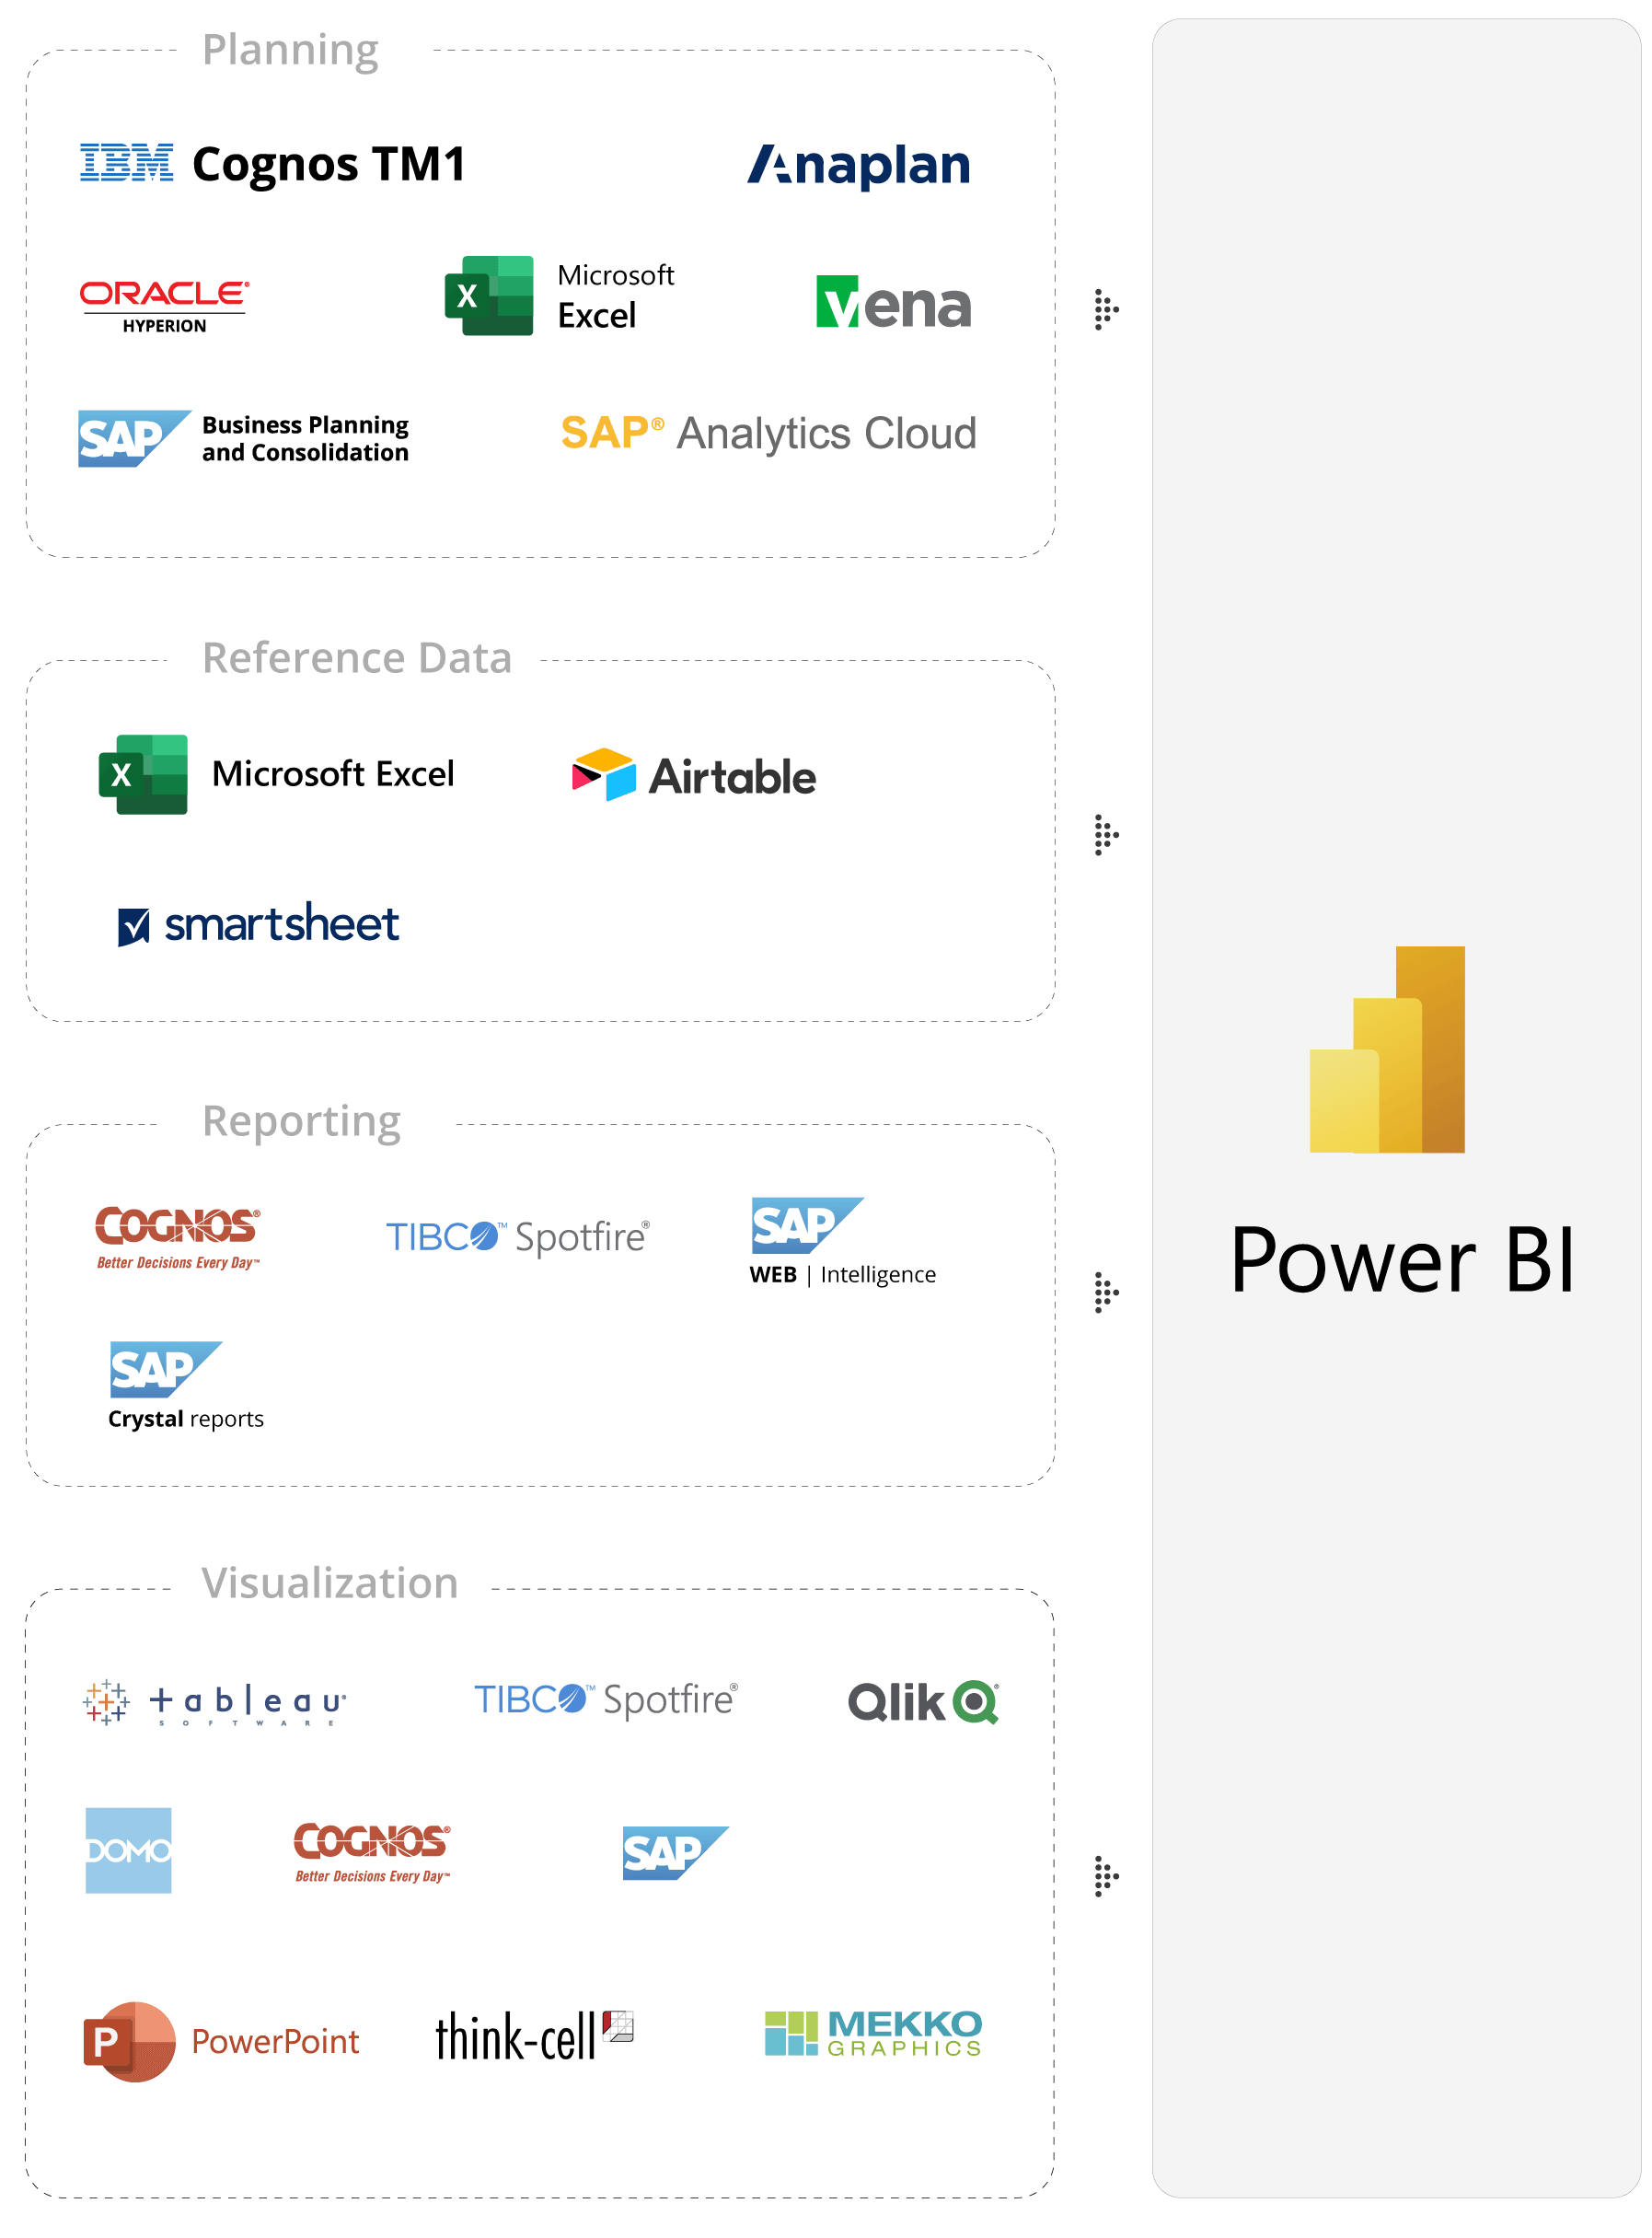
Retire legacy tools and platforms that cause data silos and embrace an integrated Enterprise Performance Management (EPM) platform in Power BI.
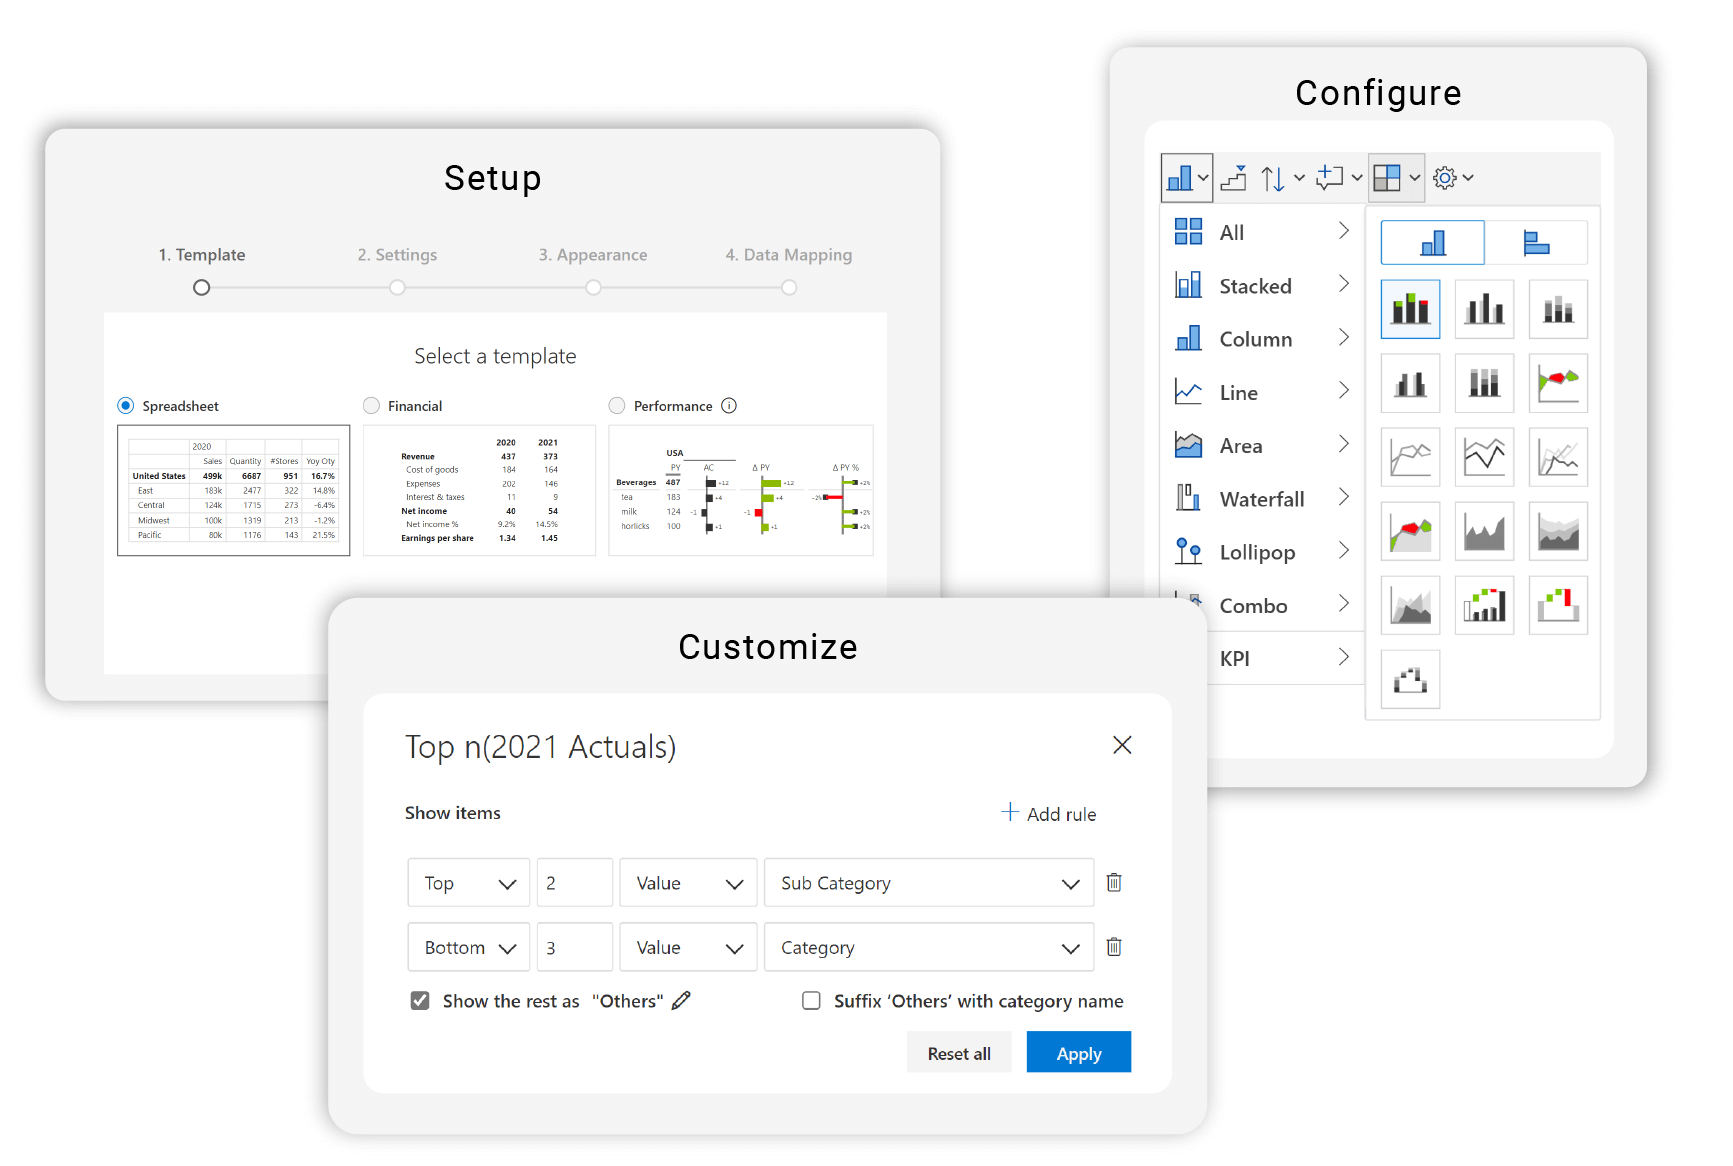
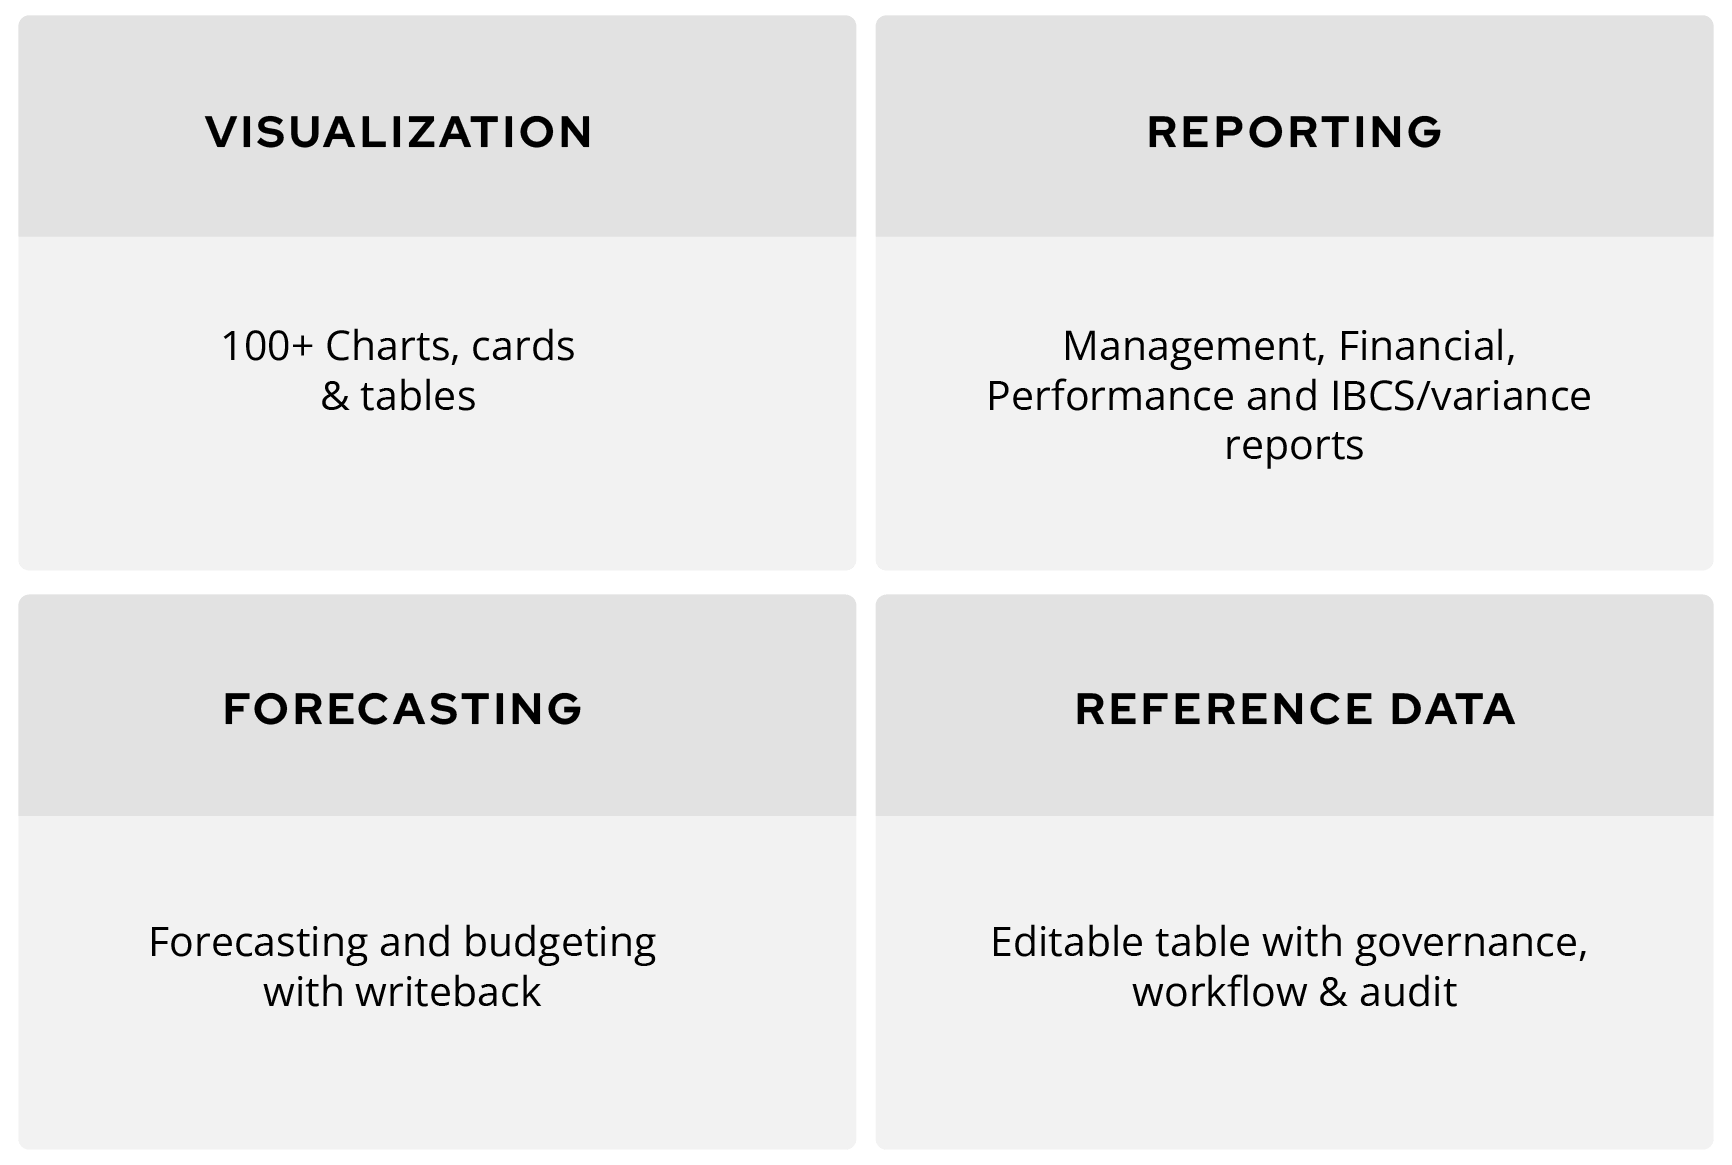
Inforiver is a no-code platform designed for business users with zero coding skills. It automates a lot of activities and cuts down your dependence on IT or consultants. There are at least 40+ planning & reporting actions that are automated and do not require you to write code or create scripts.
For example, you can accomplish the following without writing a single line of code:
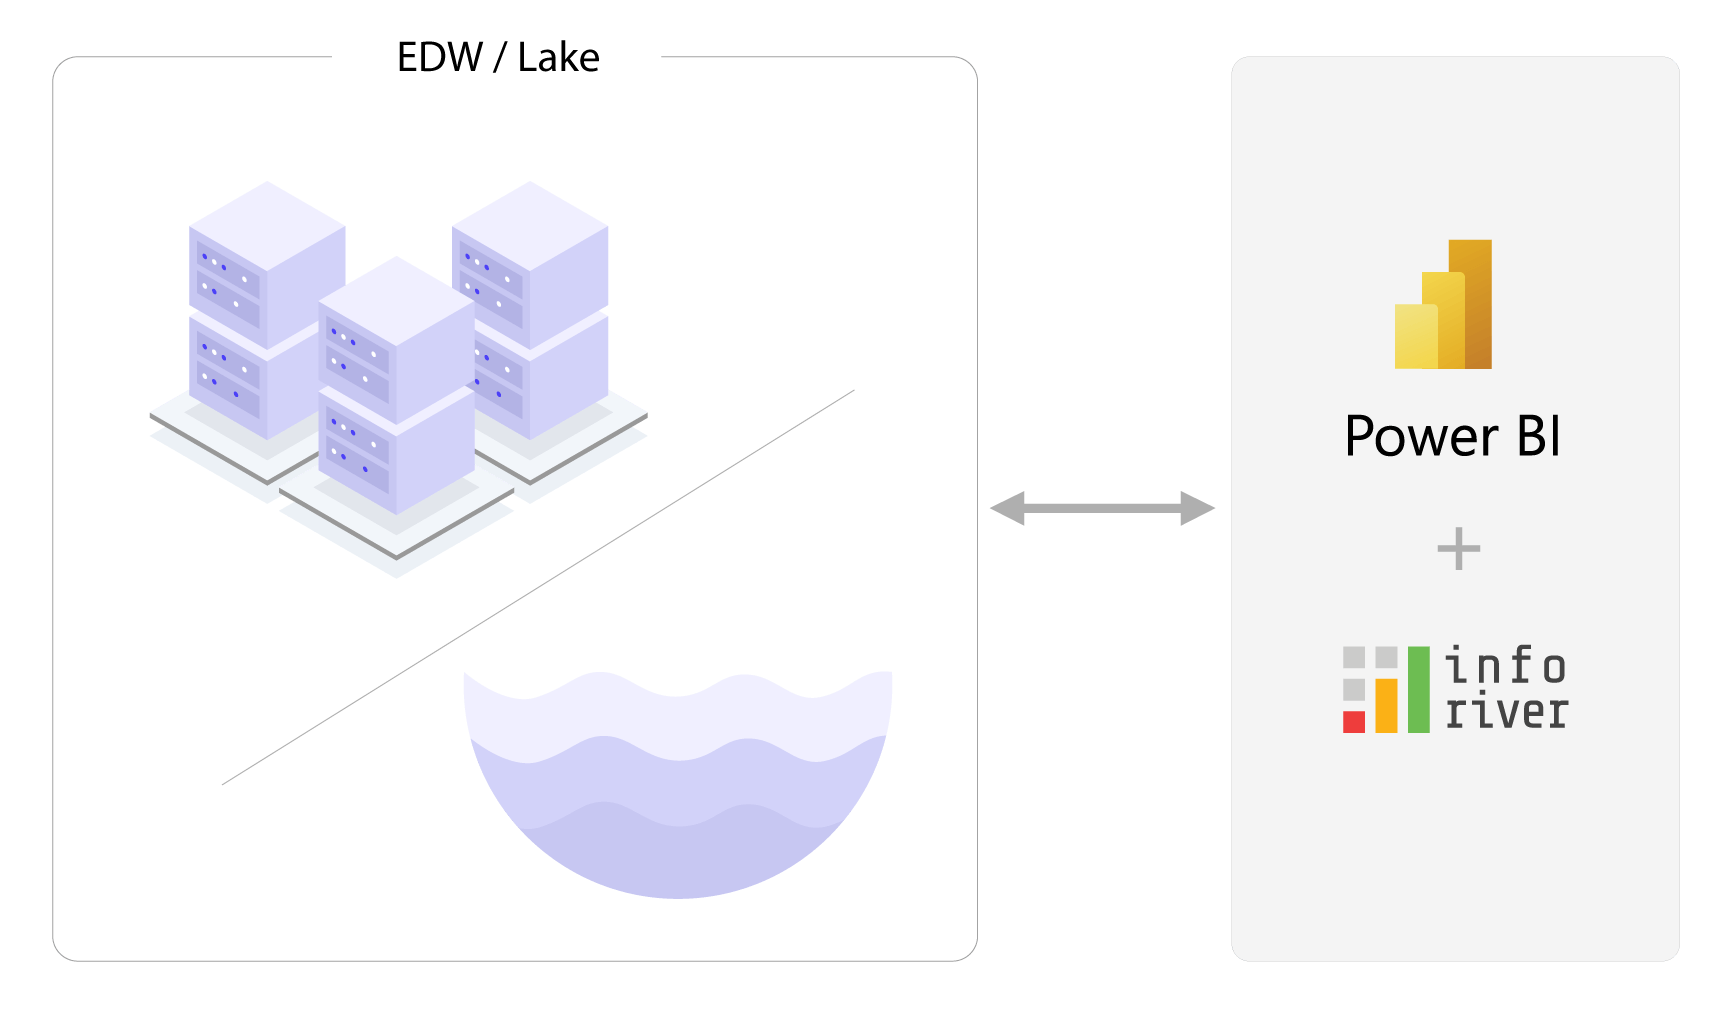
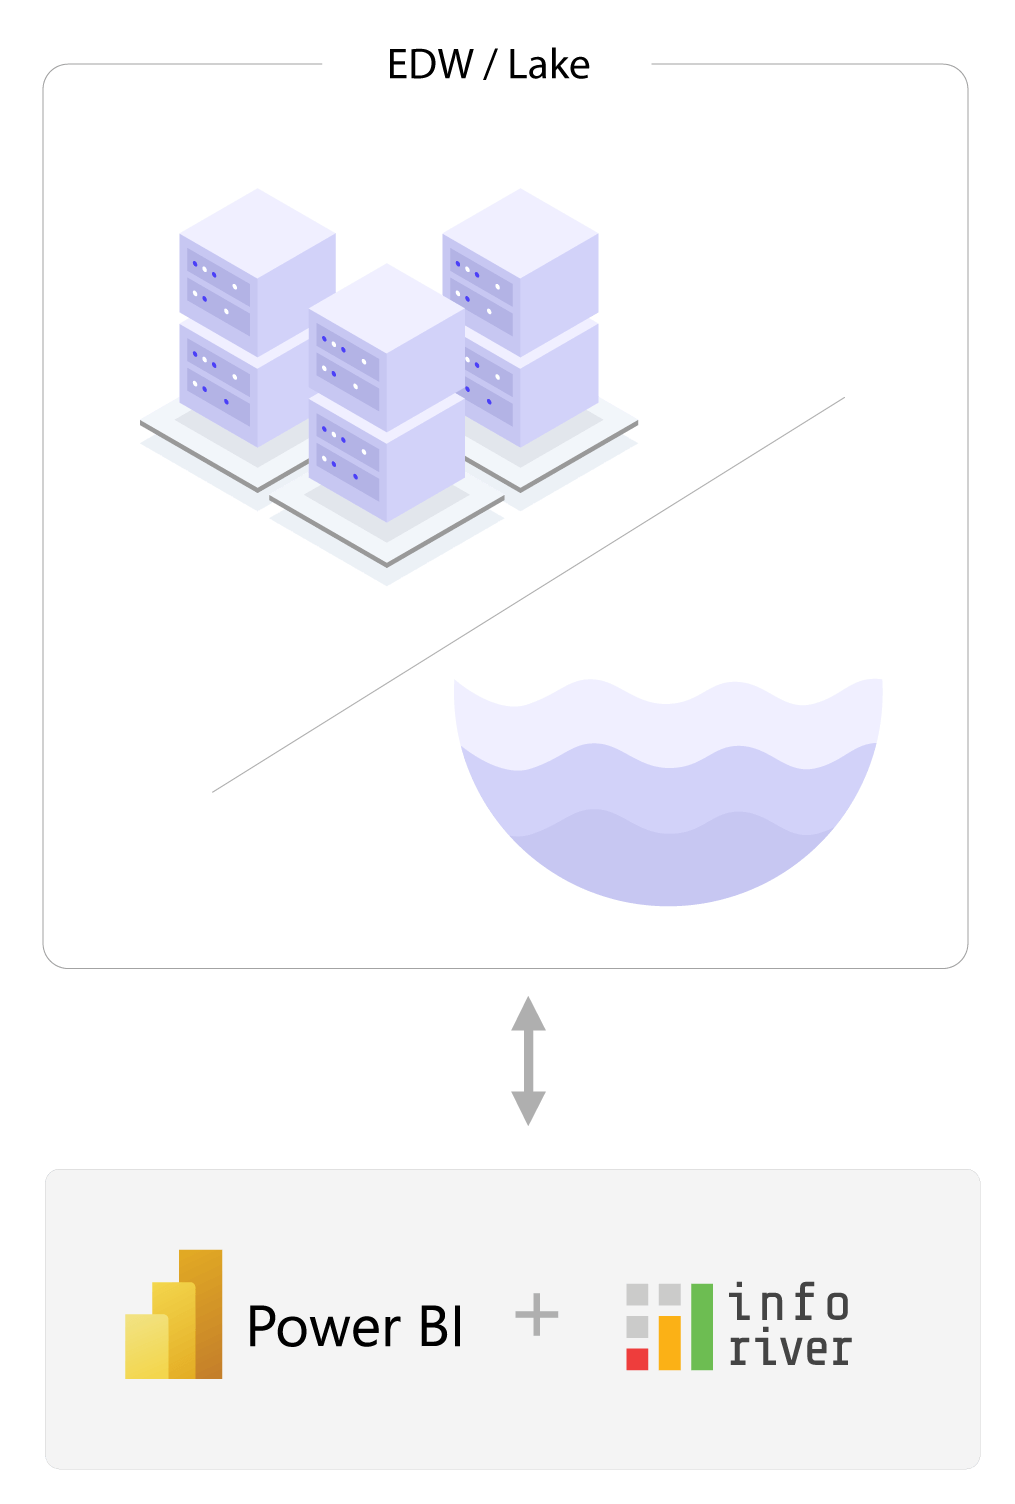
Most organizations have invested in a core data (/lake) platform (e.g., Snowflake) to consolidate all enterprise data in one place. But typical planning applications require you to first relocate your data from your core data platforms or reporting systems. This causes data silos which become complex and expensive to manage.
Choosing an option like Inforiver ensures that you bring planning to your data, and not the other way around. This ensures that you are not replicating data and creating silos, and ensures that you get the most out of your data platform investments
Inforiver visuals are certified by Microsoft. In addition, the product enables three levels of security inside your Power BI applications:

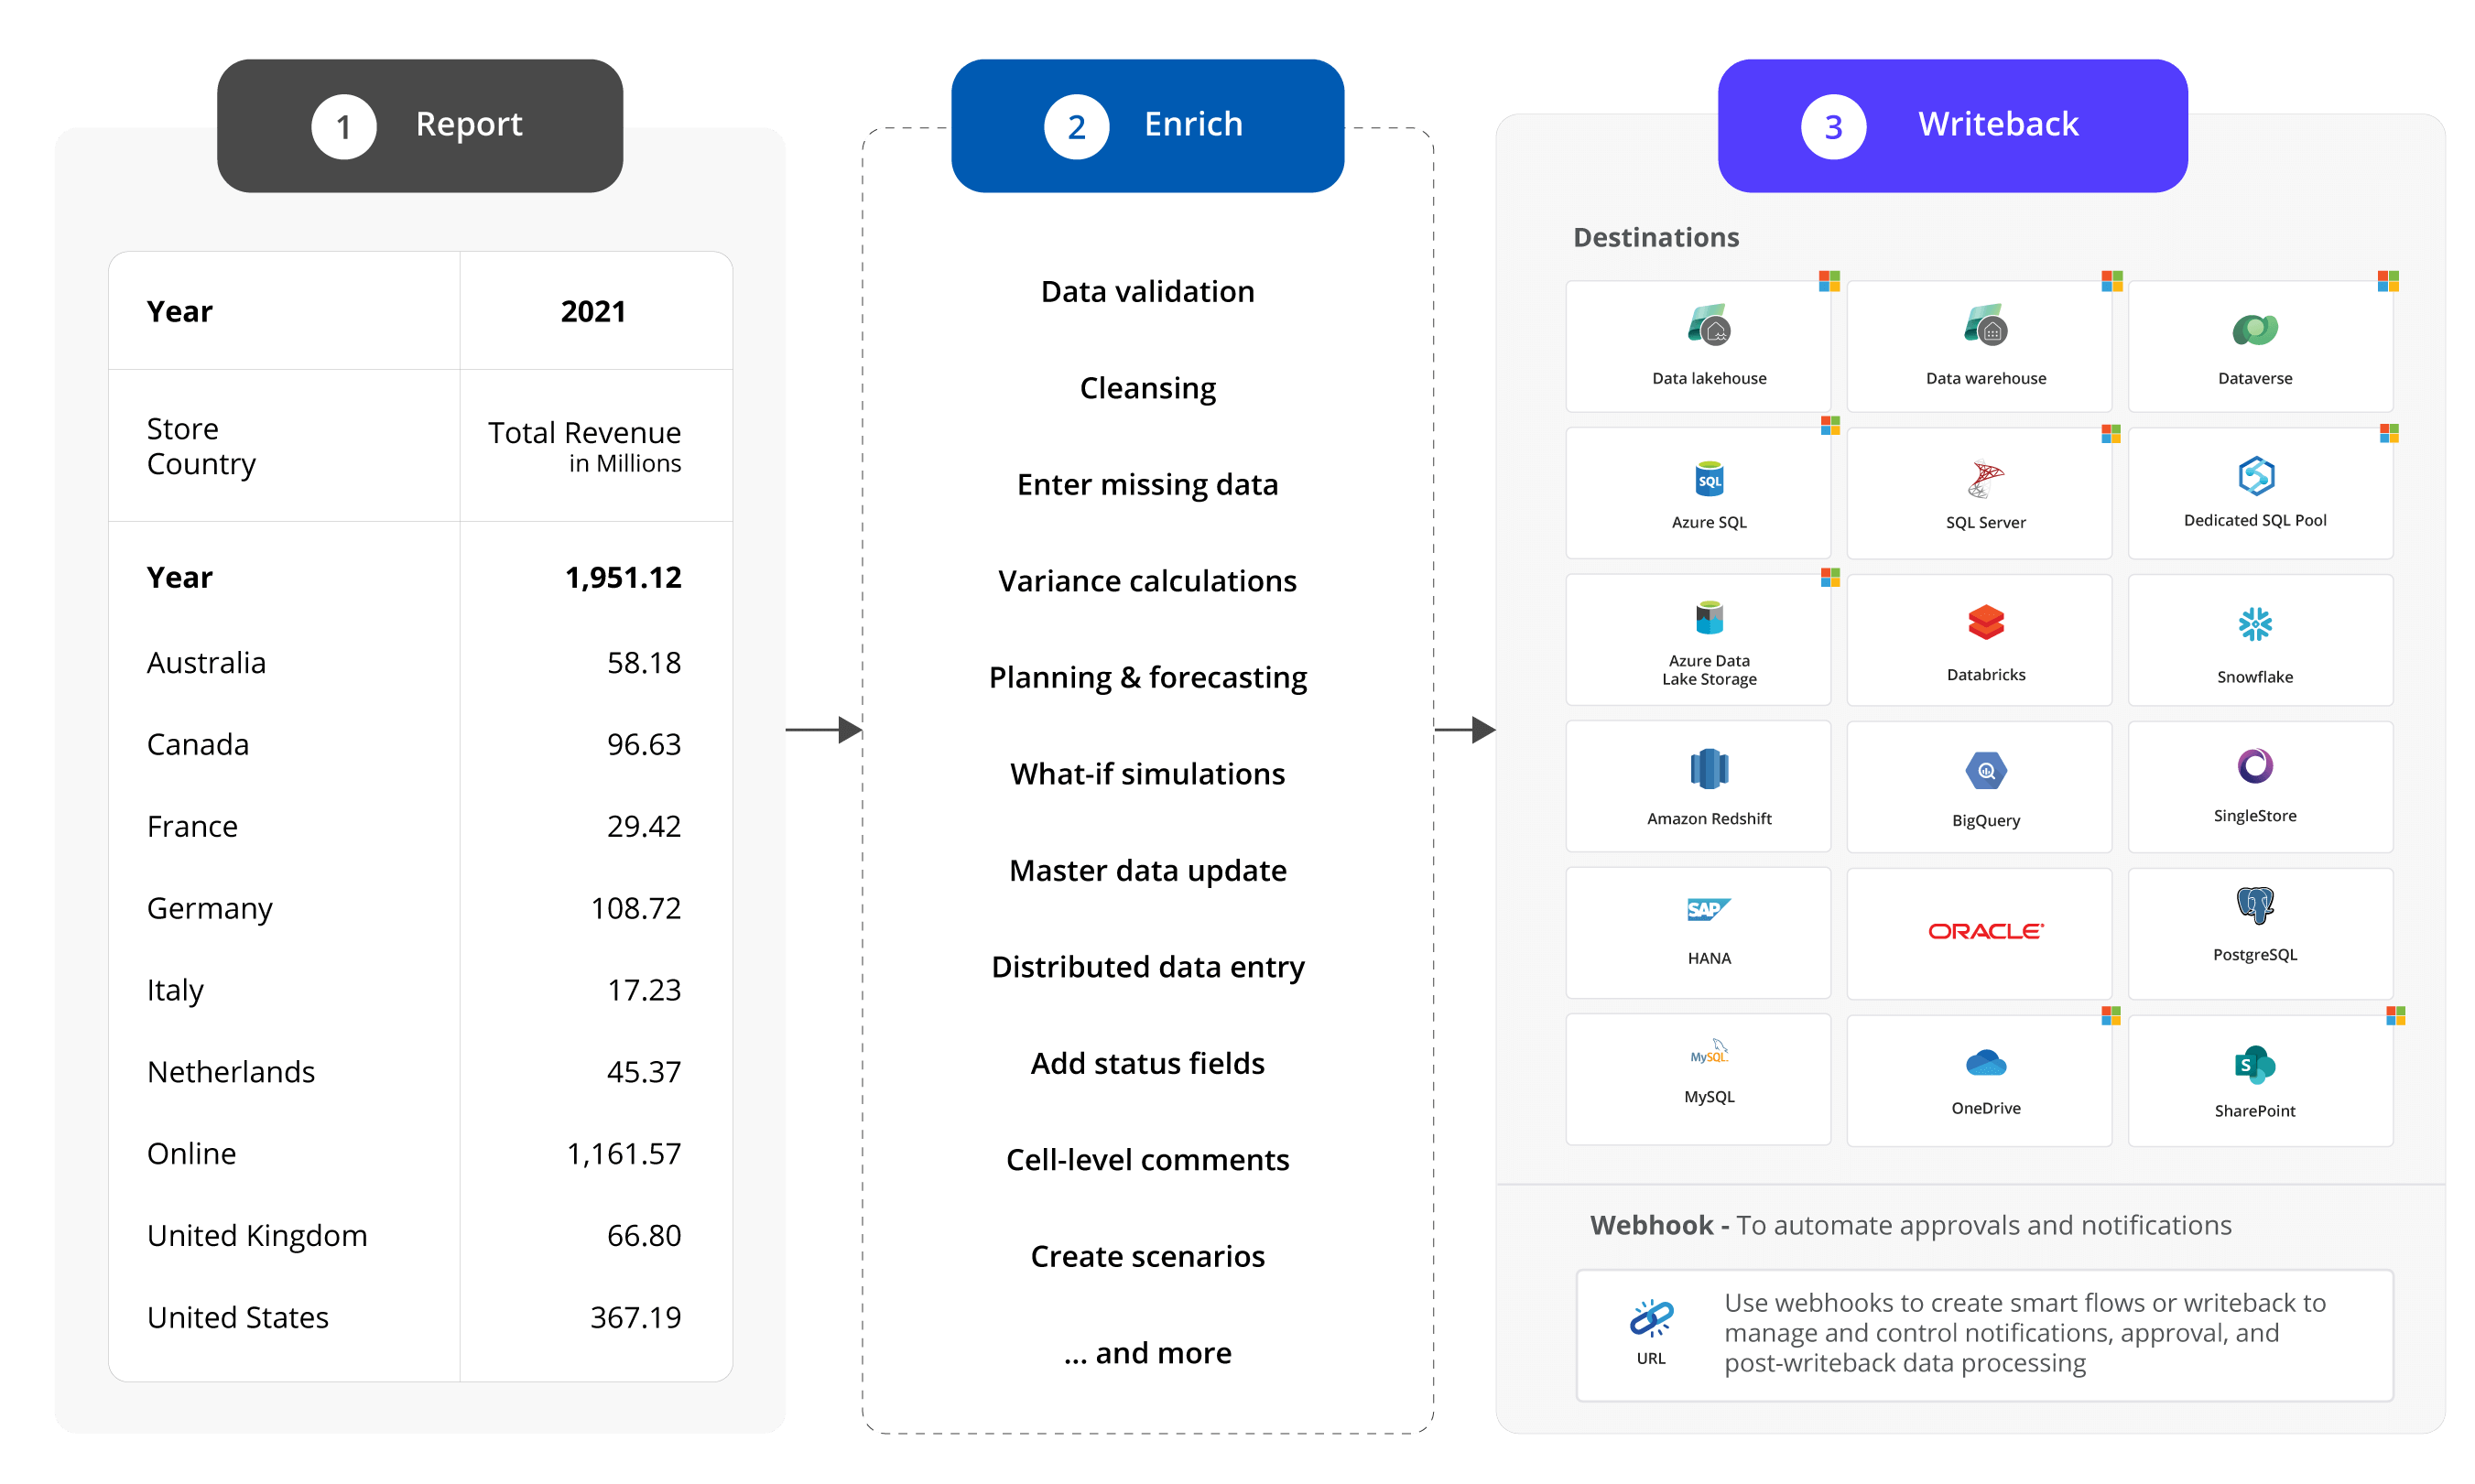
Inforiver offers the best solution for writeback across all BI platforms (and not just Power BI). The no-code writeback capability enables use cases such as the following:
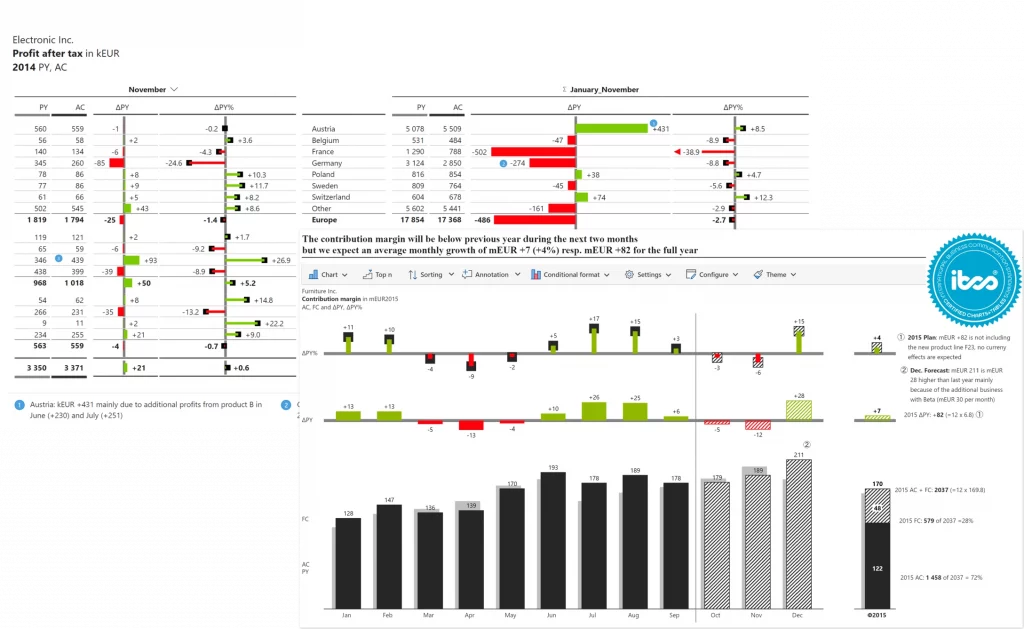
Inforiver adopts a business-responsive design that helps users deliver reports that are compliant with International Business Communication Standards (IBCS) Leverage a wide variety of templates with enhanced capabilities such as small multiples, data-level commenting, top N + others filtering, pixel-perfect Export to PDF and more.
Procure visuals from one provider for all your requirements, ensuring standardization and ease of maintenance

Inforiver helps enterprises consolidate planning, reporting & analytics on a single platform (Power BI). The no-code, self-service award-winning platform has been recognized as the industry’s best and is adopted by many Fortune 100 firms.
Inforiver is a product of Lumel, the #1 Power BI AppSource Partner. The firm serves over 3,000 customers worldwide through its portfolio of products offered under the brands Inforiver, EDITable, ValQ, and xViz.