
Upcoming webinar on 'Inforiver Charts : The fastest way to deliver stories in Power BI', Aug 29th , Monday, 10.30 AM CST. Register Now
Upcoming webinar on 'Inforiver Charts : The fastest way to deliver stories in Power BI', Aug 29th , Monday, 10.30 AM CST. Register Now
Like pretty much any piece of software, Power BI has multiple ways to solve any given problem. In this article today, I'm going to explain why you might want to use the Inforiver custom visual instead of using the standard Analyse in Excel capability that comes with Power BI.
There's an industry joke that you may already have heard; it goes something like this.
Question: What are the three most common buttons that come with any Business Intelligence tool?
Answer: OK, Cancel, and Export to Excel
I think it’s funny, but it’s also true. This highlights a problem that all BI software tools face, and that is that those that use BI software are used to working in Microsoft Excel. They feel very comfortable with Excel, and they often don't invest the time to learn how to use new tools. Analyze in Excel is Microsoft’s attempt to short circuit the need for the “Export to Excel” button so that people can have the best of both worlds. Once you export your data to Excel, you have created a “copy” of the data and it will no longer be in sync. The Analyze in Excel feature allows you to create a live connection to the data but still allow you to use the familiar Microsoft Excel (typically Pivot Tables).
There are many reasons people might choose to use Analyze in Excel, including:
While there is no doubt that the reasons people use Analyze in Excel have some merit, once you leave the Power BI environment to leverage Analyze in Excel you walk away from many other useful features that are not available in Analyze in Excel. The Inforiver visual solves this problem by providing a familiar visual experience that is similar to what you get in Excel pivot tables without the need to leave the Power BI workspace at all. The benefits of using Inforiver as an alternative to Analyze in Excel, include:
It is not my role to pass judgement as to whether a company should or should not use Excel as part of its enterprise reporting solution. What I do want to point out, however, is that some (many?) companies simply don’t want to have Excel as part of the solution. These companies want their staff to change the way they think about reporting and move them fully into the enterprise reporting space as part of their digital transformation initiatives. Arguably, keeping Analyze in Excel as part of the reporting solution goes counter to this objective. Inforiver closes the gaps between the structural reporting limitations of the Power BI standard Matrix and the full flexibility of Excel, eliminating this barrier to moving everything to enterprise reporting if desired.
In addition to all the points covered above, there are plenty of benefits that Inforiver offers over and above the standard Analyze in Excel experience without having to walk away from the familiar Pivot Table experience. Here are a few of the more important added benefits.
It is possible to directly edit any cell inside the Inforiver matrix regardless of if it currently contains a value or not. You can manually override any number that you need to change, or indeed write a new formula directly in the cell. This is not possible in a regular pivot table.
Sometimes you need to add something into a pivot table that simply doesn’t exist in the underlying data, such as when there is a planned new product launch. Using Inforiver, it is easy to insert a new row (or column) to add in something that is missing. Note how the new budget entry rolls up to the total budget, too.
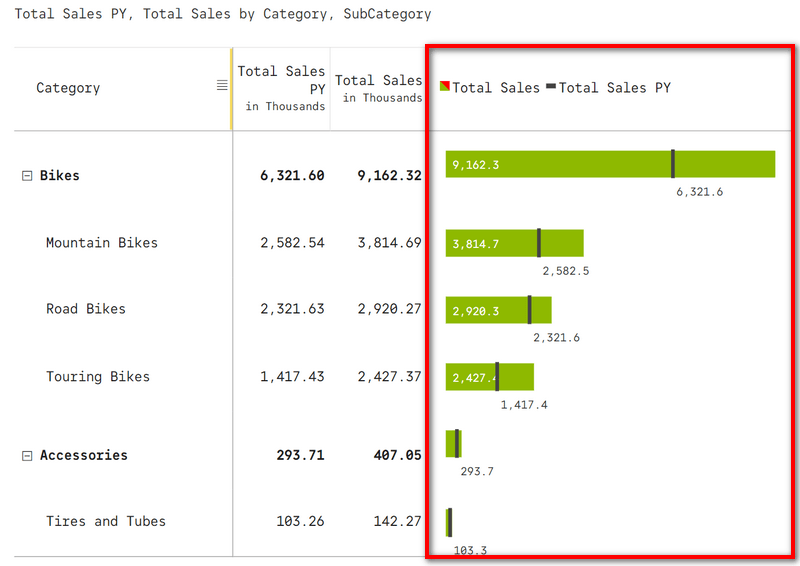
Inforiver has many in built visualisation charts that are simply not possible in standard Excel. This includes the automatic creation of special chart visuals such as the bullet chart shown below (to show just one option).
Inforiver also fully supports the IBCS reporting standards with out of the box templates.
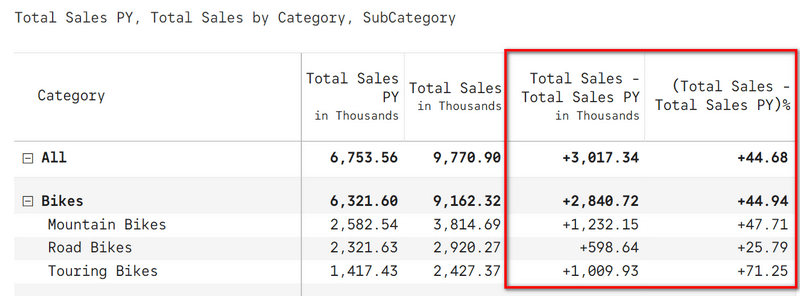
In standard Power BI and when using Analyze in Excel, it is necessary to write every single measure possibly needed to build out the required reports. Inforiver has the ability to automatically generate standard variance calculation (actual and %) against items such as Actual, Budget and Prior Year. This is super helpful when you have many baseline measures that all have to be reported on at different times.
There are many benefits to using Inforiver over the Analyze in Excel experience. Inforiver is as good as Analyze in Excel for the common reasons people default to leave the Power BI environment and yet it has so much more to offer over and above the basics.
The latest announcement to be able to directly procure Inforiver directly from Microsoft is a welcome news for all Power BI Customers.
This blog is written by Matt Allington (Self Service BI Expert + Microsoft MVP) , Excelerator BI
Sign up for a FREE trial in less than a minute!

Inforiver helps enterprises consolidate planning, reporting & analytics on a single platform (Power BI). The no-code, self-service award-winning platform has been recognized as the industry’s best and is adopted by many Fortune 100 firms.
Inforiver is a product of Lumel, the #1 Power BI AppSource Partner. The firm serves over 3,000 customers worldwide through its portfolio of products offered under the brands Inforiver, EDITable, ValQ, and xViz.


