Upcoming webinar on 'Inforiver Charts : The fastest way to deliver stories in Power BI', Aug 29th , Monday, 10.30 AM CST. Register Now
The fastest way to build Power BI reports & visualizations
Everything in Standard Edition, along with advanced calculation, analysis & presentation capabilities
Everything in Professional, along with advanced formatted export, data entry, simulation, and forecasting capabilities.
Everything in Premium, along with collaboration, scheduling, and broadcasting capabilities.
Format report layouts, rows, columns, cells, titles, headers, text and values exactly as you want it
Tell better stories and collaborate better with cell, row & measure-level comments
Add customizable charts (bar, sparkline, bullet, waterfall, dumbbell range, stacked) to your table in a single click
Leverage no-code visual formula engine to insert rows and measures; Includes conditional calculations
Utilize First-Previous-Next-Last pagination out-of-the-box; Configure smart page breaks and section breaks
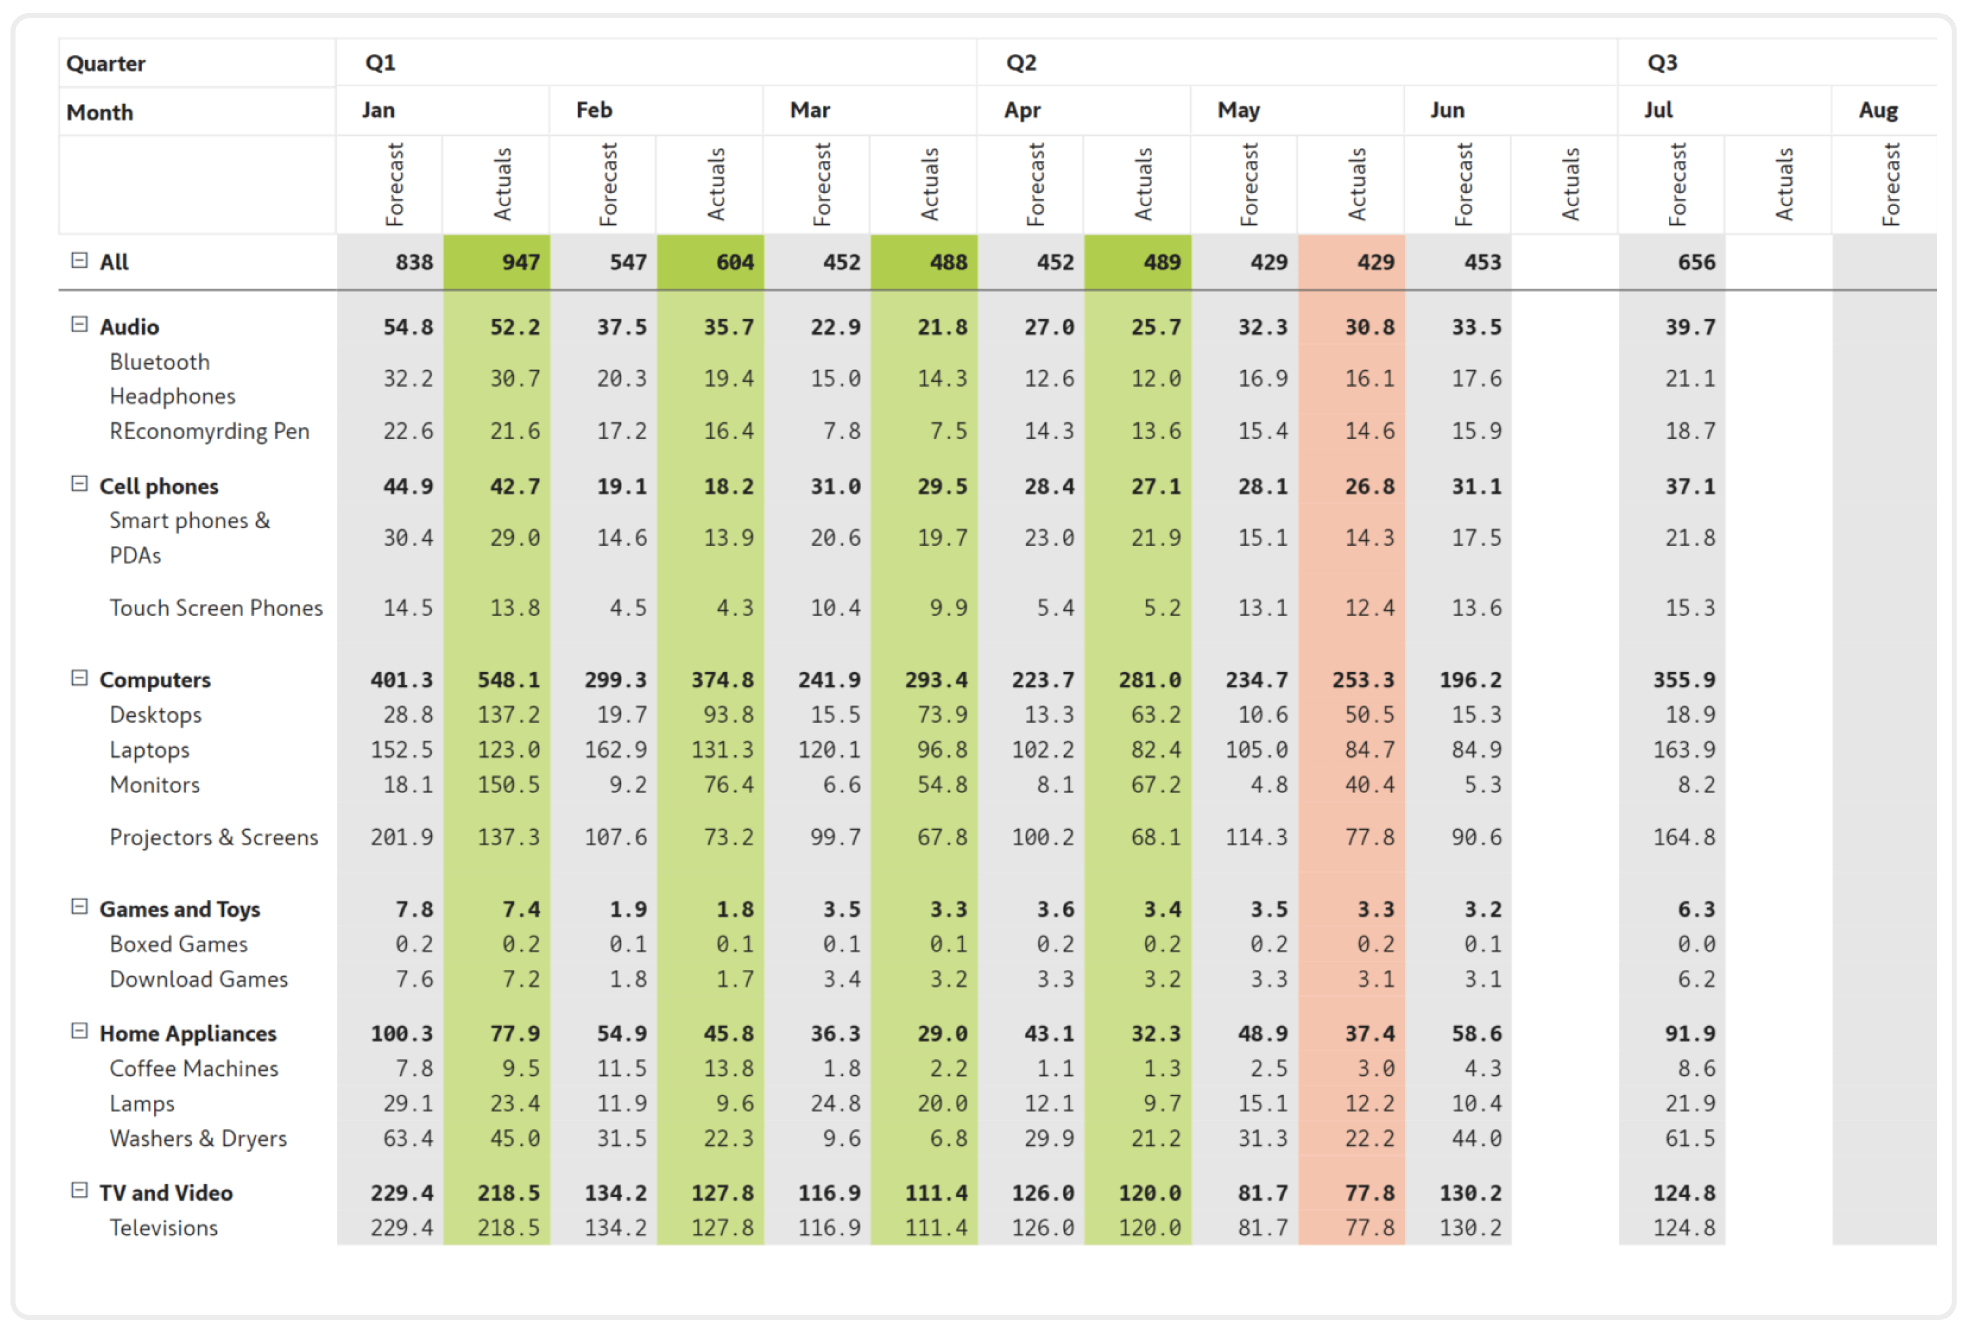
Perform conditional formatting in a click with pre-set options with advanced configurability
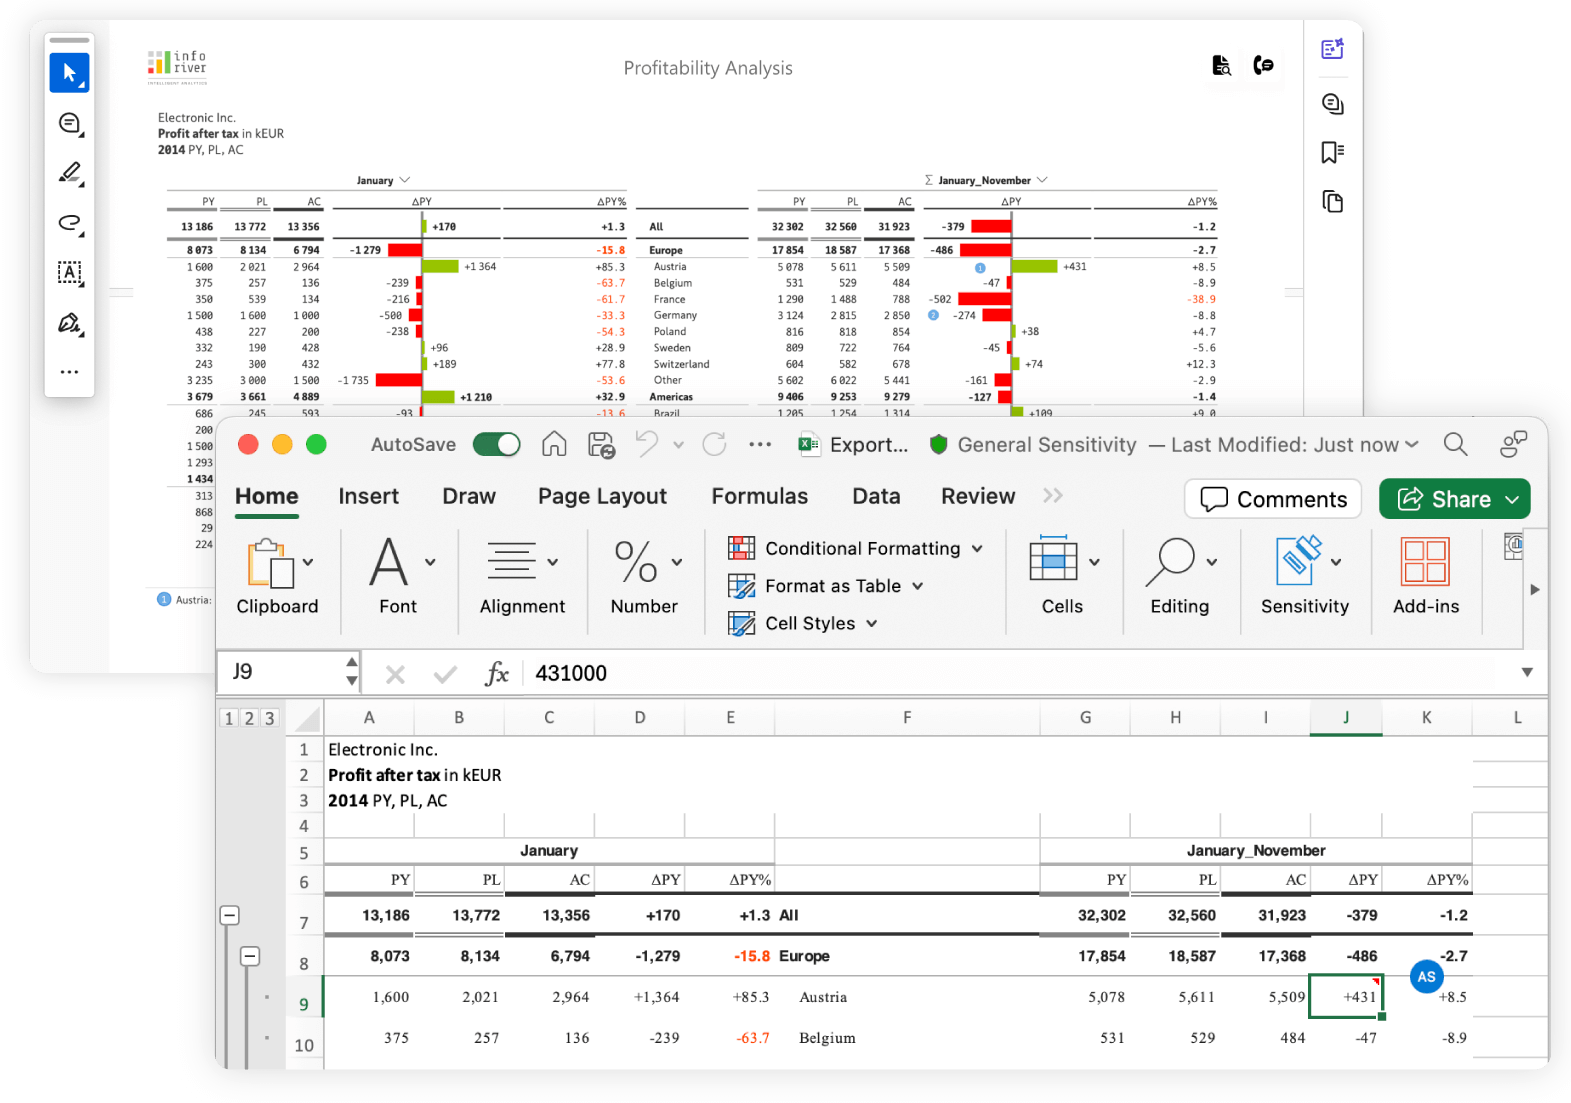
Perform report exports to Excel and PDF along with formatting and hierarchy structures
Save data along with comments to database, OneDrive, SharePoint, and publish to URLs
Leverage real-time governed commenting, email notifications, and commentary digests
Simulate performance on-the-fly based on changing business conditions, and visualize projections and variances
Track changes to report using interactive & query-enabled audit & report log; Monitor usage statistics
Schedule and broadcast reports supporting row level security (RLS) to email, OneDrive and SharePoint
Build highly formatted & interactive paginated reports
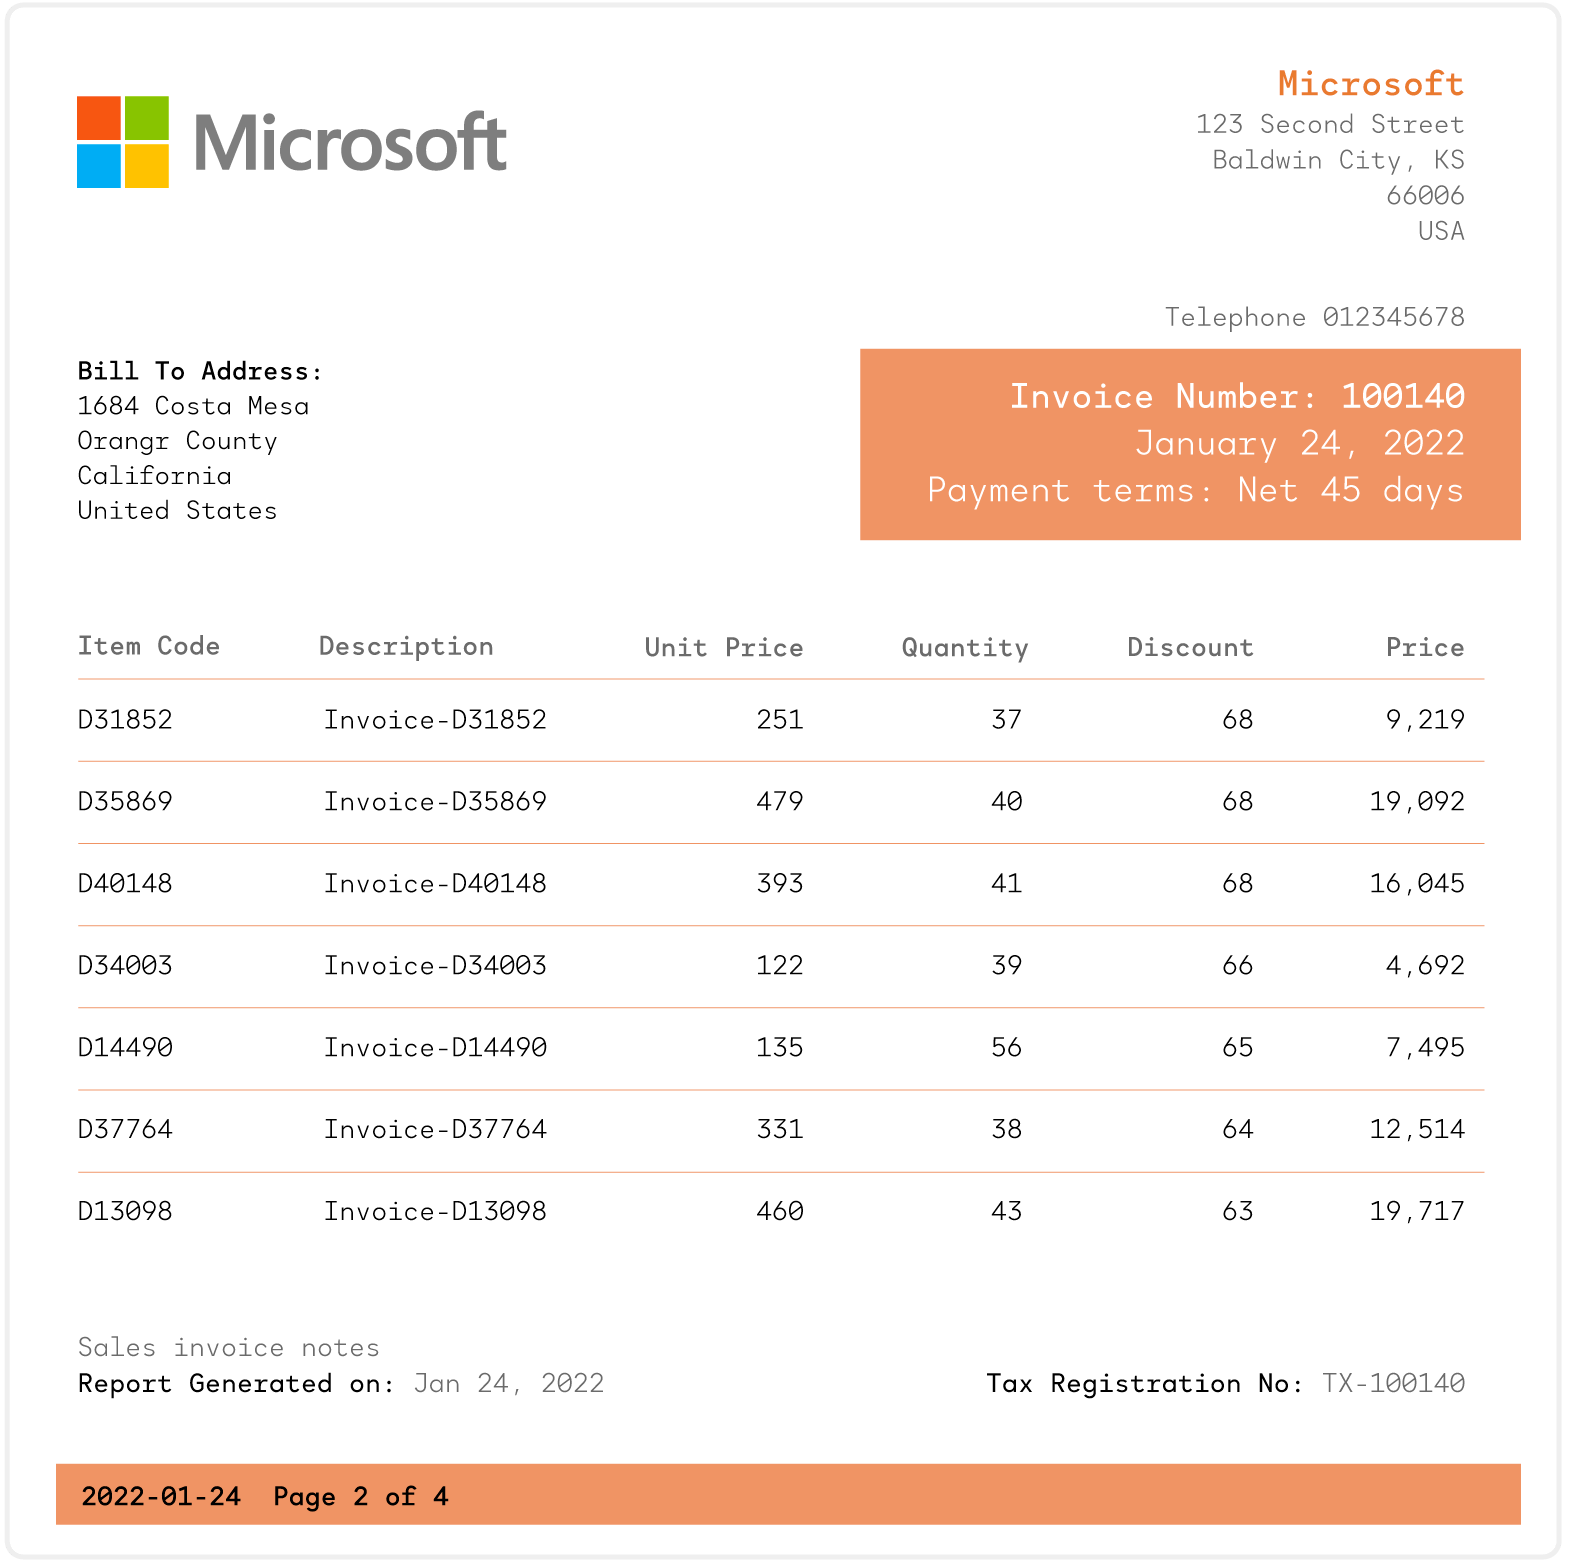
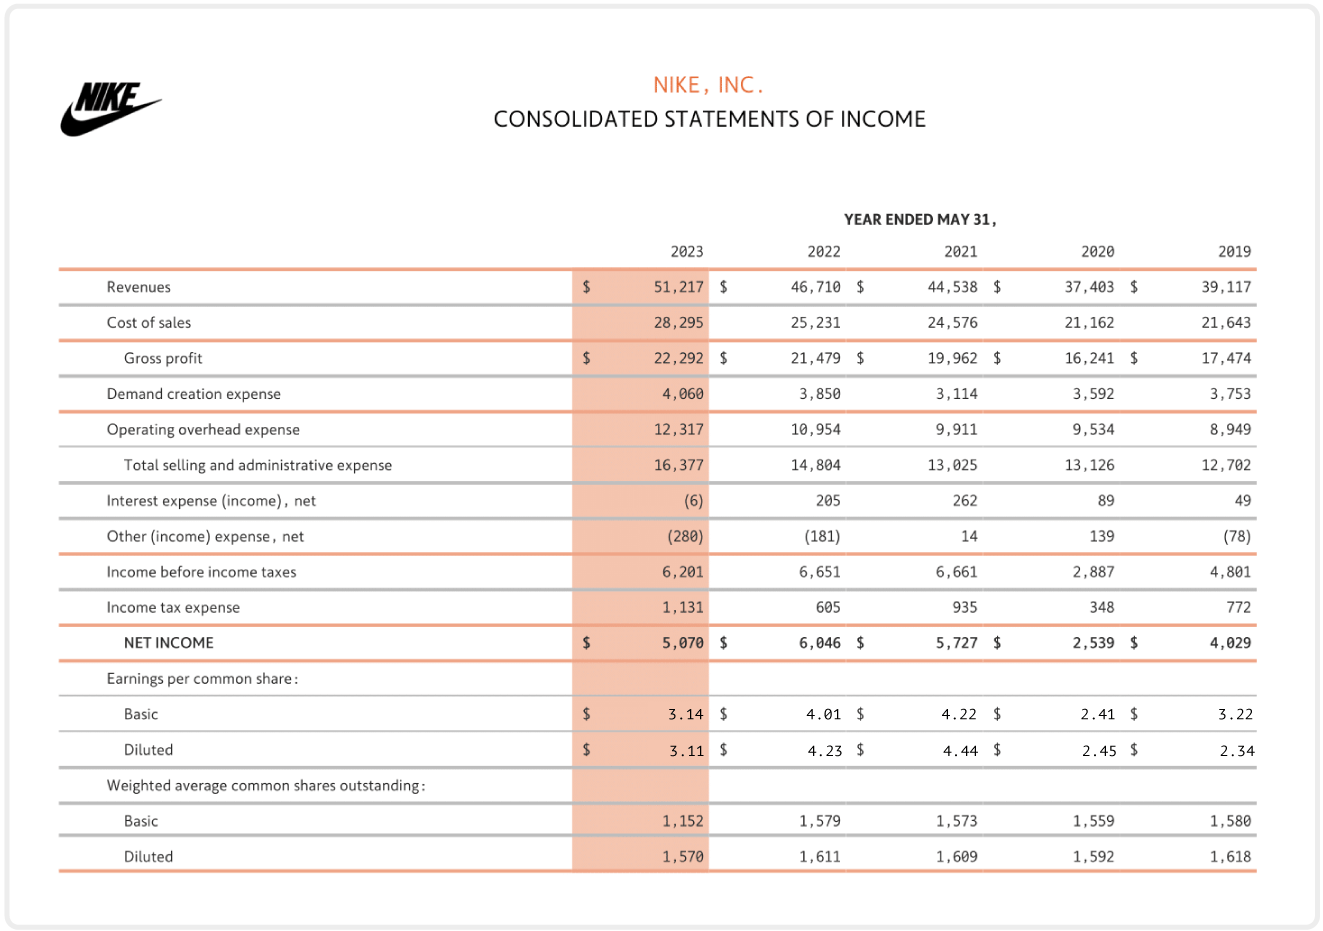
Deliver highly formatted income statements, balance sheets, cash flow statements, and more
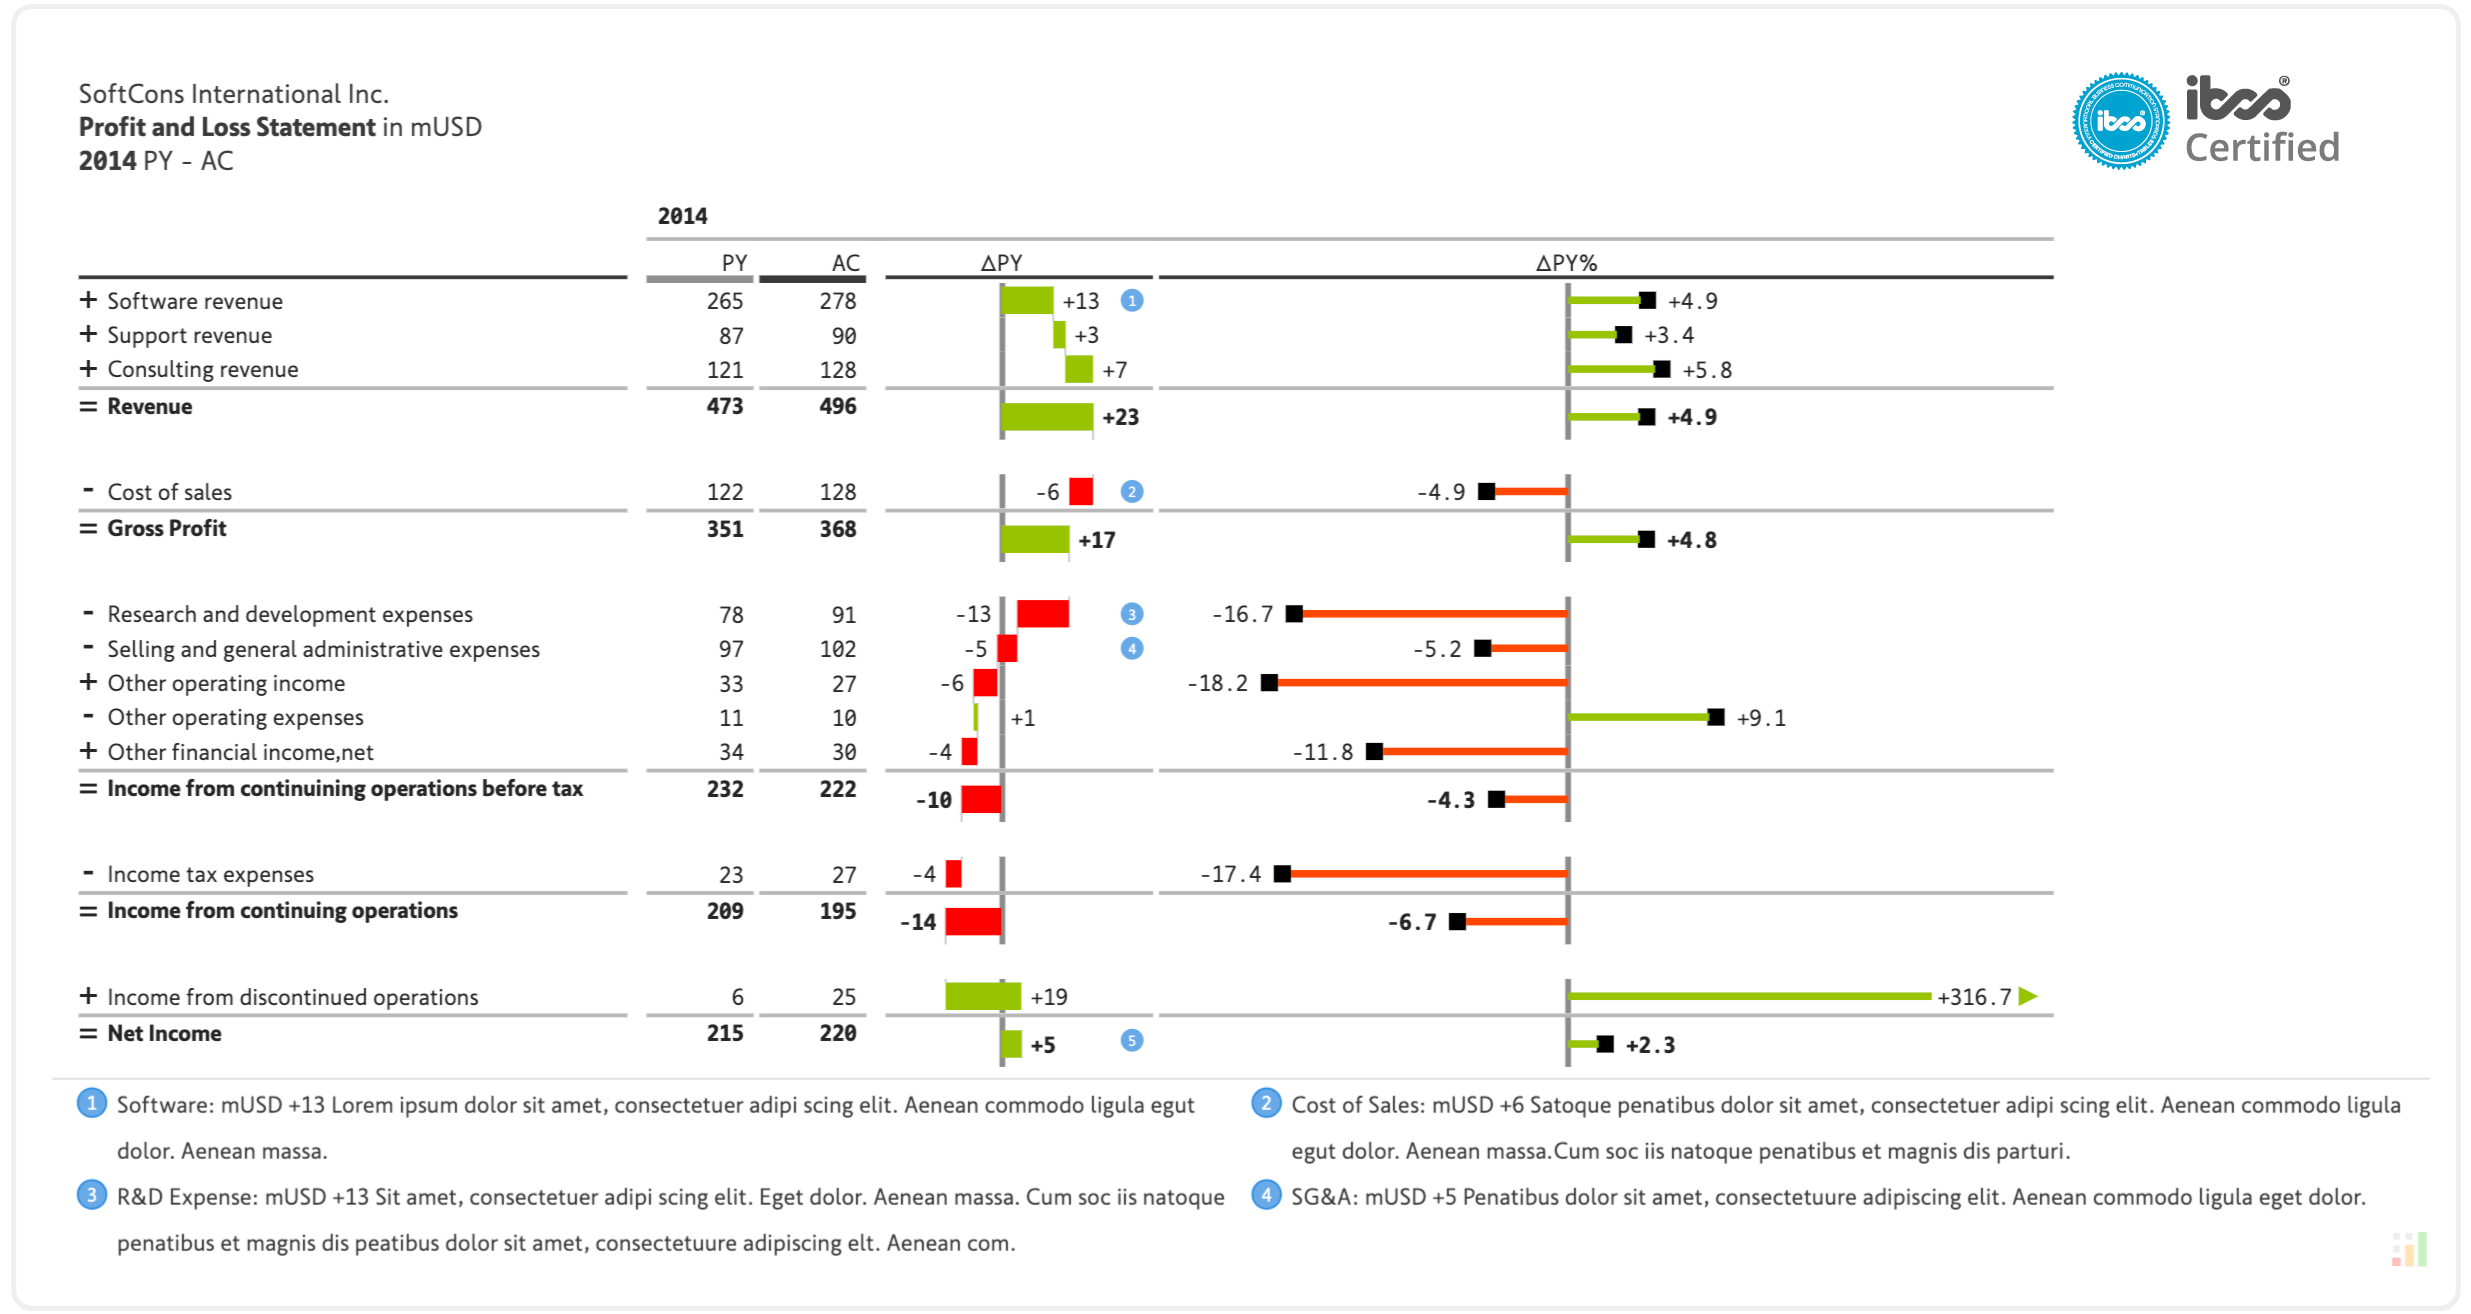
Deliver performance & variance reporting using 1-click International Business Communication Standards (IBCS) templates
Leverage spreadsheet-like interface for what-if simulations, forecasting, planning & budgeting
Deliver a range of charts and visualizations in your matrix reports in a single click
Enrich your analysis & decision-making by applying pivot-table like capabilities inside Power BI
Insert, edit or update cell values using values or formula; supports formula references to other cells
Leverage powerful formula engine to insert rows, columns and measures at the visual-level
Enhance your data stories with cell, row & column-level notes/footnotes & annotations
Apply pre-set or custom conditional formatting rules
Export to Excel or PDF without losing formatting
The industry-leading export capability delivers the following:
Track changes to your report using an interactive, filterable, exportable and comment-enabled audit log
30 Elegant Table Designs for Microsoft Power BI
Explore 30 elegant table designs (and a few bonus designs) that you can recreate in Power BI in less than a minute each without using scripting or DAX