Upcoming webinar on 'Inforiver Charts : The fastest way to deliver stories in Power BI', Aug 29th , Monday, 10.30 AM CST. Register Now
Upcoming webinar on 'Inforiver Charts : The fastest way to deliver stories in Power BI', Aug 29th , Monday, 10.30 AM CST. Register Now
Perform formatted exports to PDF from your Power BI reports.
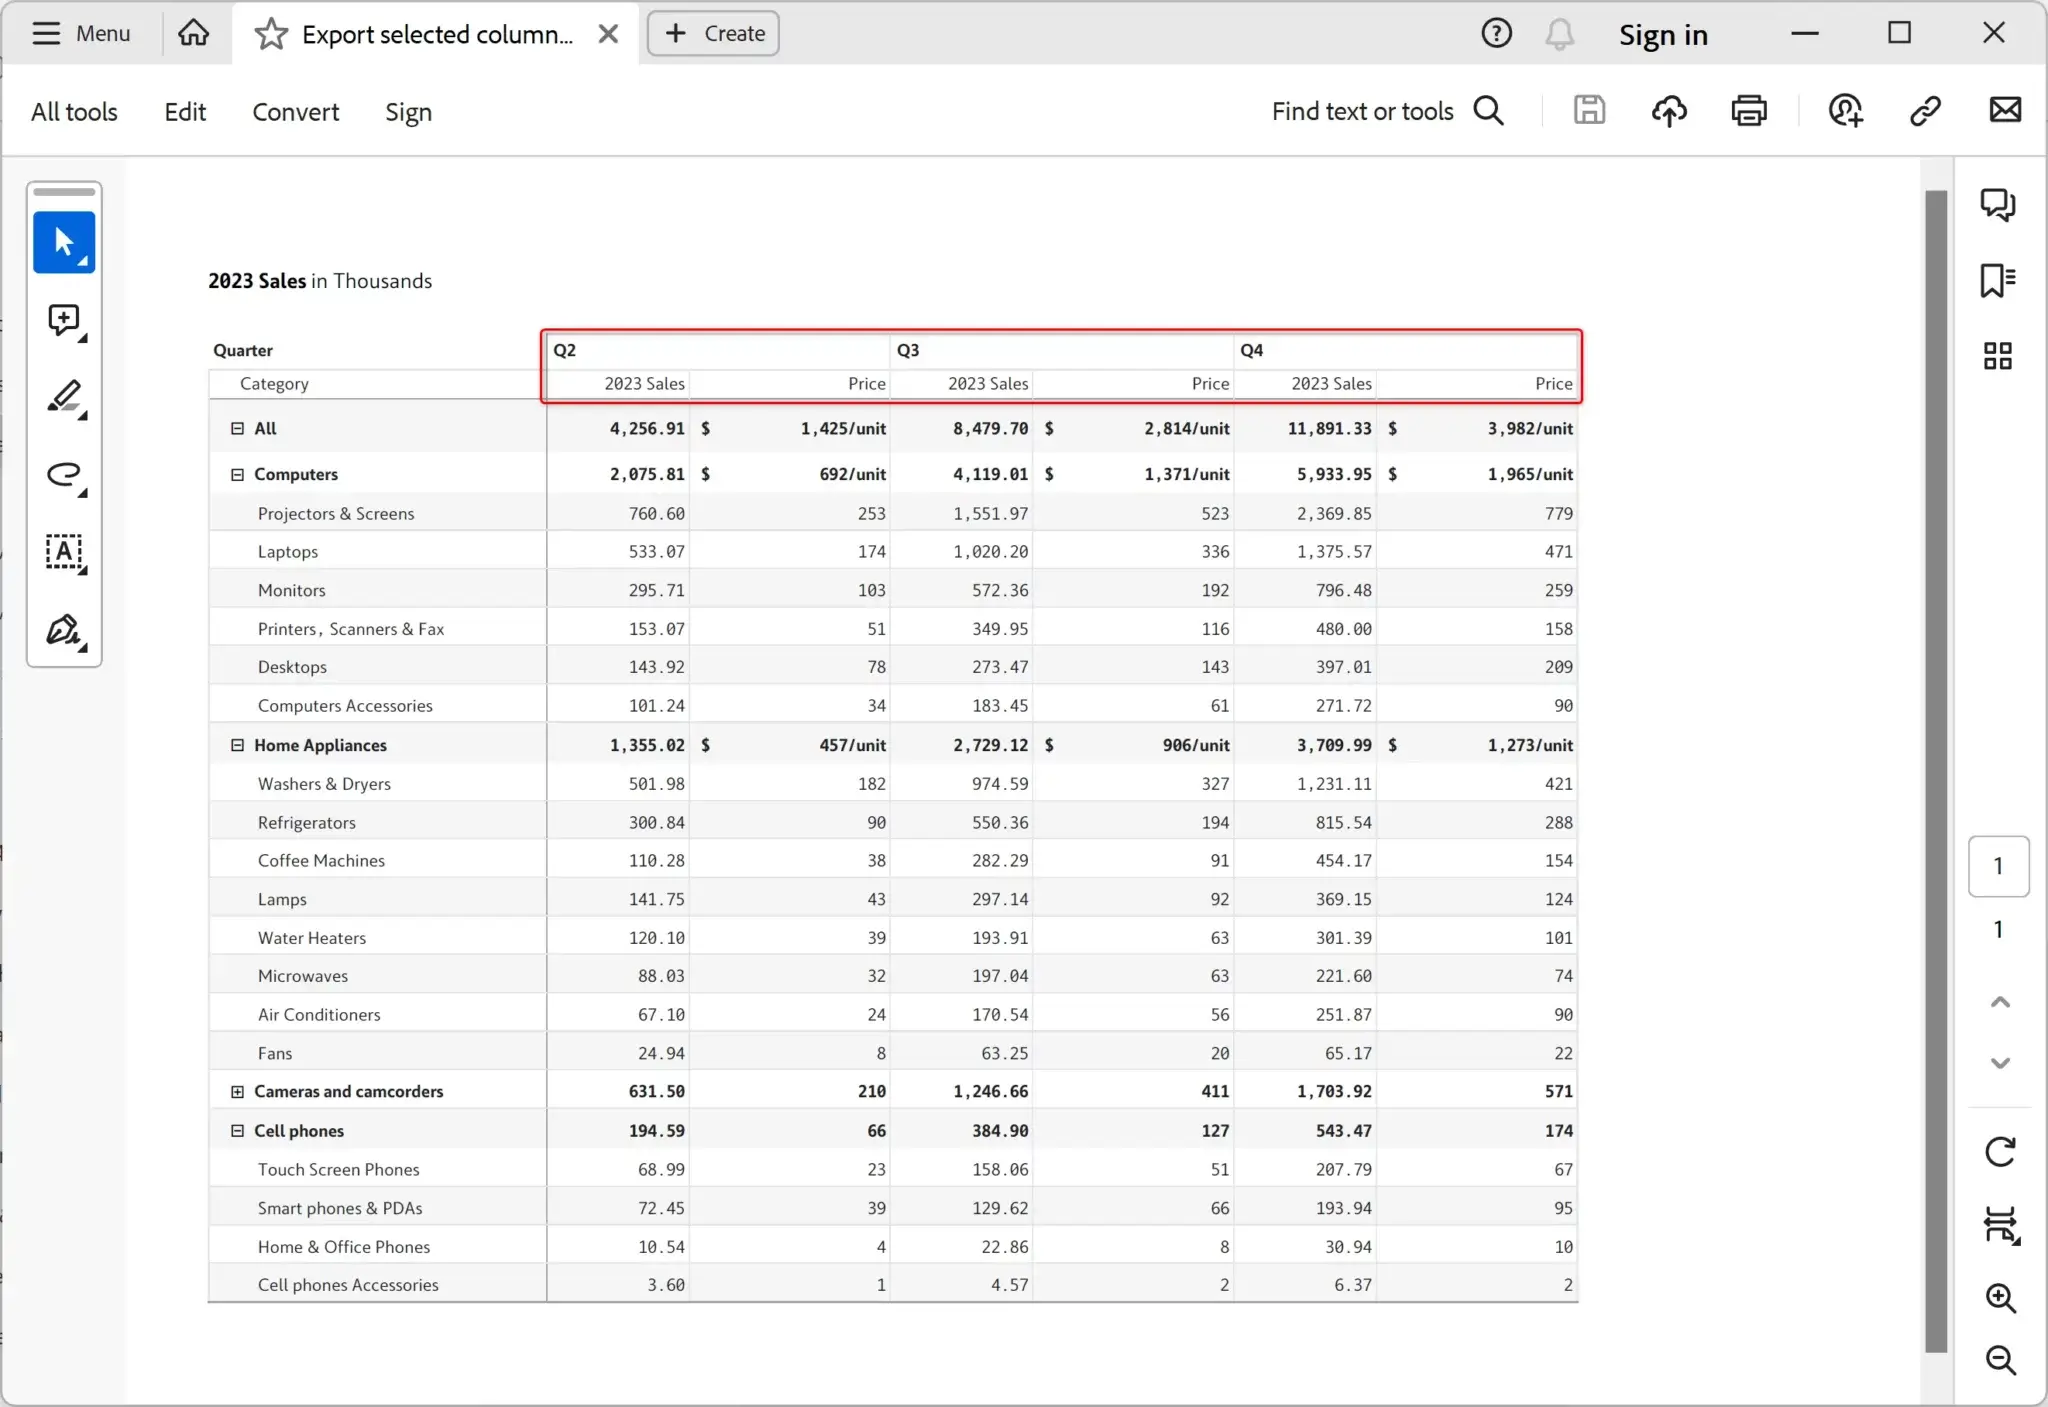
Export the entire table/matrix or select specific columns using the ‘Selected Columns’ option in the toolbar. In the following example, only the last three quarters are exported to the PDF file.
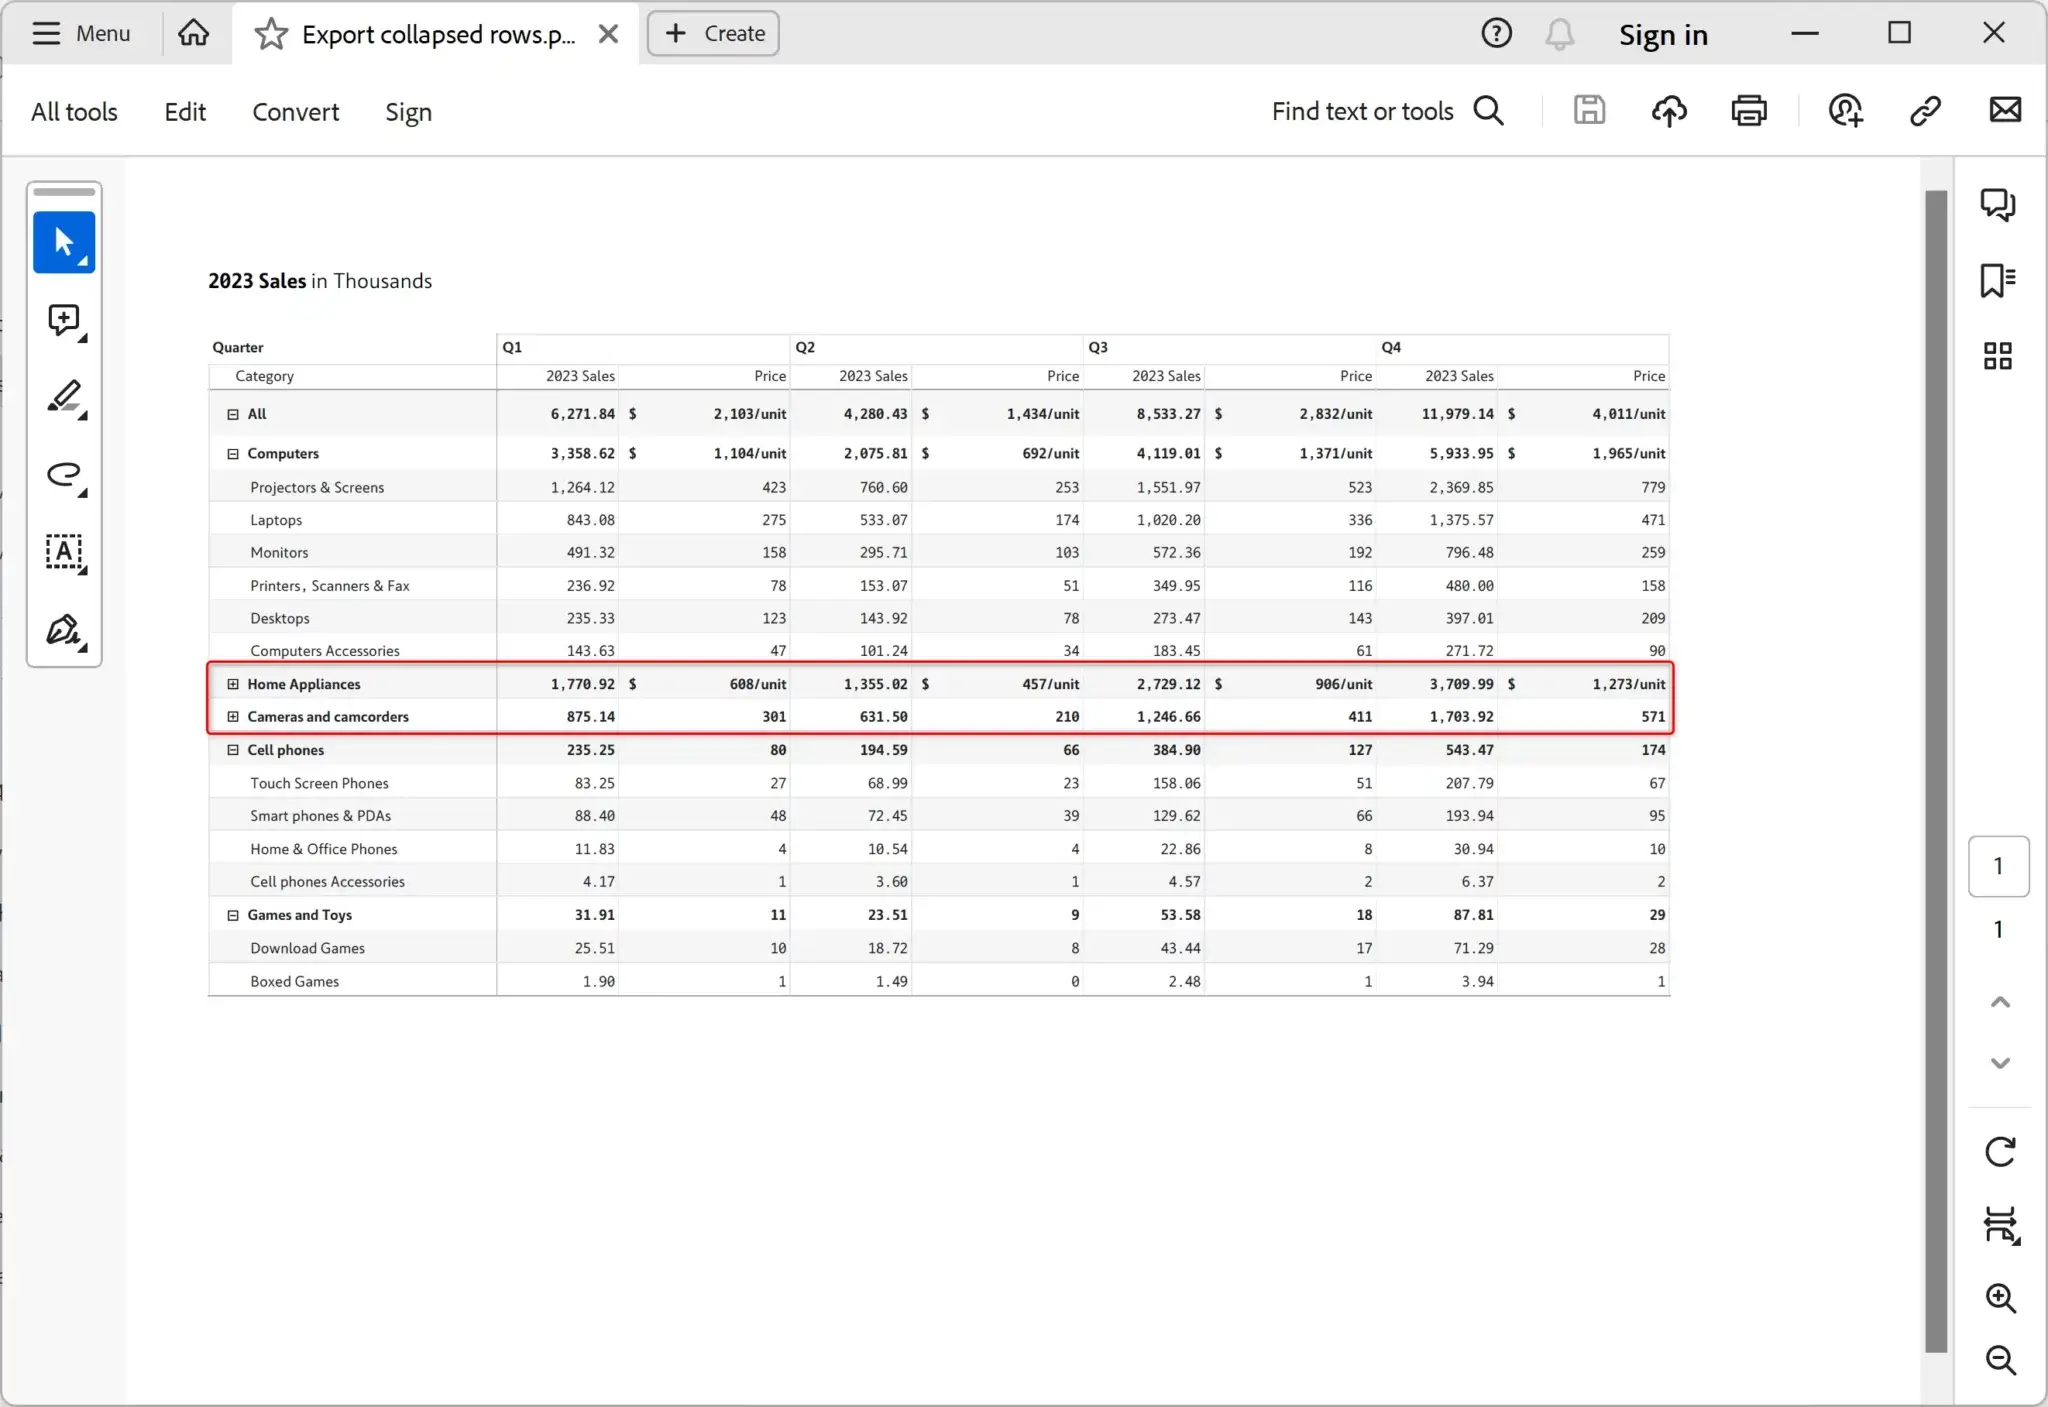
Notice that the rows under the Home Appliances and Camera and Camcorders categories are hidden in the PDF file, while other categories are expanded.
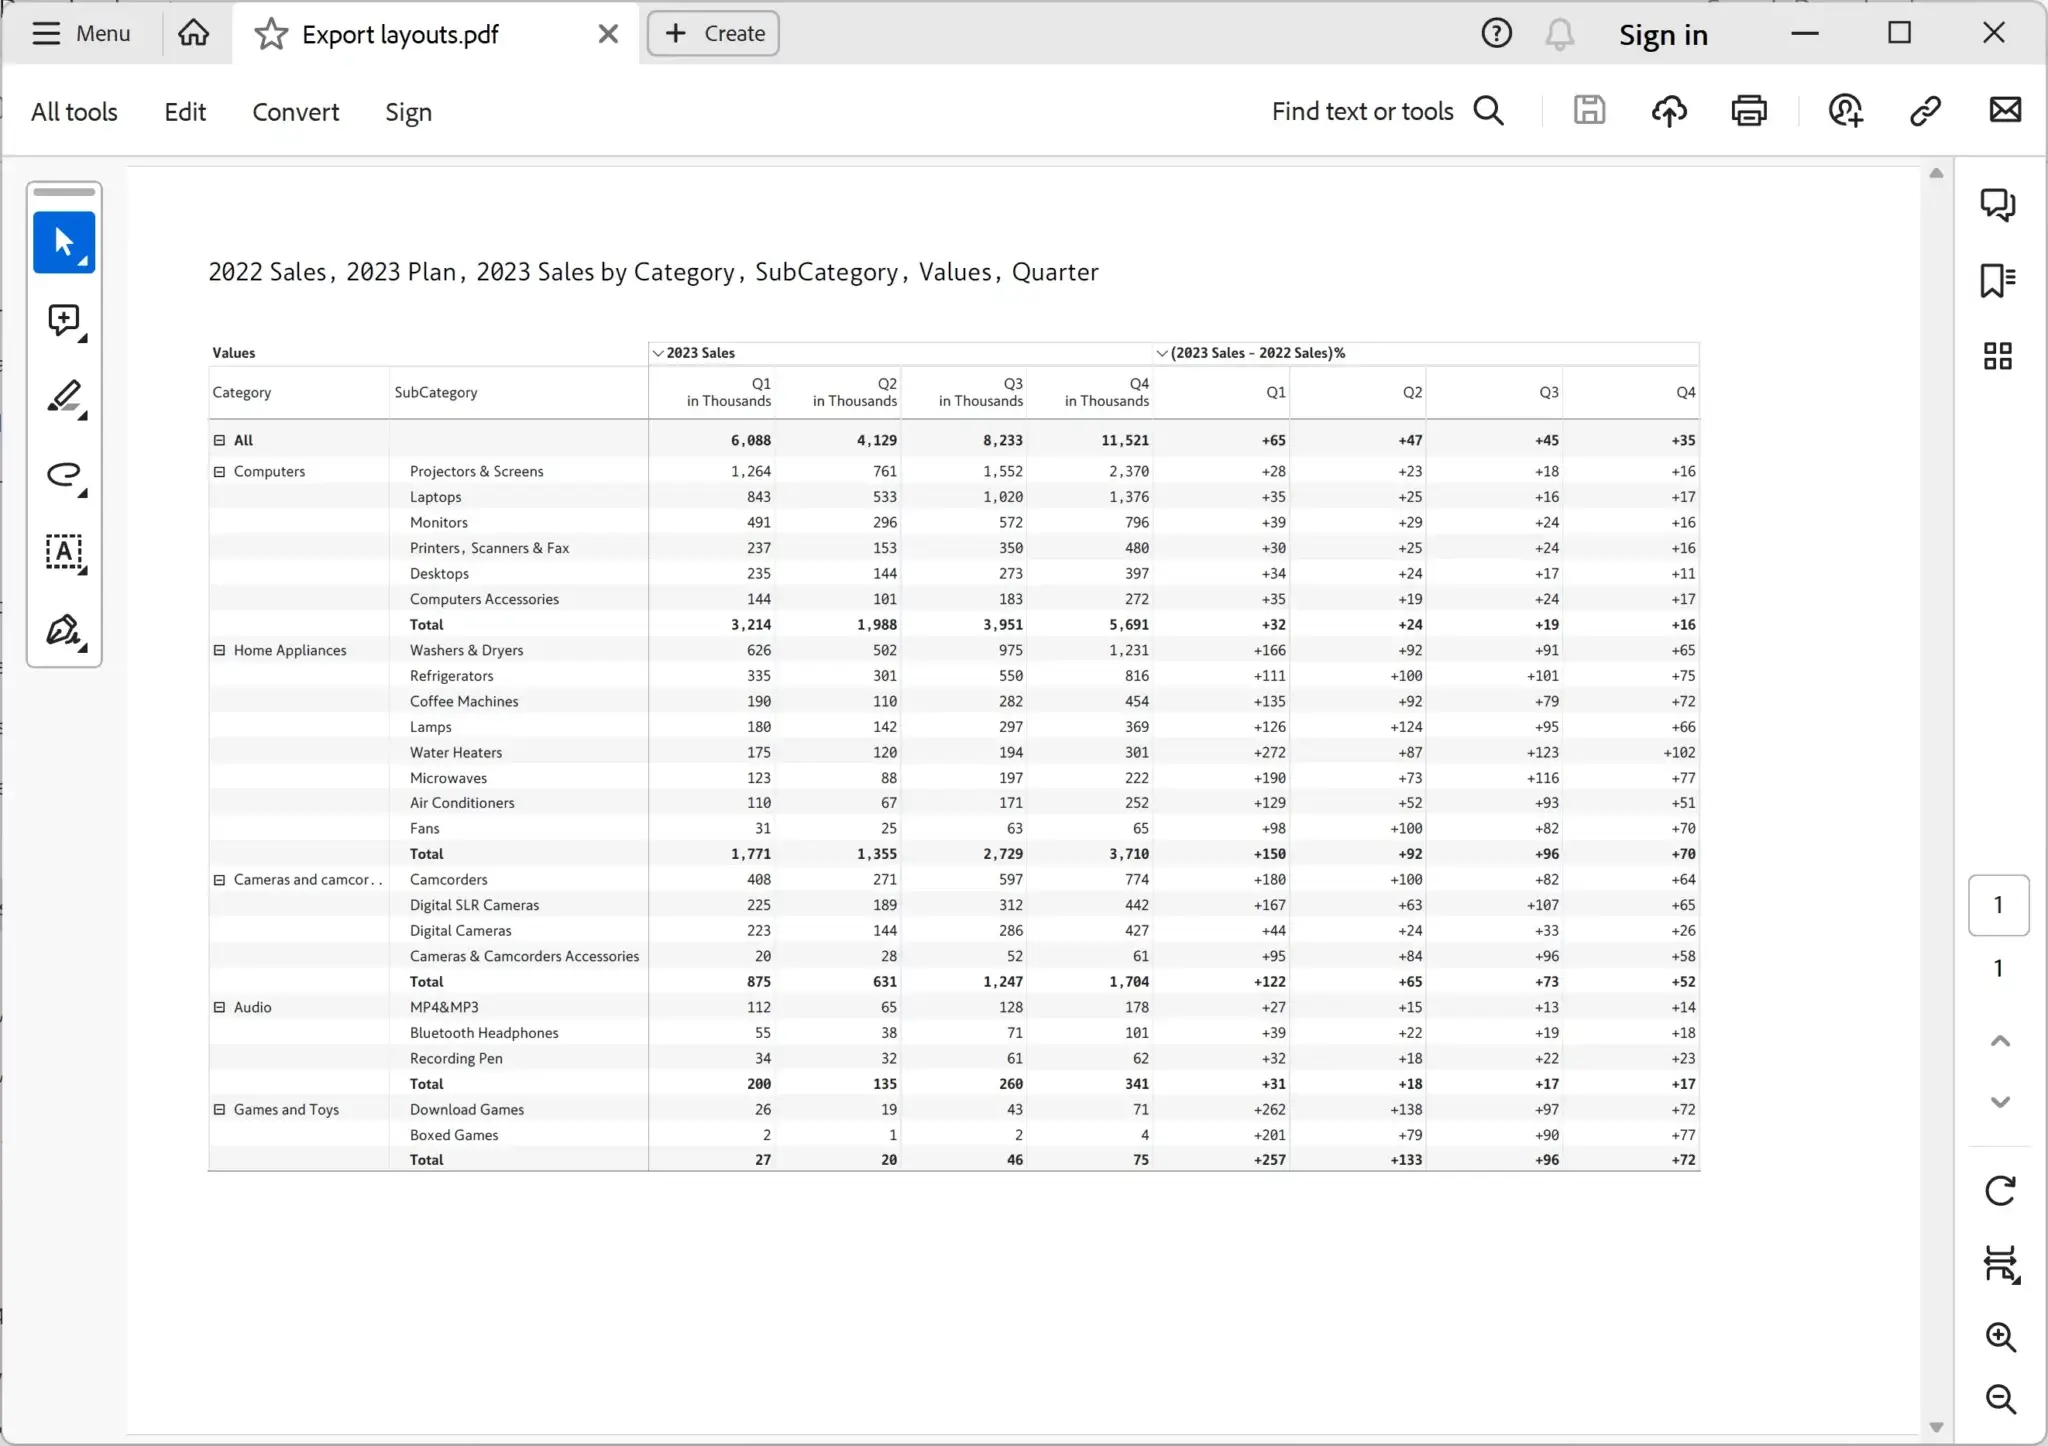
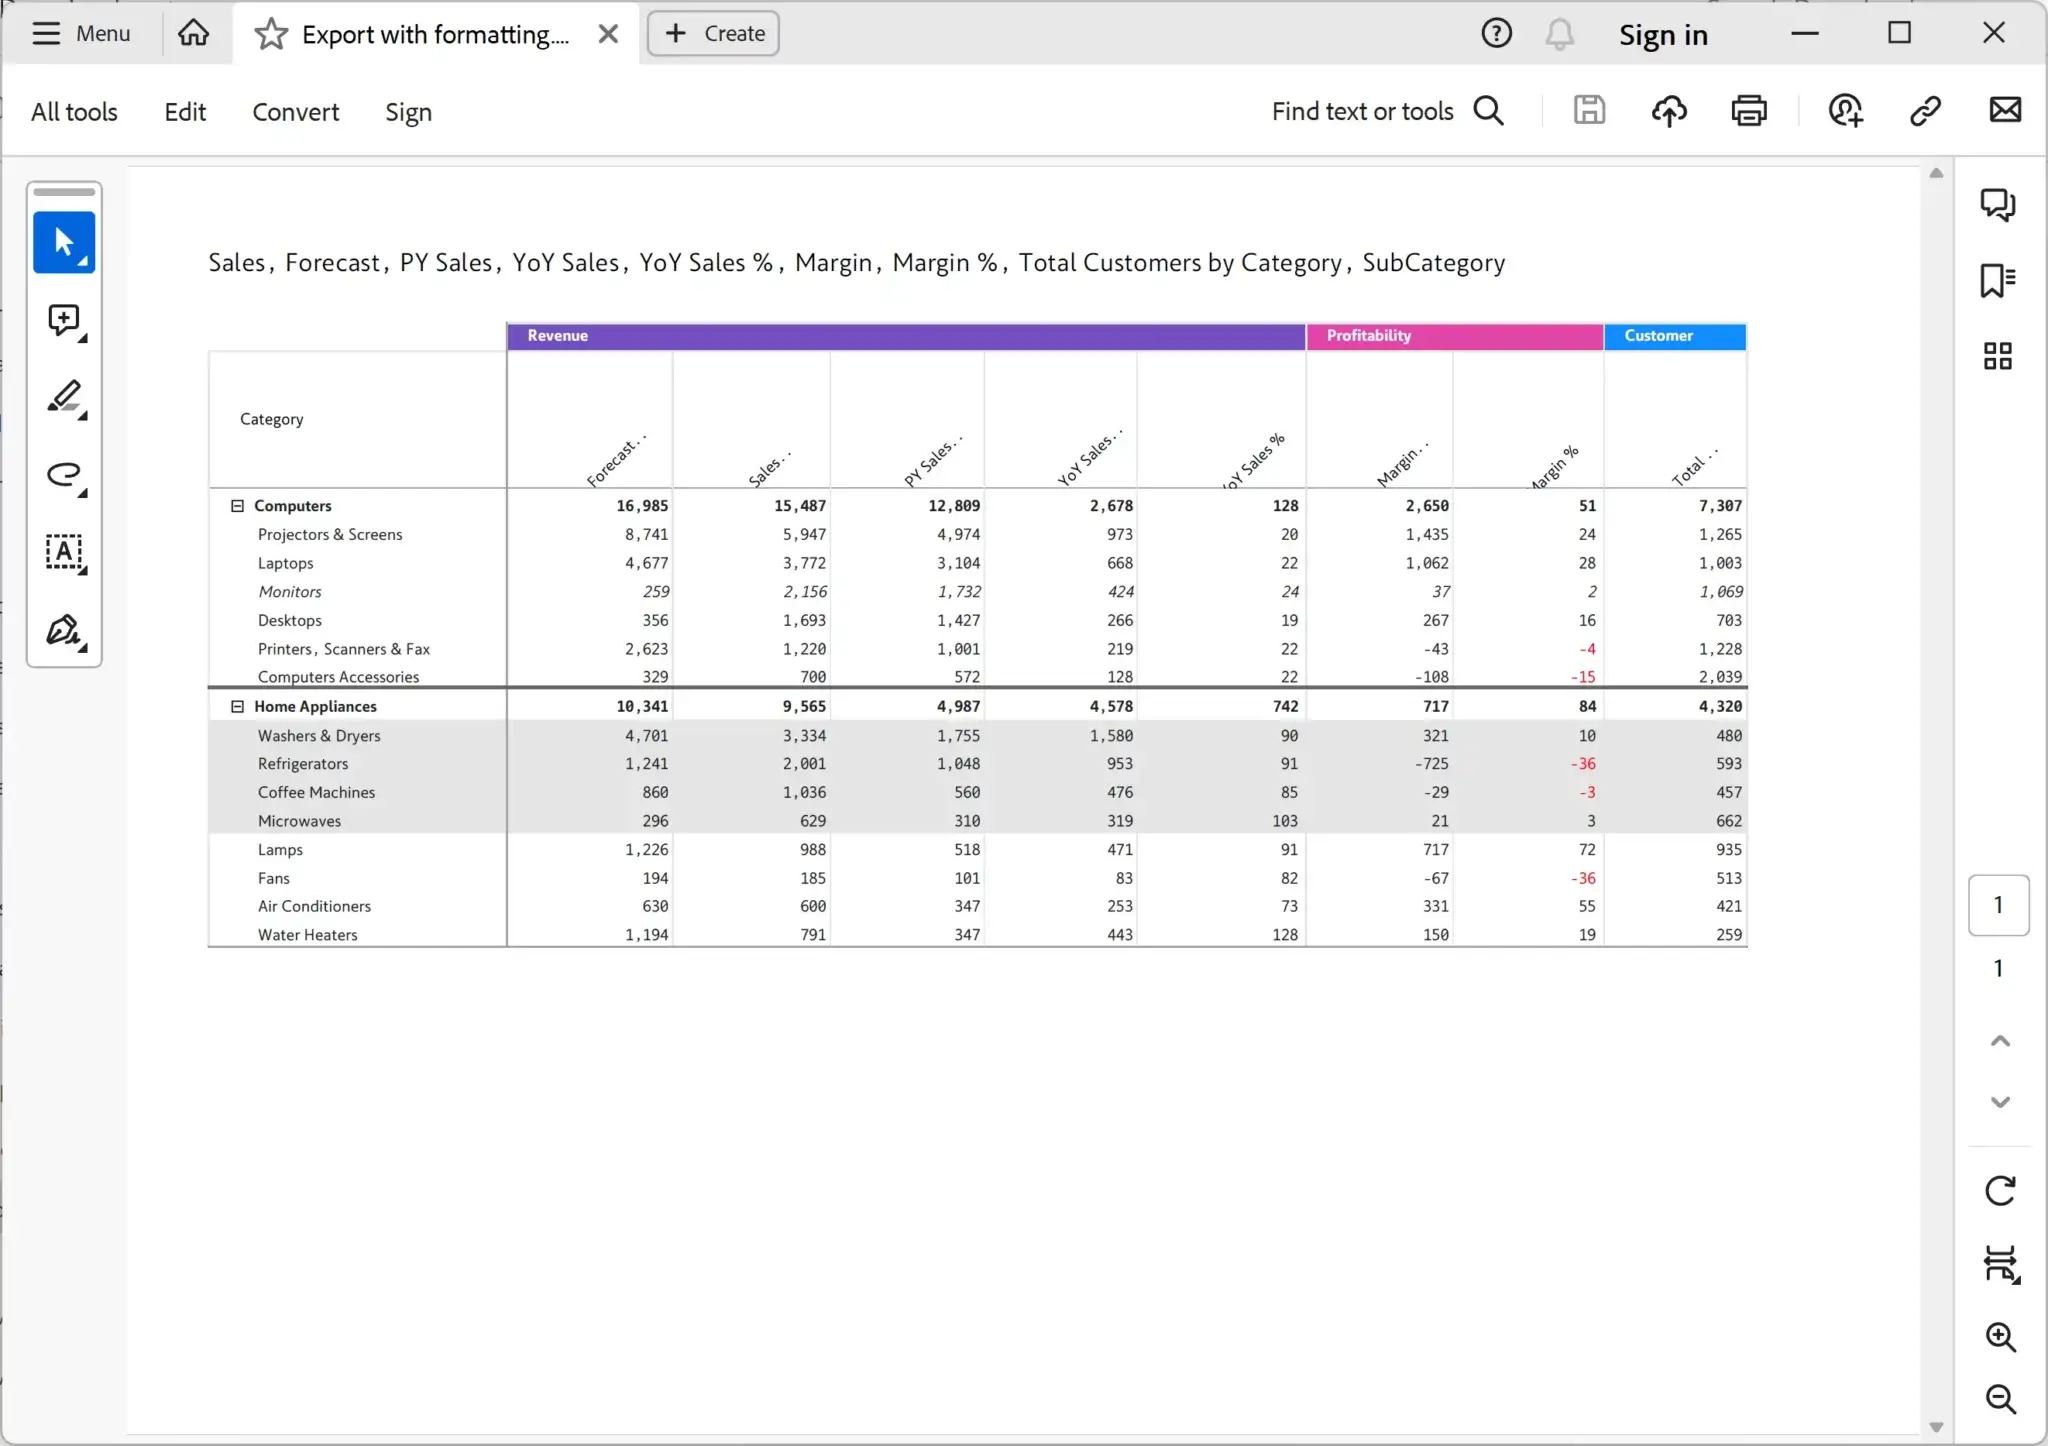
Successfully export a variety of table layouts (hierarchy, table, stepped, and drill down) and measure layouts (measures in rows and columns) to the exported PDF file. The following example shows a stepped layout with measures in columns.
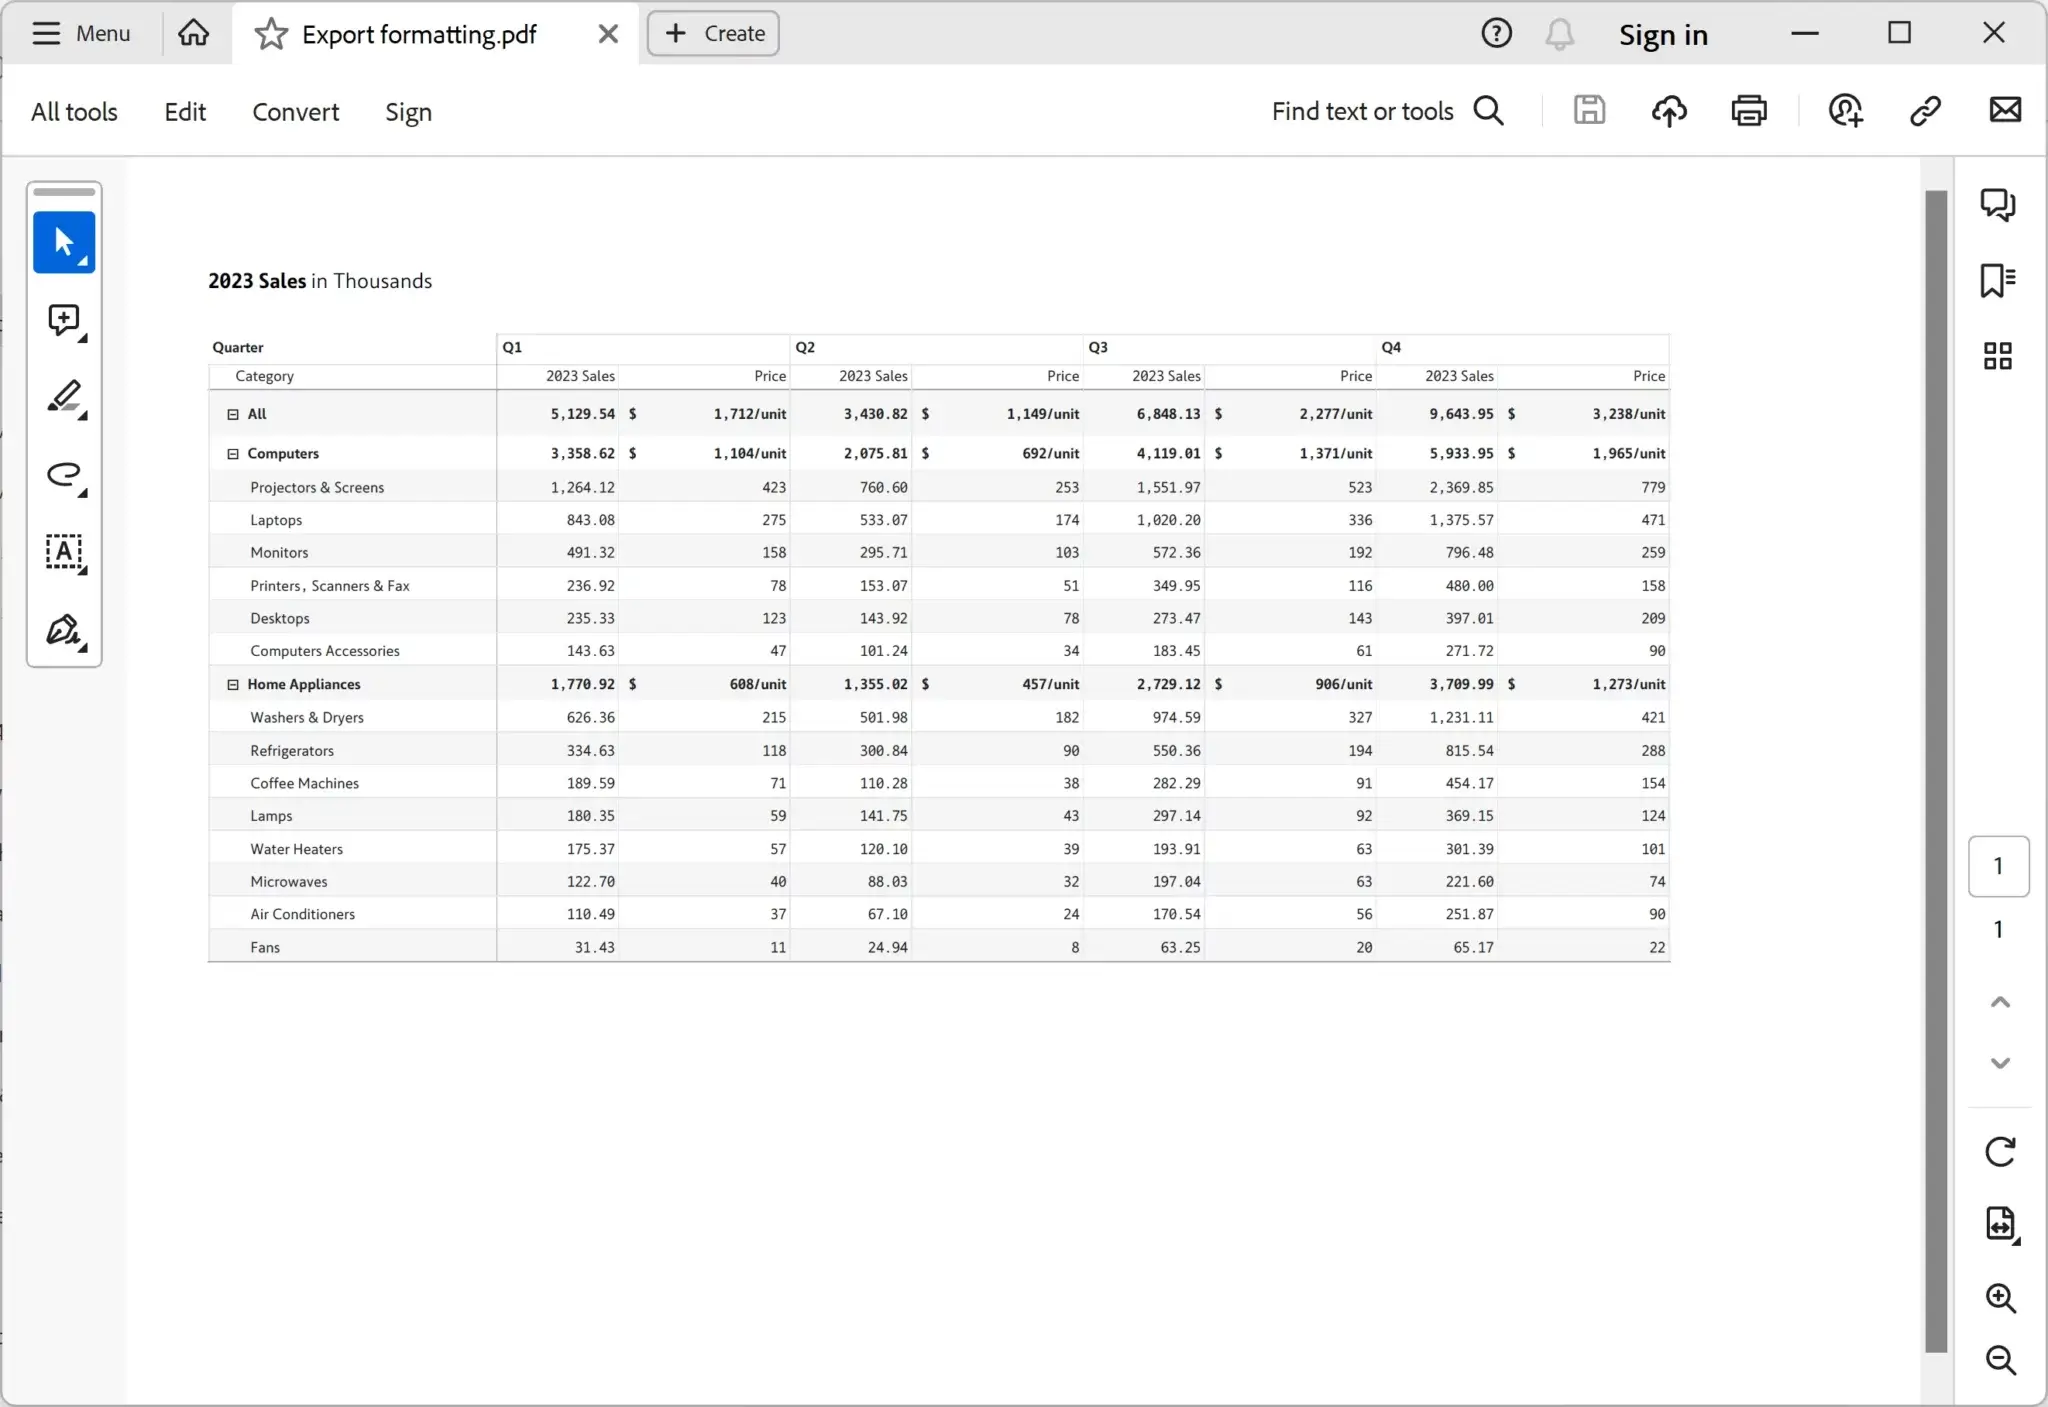
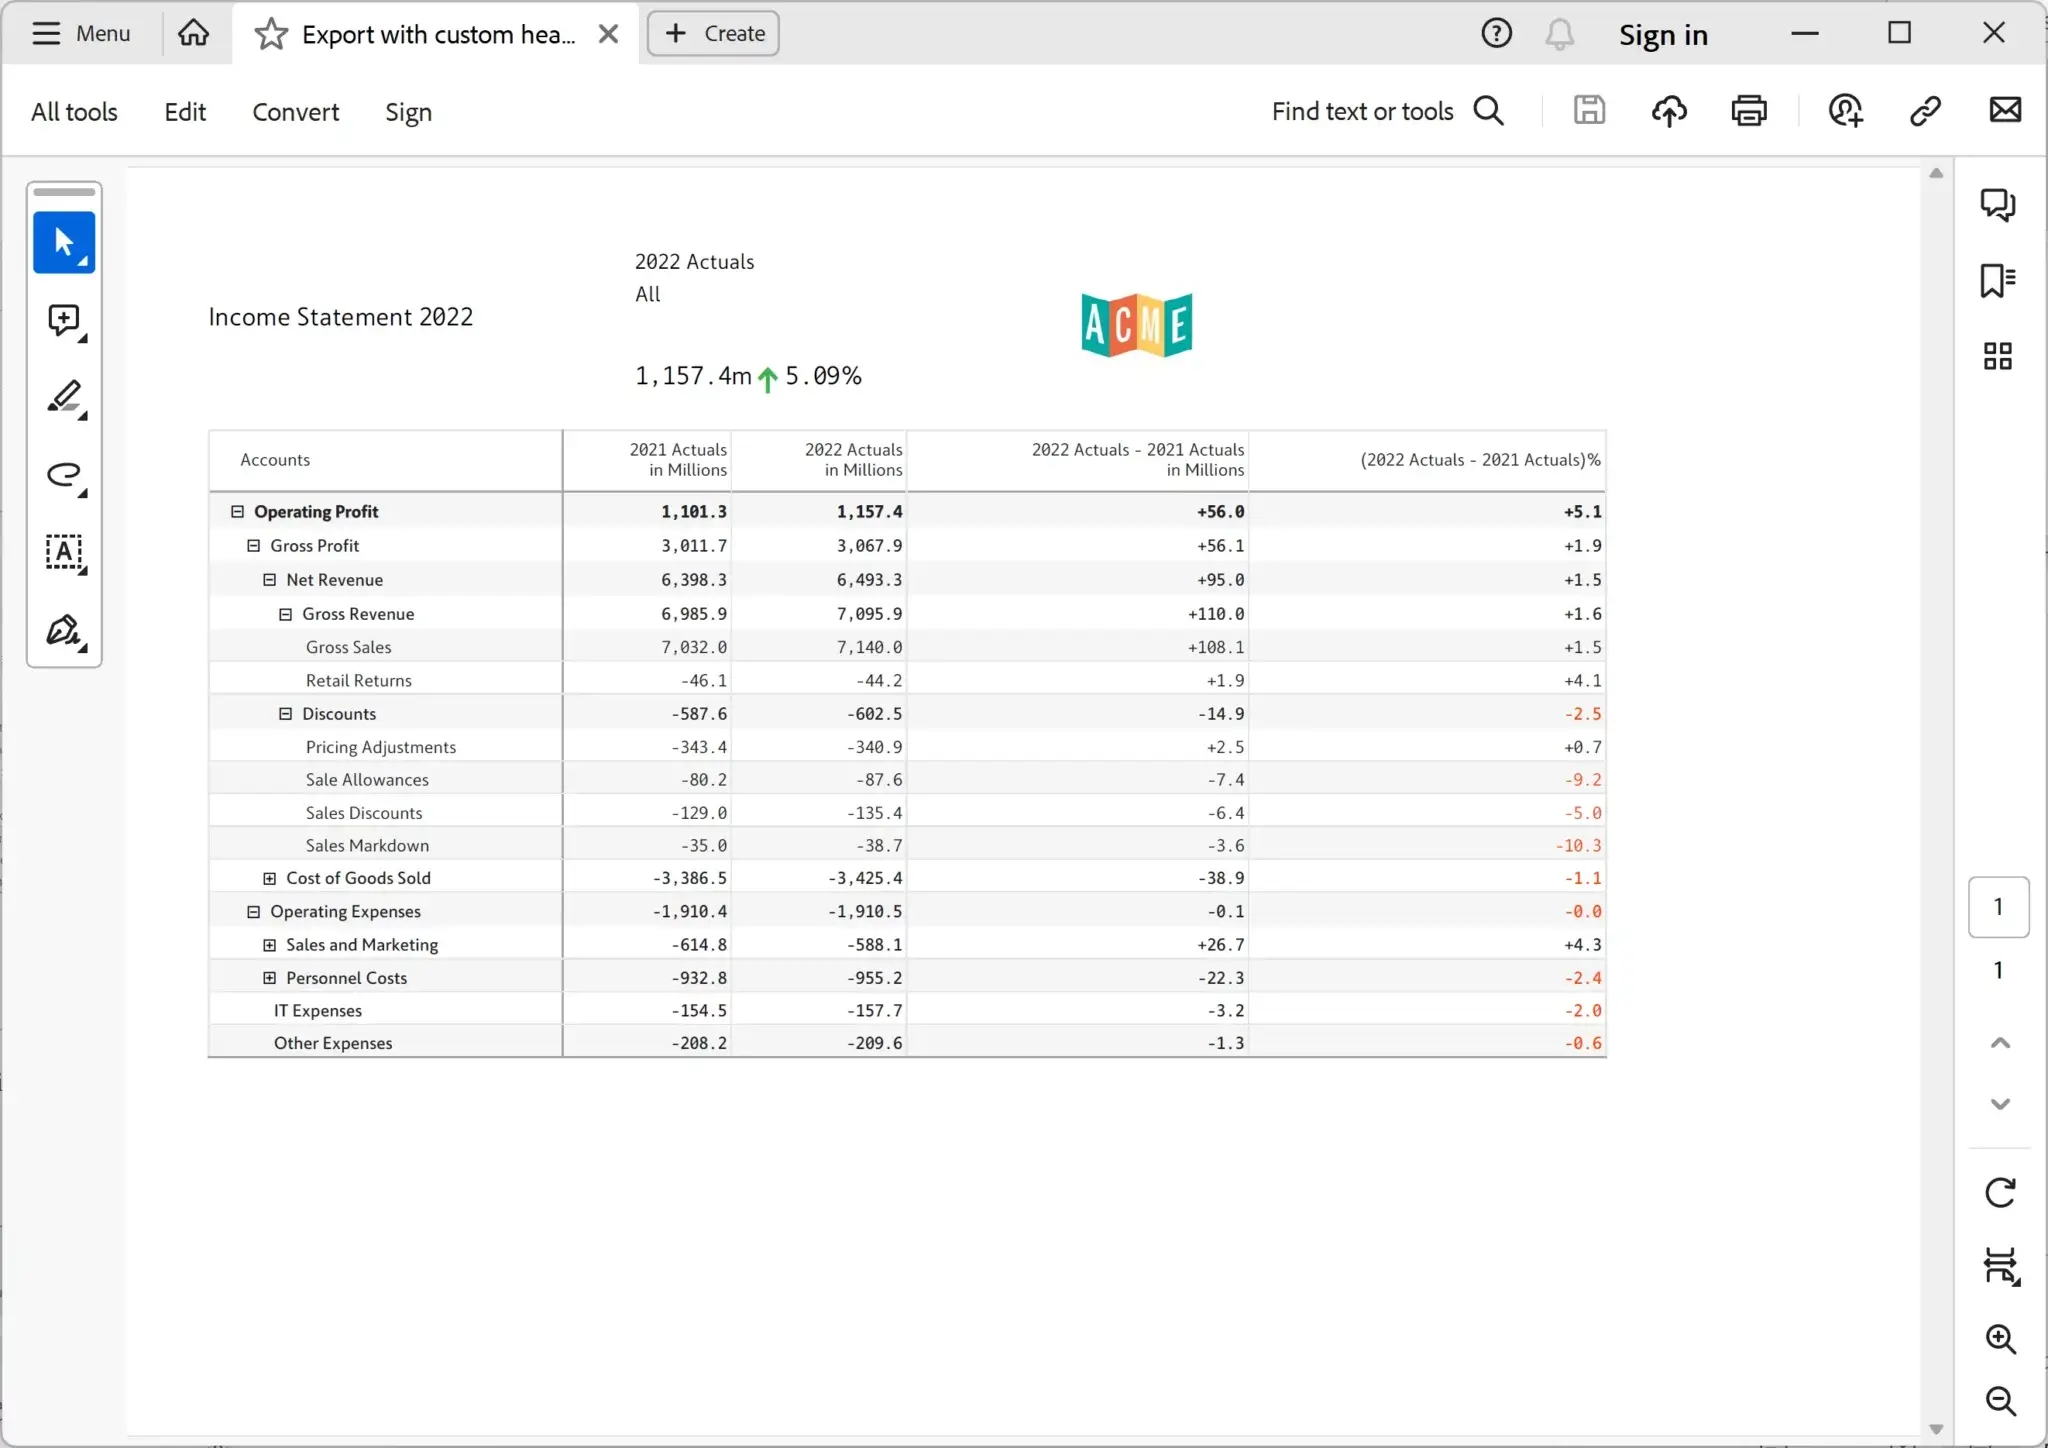
Retain scaling, decimal places, prefix/suffix items as you export to PDF. Observe how the table header shows values in thousands, and notice the prefix ($) and suffix (/unit) in some of the values
The example below shows a sales report with different background colors for column groups, borders, background, and font colors. Also, notice the tilted measure headers.
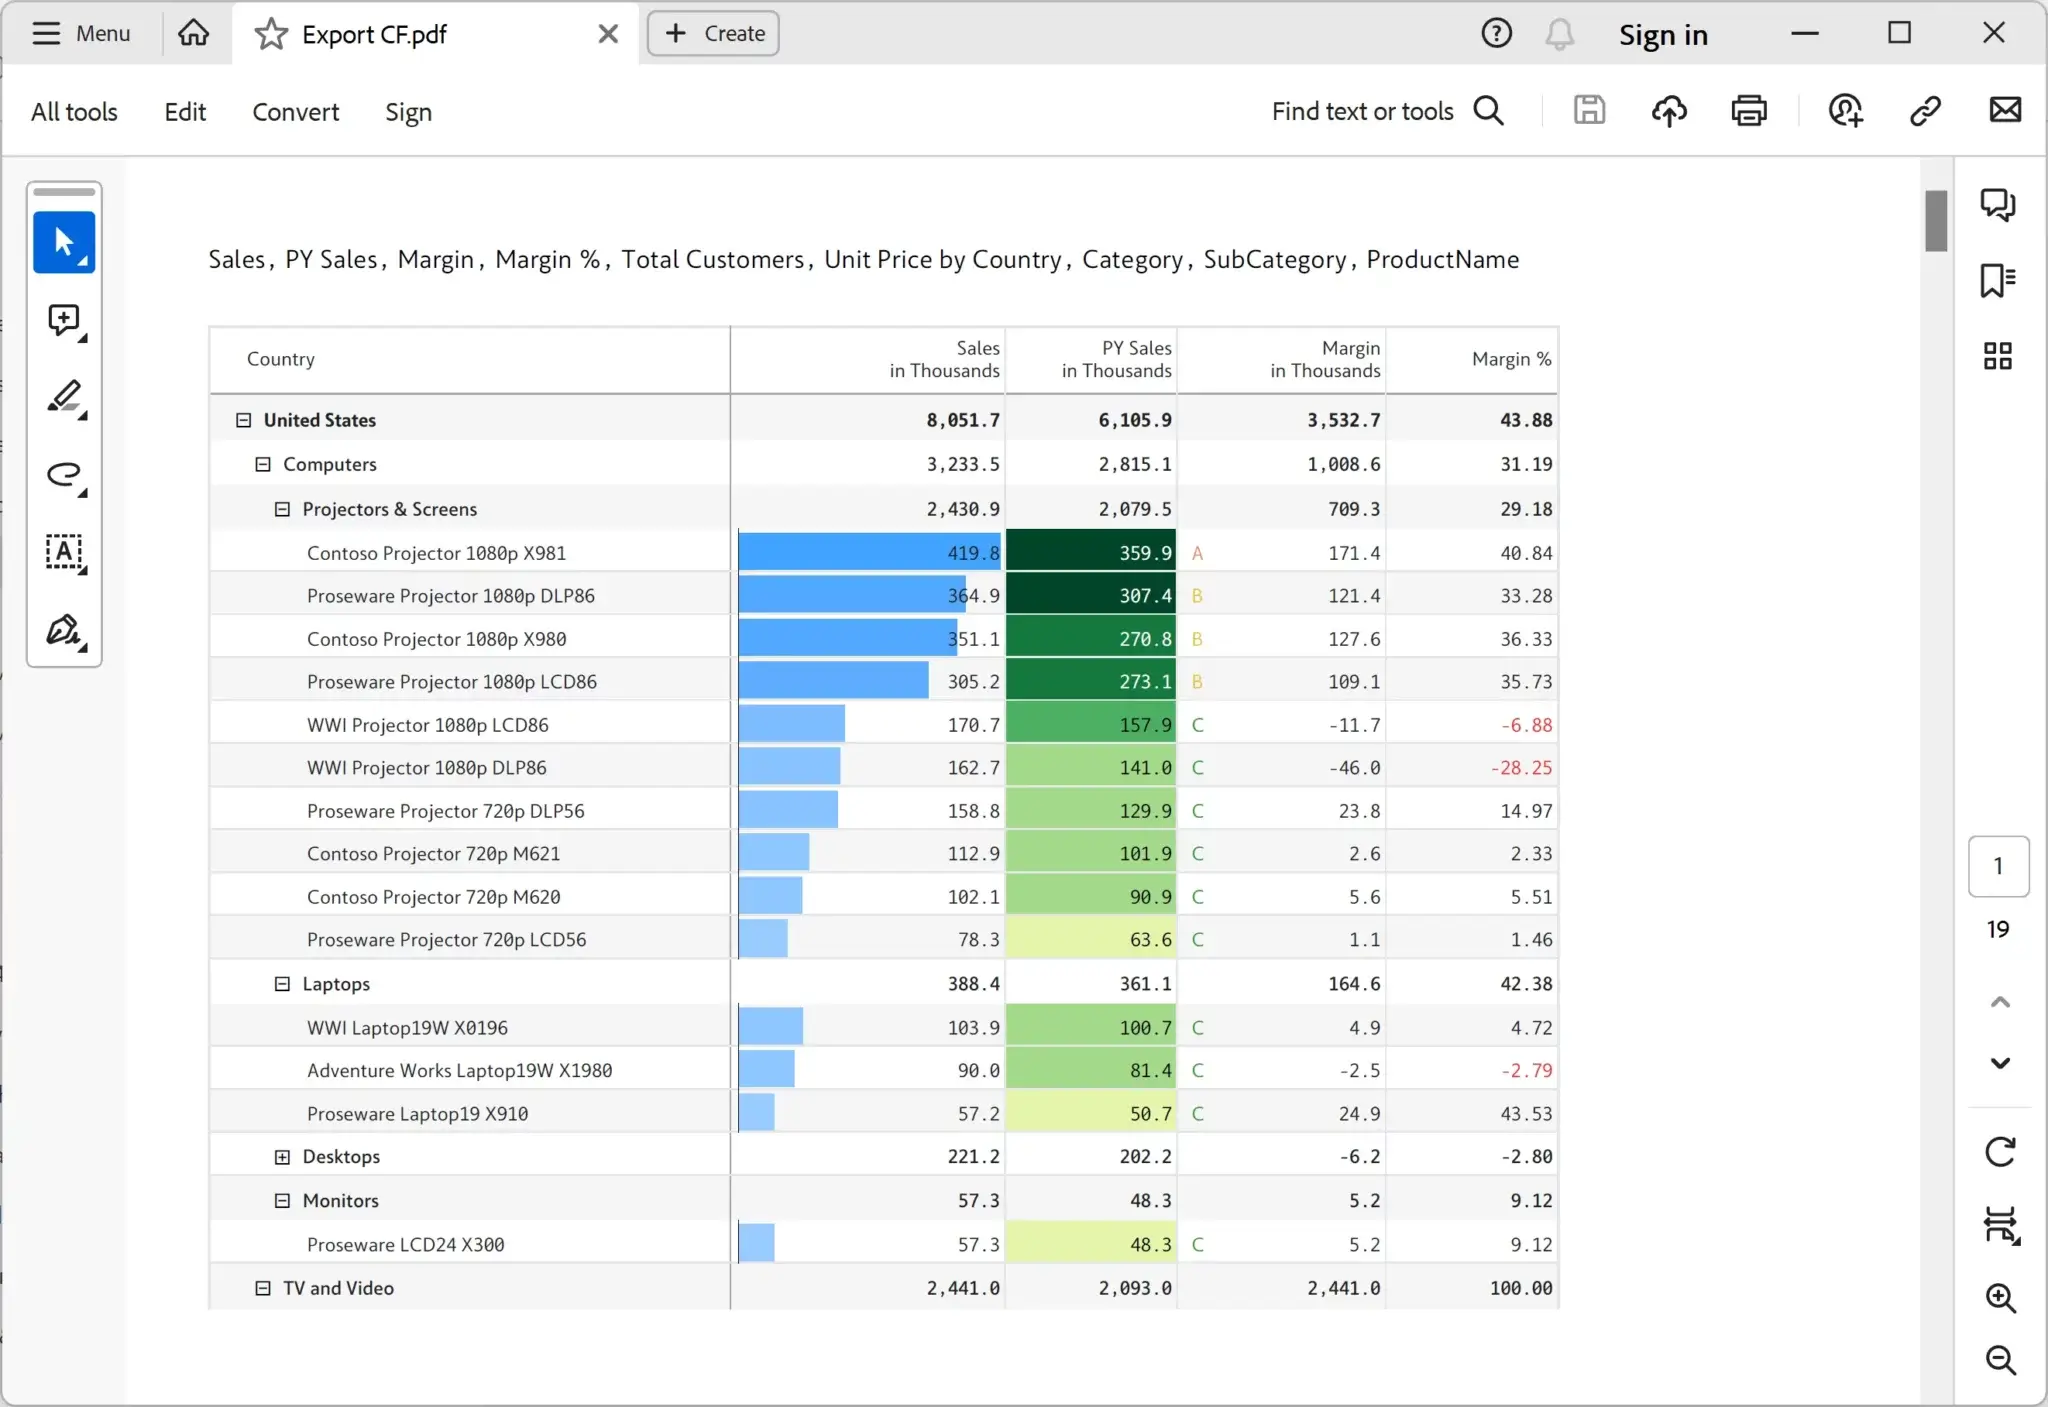
Export reports along with conditional formatting to PDF file. The image below shows data bars (Sales column), color scales for the background (PY Sales), ABC classification (Margin), and semantic formatting (Margin %).
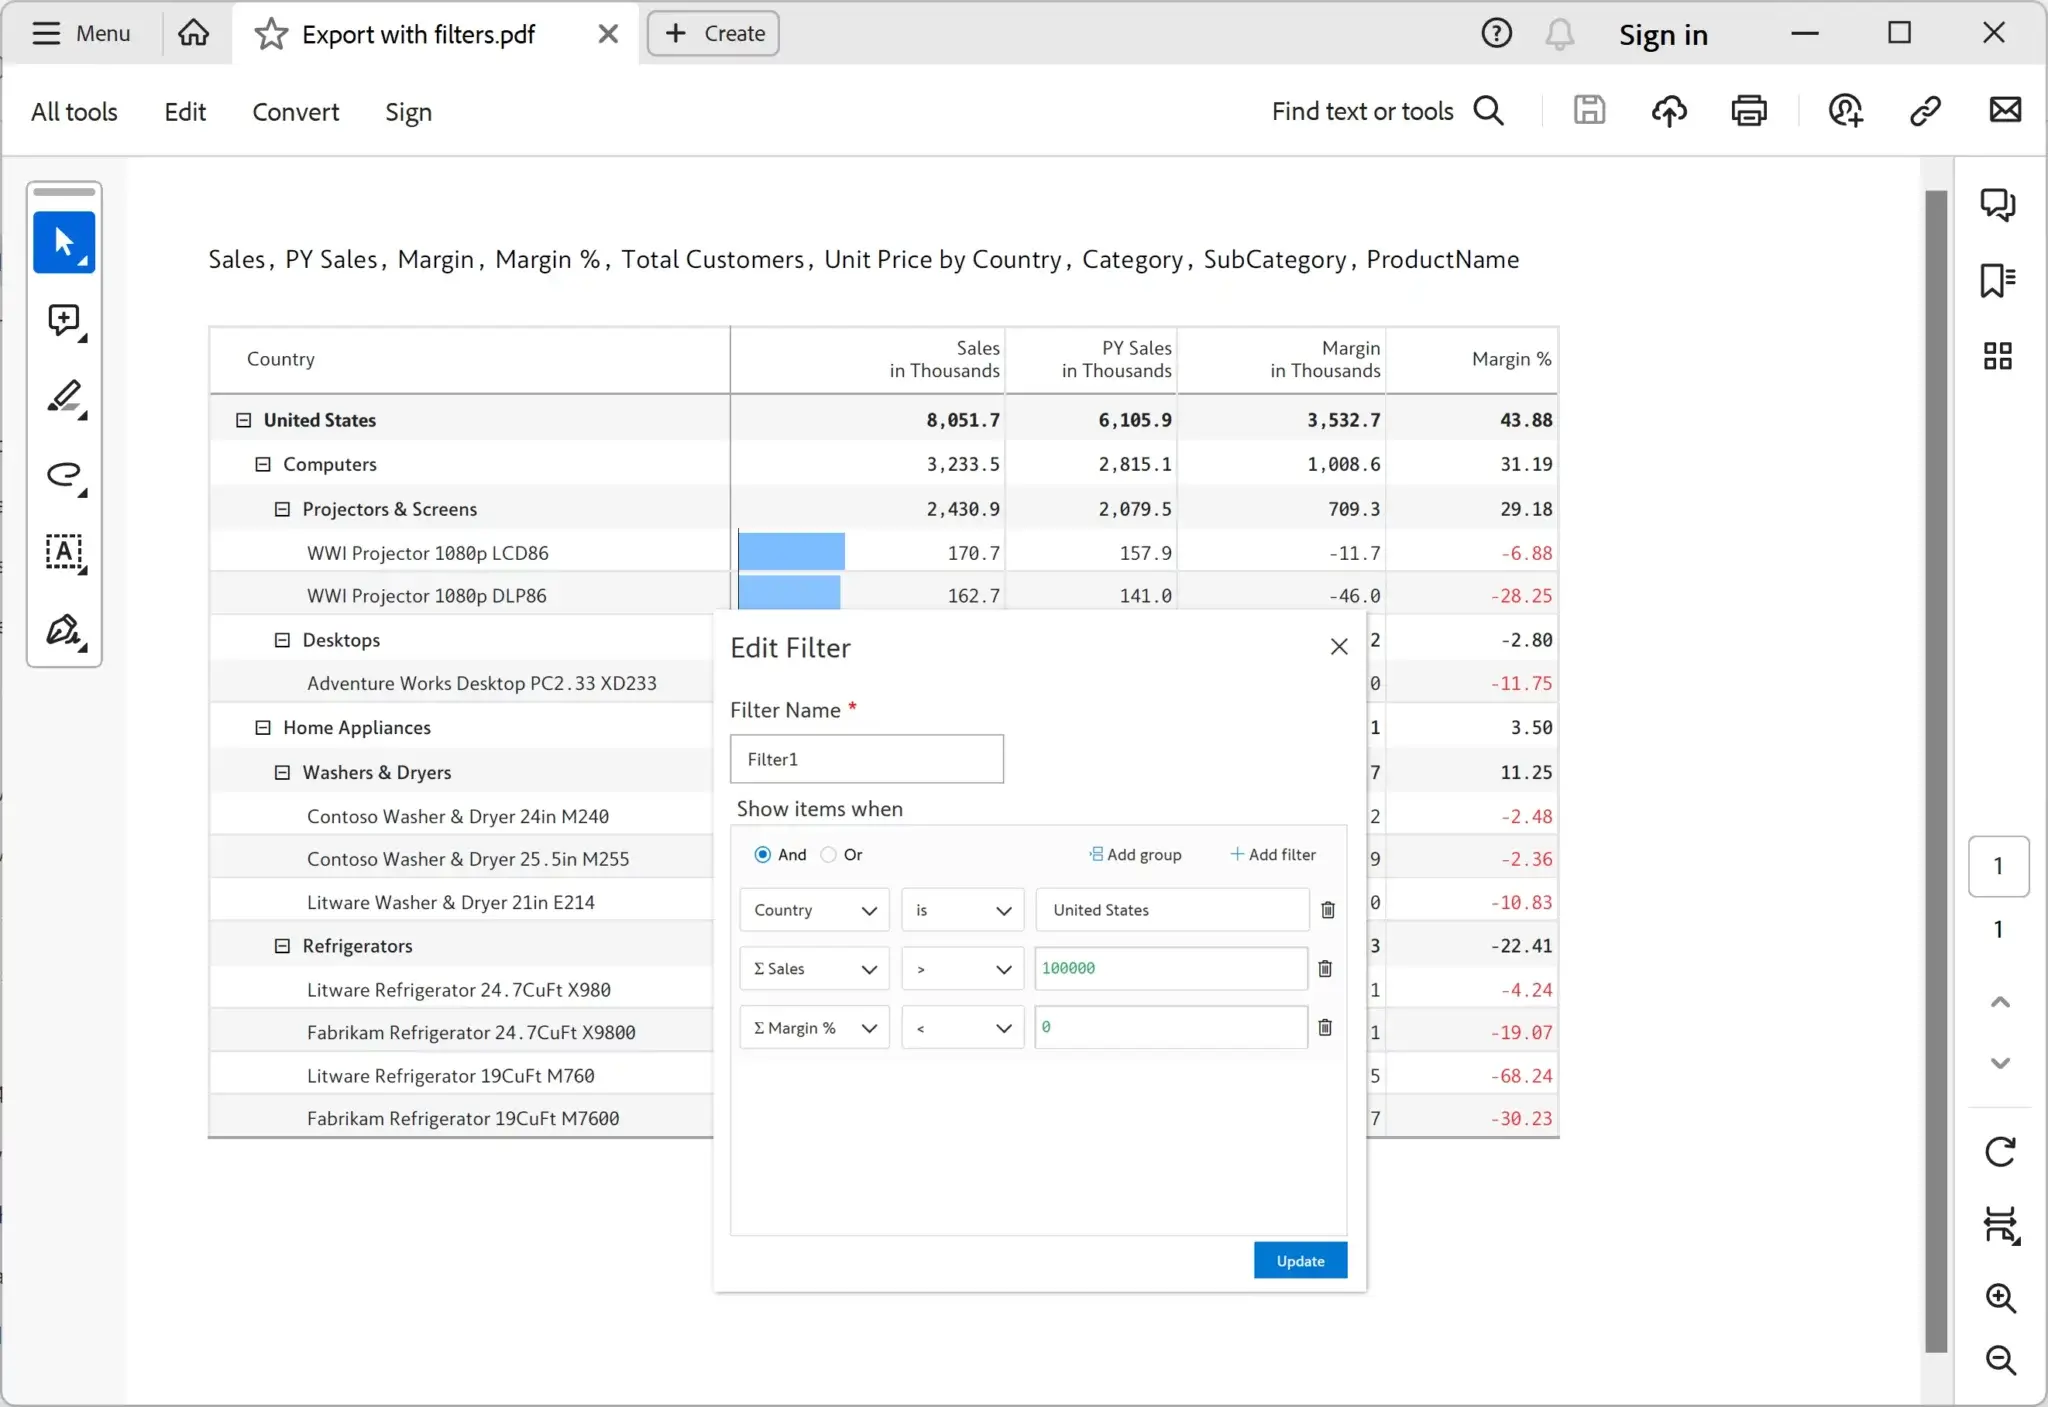
The advanced and nested (and/or) filters applied to the table are retained when exporting to a PDF file. The image below shows only the products with sales above 100k and positive margin% in the United States.
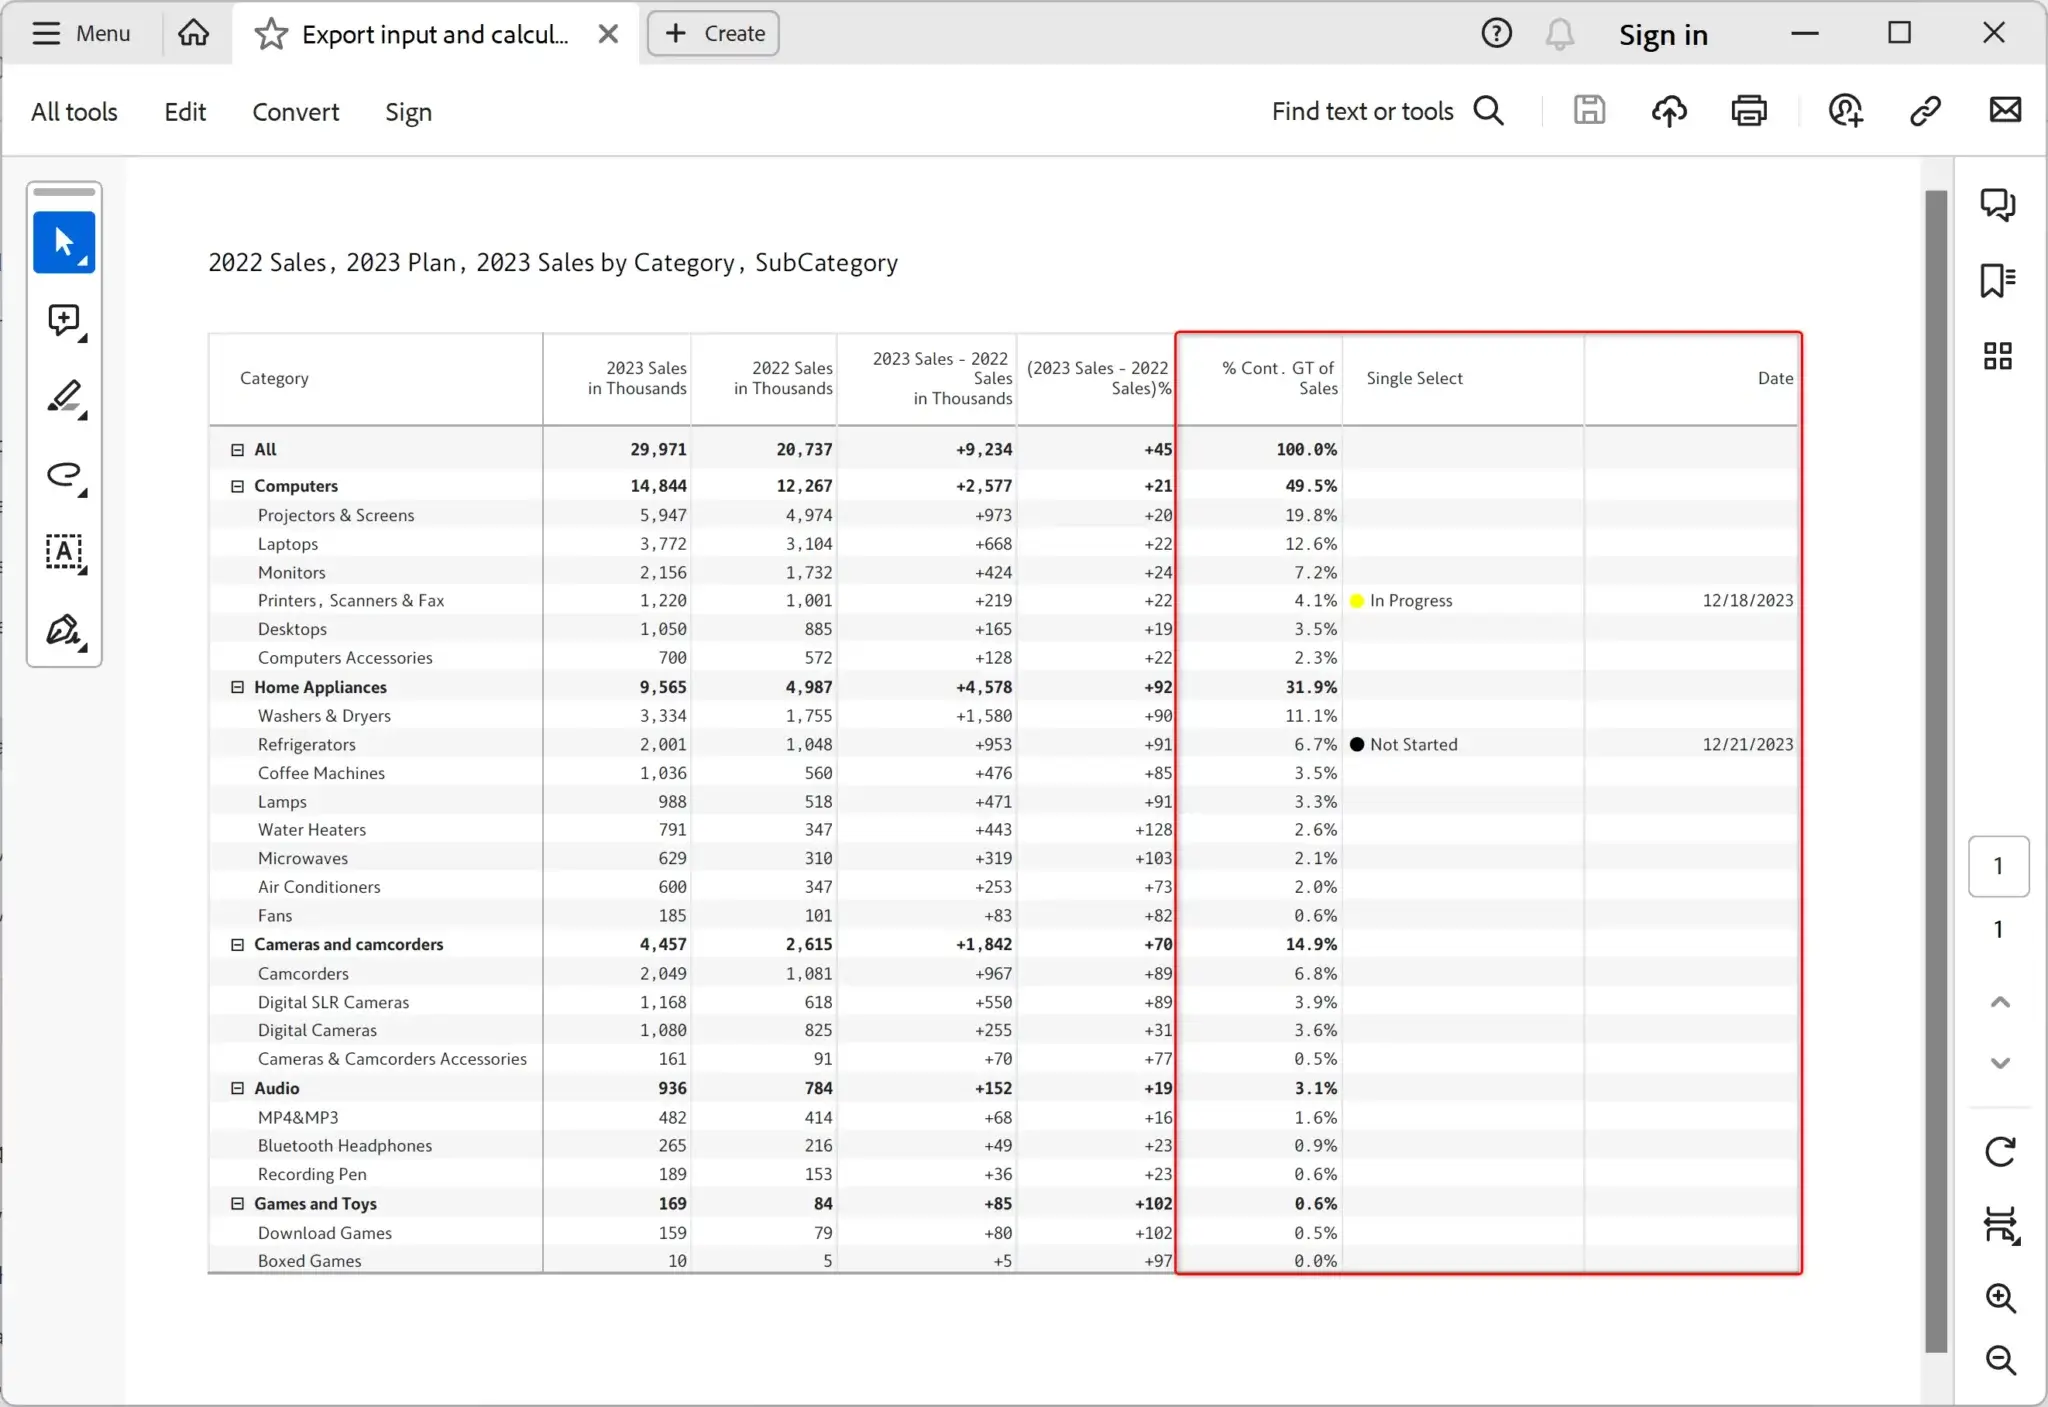
Manual data entry and calculated columns, measures, and rows created by the user in the visual can be exported to the PDF file.
Export report headers with charts, KPI cards, and images seamlessly to the PDF file.
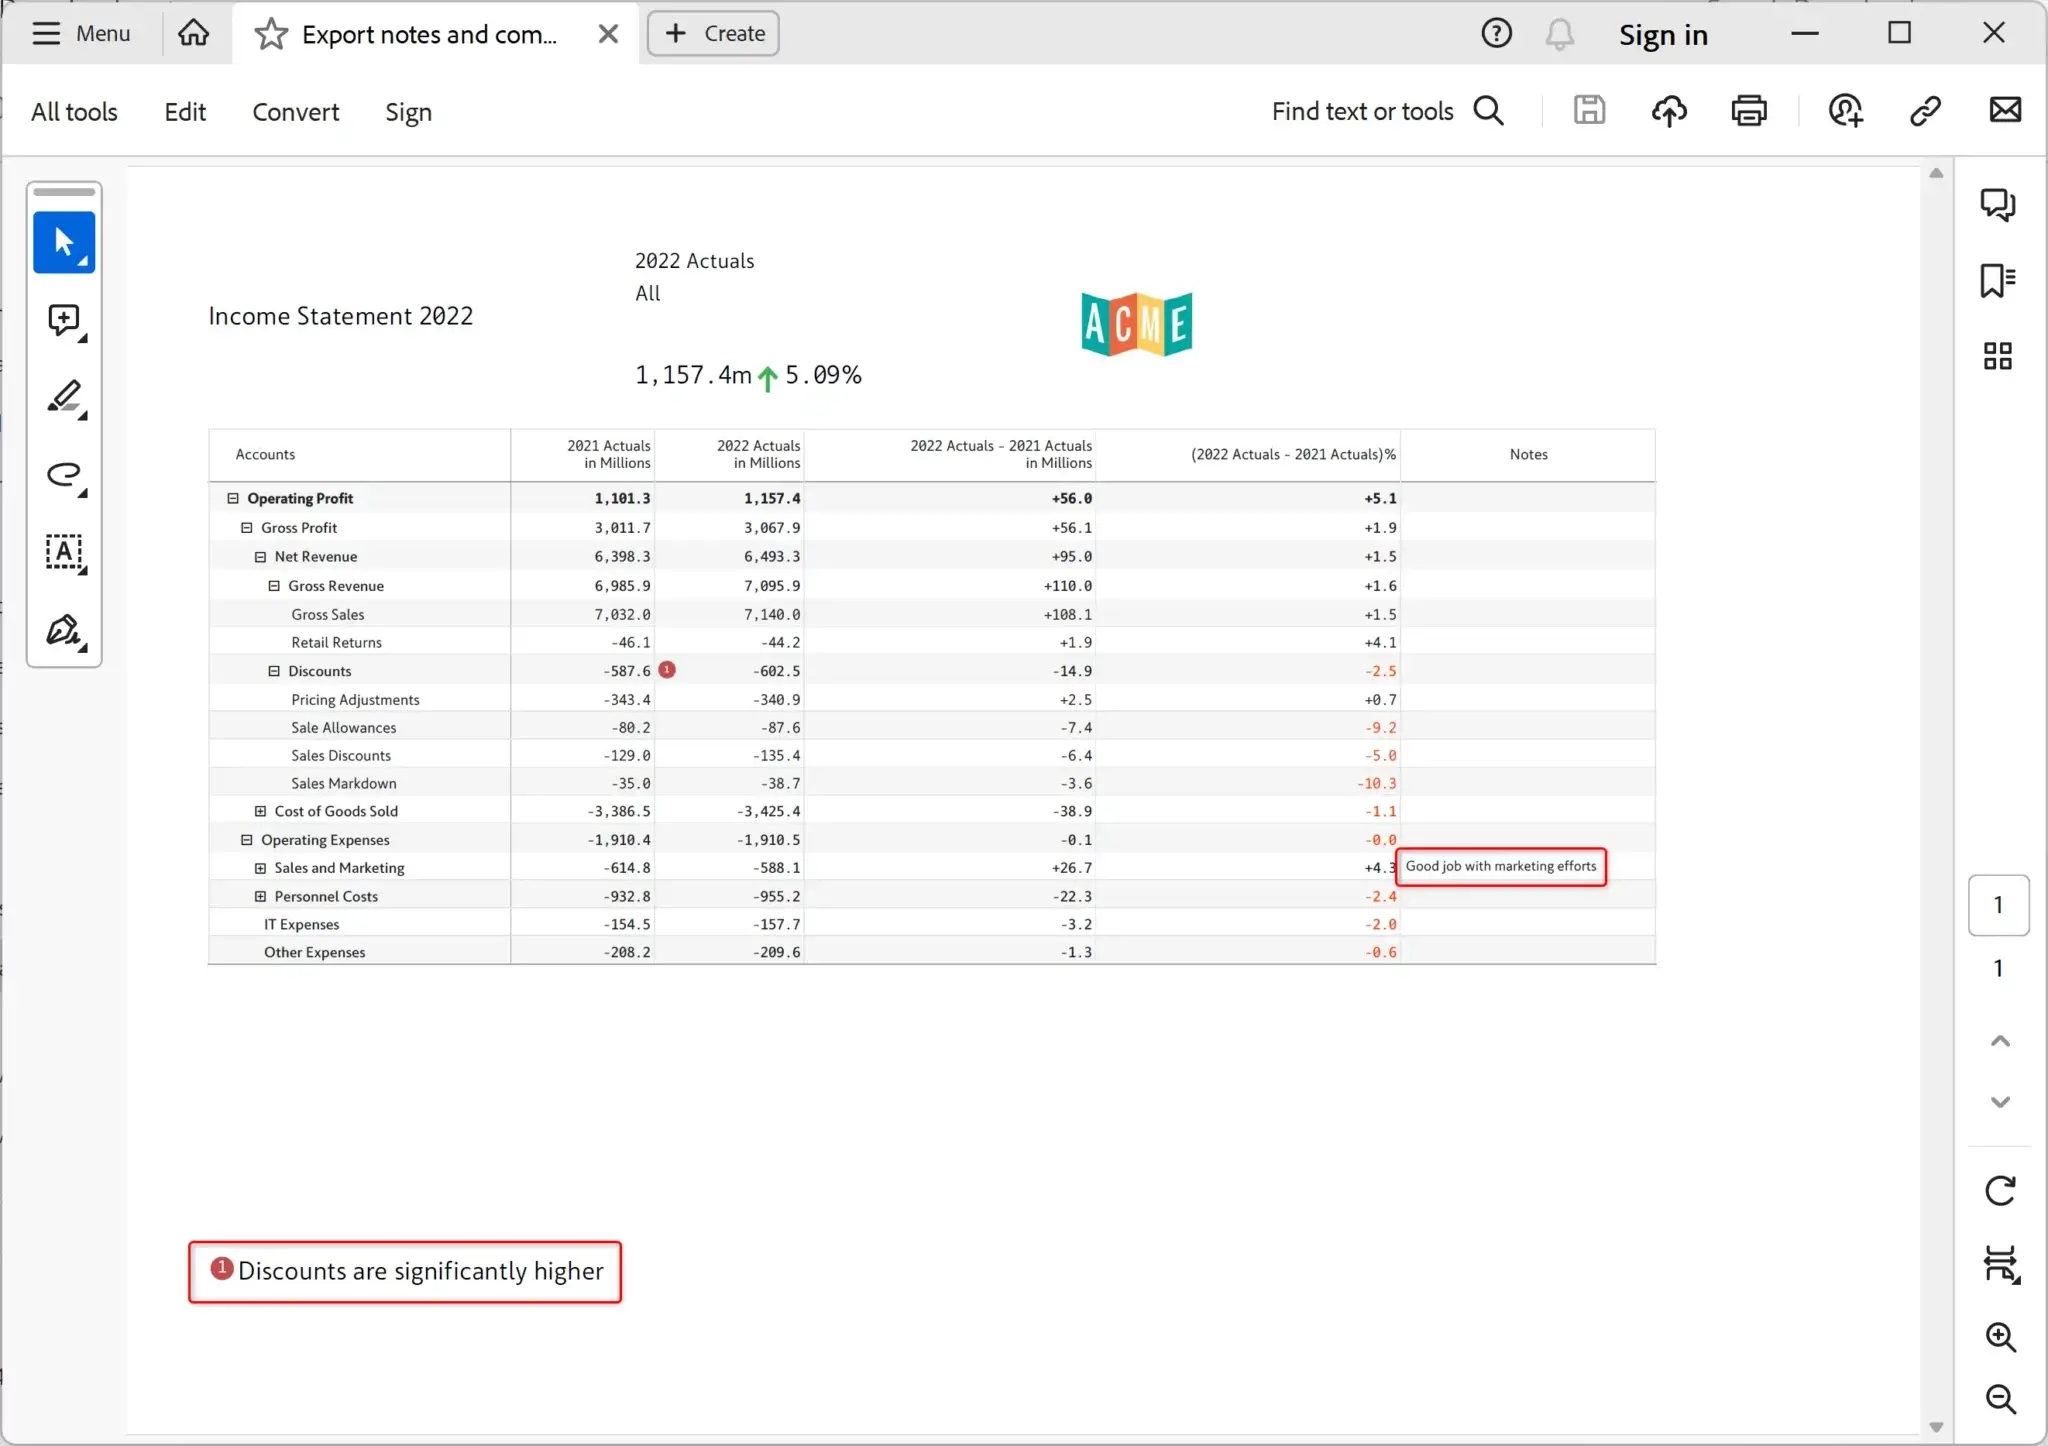
Export inline notes, footnotes and dedicated notes columns to the PDF file. Observe footnote and dedicated notes column exported to PDF below.
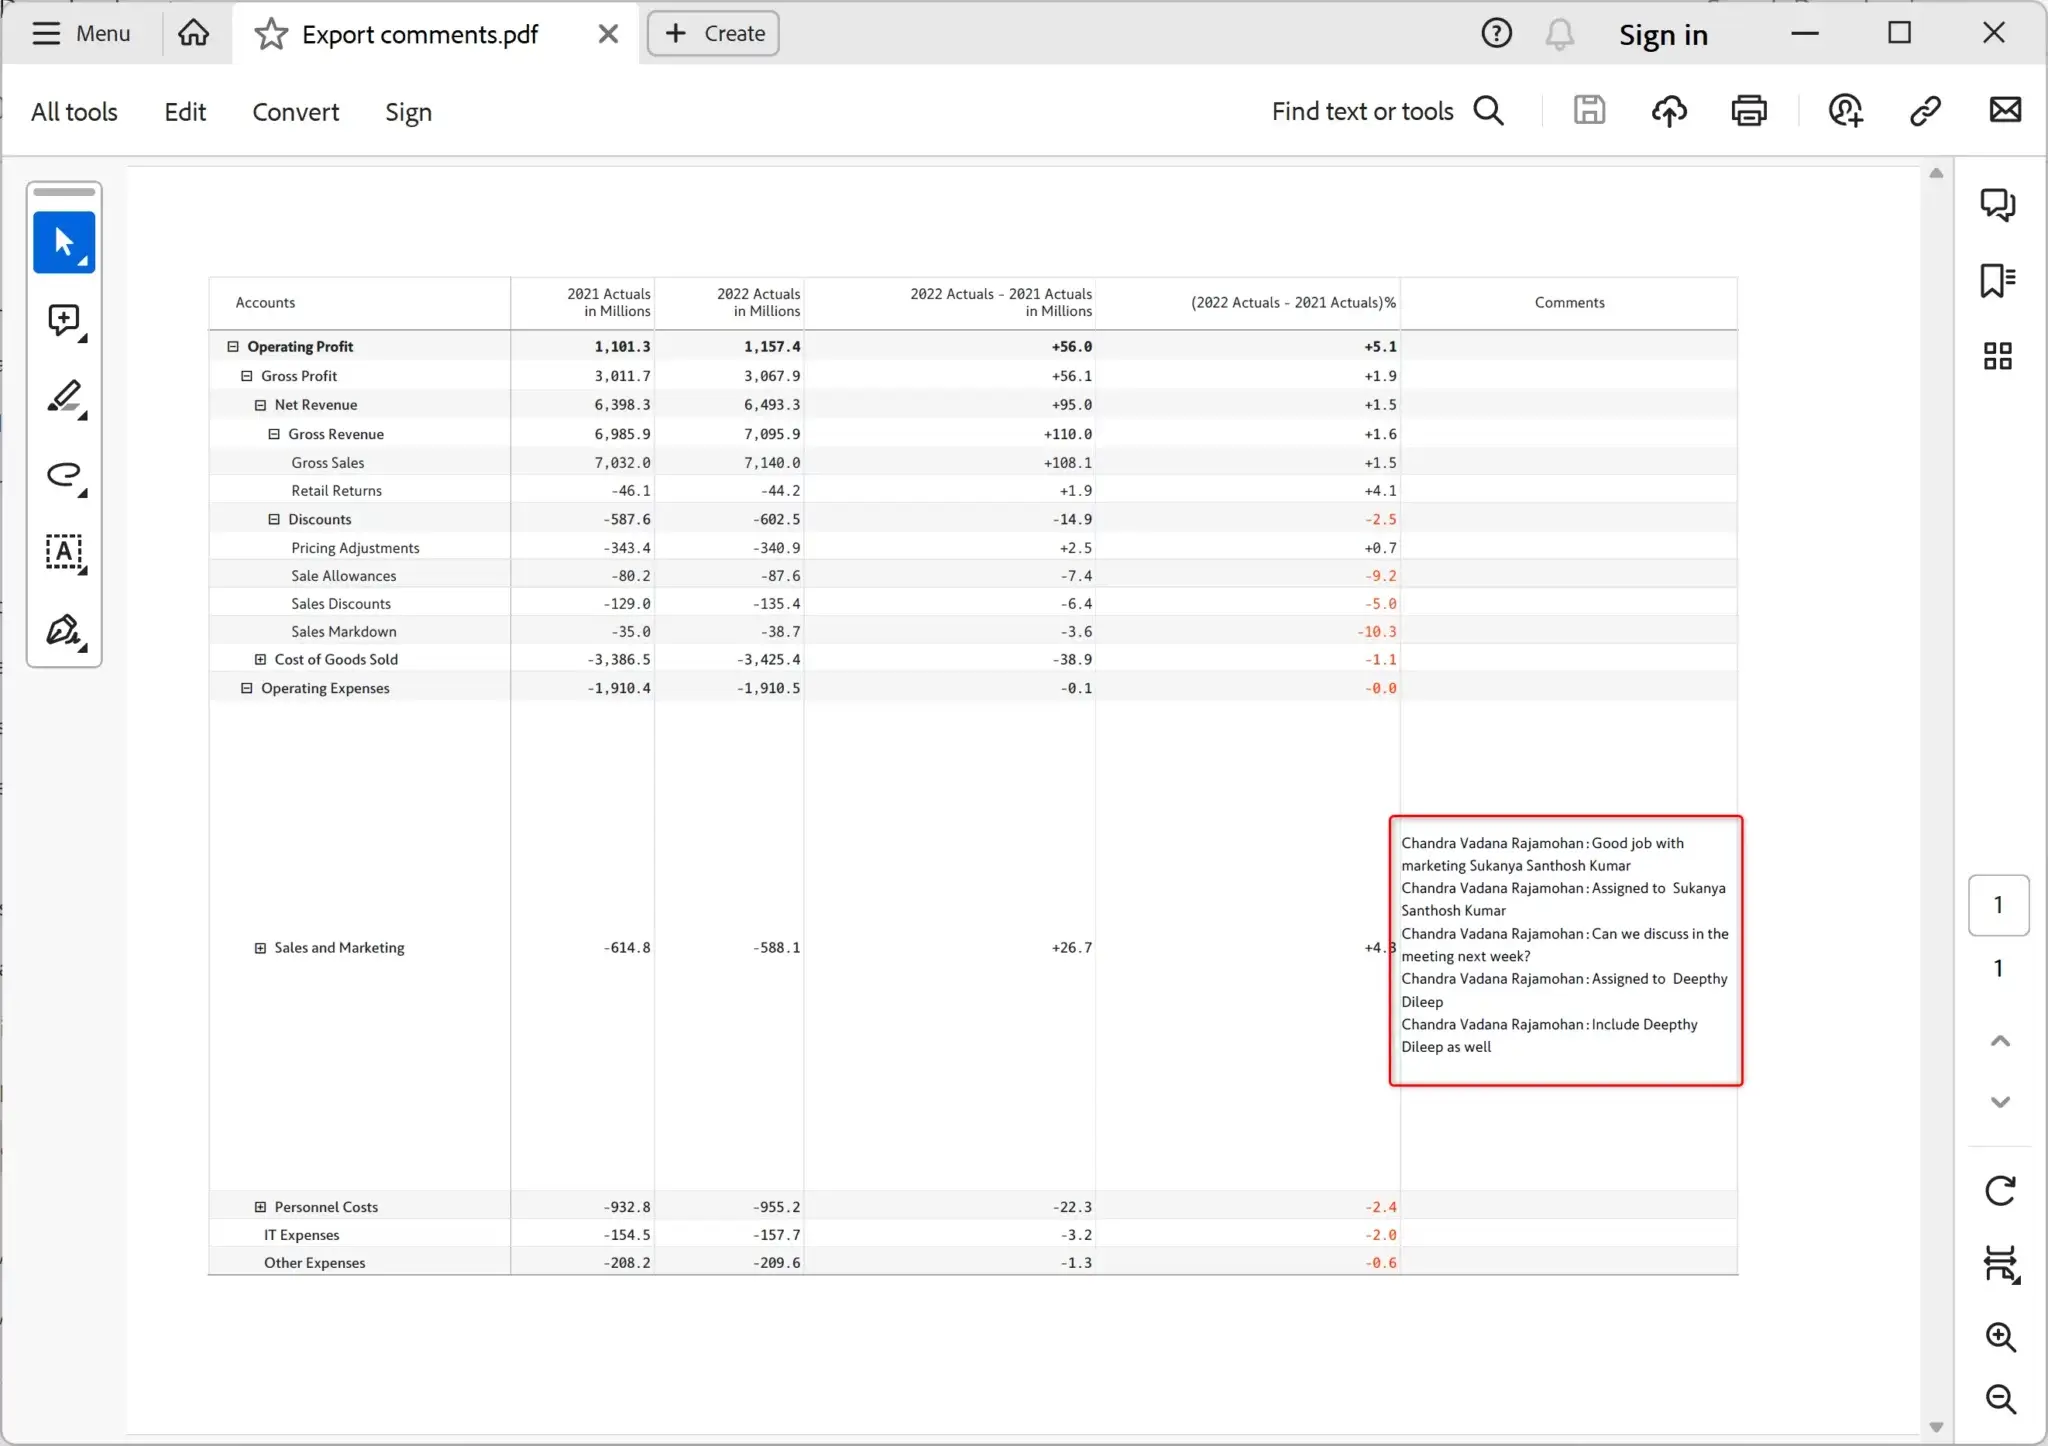
Export Power BI reports with threaded conversations to the PDF file.
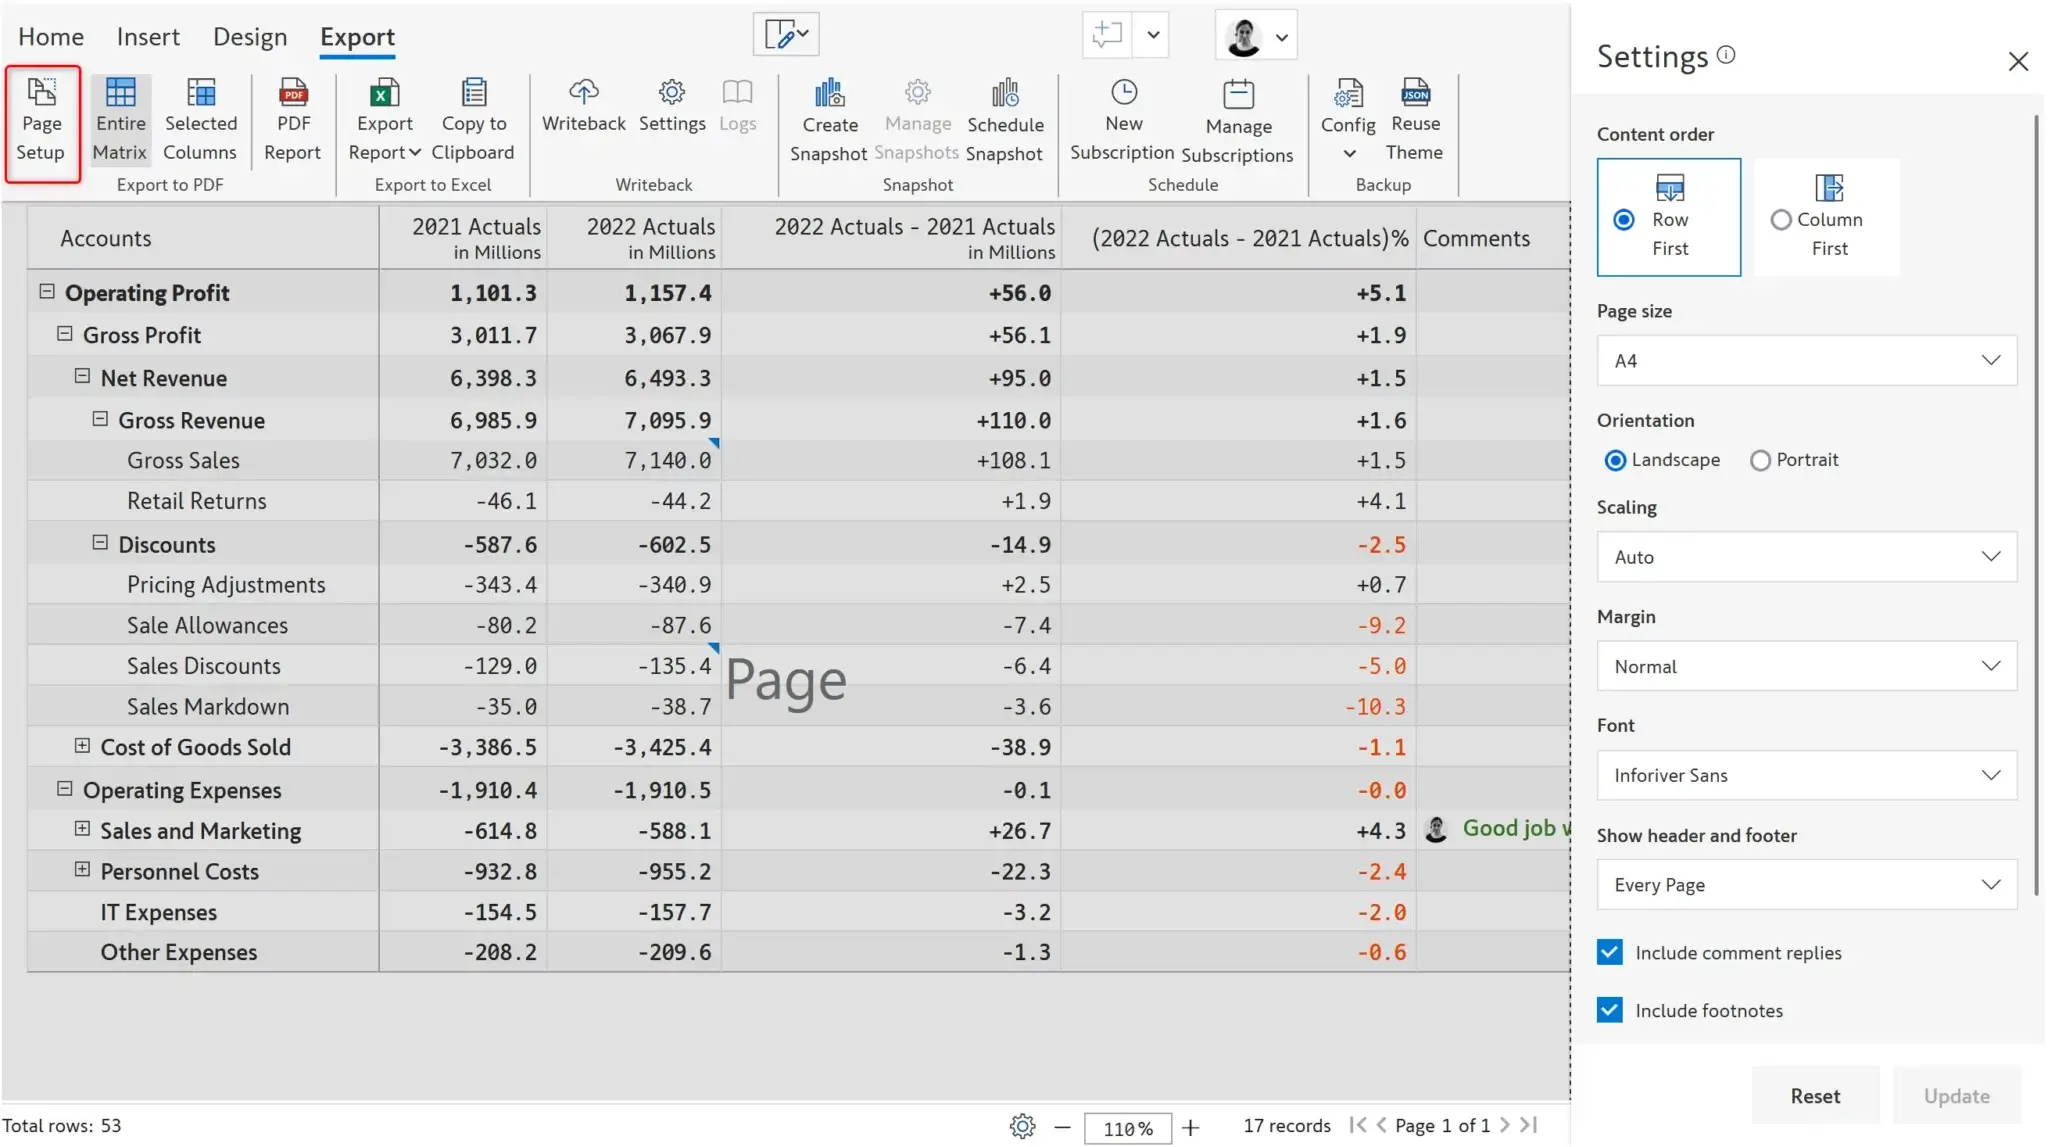
Configure properties such as font, page size, page orientation, scaling, margin, etc that will impact the settings of the exported PDF file.
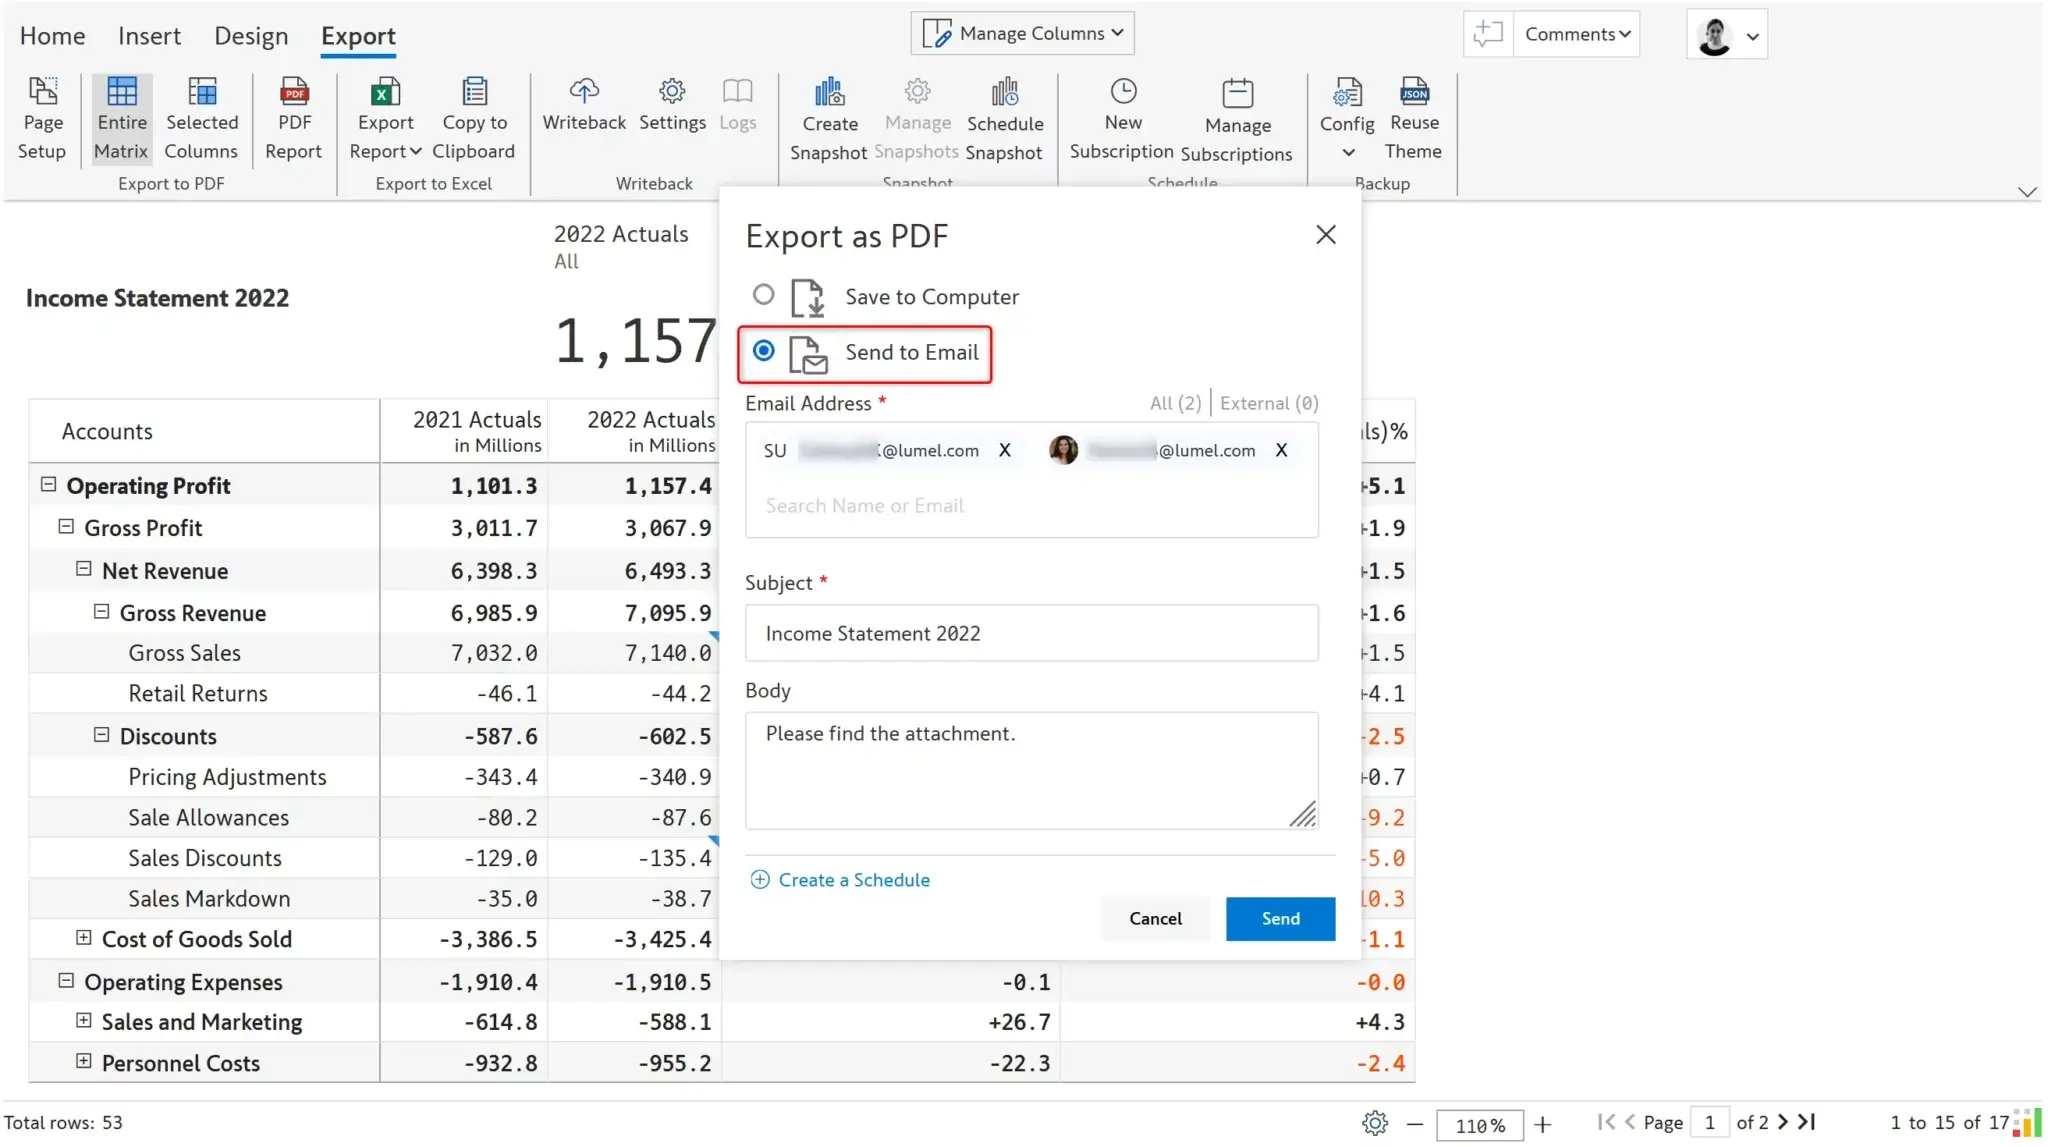
Send an ad-hoc email with the PDF attached. External email addresses are also supported. This feature is available in Inforiver Enterprise.
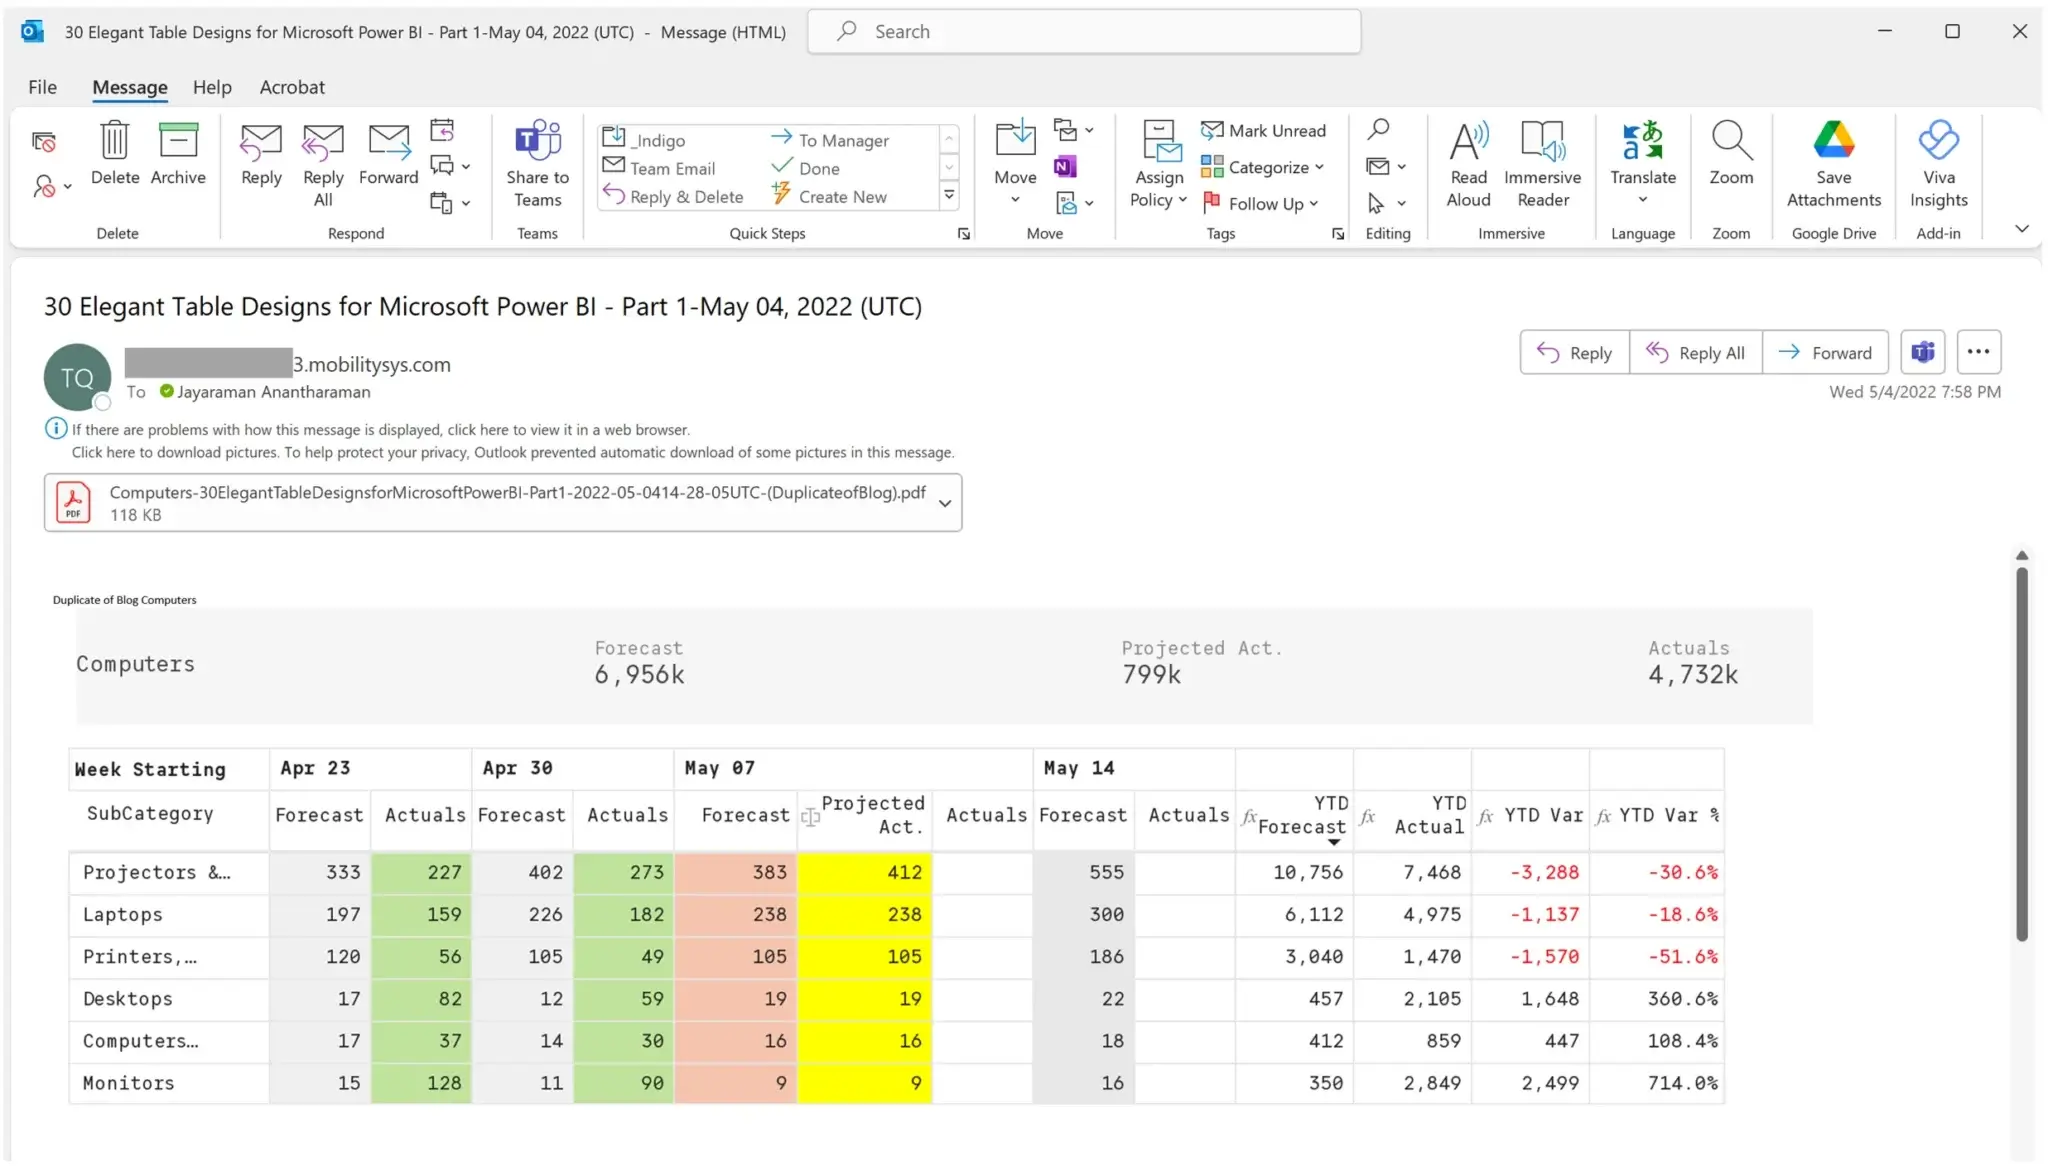
With Inforiver Enterprise, you can also send PDF files periodically to users in your organization. Users can receive the PDF file in an email based on schedule frequency. Different categories can also be sent to different users using filters/bookmarks.
Here is a brief video outlining formatted Export to PDF using Inforiver in Power BI.
Visit our documentation page to learn more about Export to PDF in Power BI.

Inforiver helps enterprises consolidate planning, reporting & analytics on a single platform (Power BI). The no-code, self-service award-winning platform has been recognized as the industry’s best and is adopted by many Fortune 100 firms.
Inforiver is a product of Lumel, the #1 Power BI AppSource Partner. The firm serves over 3,000 customers worldwide through its portfolio of products offered under the brands Inforiver, EDITable, ValQ, and xViz.