Upcoming webinar on 'Inforiver Charts : The fastest way to deliver stories in Power BI', Aug 29th , Monday, 10.30 AM CST. Register Now
Upcoming webinar on 'Inforiver Charts : The fastest way to deliver stories in Power BI', Aug 29th , Monday, 10.30 AM CST. Register Now
When exporting data in a Power BI table or matrix report to Excel, you quickly encounter a few limitations.
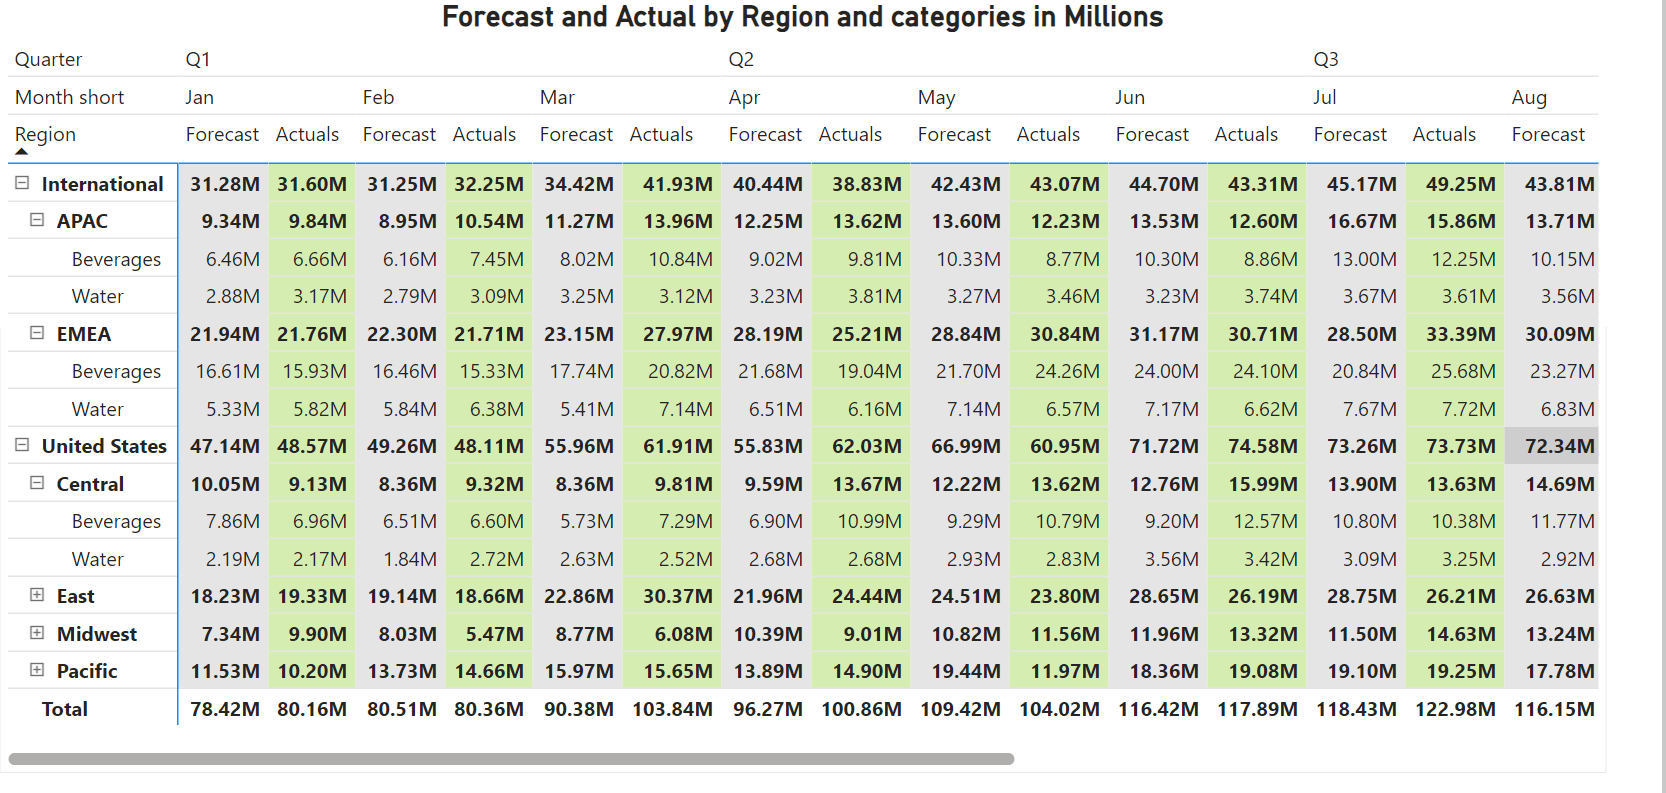
To illustrate this, let us take this sample report built using the matrix visual available in Power BI.
You get the following when you export the matrix to an Excel file.
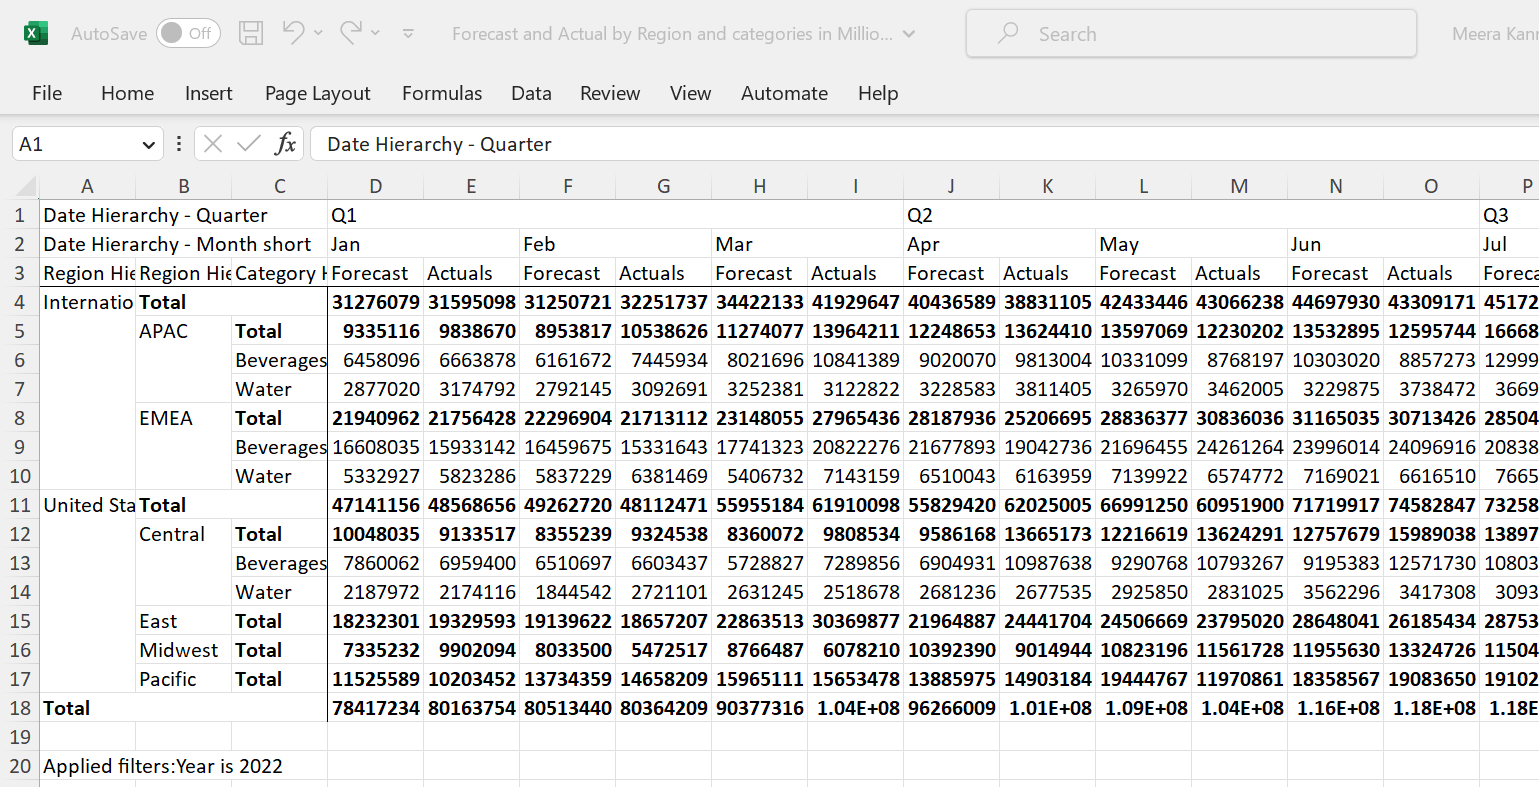
You will notice the following shortcomings:
Let us compare & contrast this with how you can generate formatted, multi-worksheet data exports using Inforiver for Power BI.
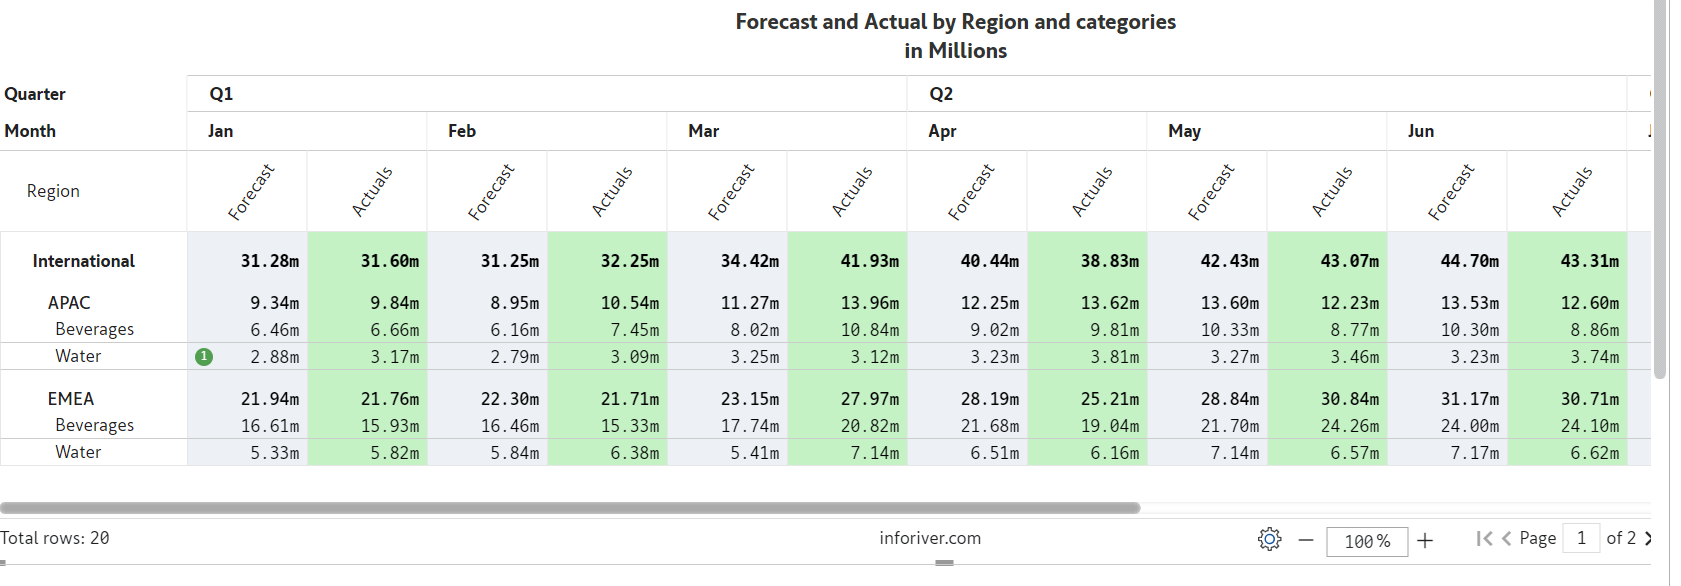
Let us take a paginated Inforiver Matrix report using a similar format. This report has two pages, with Page 1 for the International region and Page 2 for the US region. (We have used a smart page break based on the region – which, when used, automatically pushes each new region to a new page)
When you export the contents of the Inforiver matrix to Excel, you get the following.
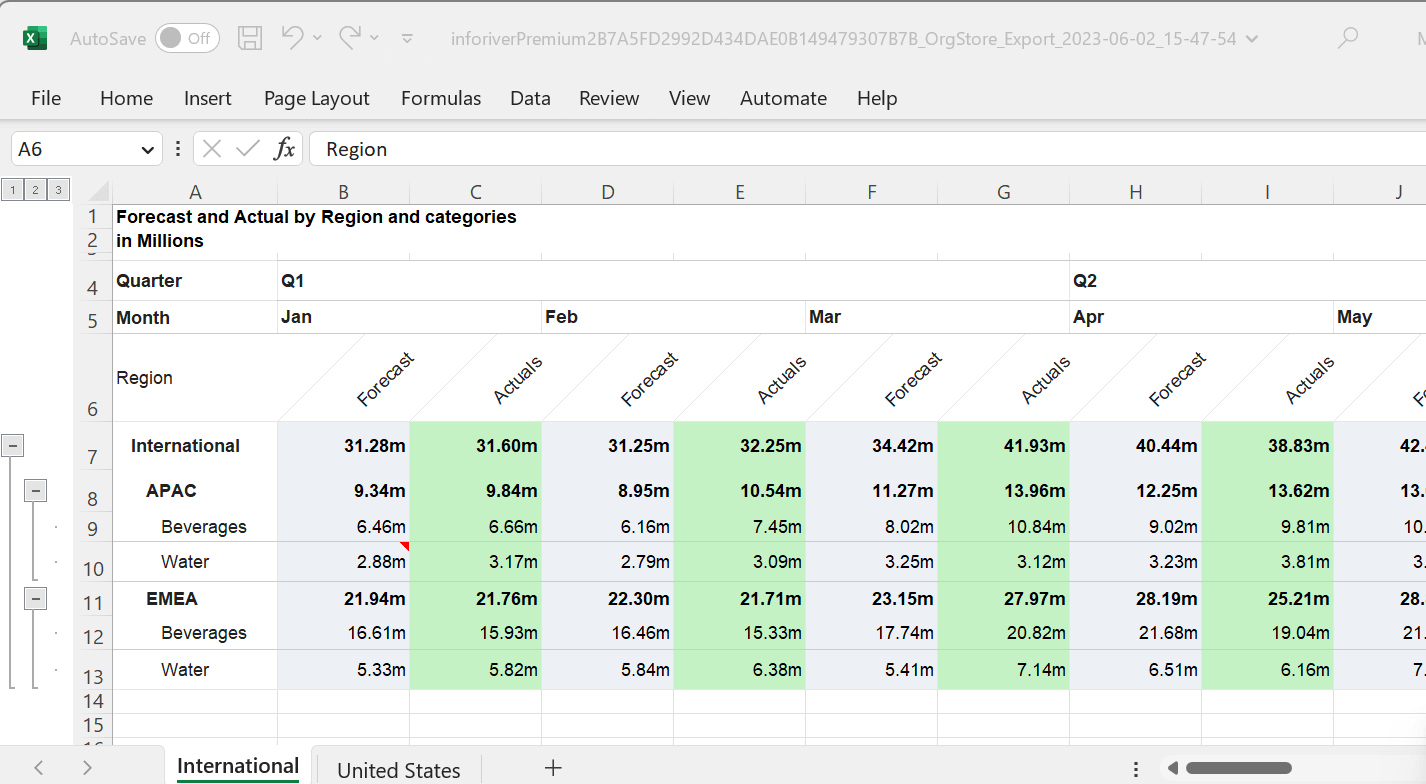
You will instantly notice that the data from the two pages have been exported to two worksheets/tabs in Excel. In addition, you will also notice that Inforiver successfully exports data while preserving the following:
Inforiver for Power BI provides the following capabilities while exporting to Excel.
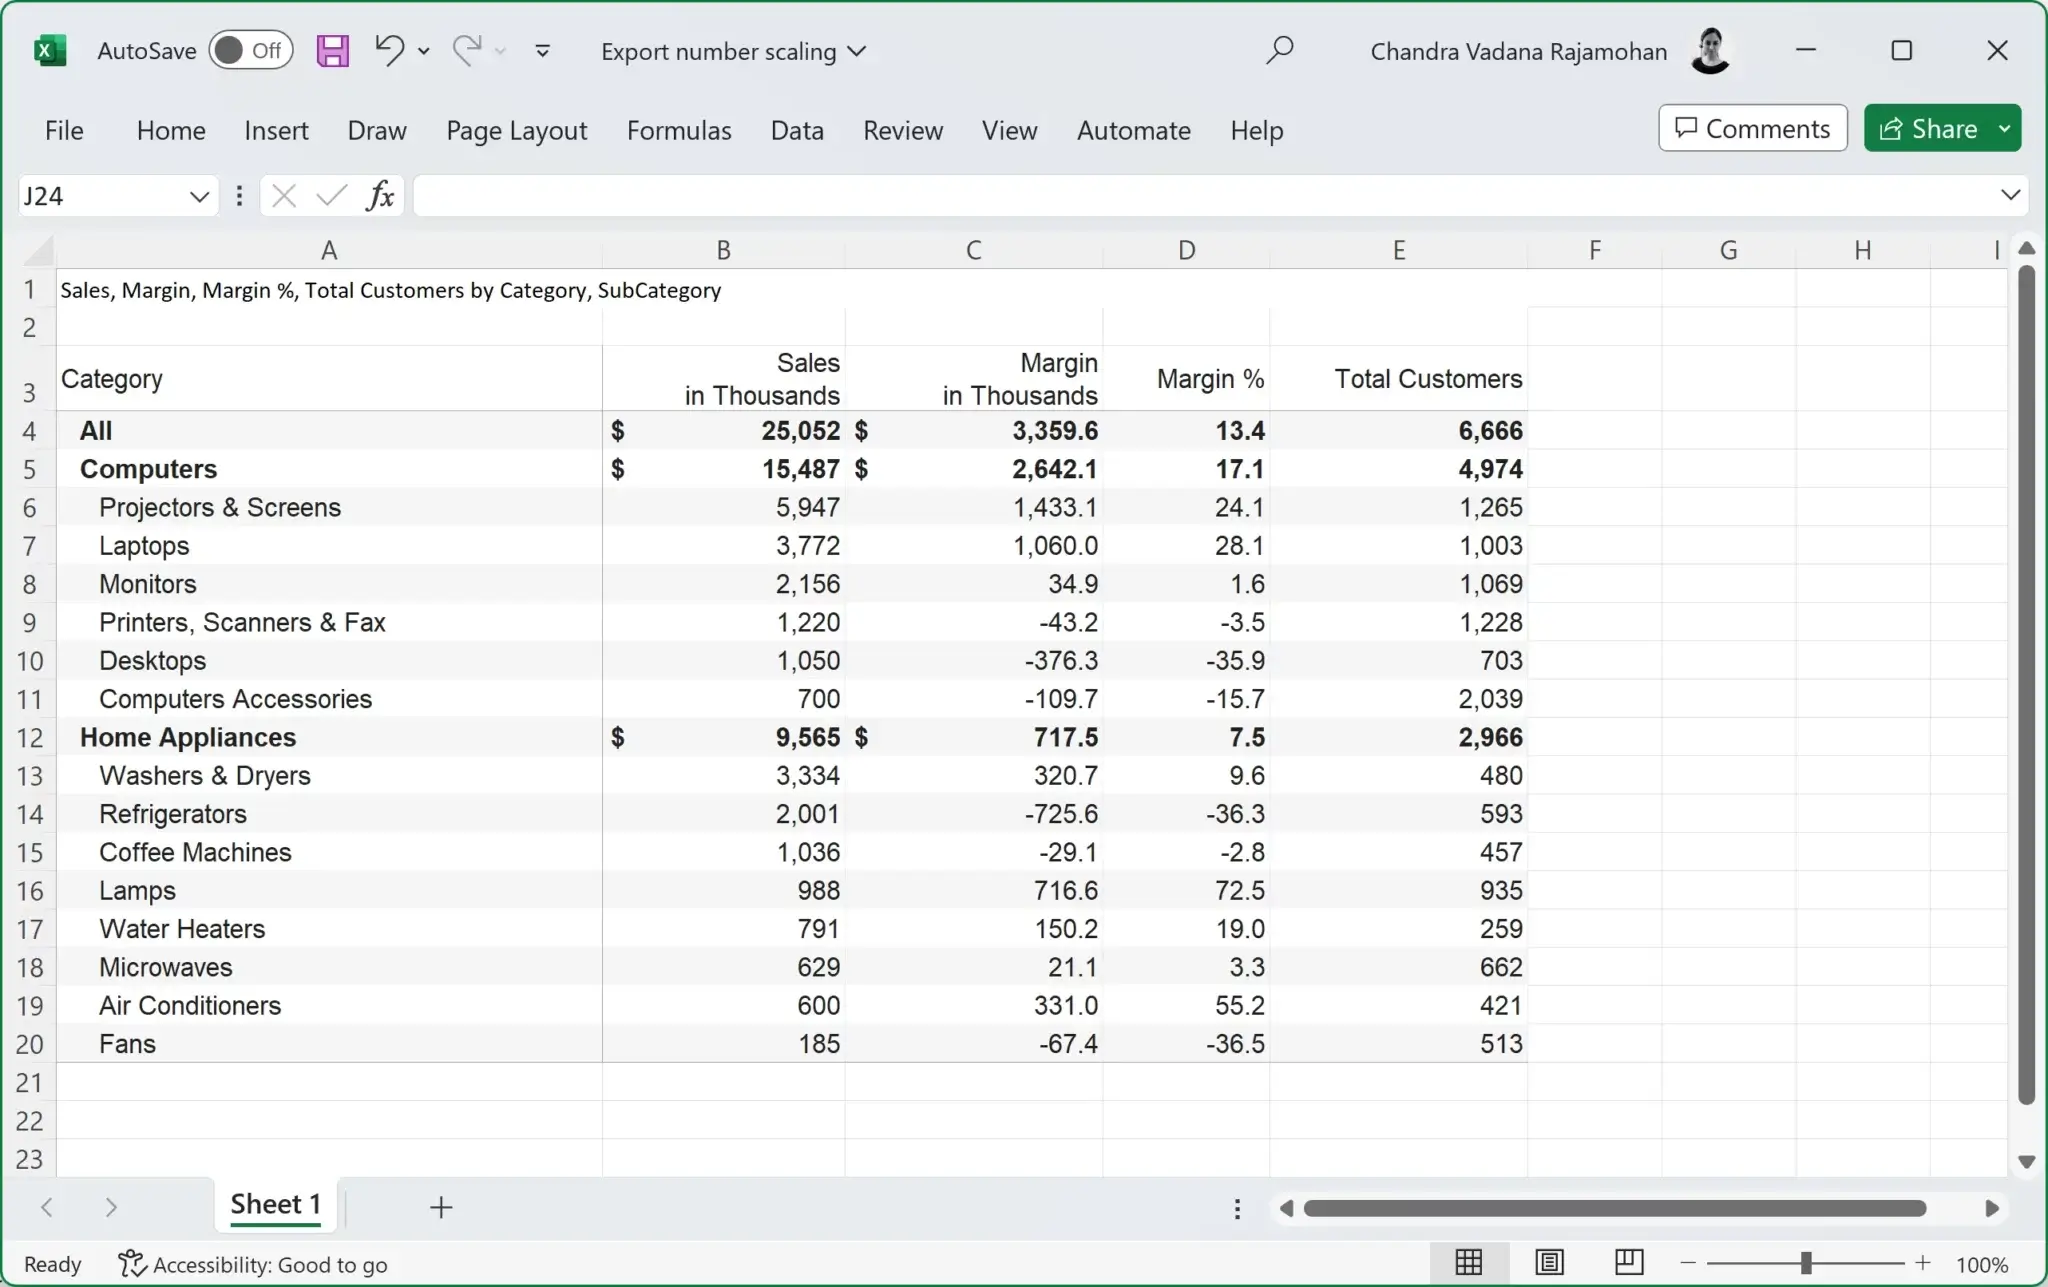
Table layouts (hierarchy, table, stepped, and drill down) and measure layouts (measures in rows and columns) are preserved in the exported file. The following export shows a stepped layout with measures in rows.
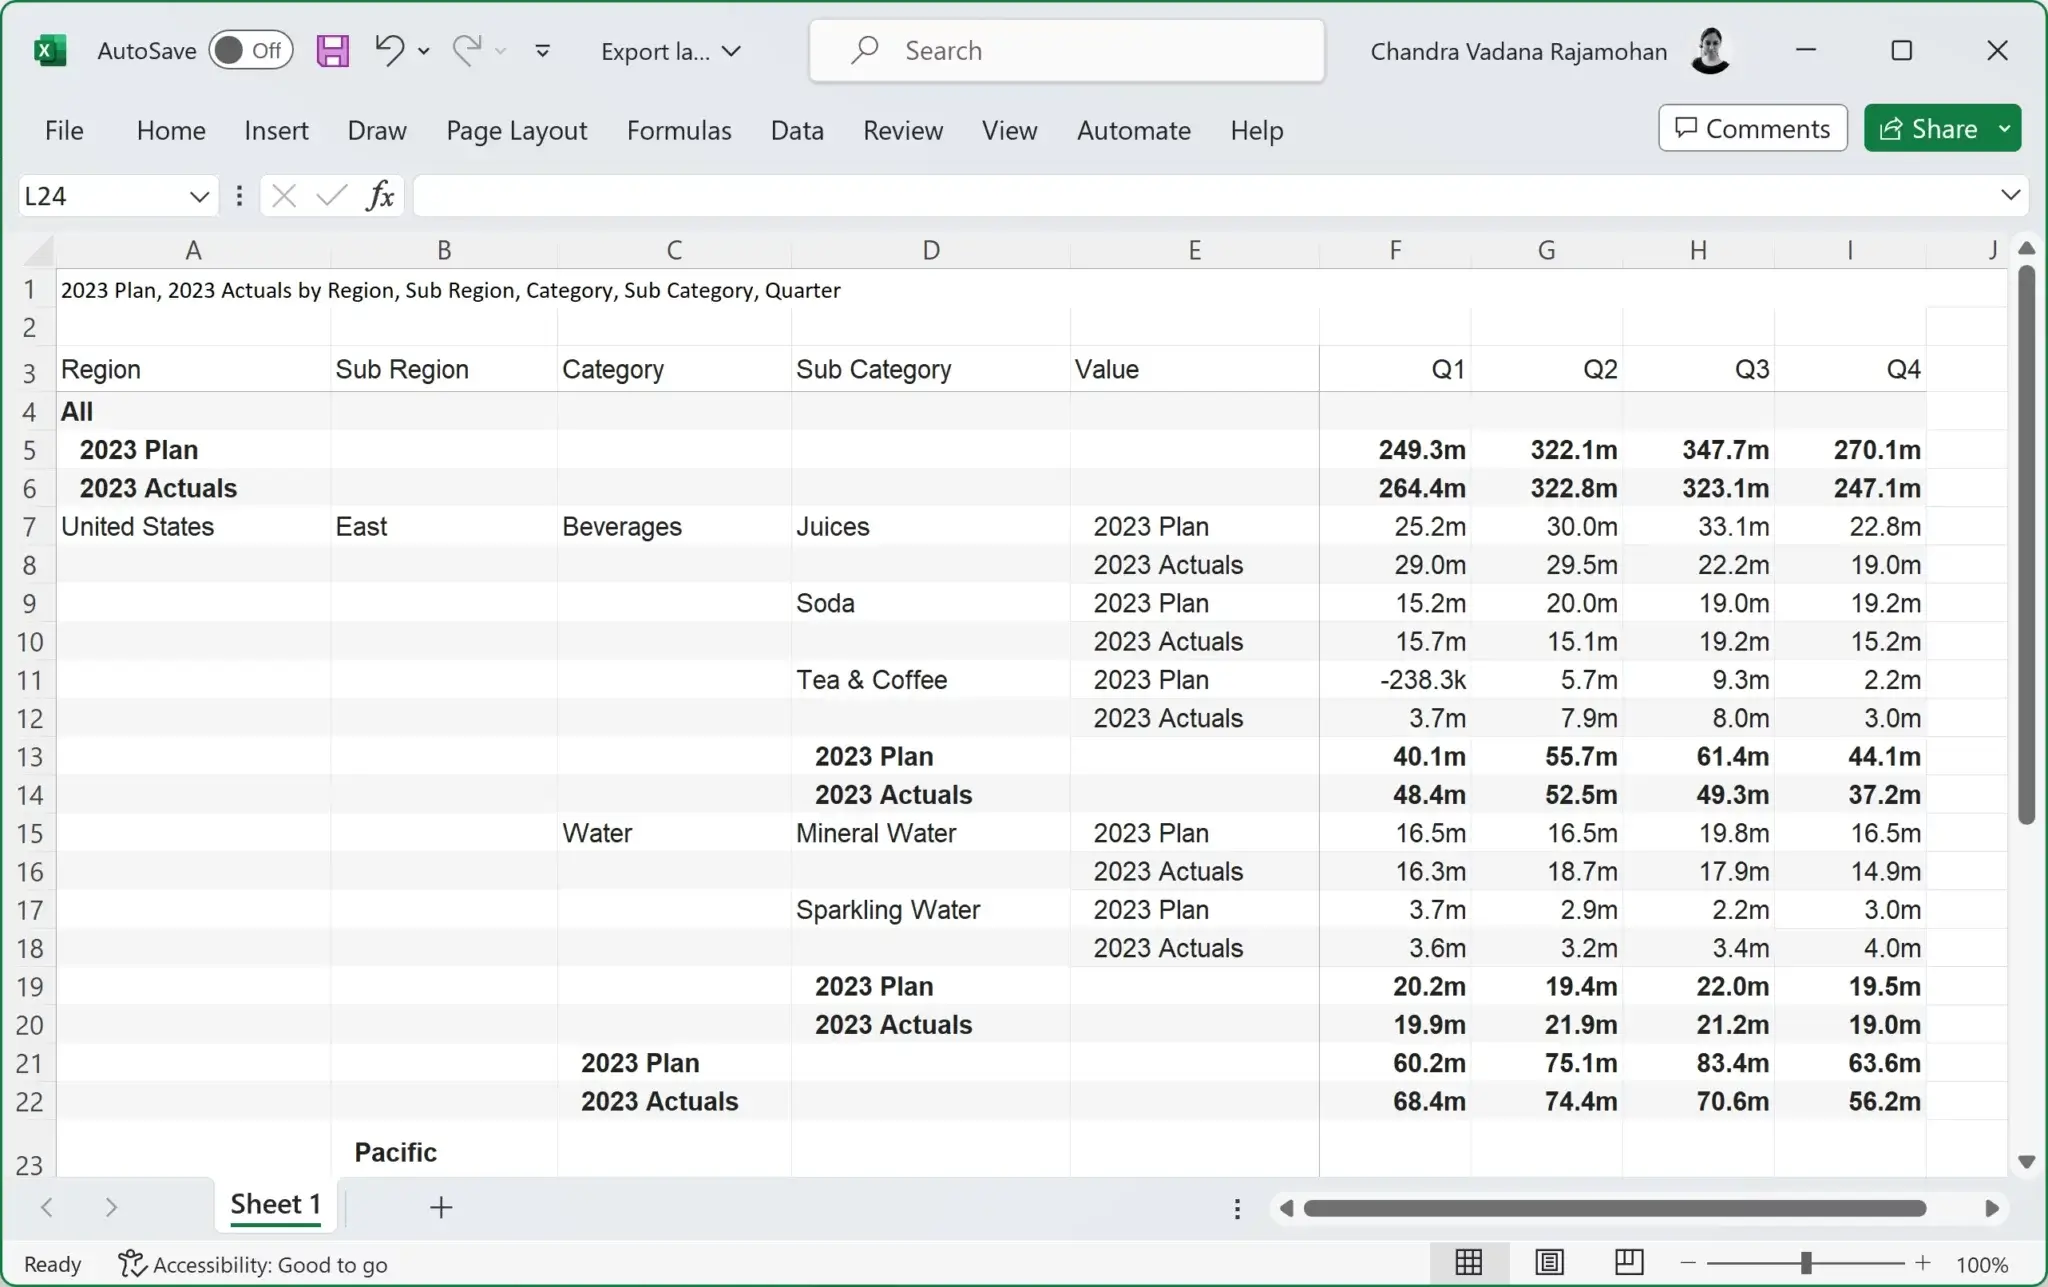
Notice the scaling in the column headers, the decimal places, and the dollar prefix in the exported file.
This is very helpful when you have a lot of records & hierarchies, say 1000 records with seven hierarchy levels. It saves you much time as you do not have to recreate these row hierarchies in Excel.
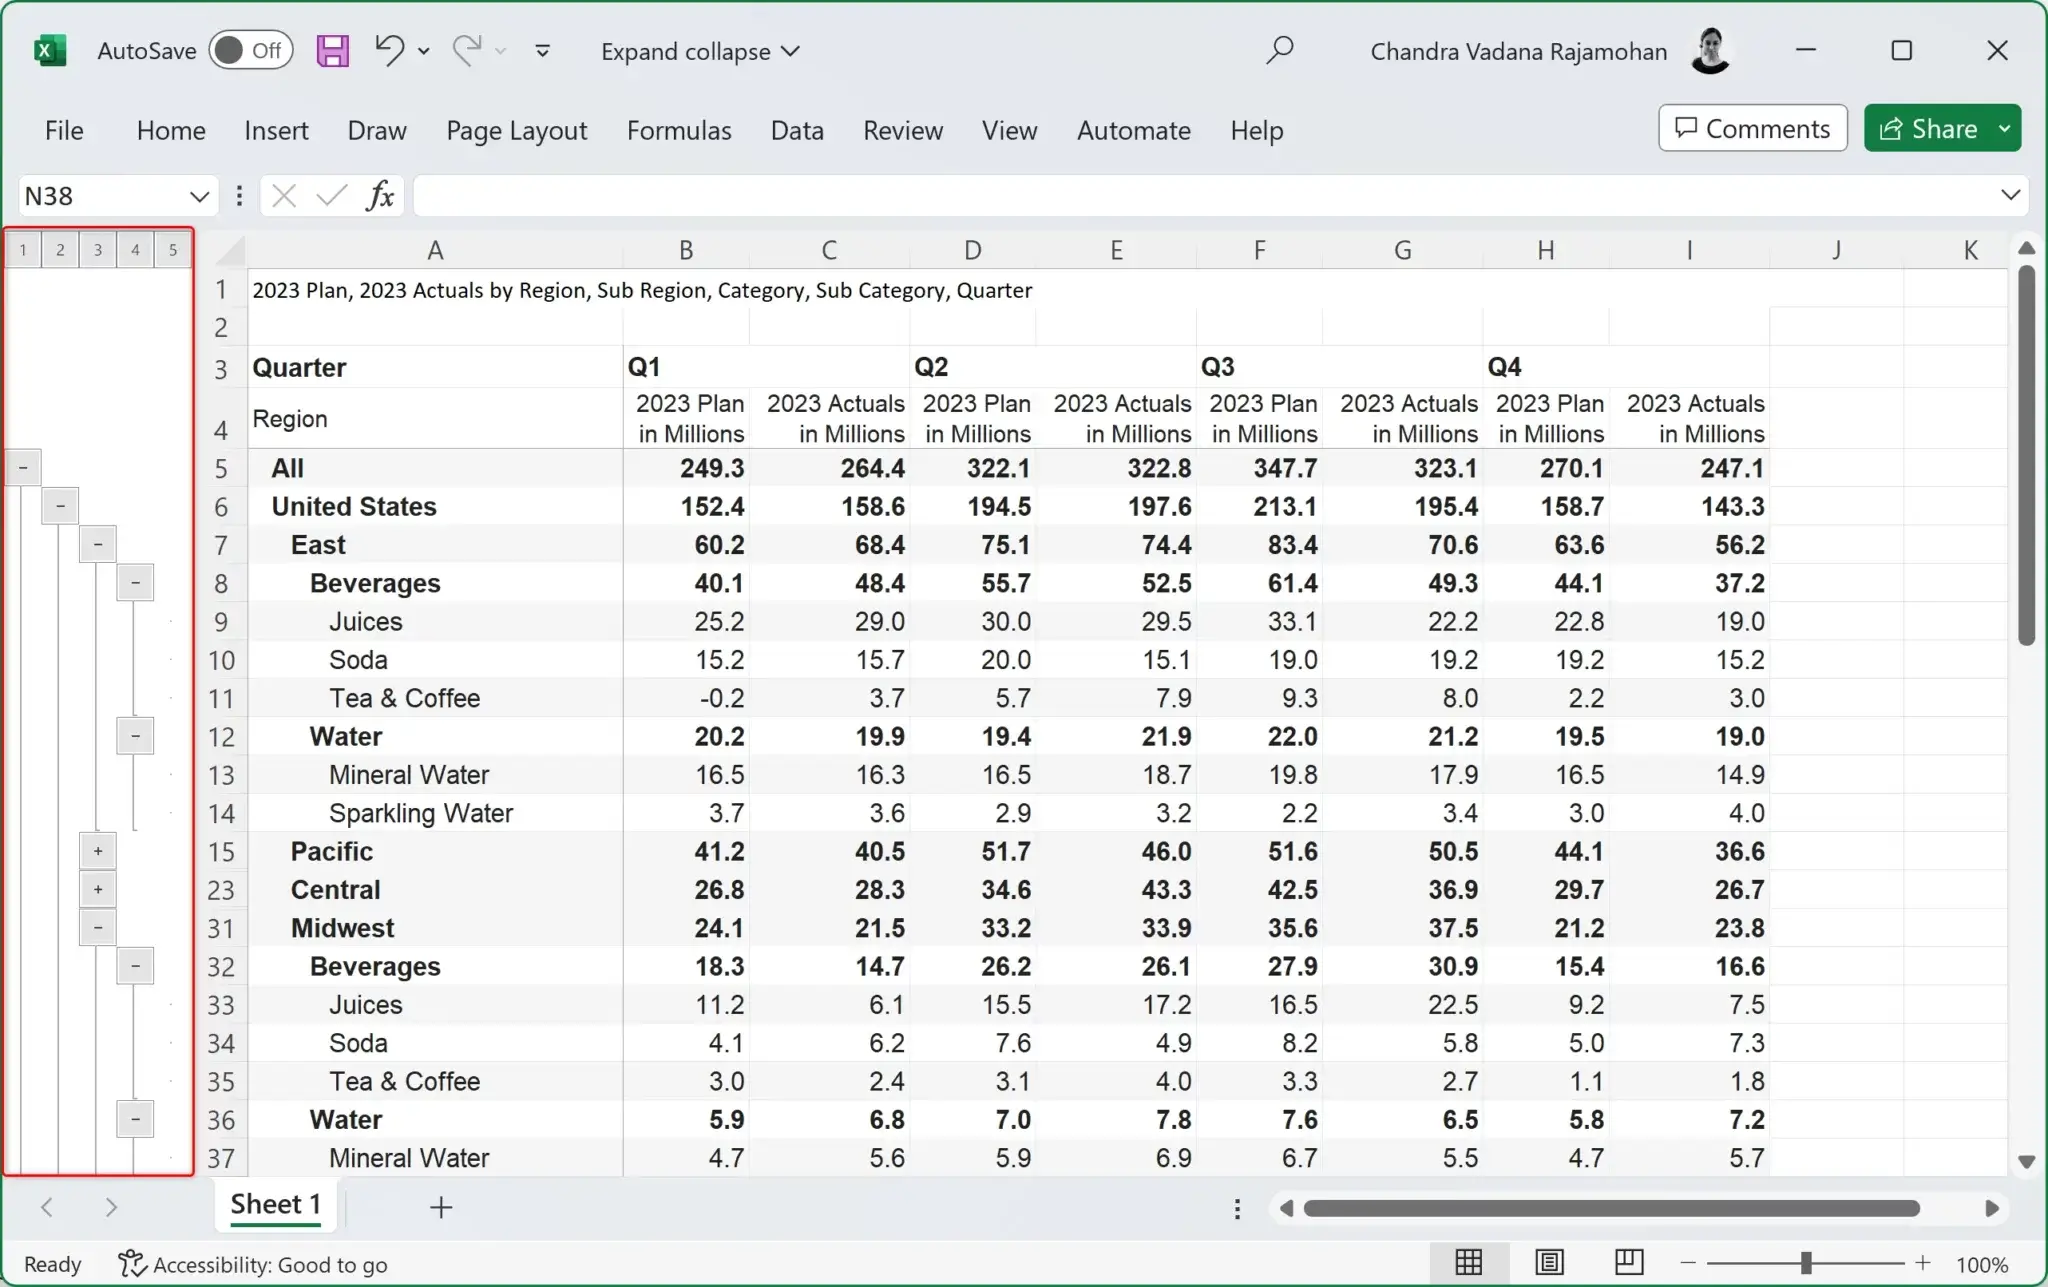
While exporting to Excel, if some branches are collapsed, you can export hidden rows or export only rows revealed to the user. In the example below, we have exercised the option of not exporting hidden rows. As a result, child rows are shown only for United States-East.
The example below shows a monthly sales tracker with different background colors for past, present, and future periods. Also, notice the vertical measure headers.
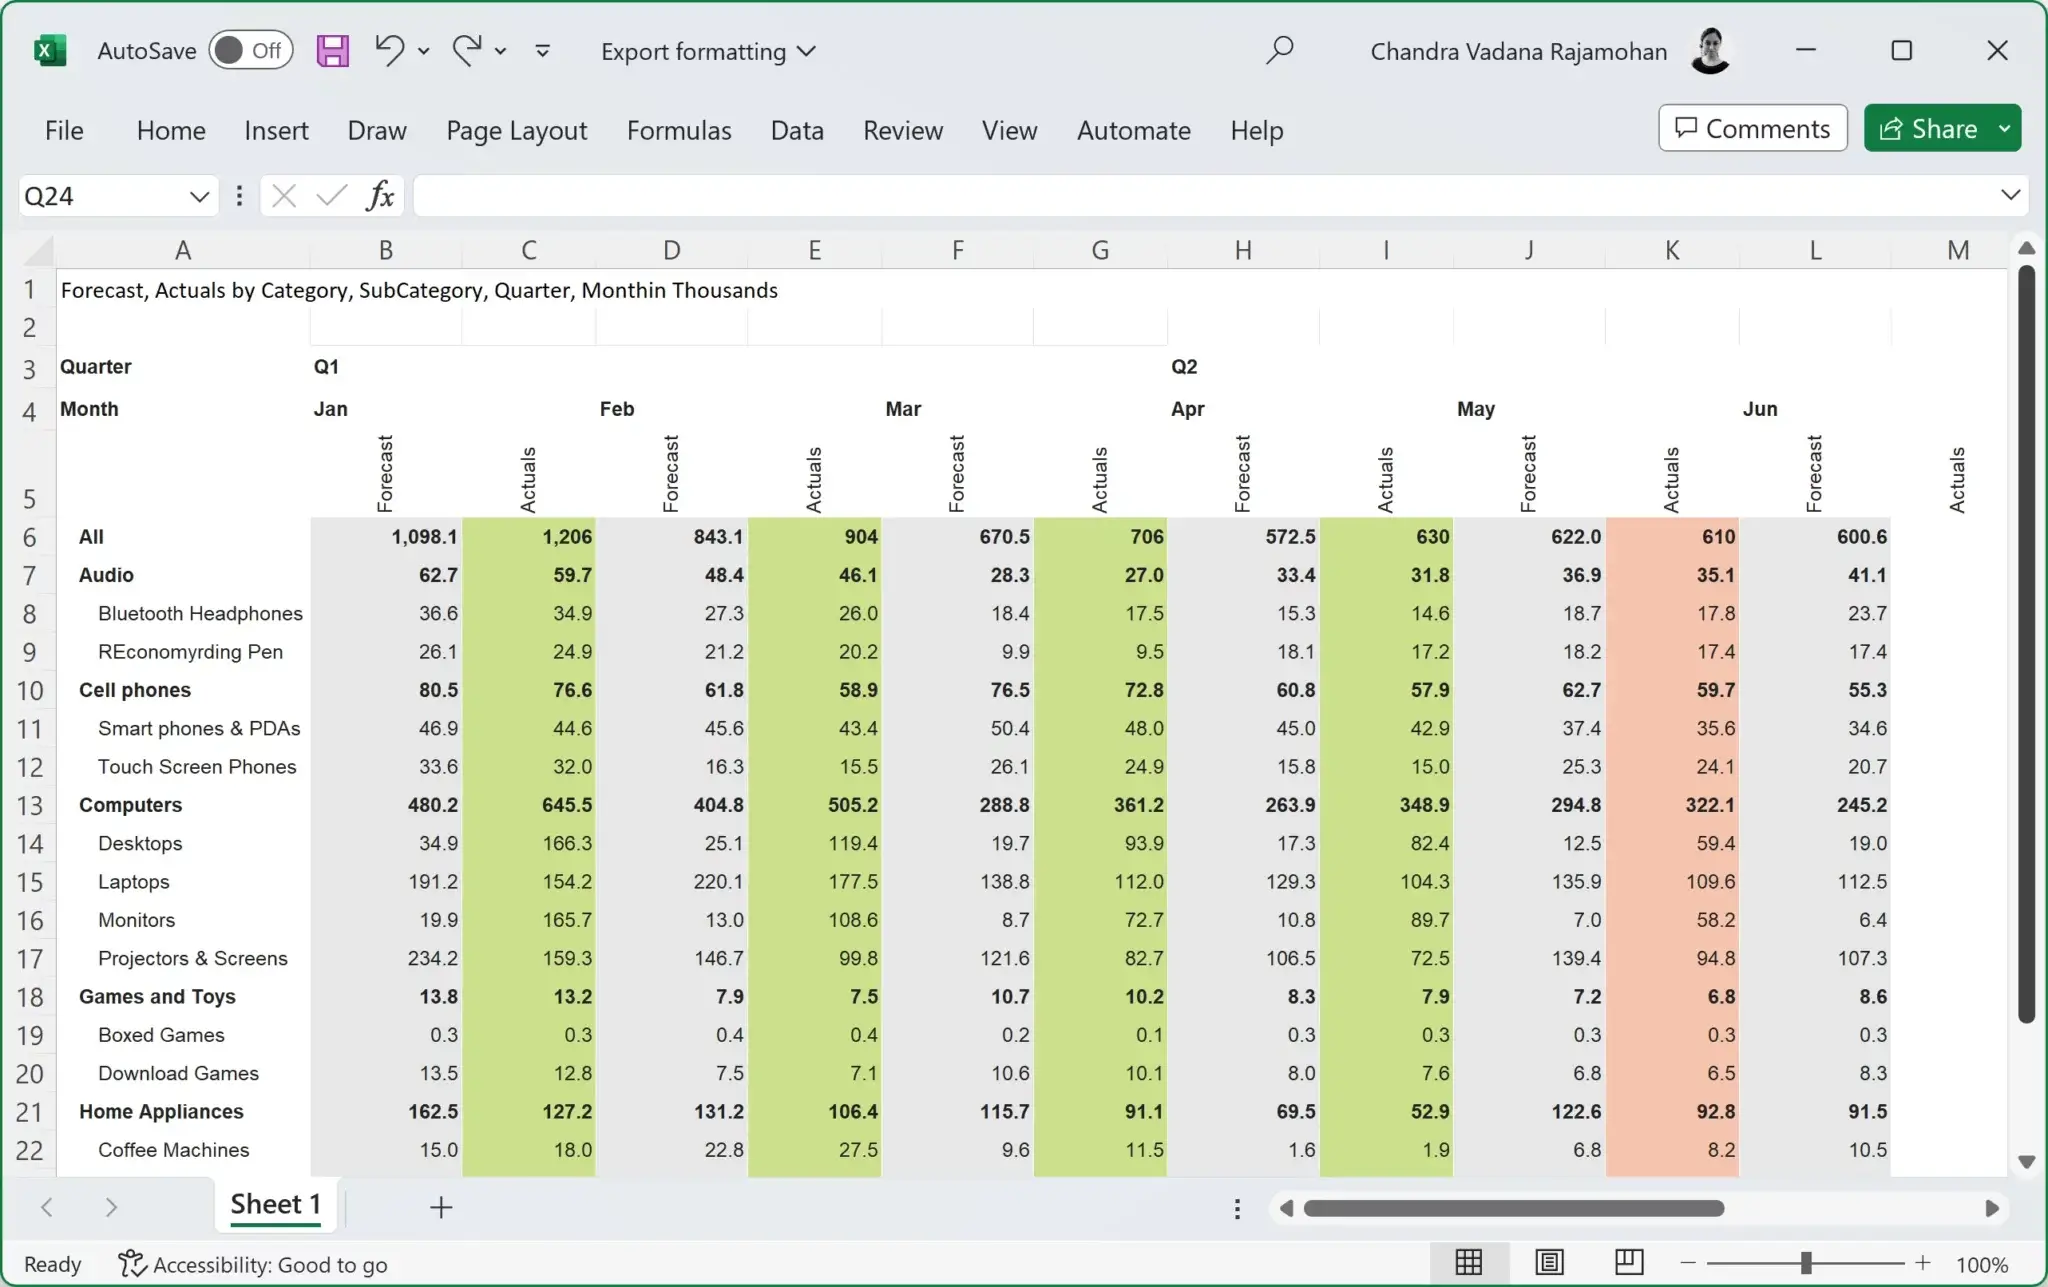
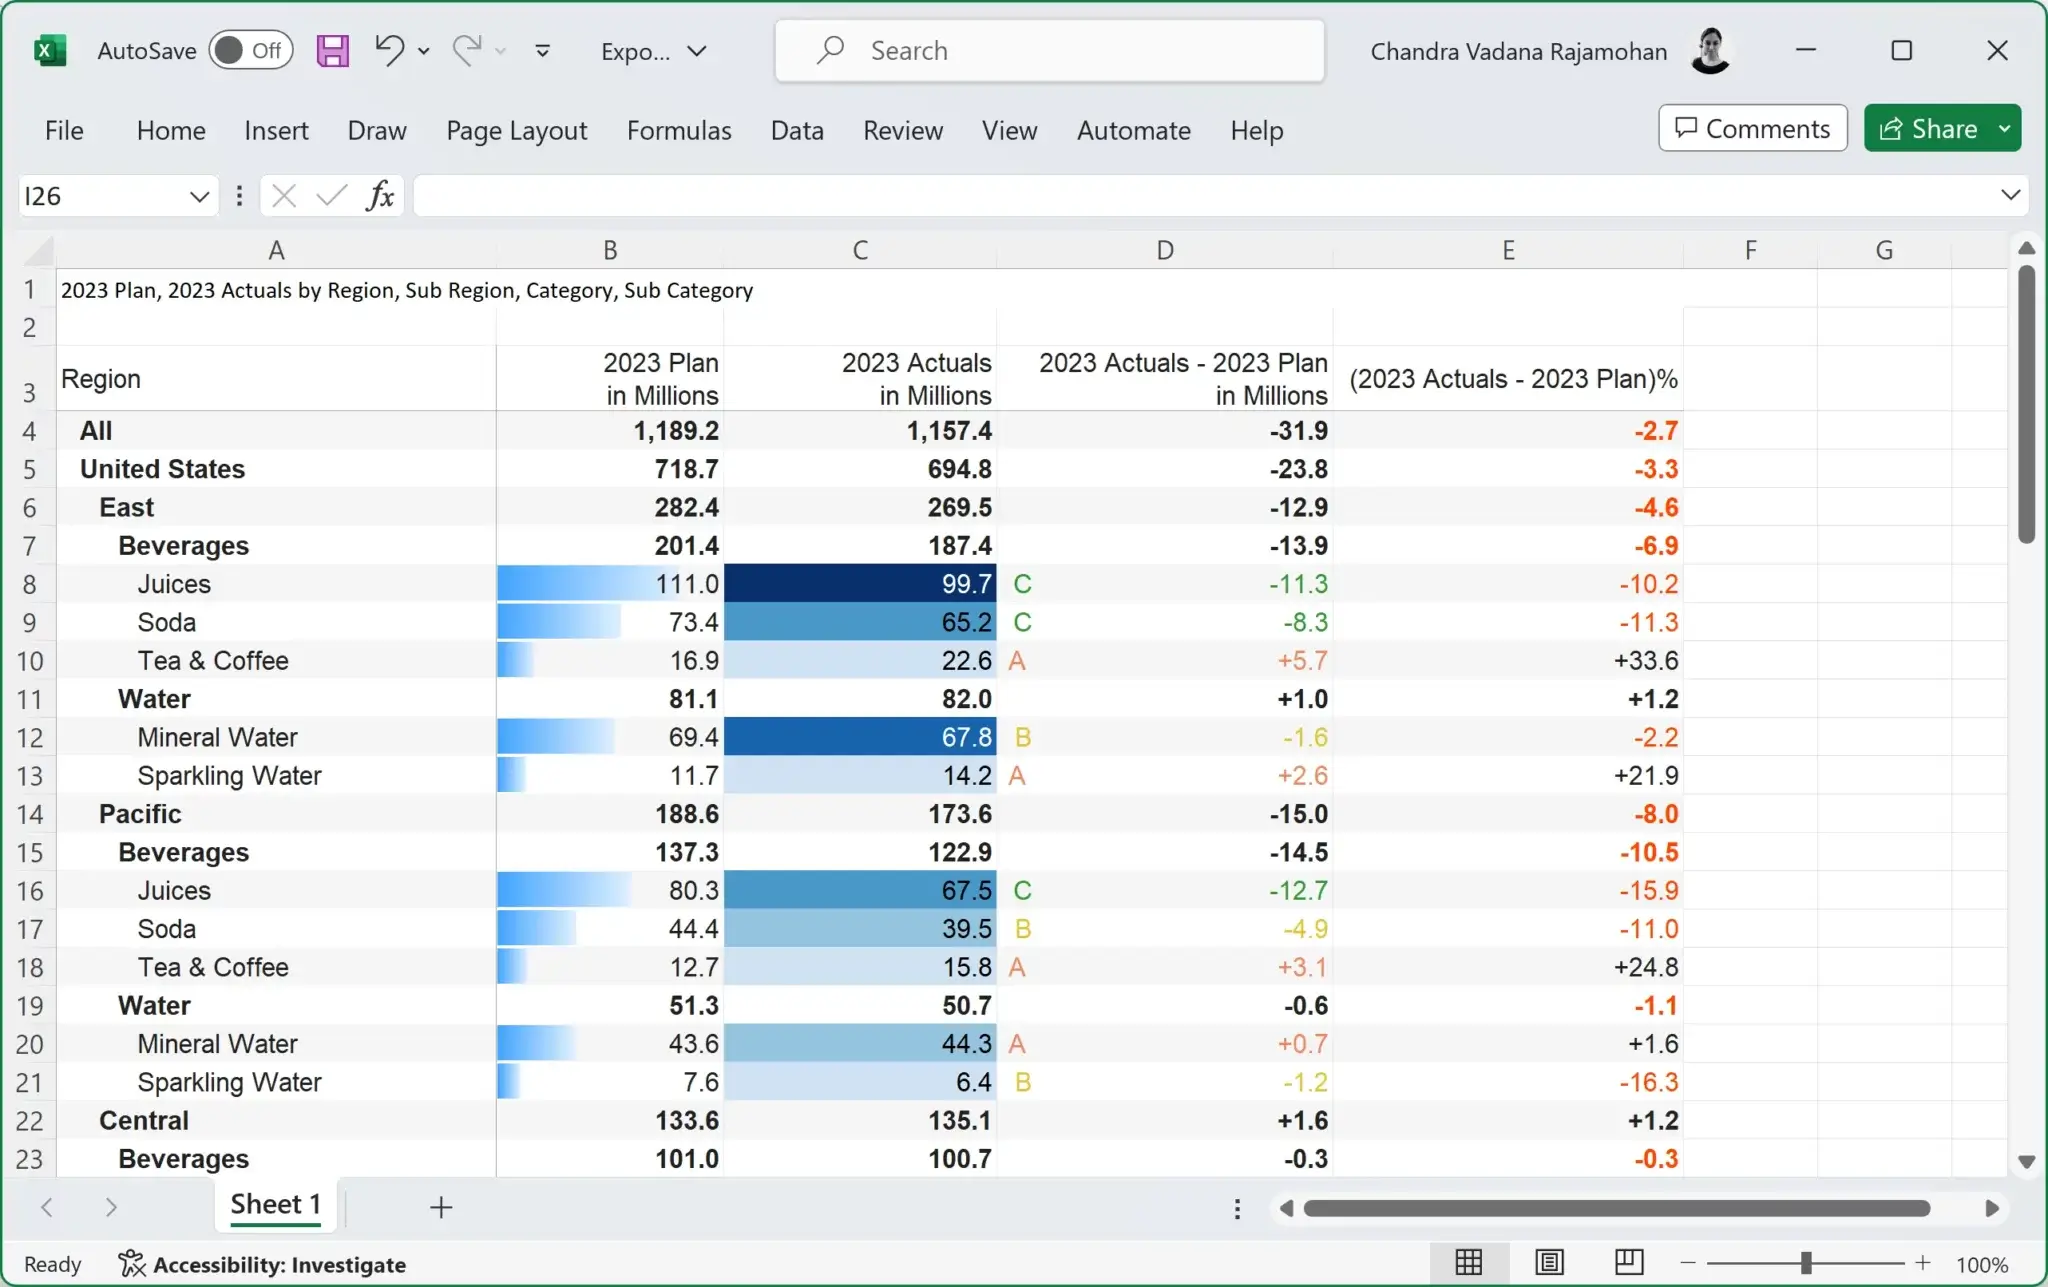
The image below shows data bars, color scales for the background, ABC classification, and semantic formatting.
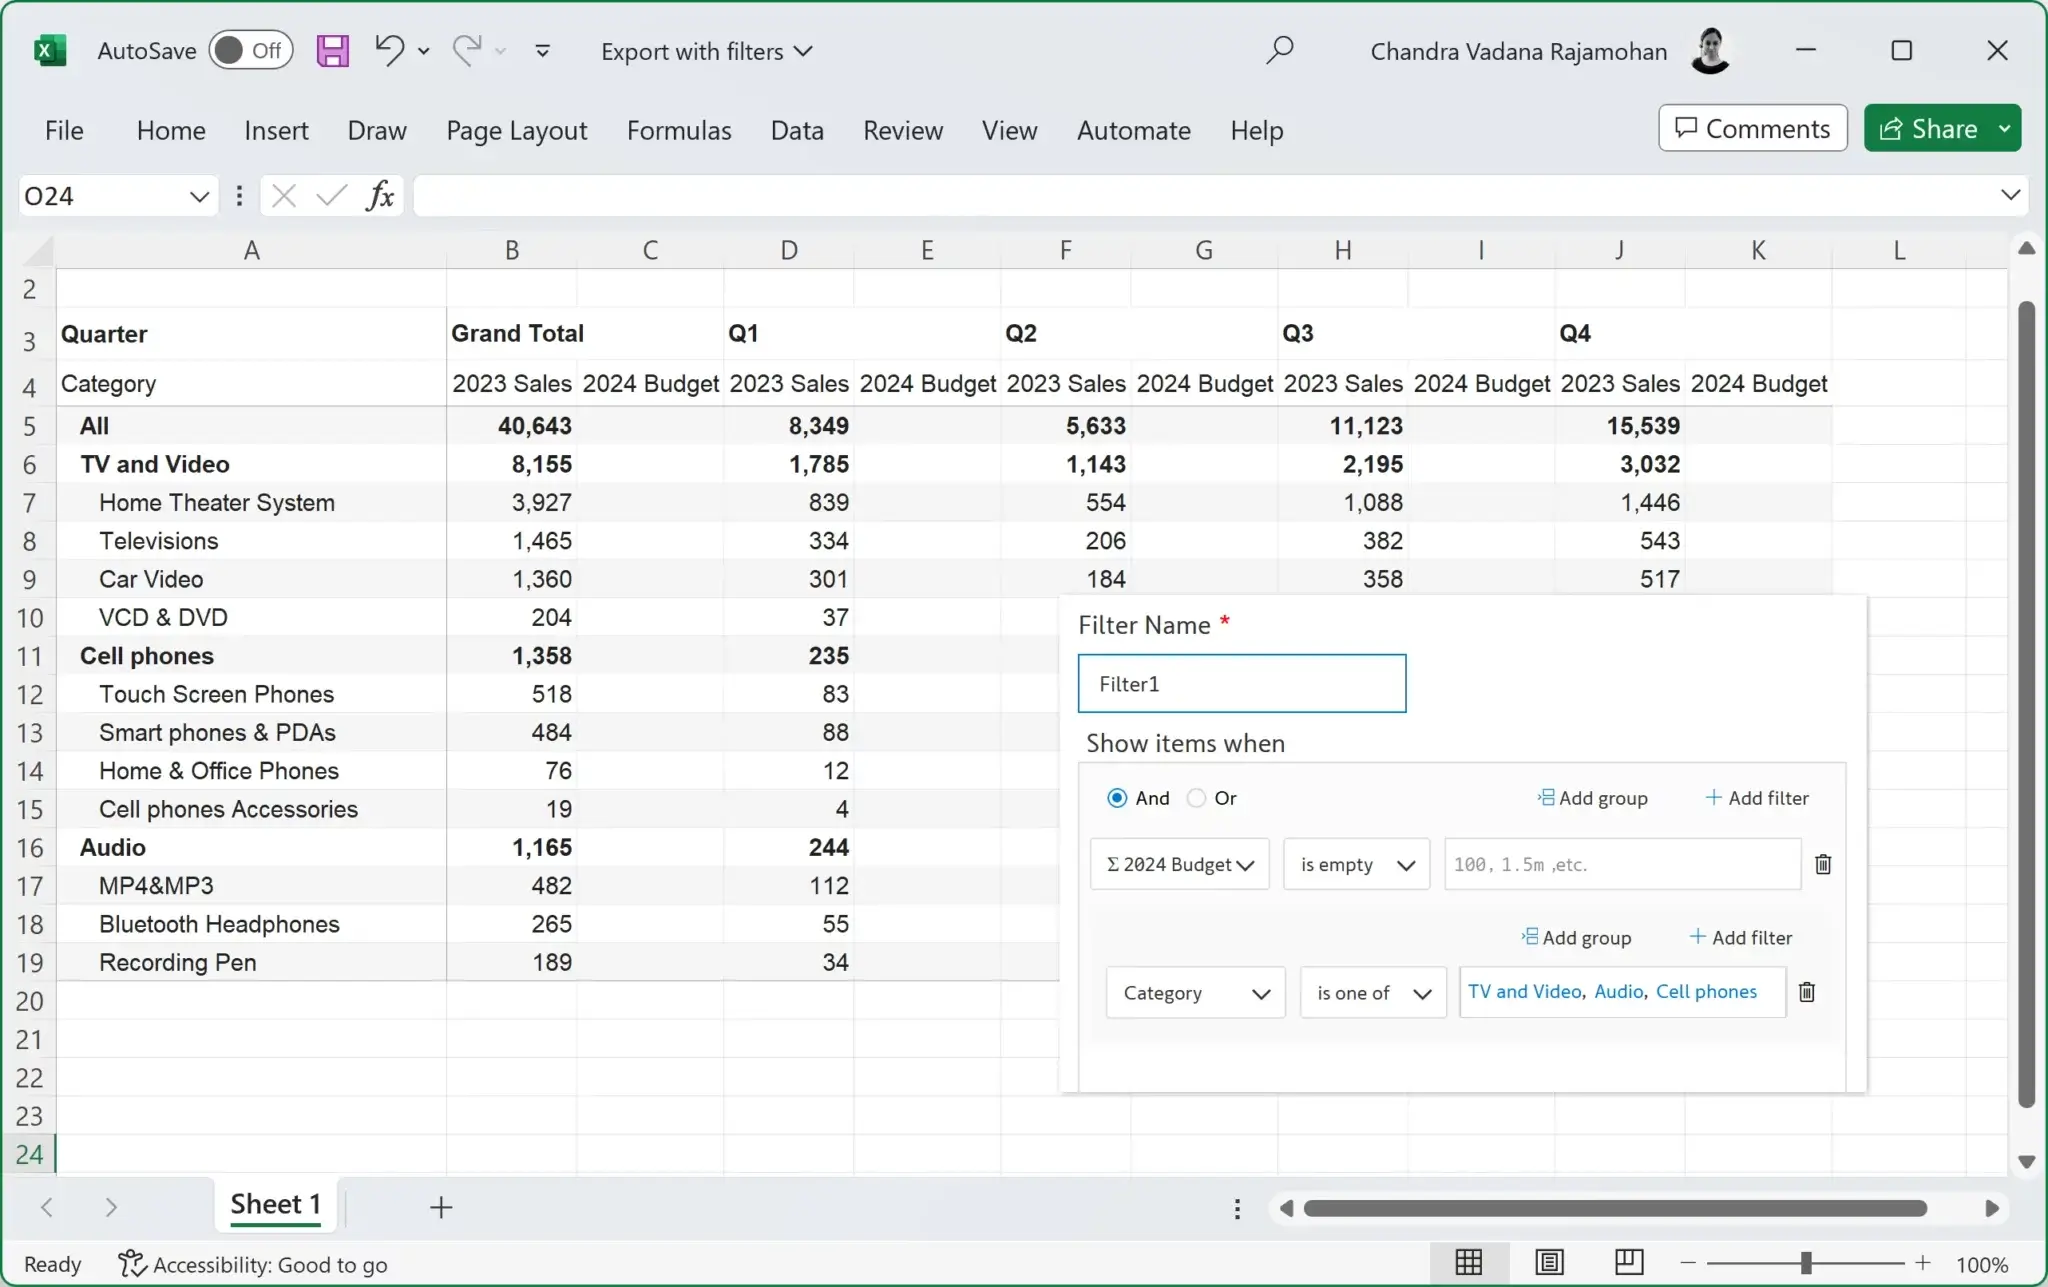
The advanced and nested (and/or) filters applied to the table are retained when exporting as a Excel file.
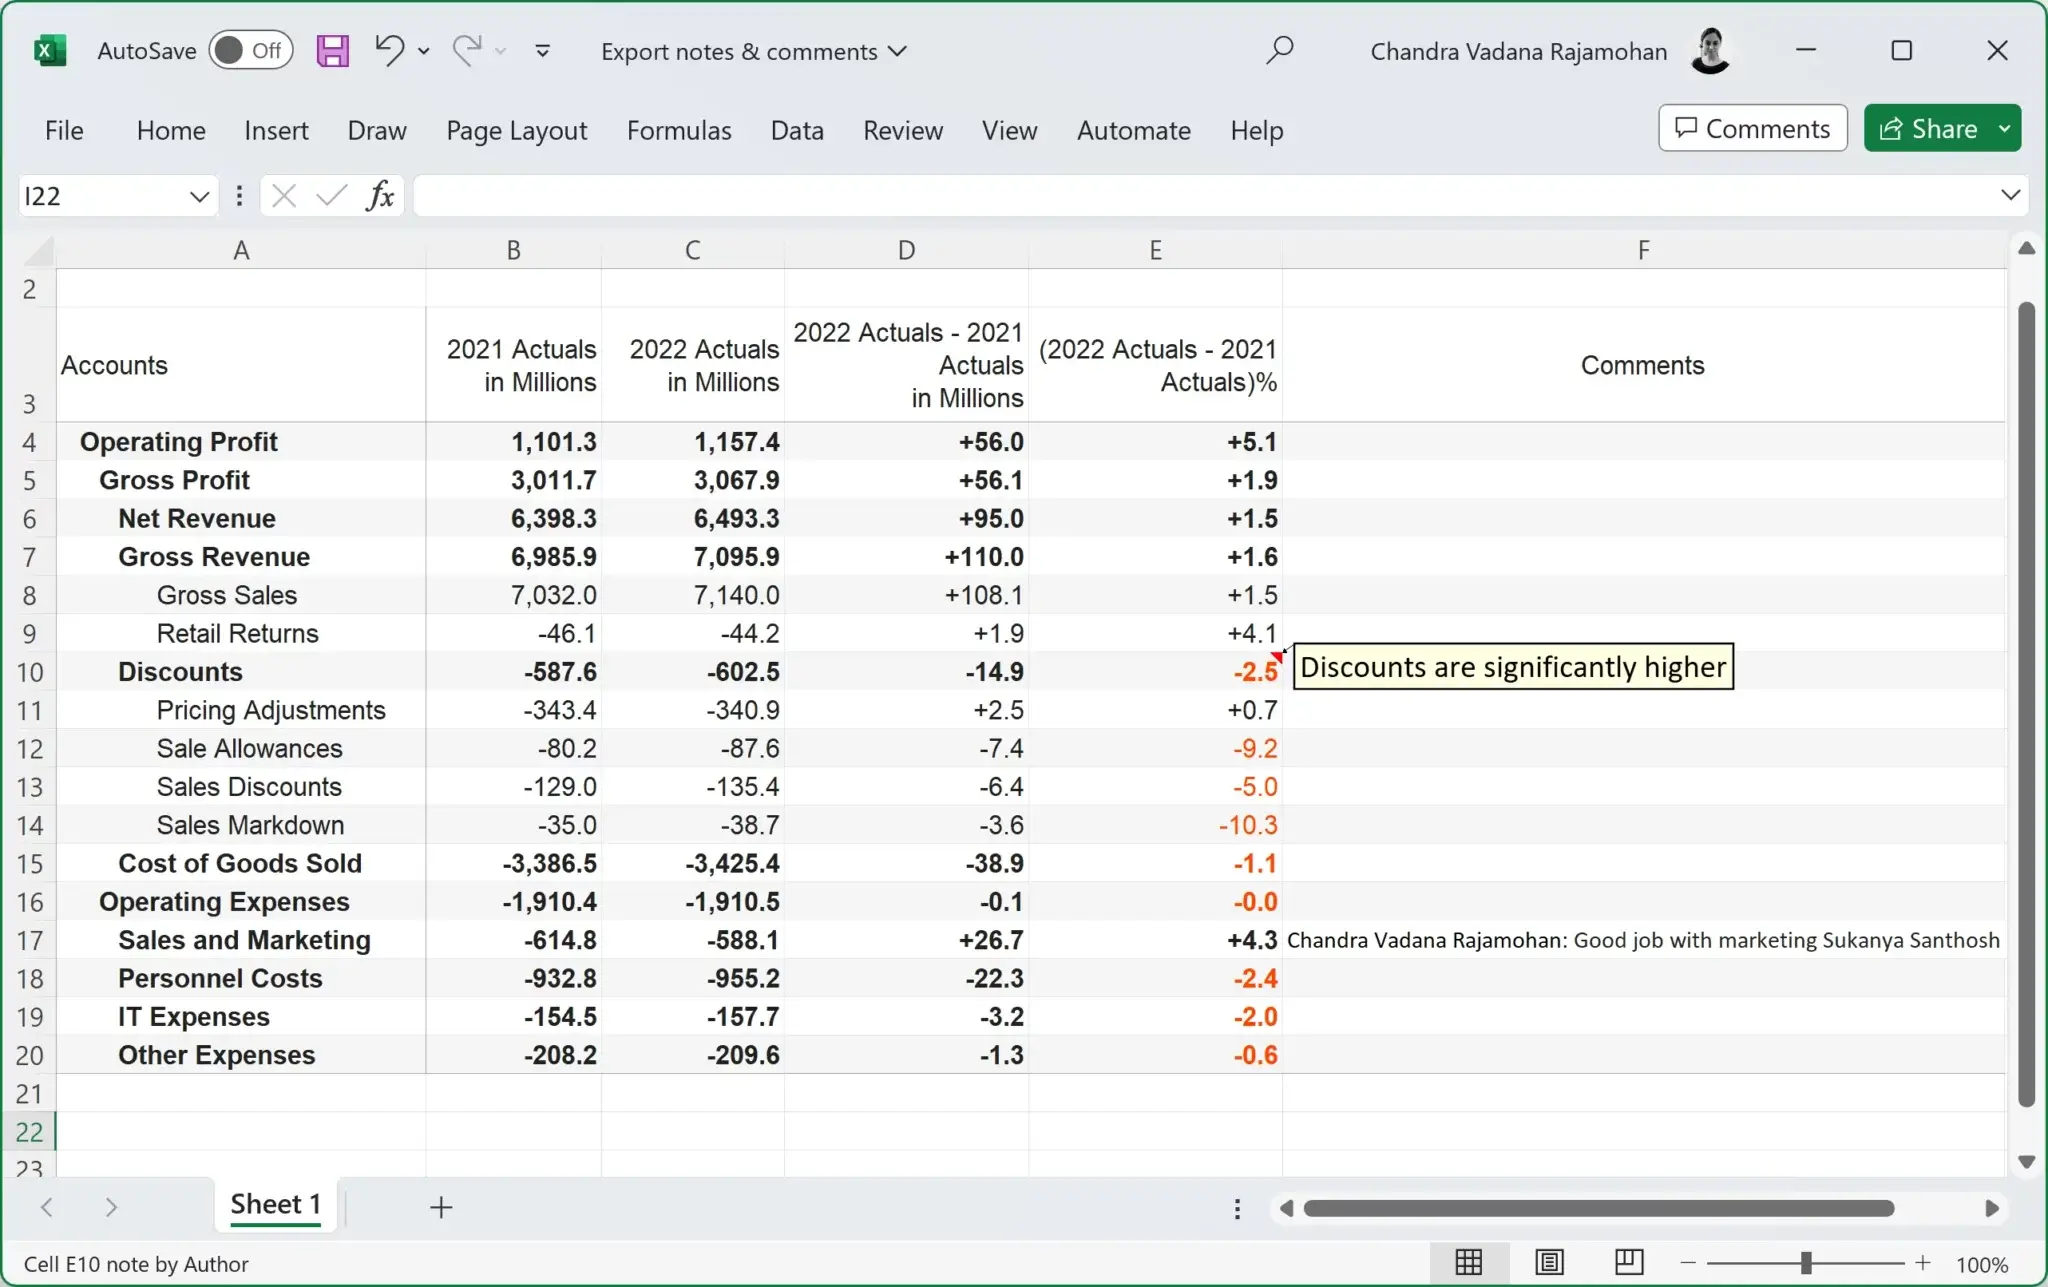
The inline notes and notes & comments columns are retained in the Excel file, as shown below.
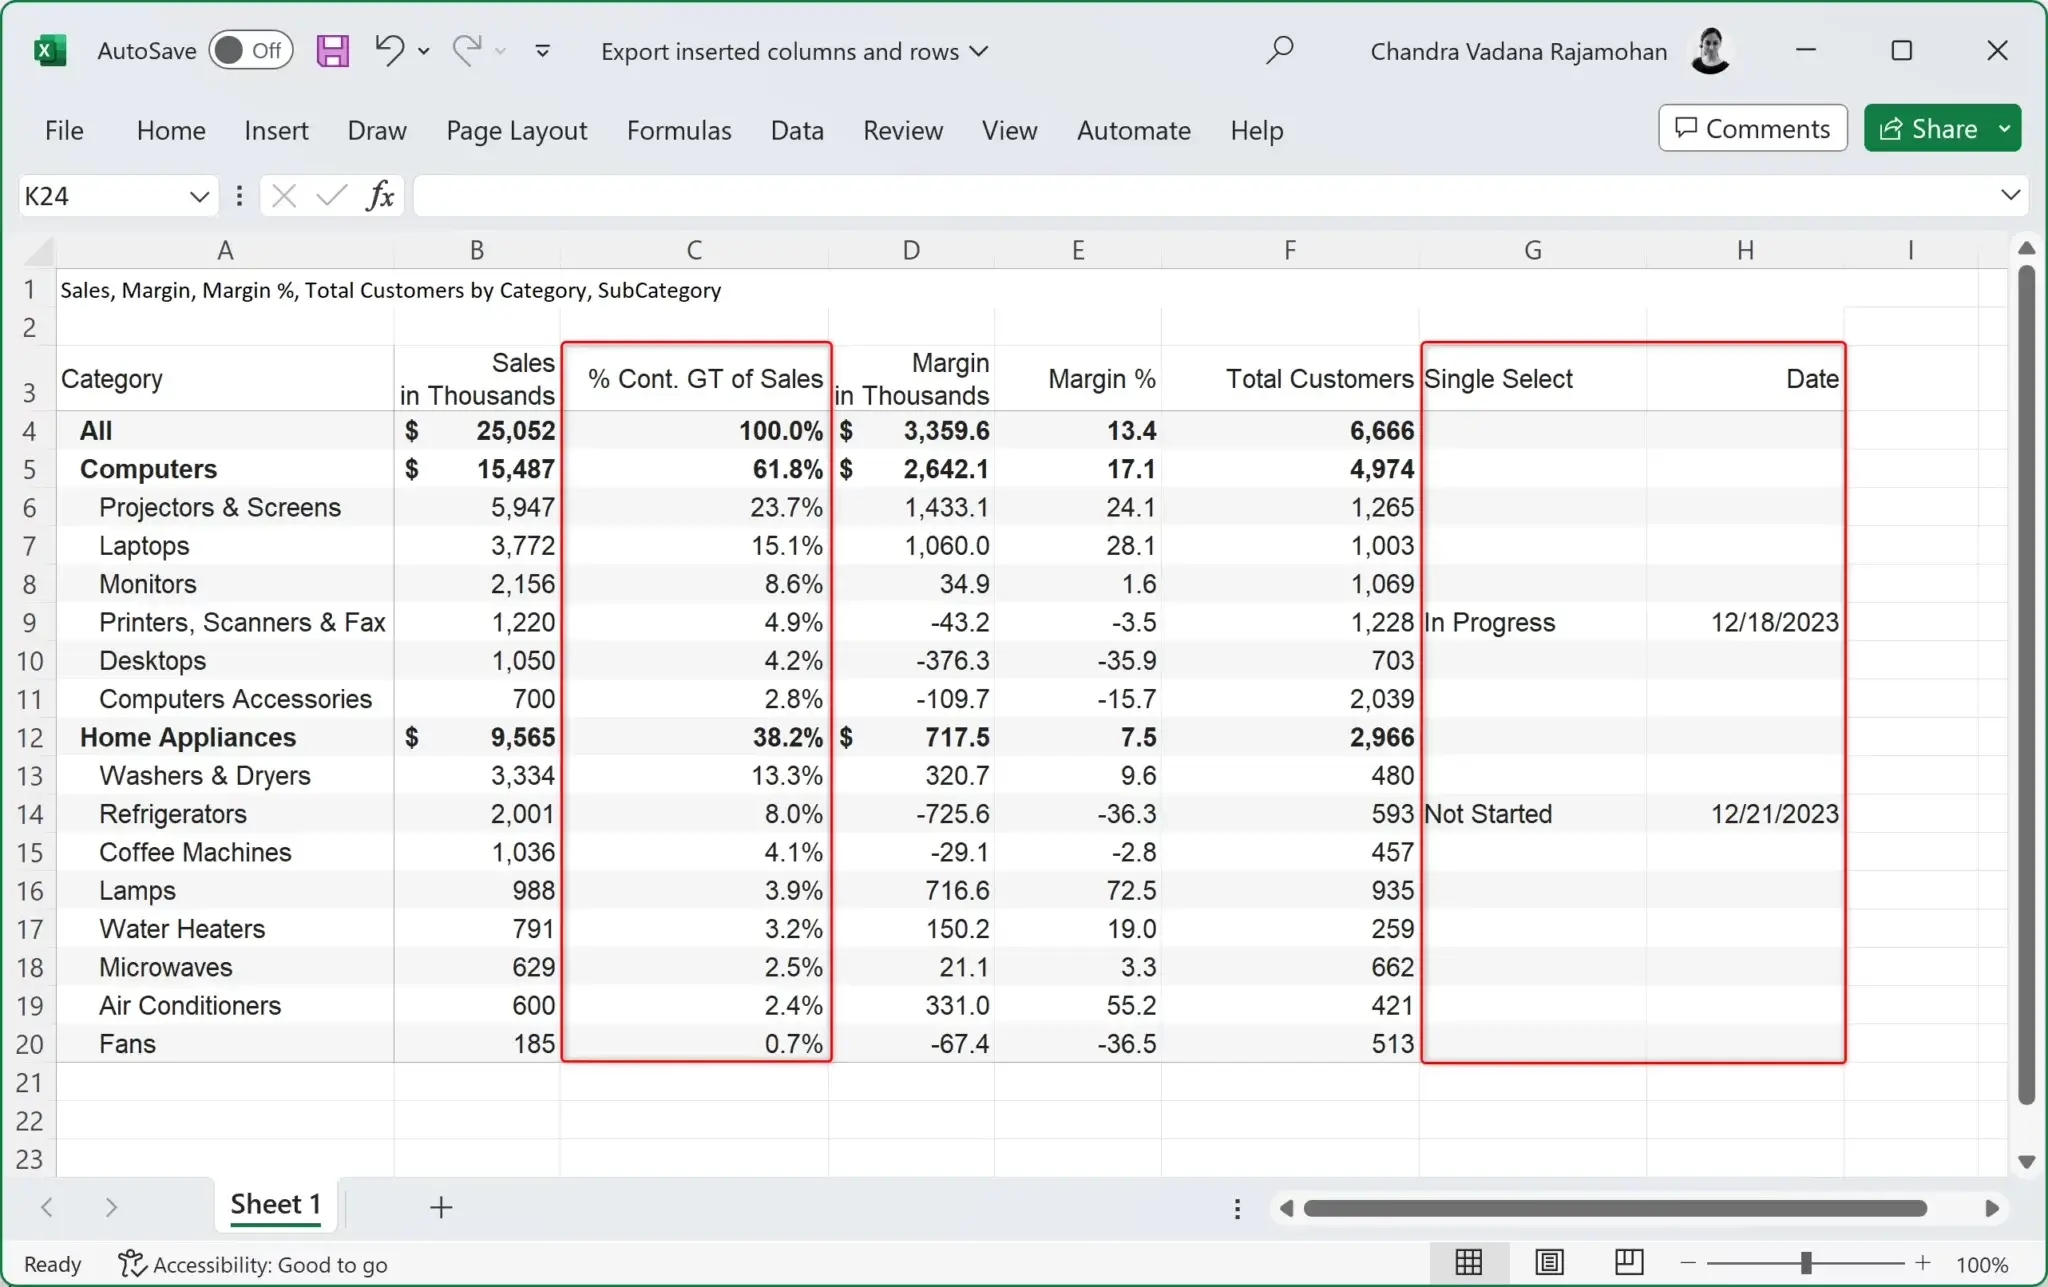
Manual data entry and calculated columns, measures, and rows created by the user in the visual can also be exported. The following image shows the three inserted columns in the exported Excel file - a contribution column (in a single click using quick formulas) and two manual input columns for capturing status and date.
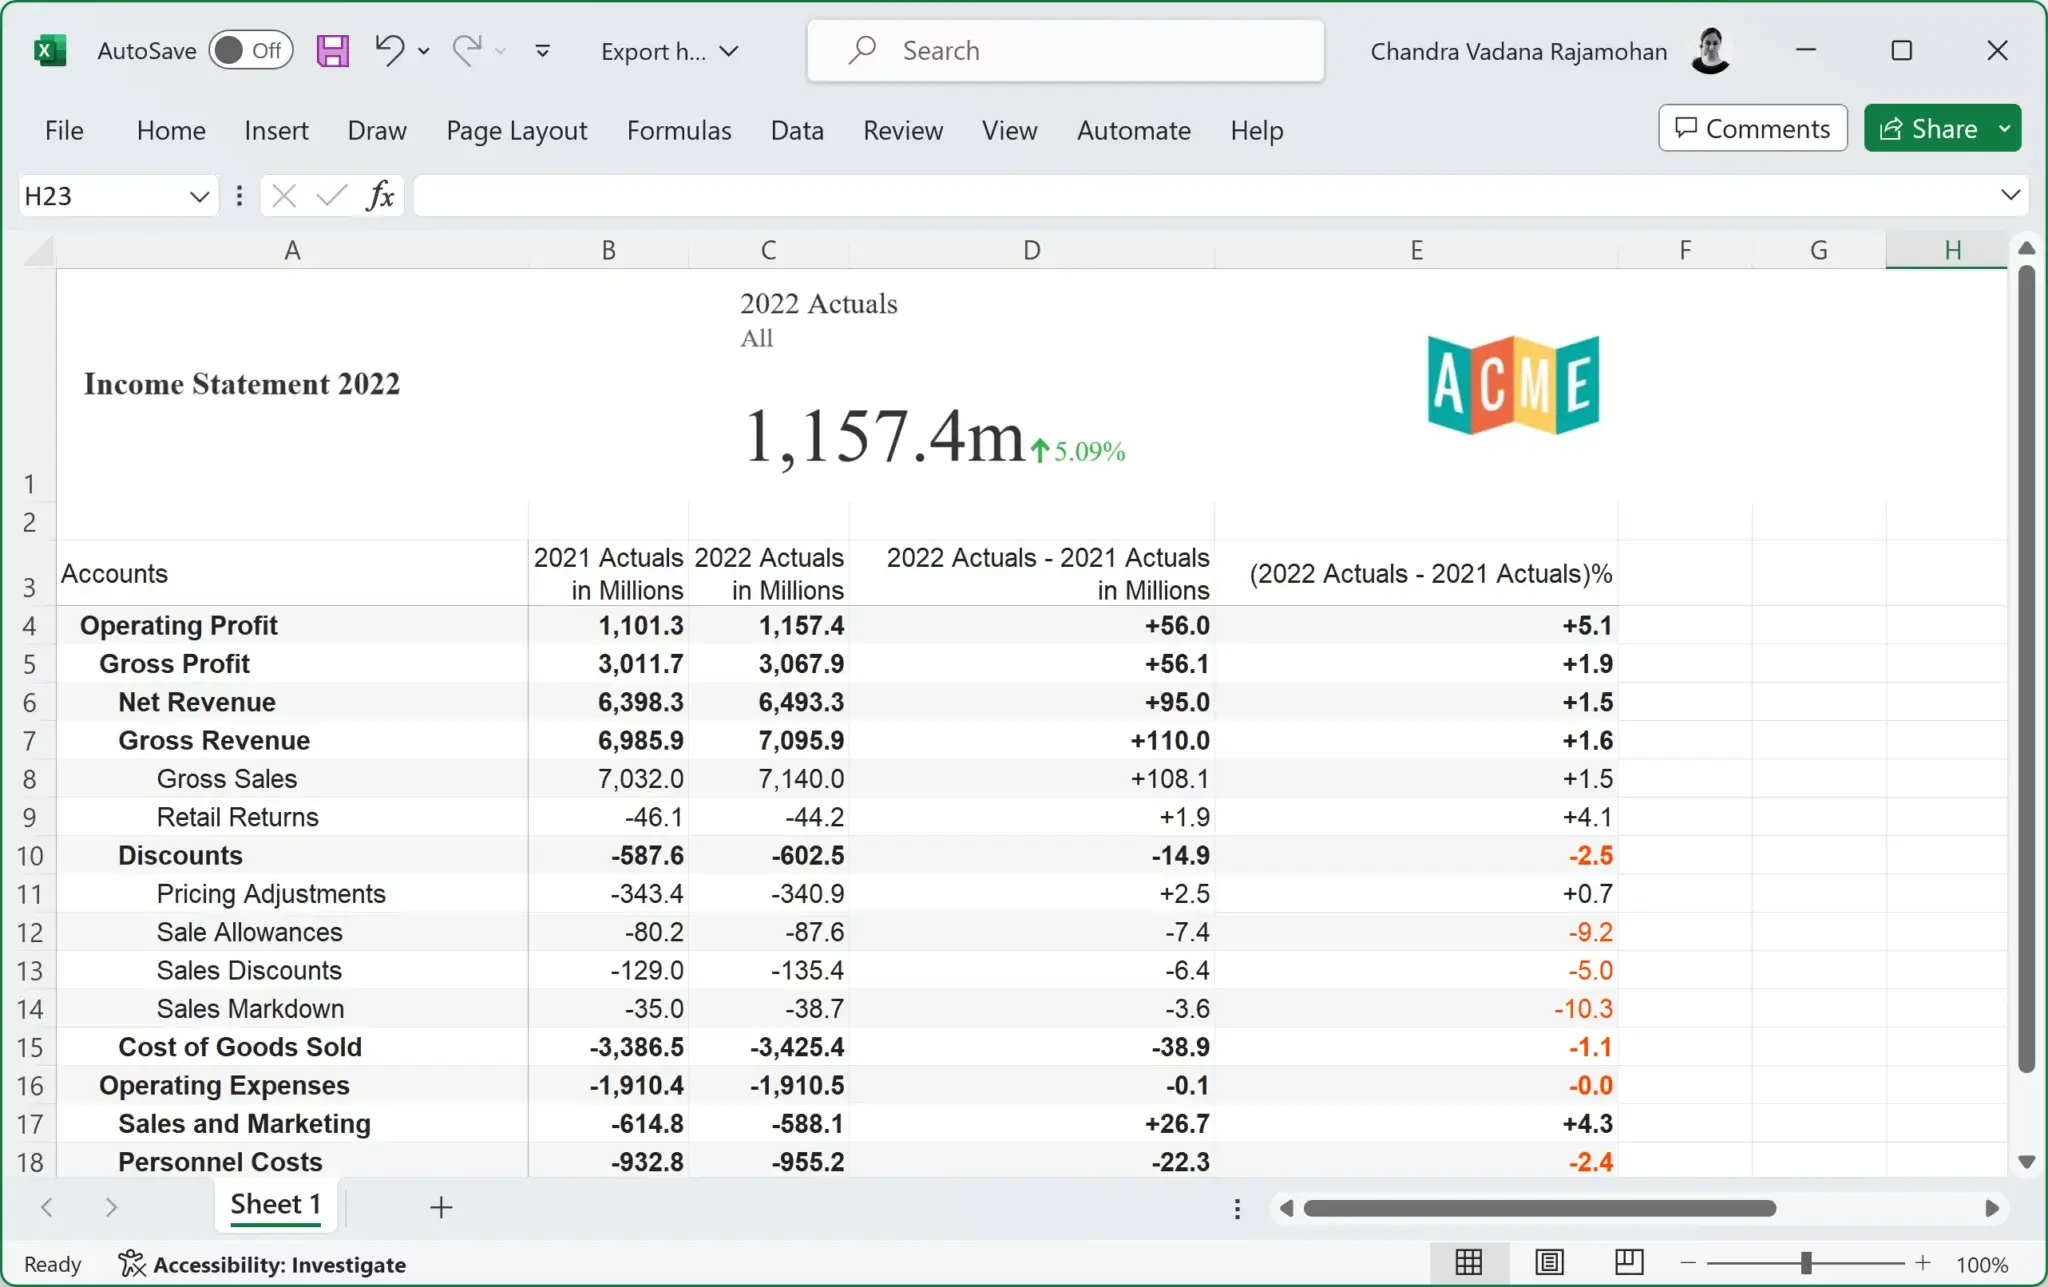
The report header, including charts, KPI cards, and images, can be exported. Note that the header is exported as a single image.
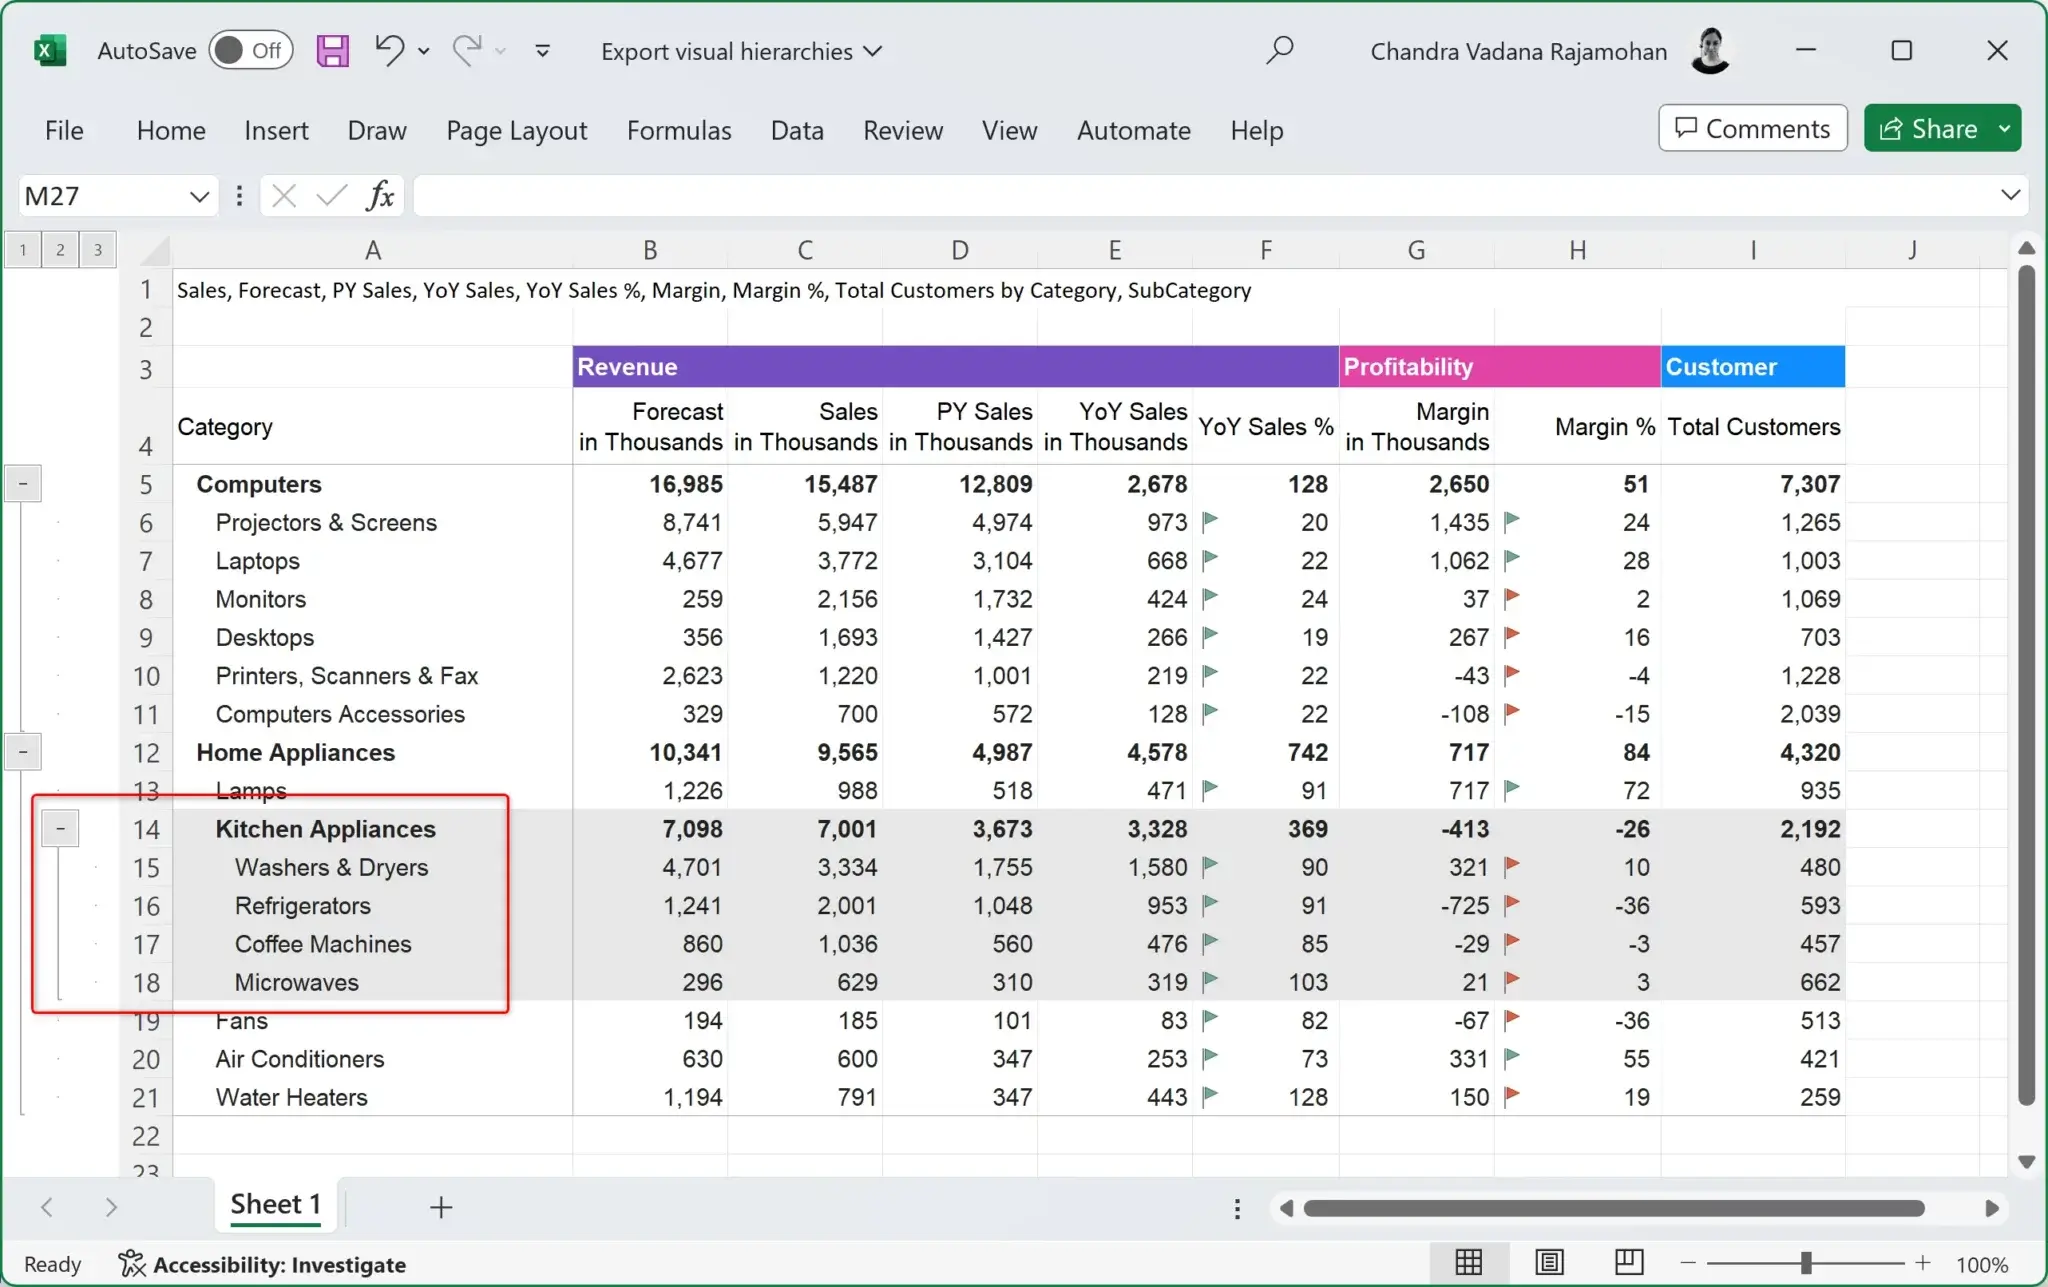
The row and column hierarchies created using the ‘Group’ feature are retained in the exported Excel file. The following image shows the expand/collapse icons for a newly created hierarchy inside the visual – Kitchen Appliances. Similarly, the column groups – Revenue, Profitability, and Customer are also retained along with the formatting.
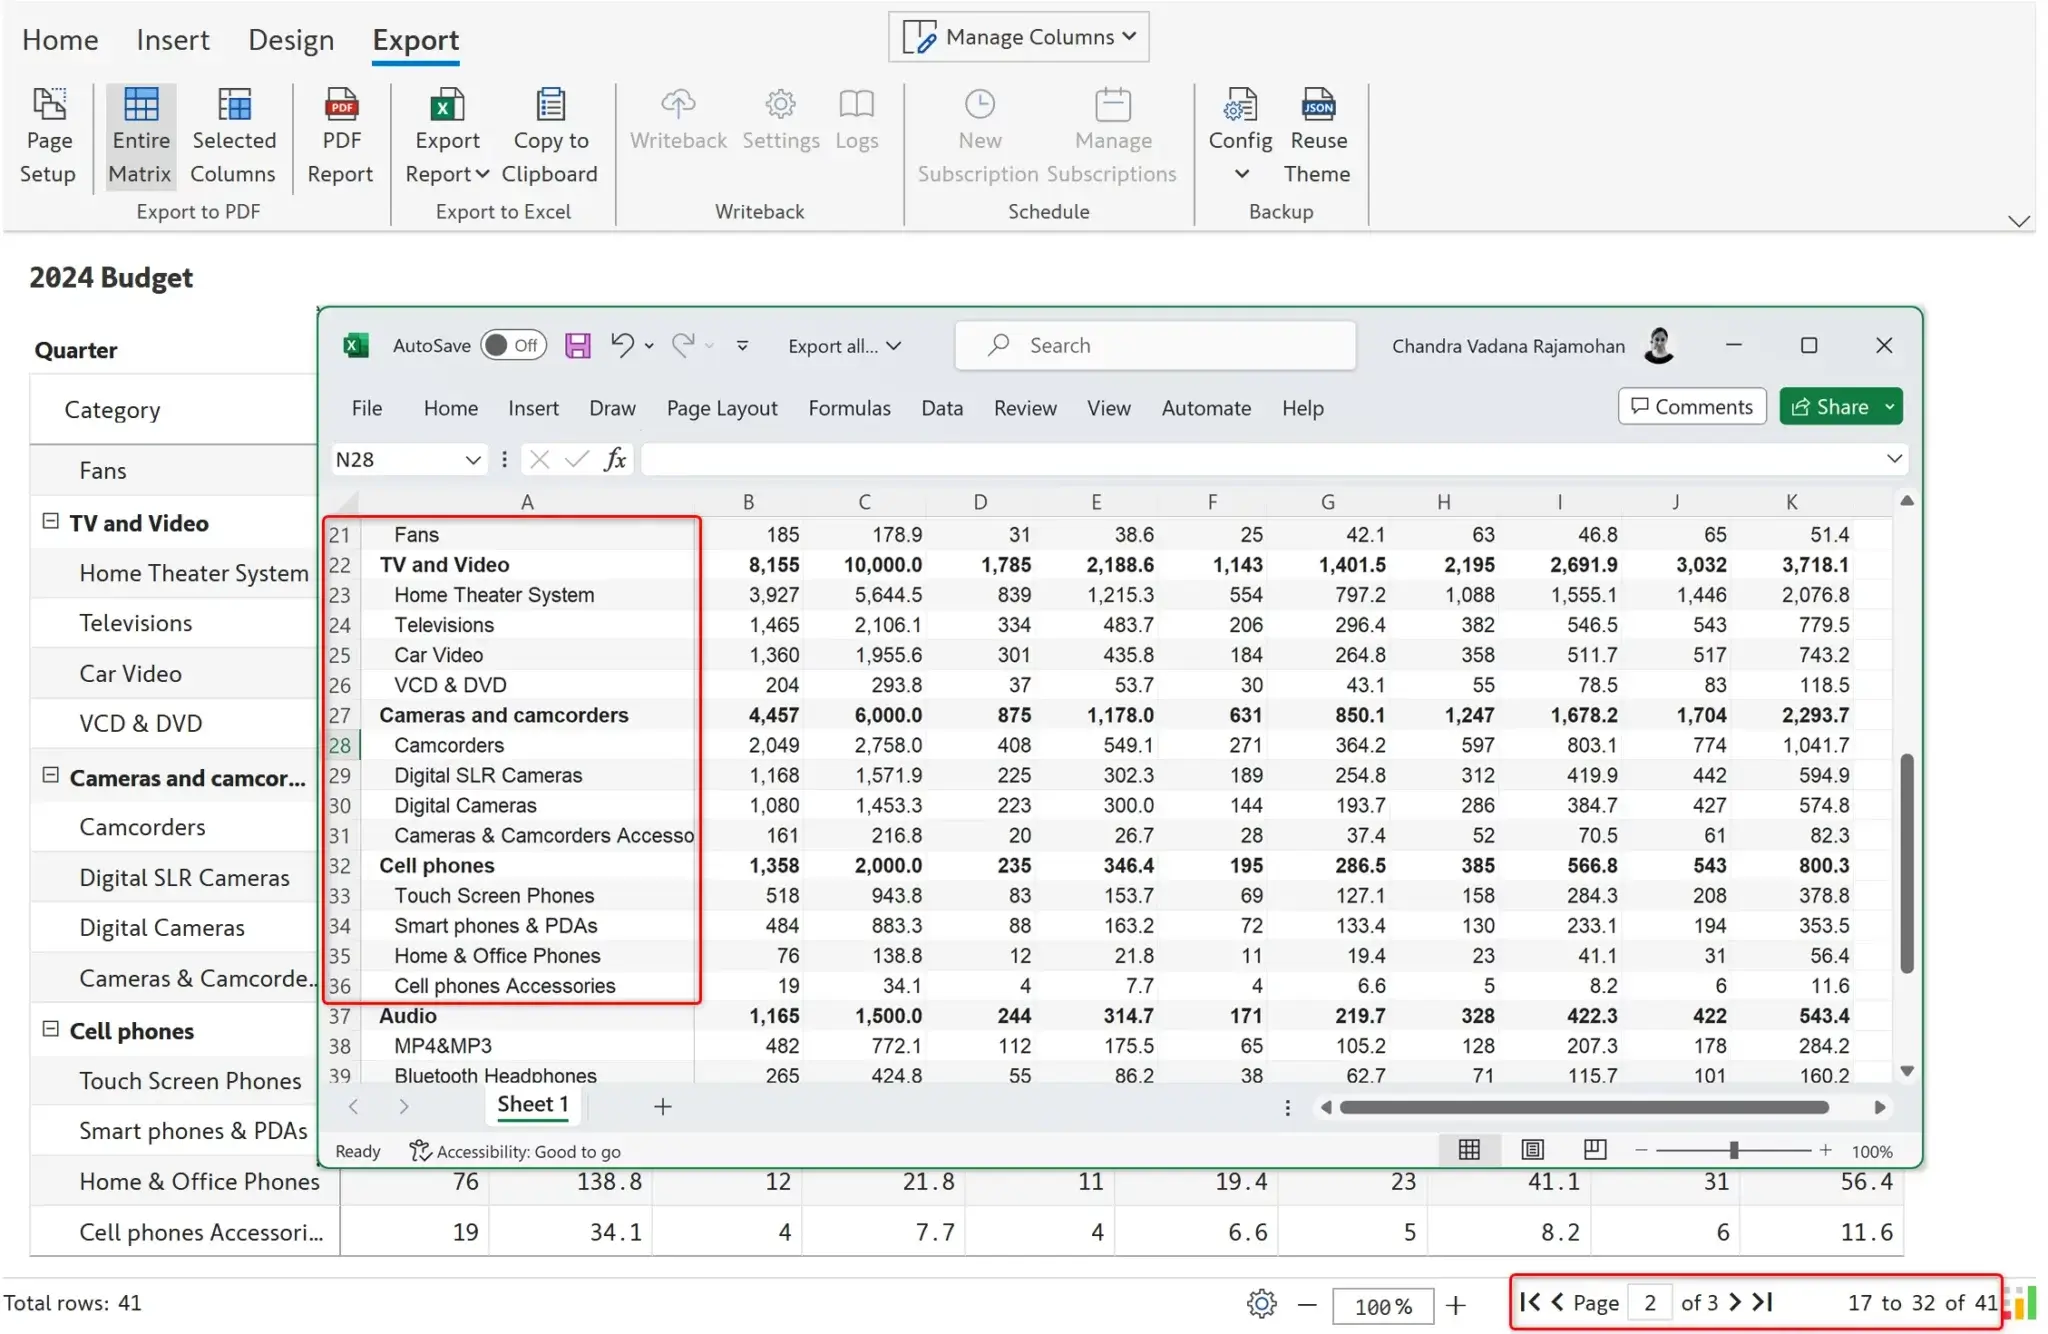
Export all rows and columns, not just the visible records on the page/screen. The categories TV and Video, Cameras and camcorders, and Cell phones, on the second page of the Inforiver report, are shown in the exported Excel.
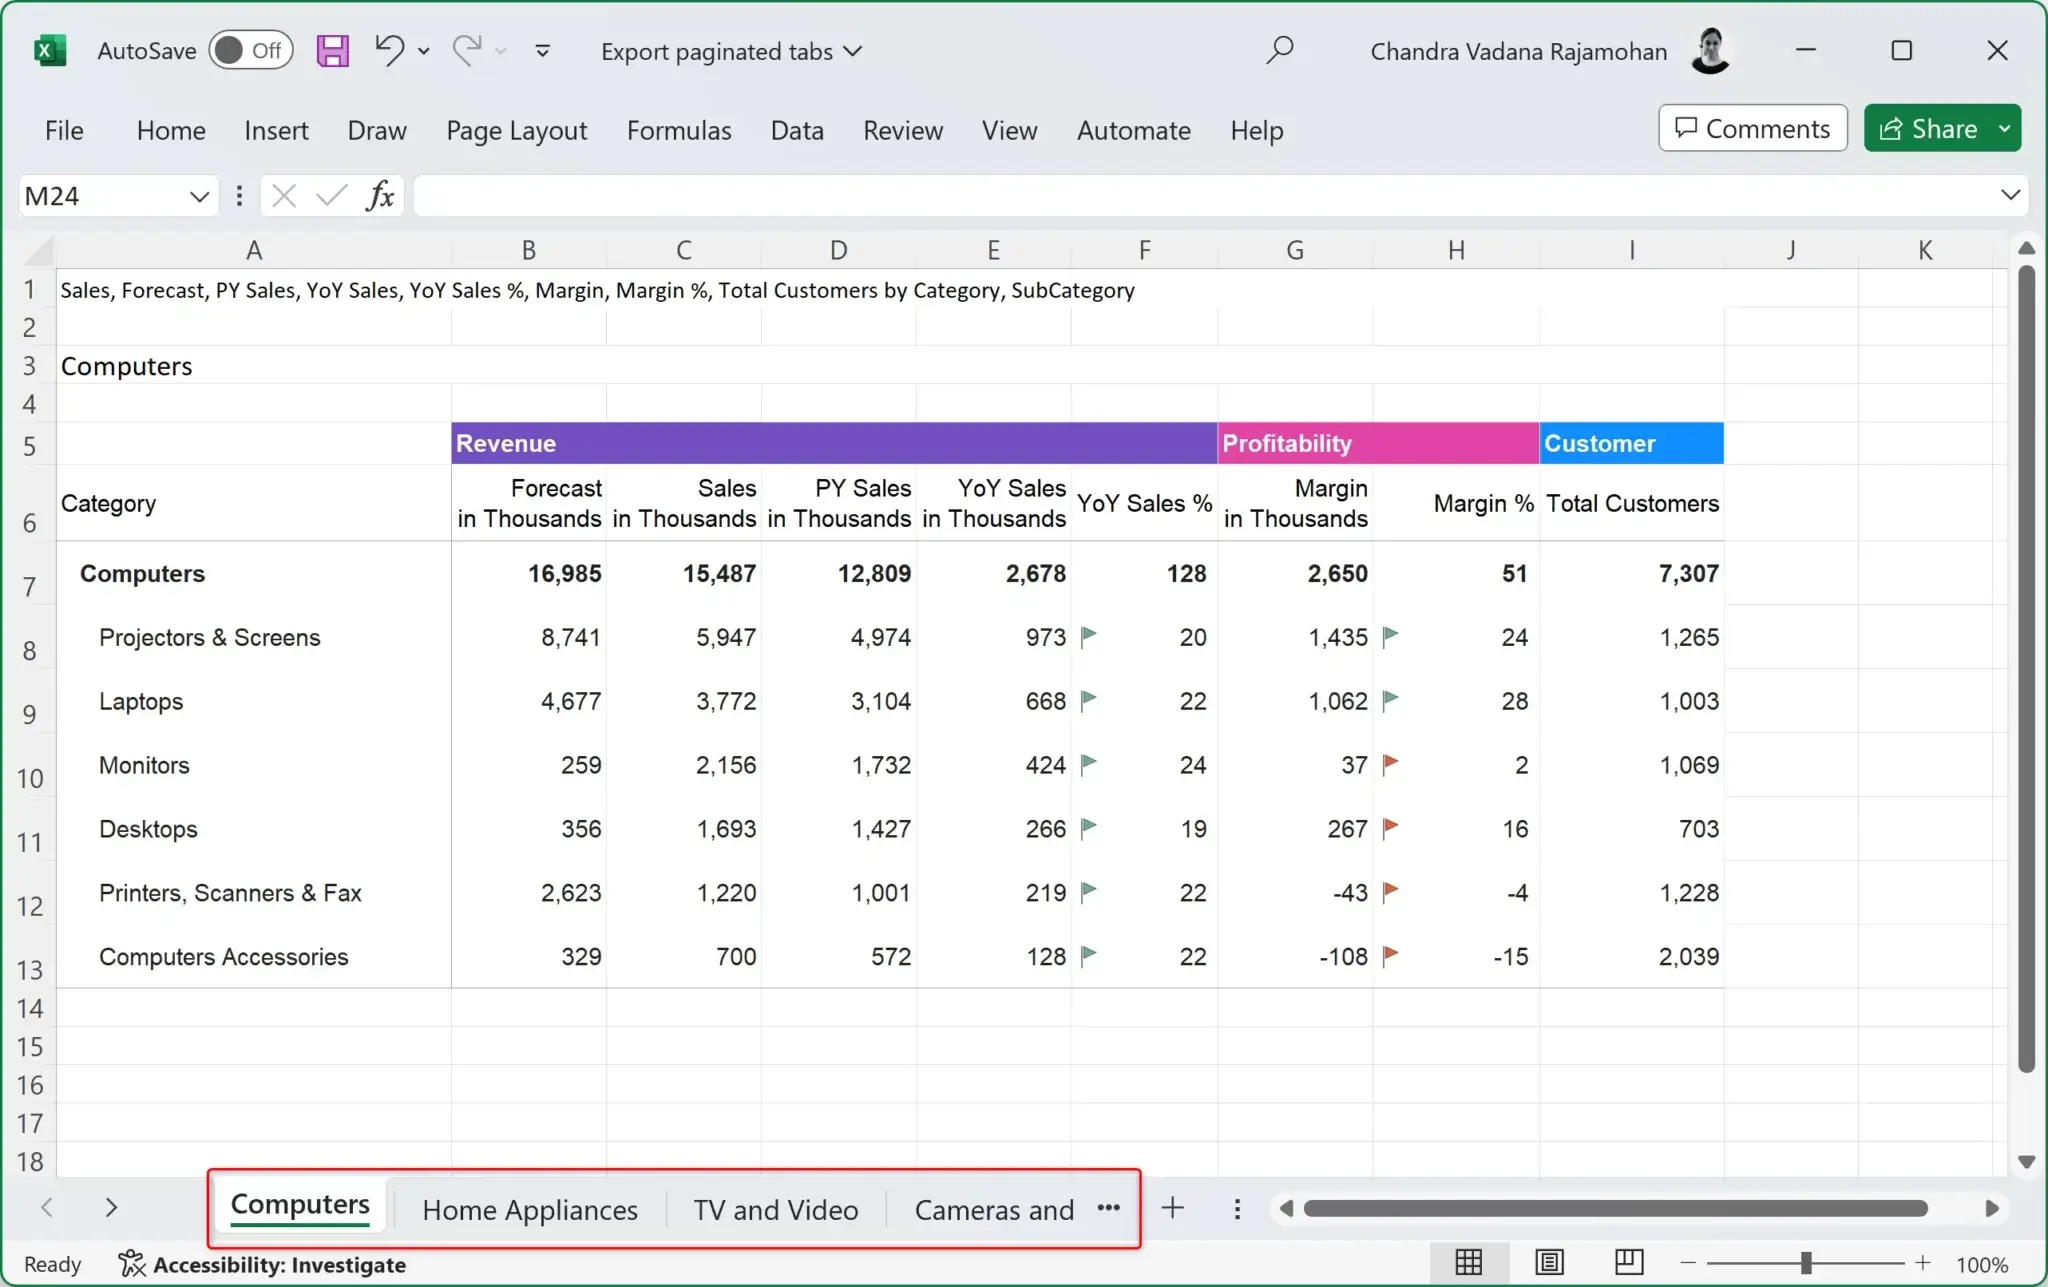
Export a single Inforiver table/matrix to multiple tabs in Excel using row or column breaks (Paginated export to Excel). In the below image, each category is shown in a separate tab.
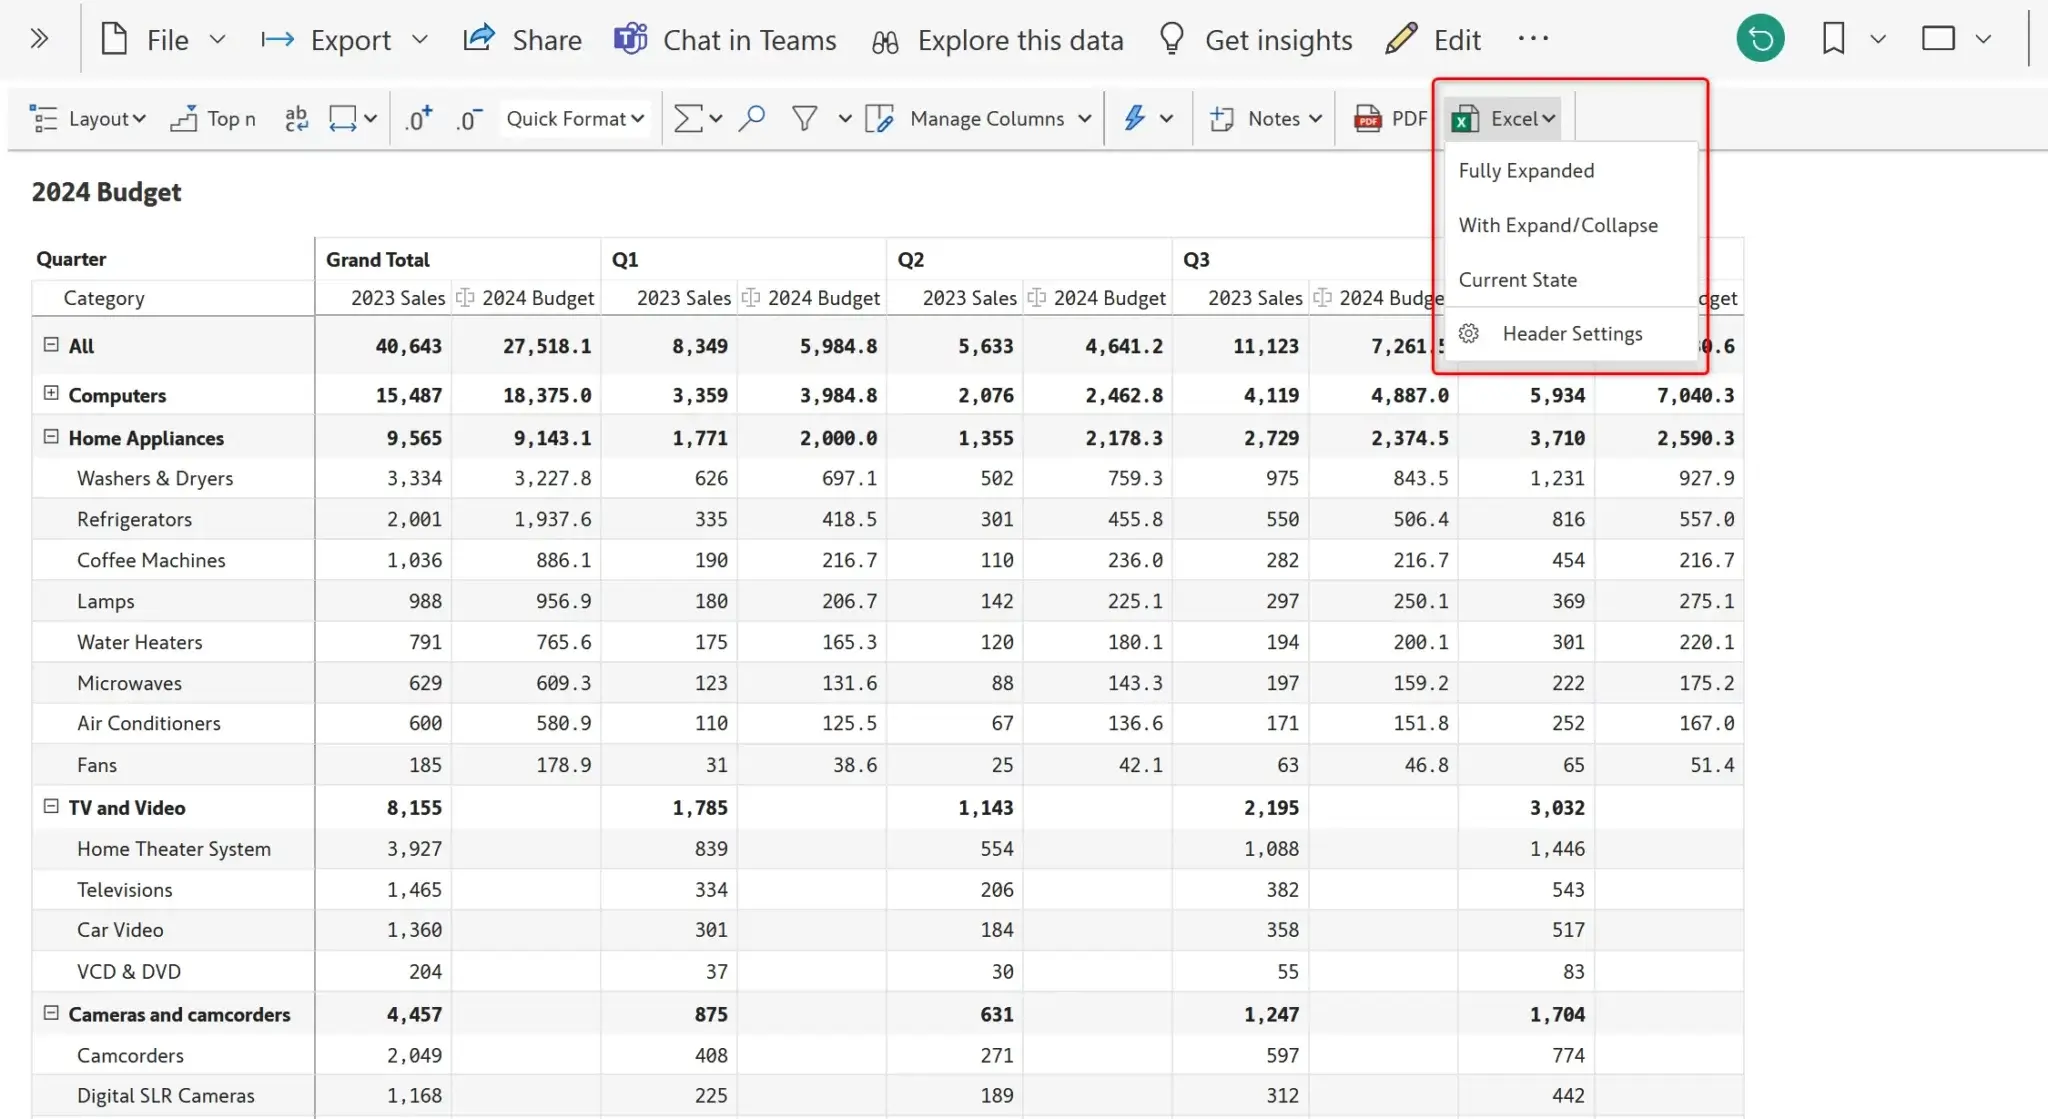
The end users in the reading view can customize the export using the options shown in the image below.
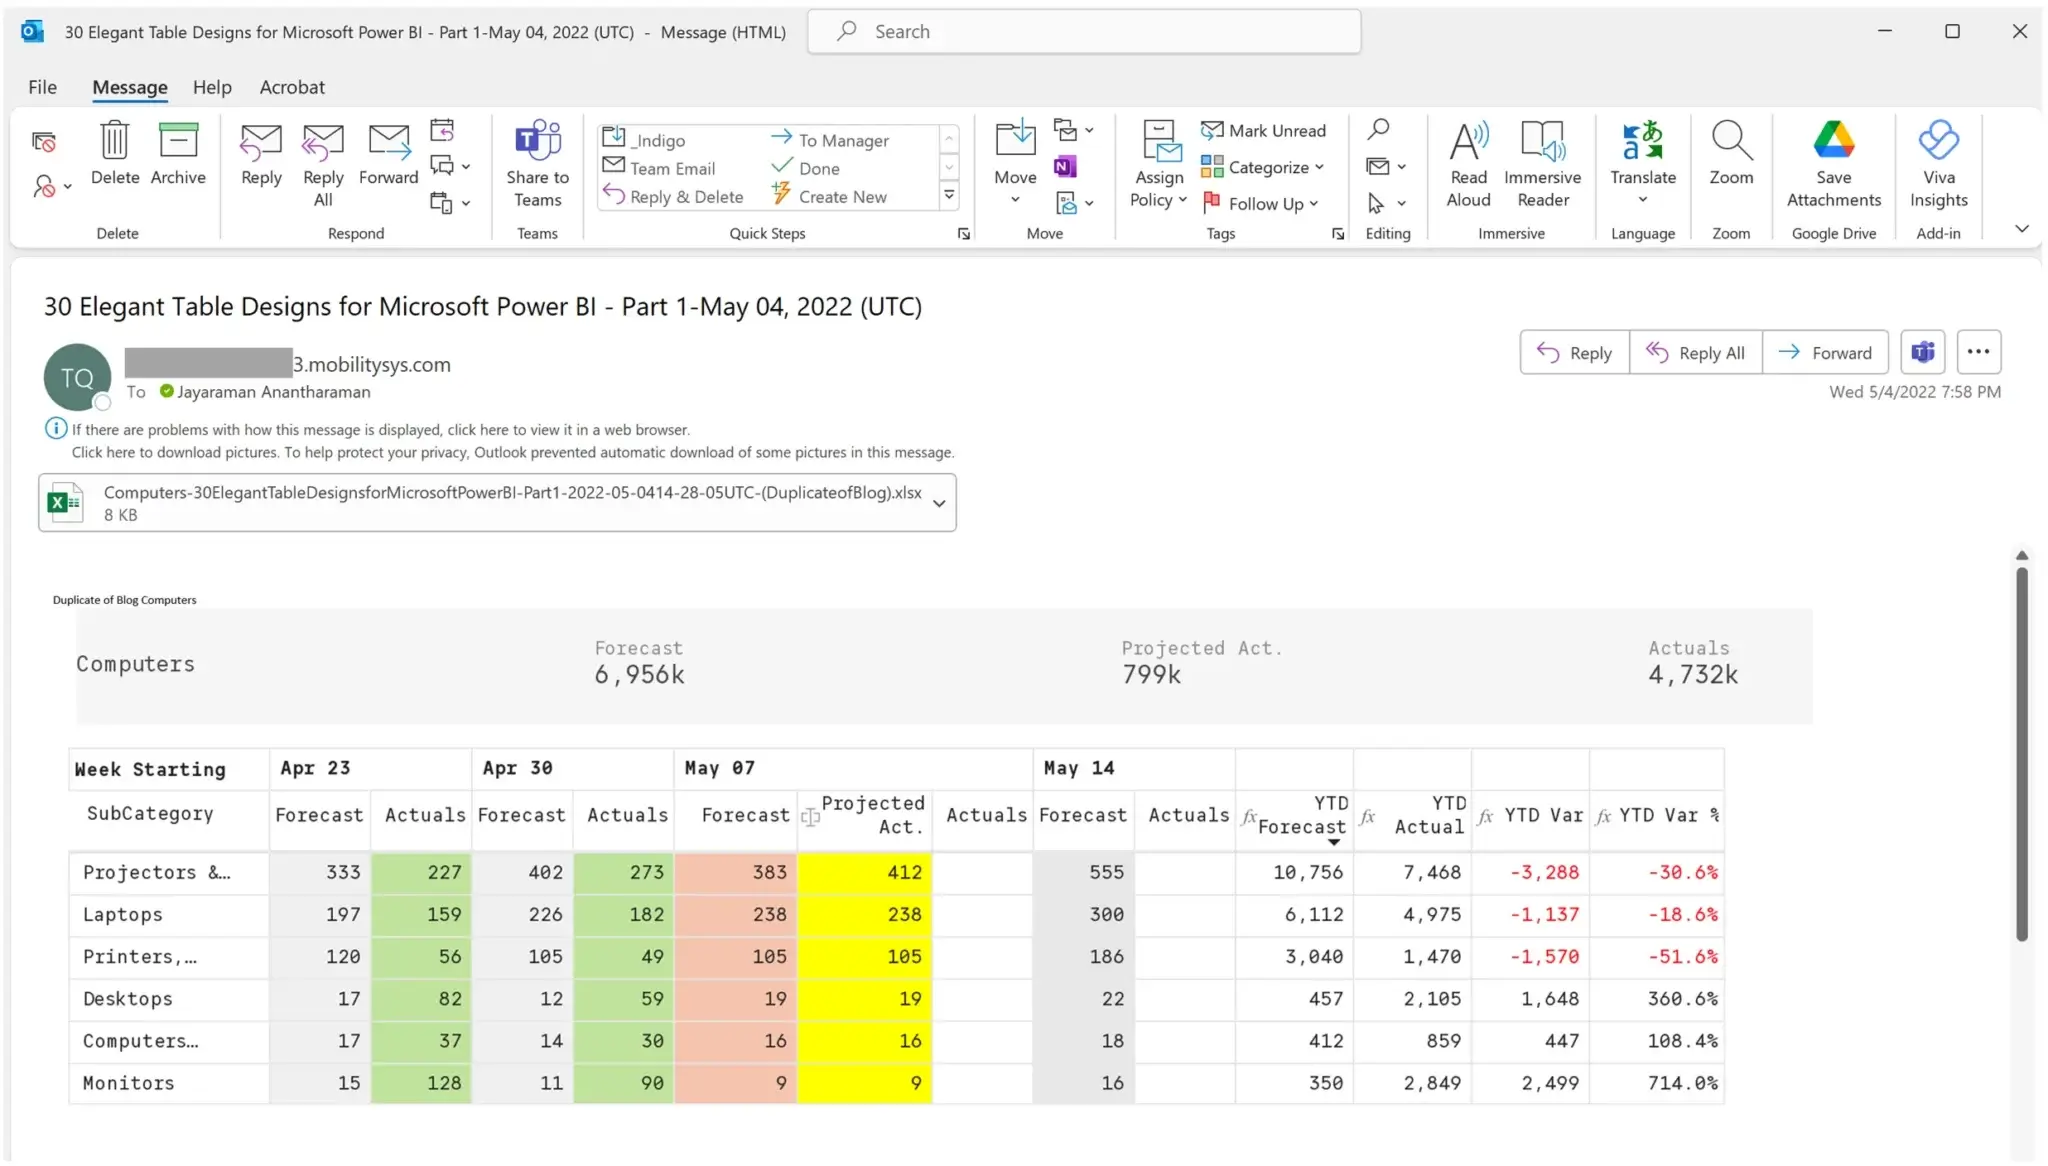
If you have Inforiver Enterprise, you can also schedule Excel files for users in your organization. Users can receive the Excel file in an email based on schedule frequency - e.g., daily, Tuesdays & Thursdays, monthly, etc.
Here is a brief video outlining formatted Export to excel using Inforiver in Power BI.
To summarize, Inforiver delivers strong capabilities that help you export your Power BI reports to Excel while preserving formatting. Try the Export to Excel capability for yourself today.

Inforiver helps enterprises consolidate planning, reporting & analytics on a single platform (Power BI). The no-code, self-service award-winning platform has been recognized as the industry’s best and is adopted by many Fortune 100 firms.
Inforiver is a product of Lumel, the #1 Power BI AppSource Partner. The firm serves over 3,000 customers worldwide through its portfolio of products offered under the brands Inforiver, EDITable, ValQ, and xViz.