Upcoming webinar on 'Inforiver Charts : The fastest way to deliver stories in Power BI', Aug 29th , Monday, 10.30 AM CST. Register Now
Upcoming webinar on 'Inforiver Charts : The fastest way to deliver stories in Power BI', Aug 29th , Monday, 10.30 AM CST. Register Now
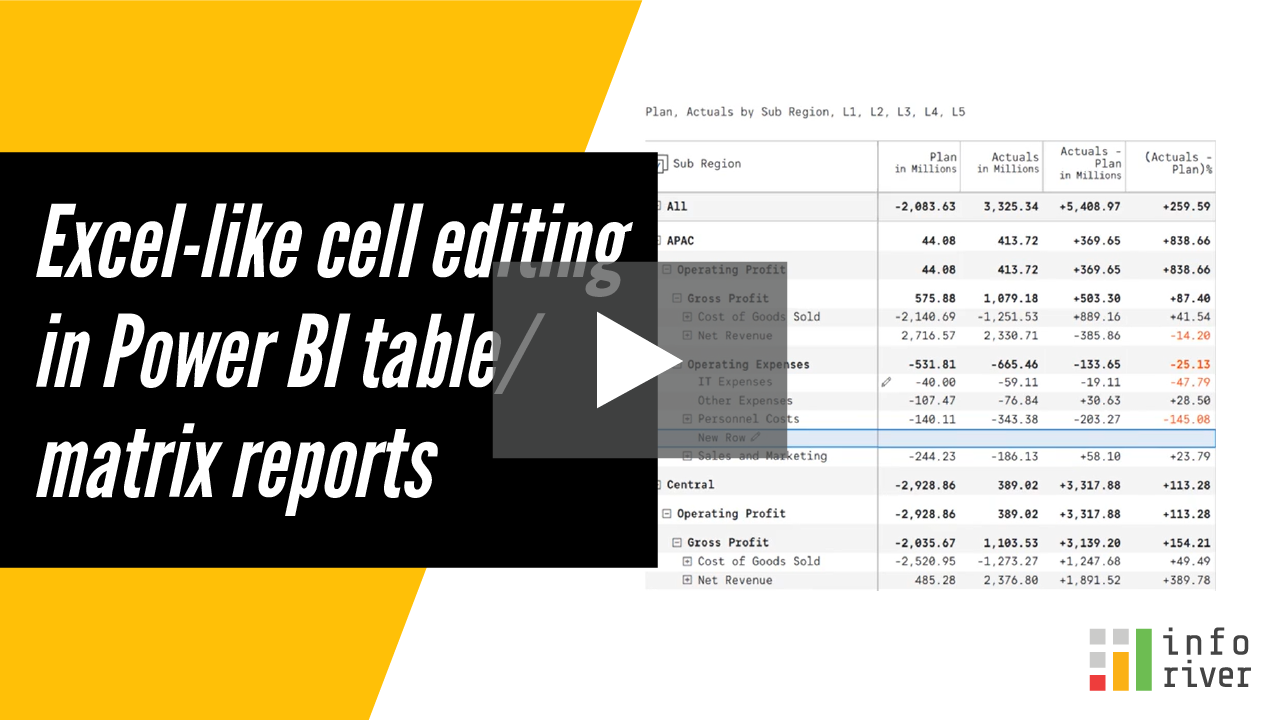
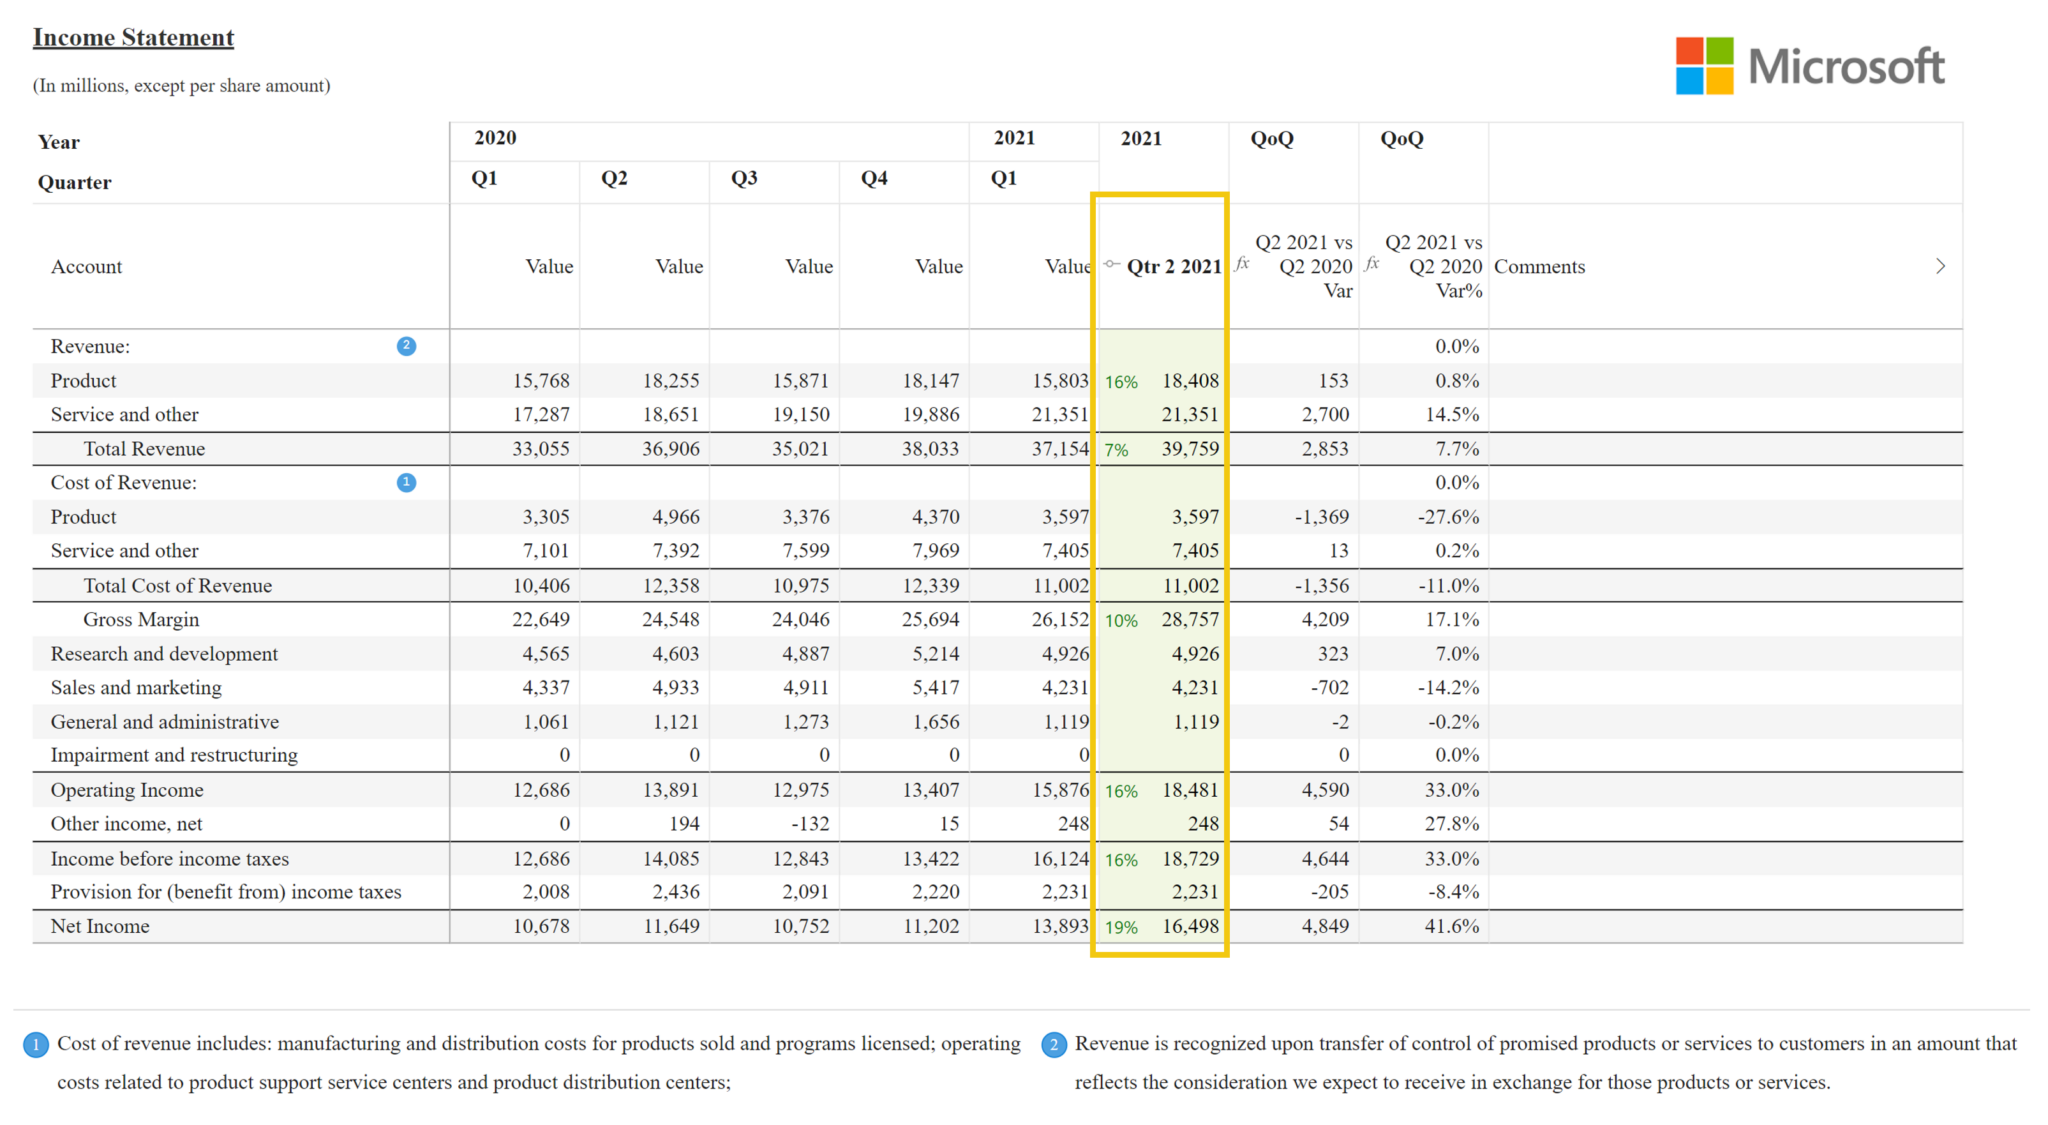
Create financial reports with Excel-like formatting in Power BI. Inforiver supports an Excel-like cell editing experience where you can enter data directly in any cell. Notice that the column headers are vertically oriented to deliver tightly packed columns, just as in your Excel financial reports.
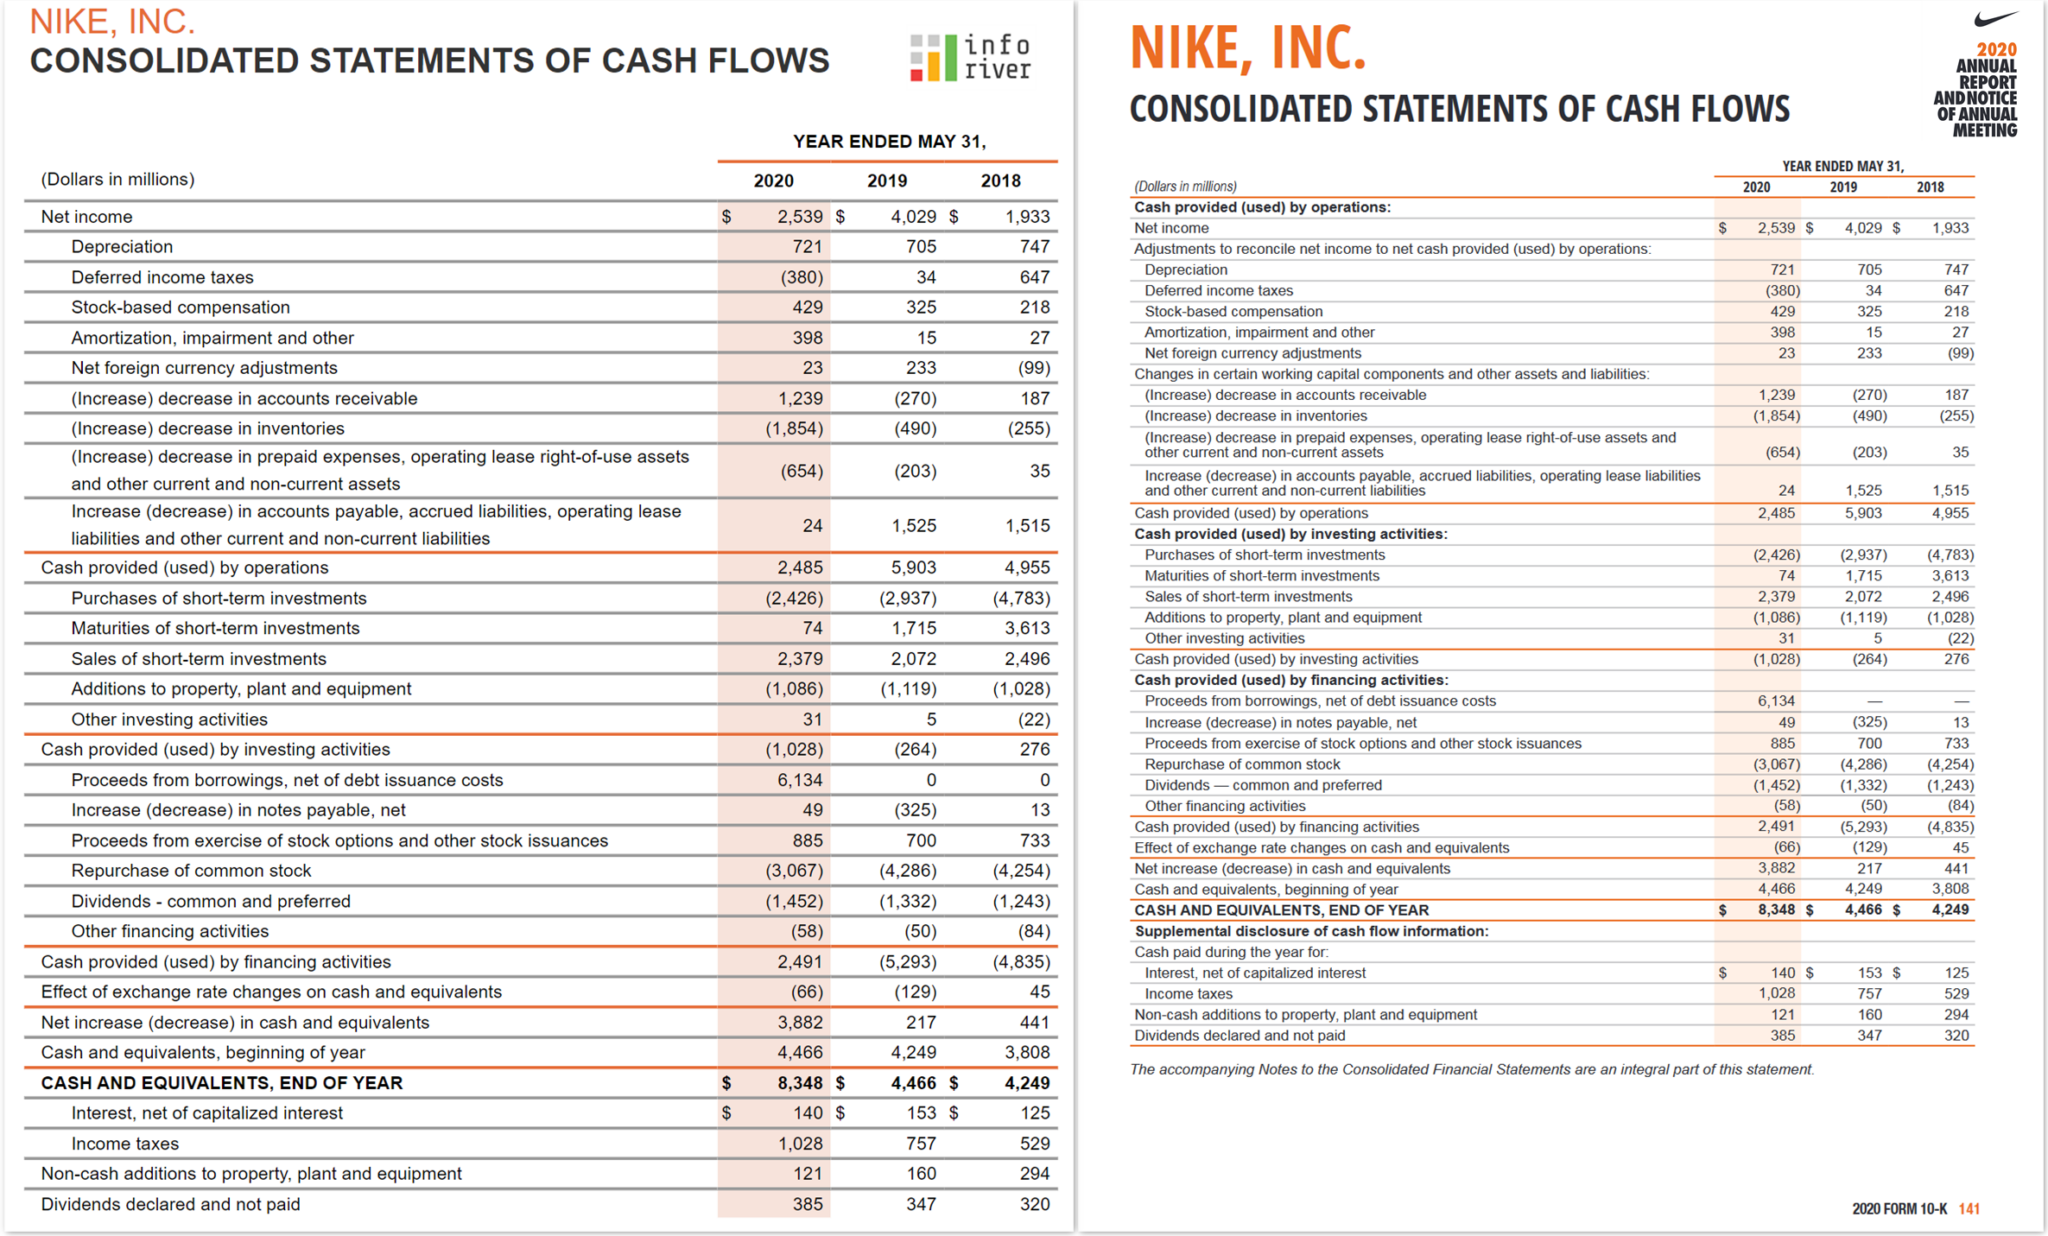
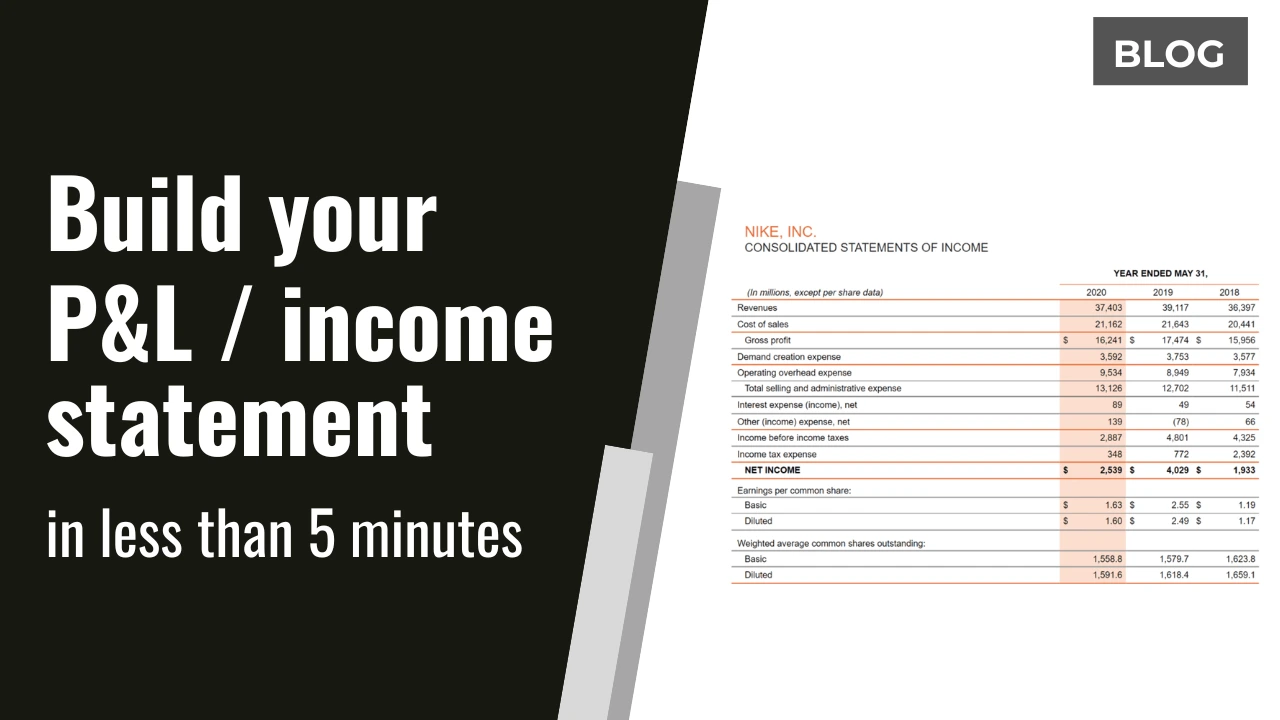
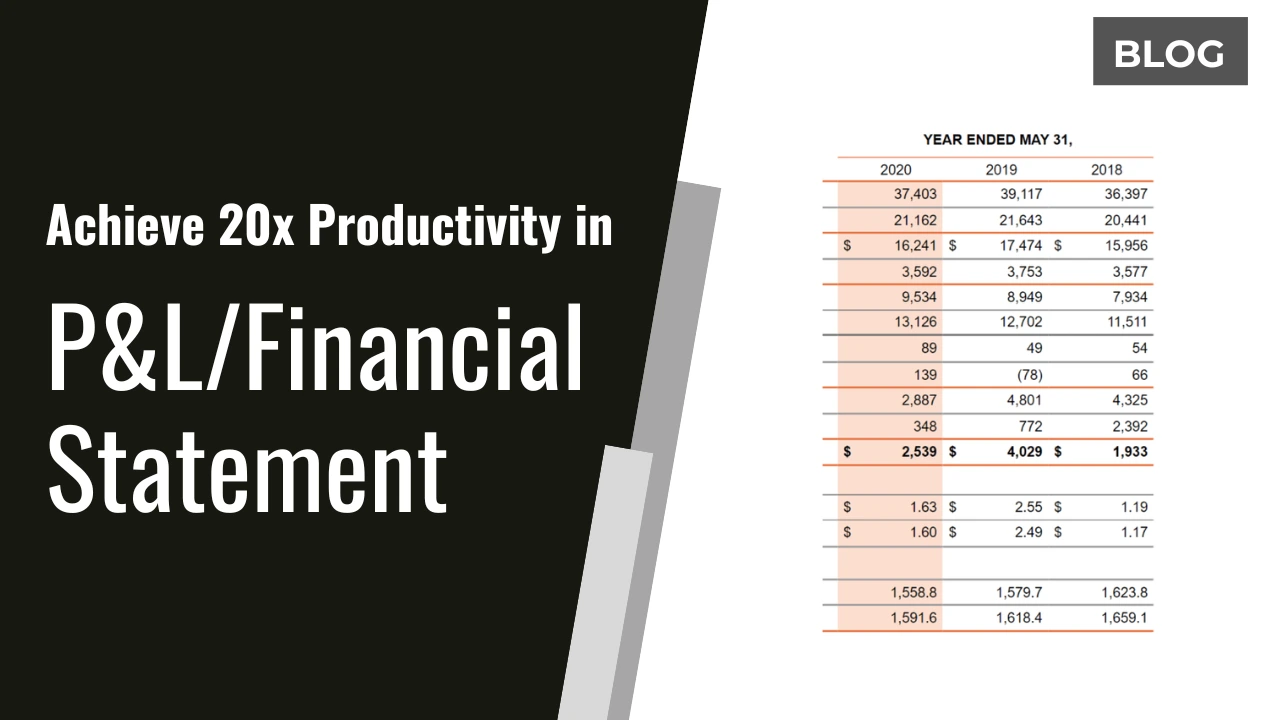
Create financial statements supporting brand guidelines (as they appear in annual reports). Here is Nike's 2020 cash flow statement taken from the annual report (on the right) and the same statement reproduced using Inforiver in Power BI (on the left). Inforiver helps you perform a variety of formatting that is harder to implement in Power BI, such as having multiple number formats within a single column, indenting row headers, grouping column headers, formatting cells with currency symbols, borders, and more.
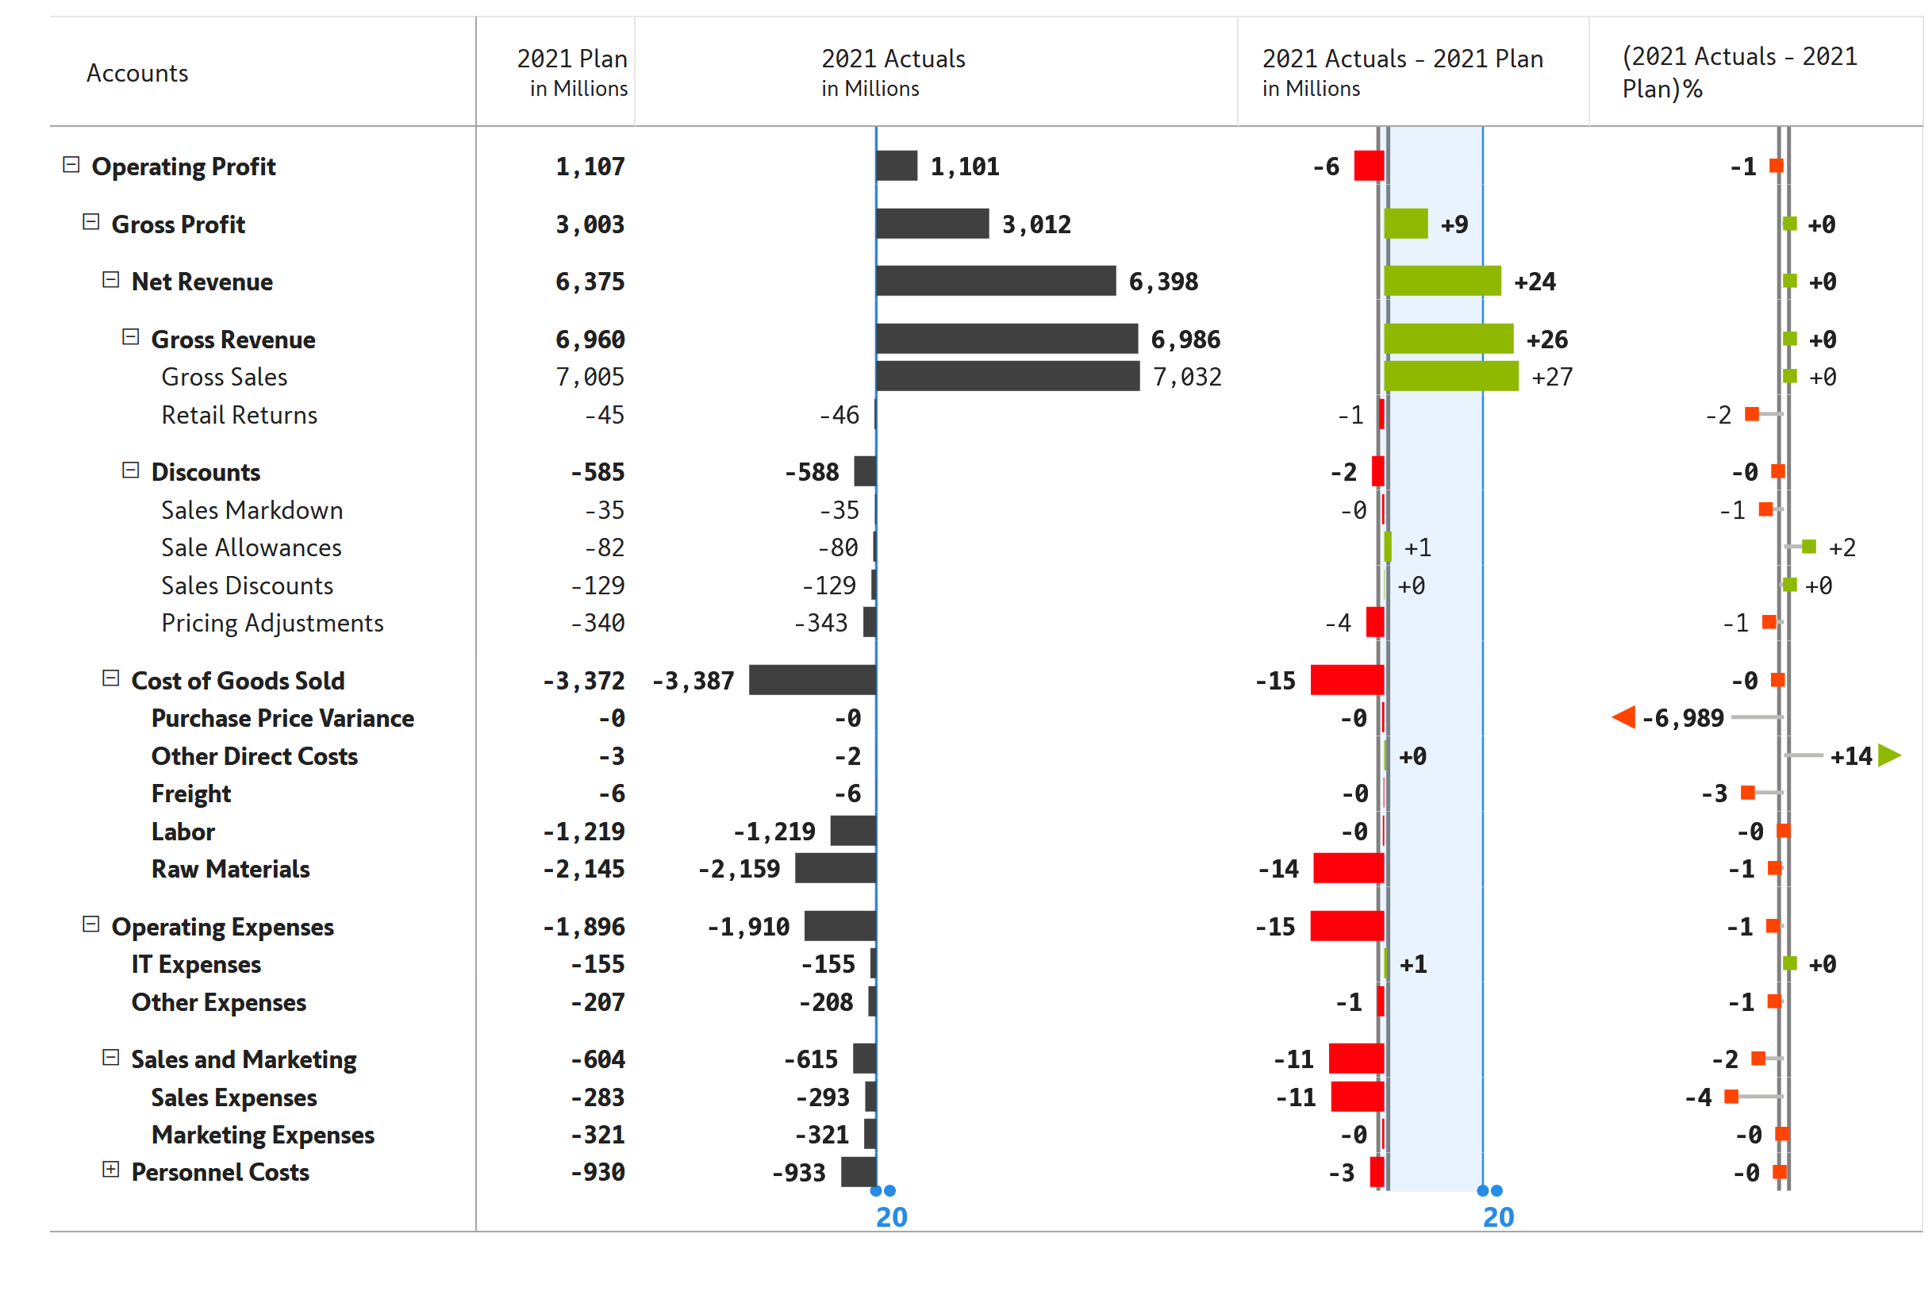
Leverage a variety of in-cell charts within your financial reports to enhance viewer engagement and experience. The report shown below supports account hierarchies along with variances in an expand/collapse-enabled interface. The scale band (in blue) used for variances ensures that even smaller variances are magnified to this scale.
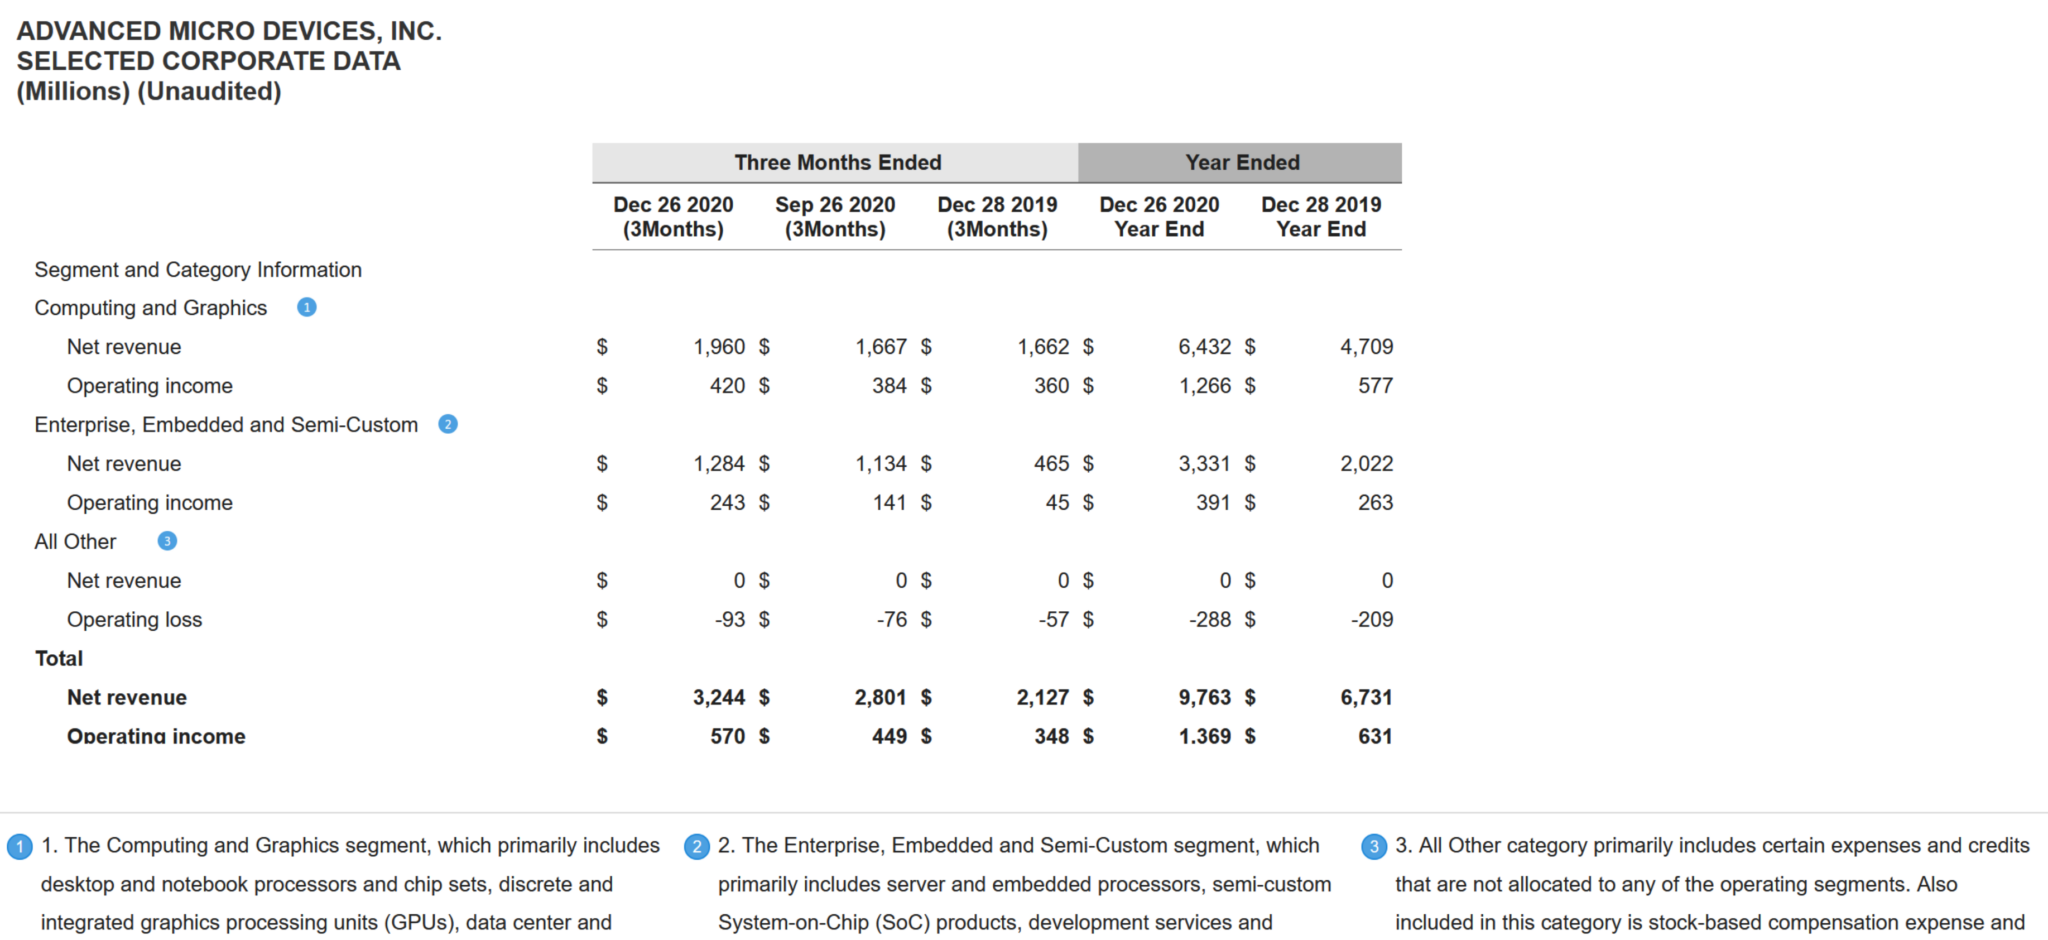
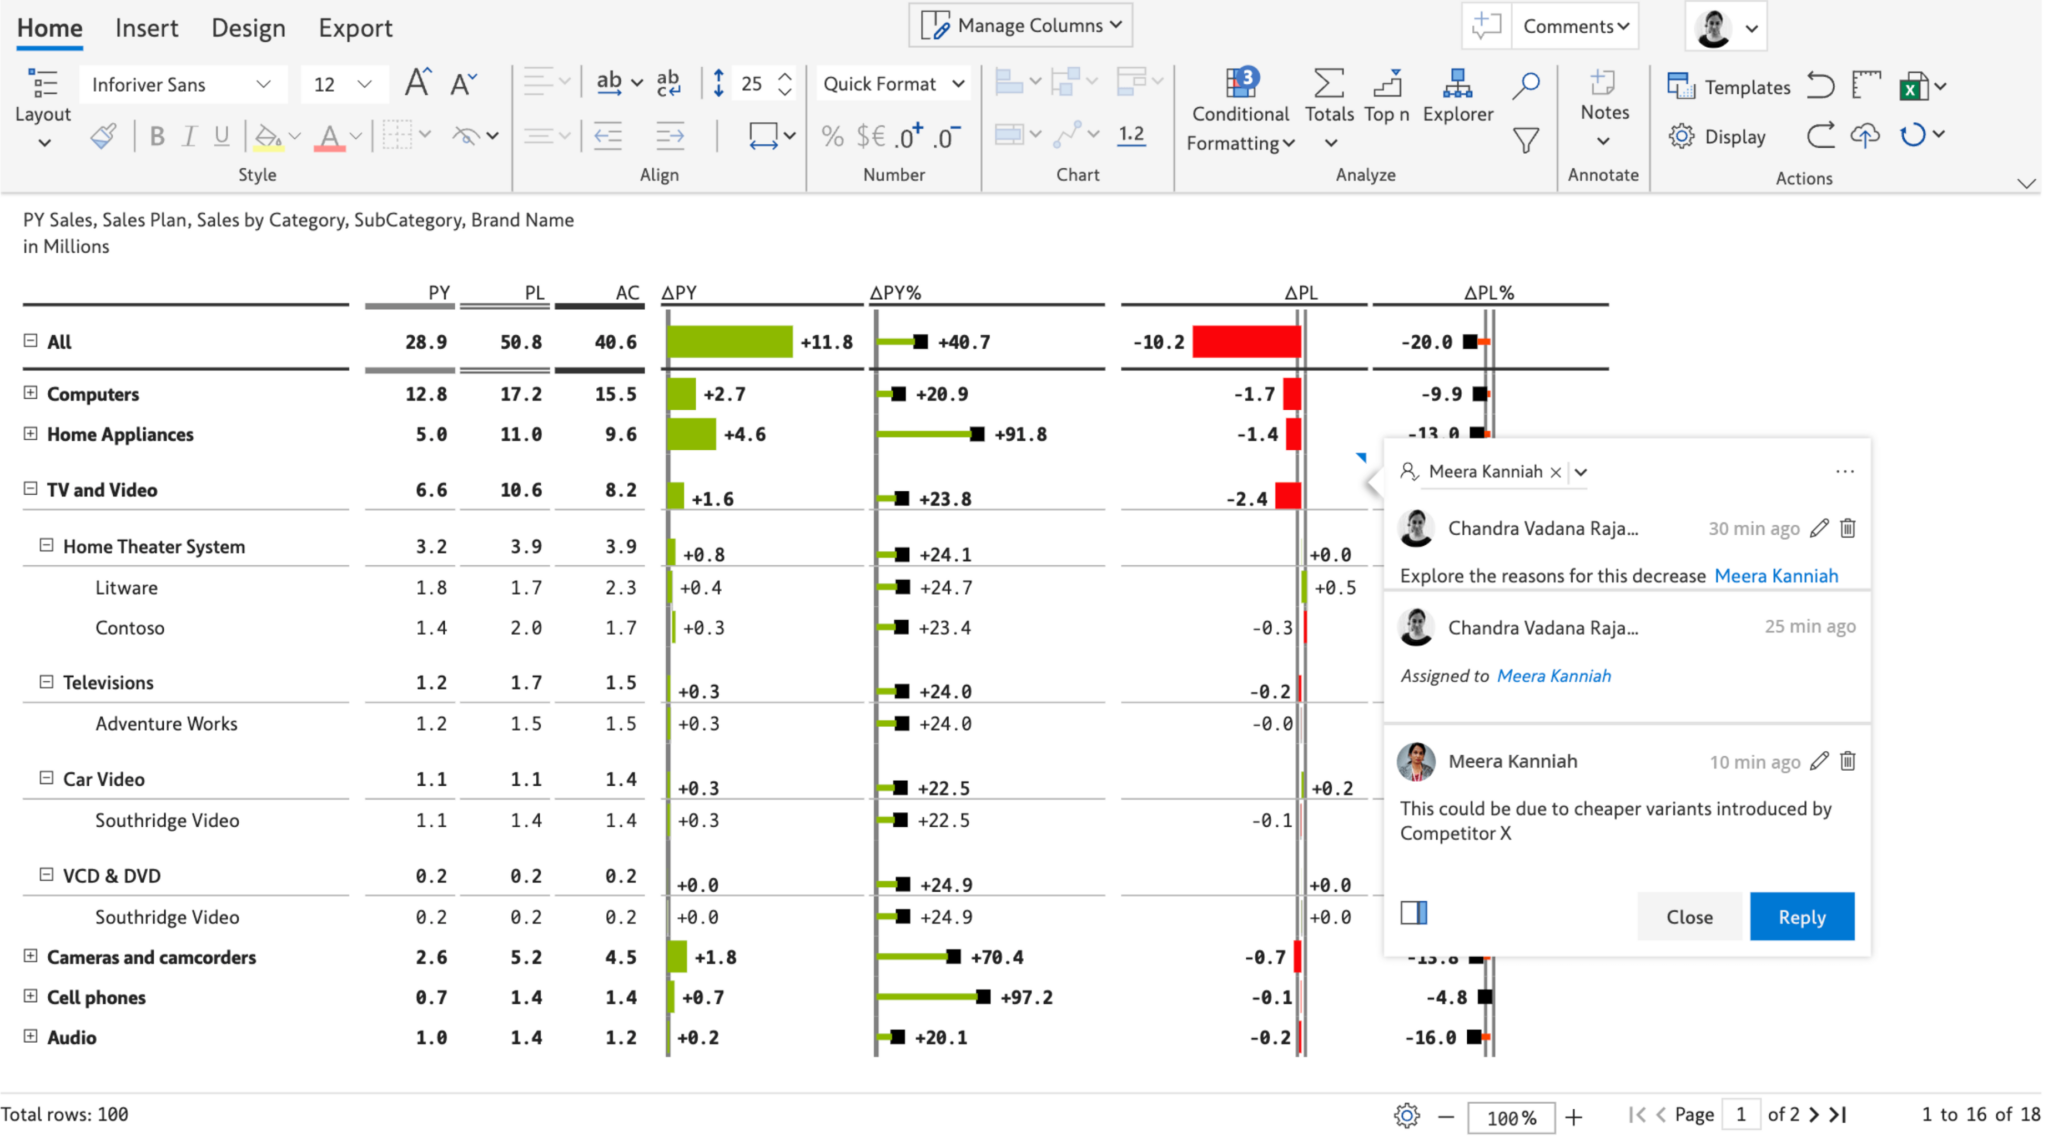
Provide explanations or supplementary information in your financial reports using data-level notes and footnotes.
Add data-level comments with @ mentions, reply to comments by other users, and receive instant email notifications. Collaborative commenting is available as part of Inforiver Enterprise. You can also schedule periodic commentary digests to notify users of conversations, tasks, and exceptions.
Deliver summarized income statements, balance sheets, and statements of cash flows for executives and external stakeholders.

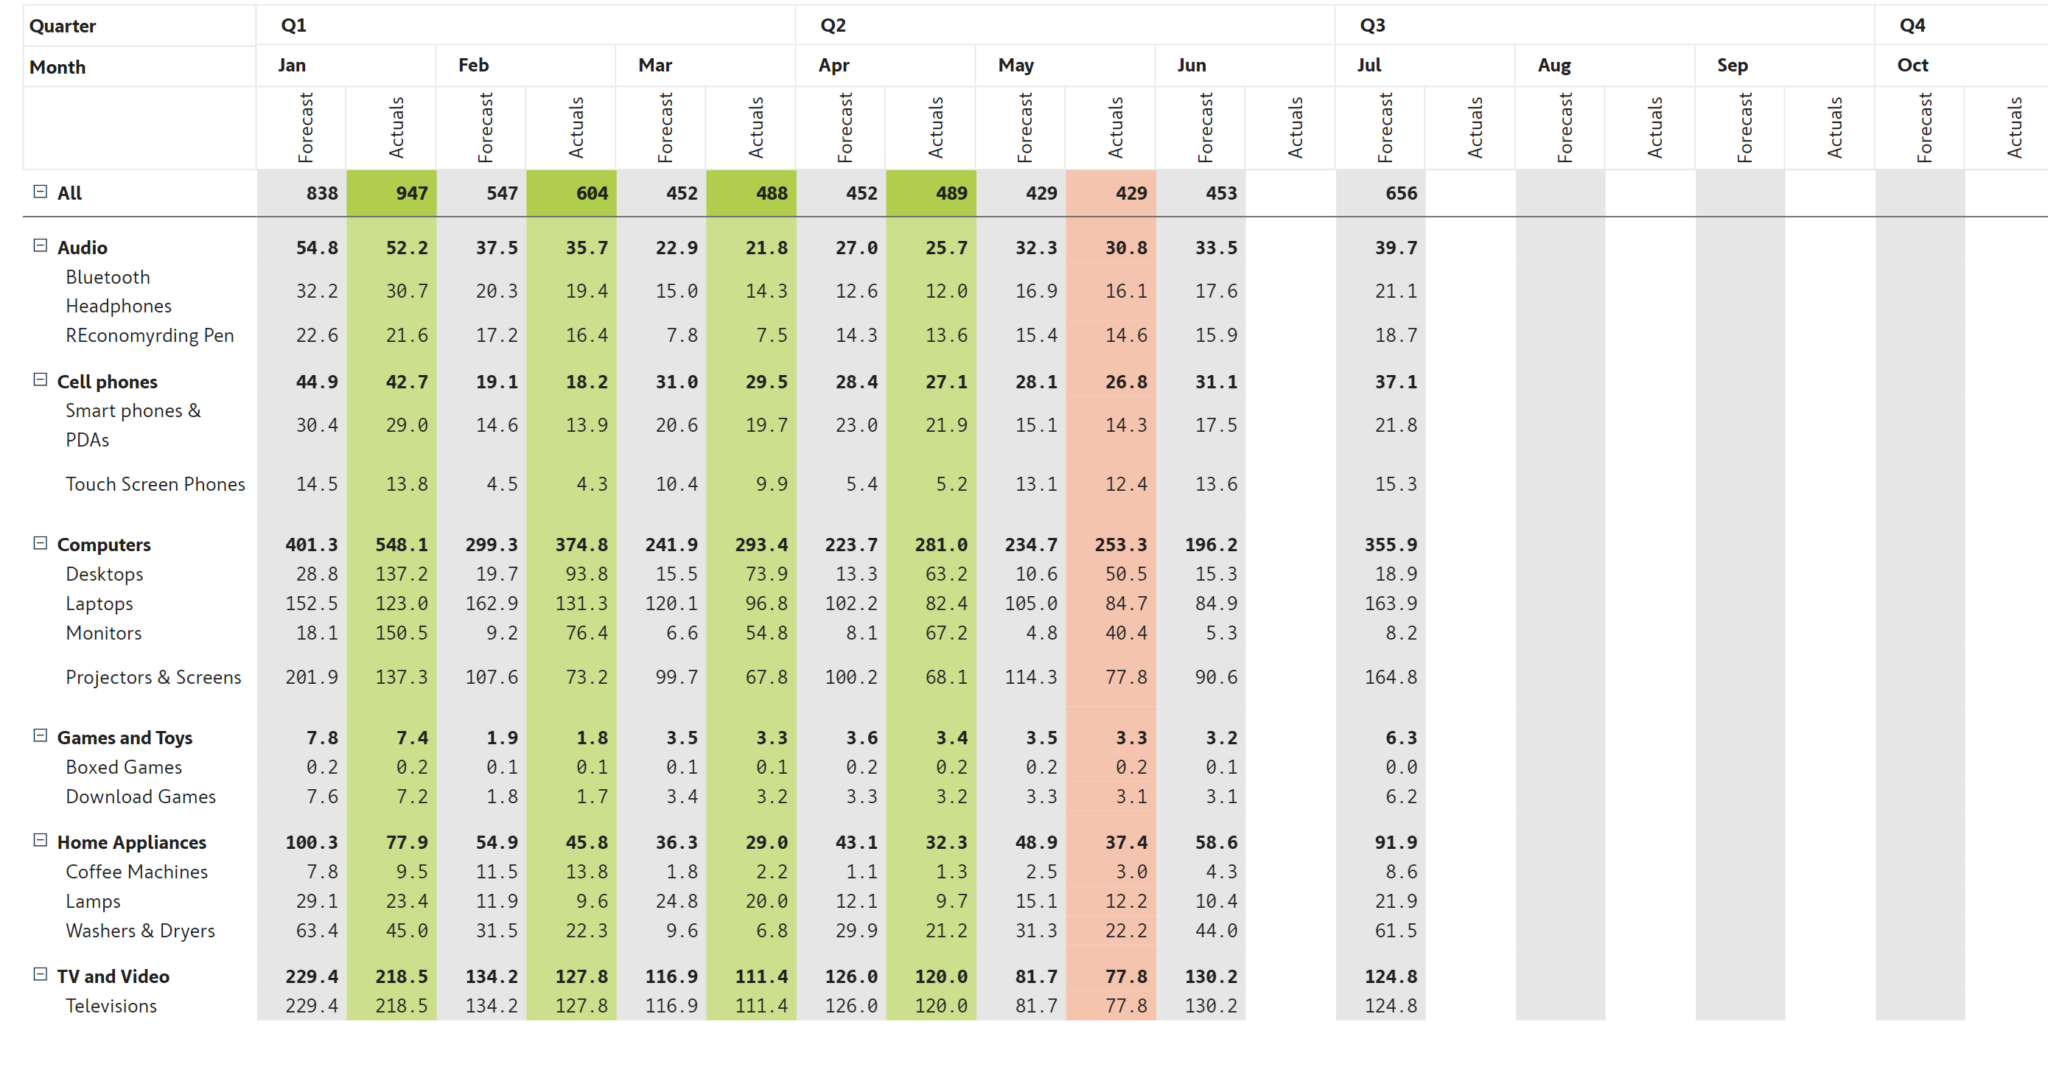
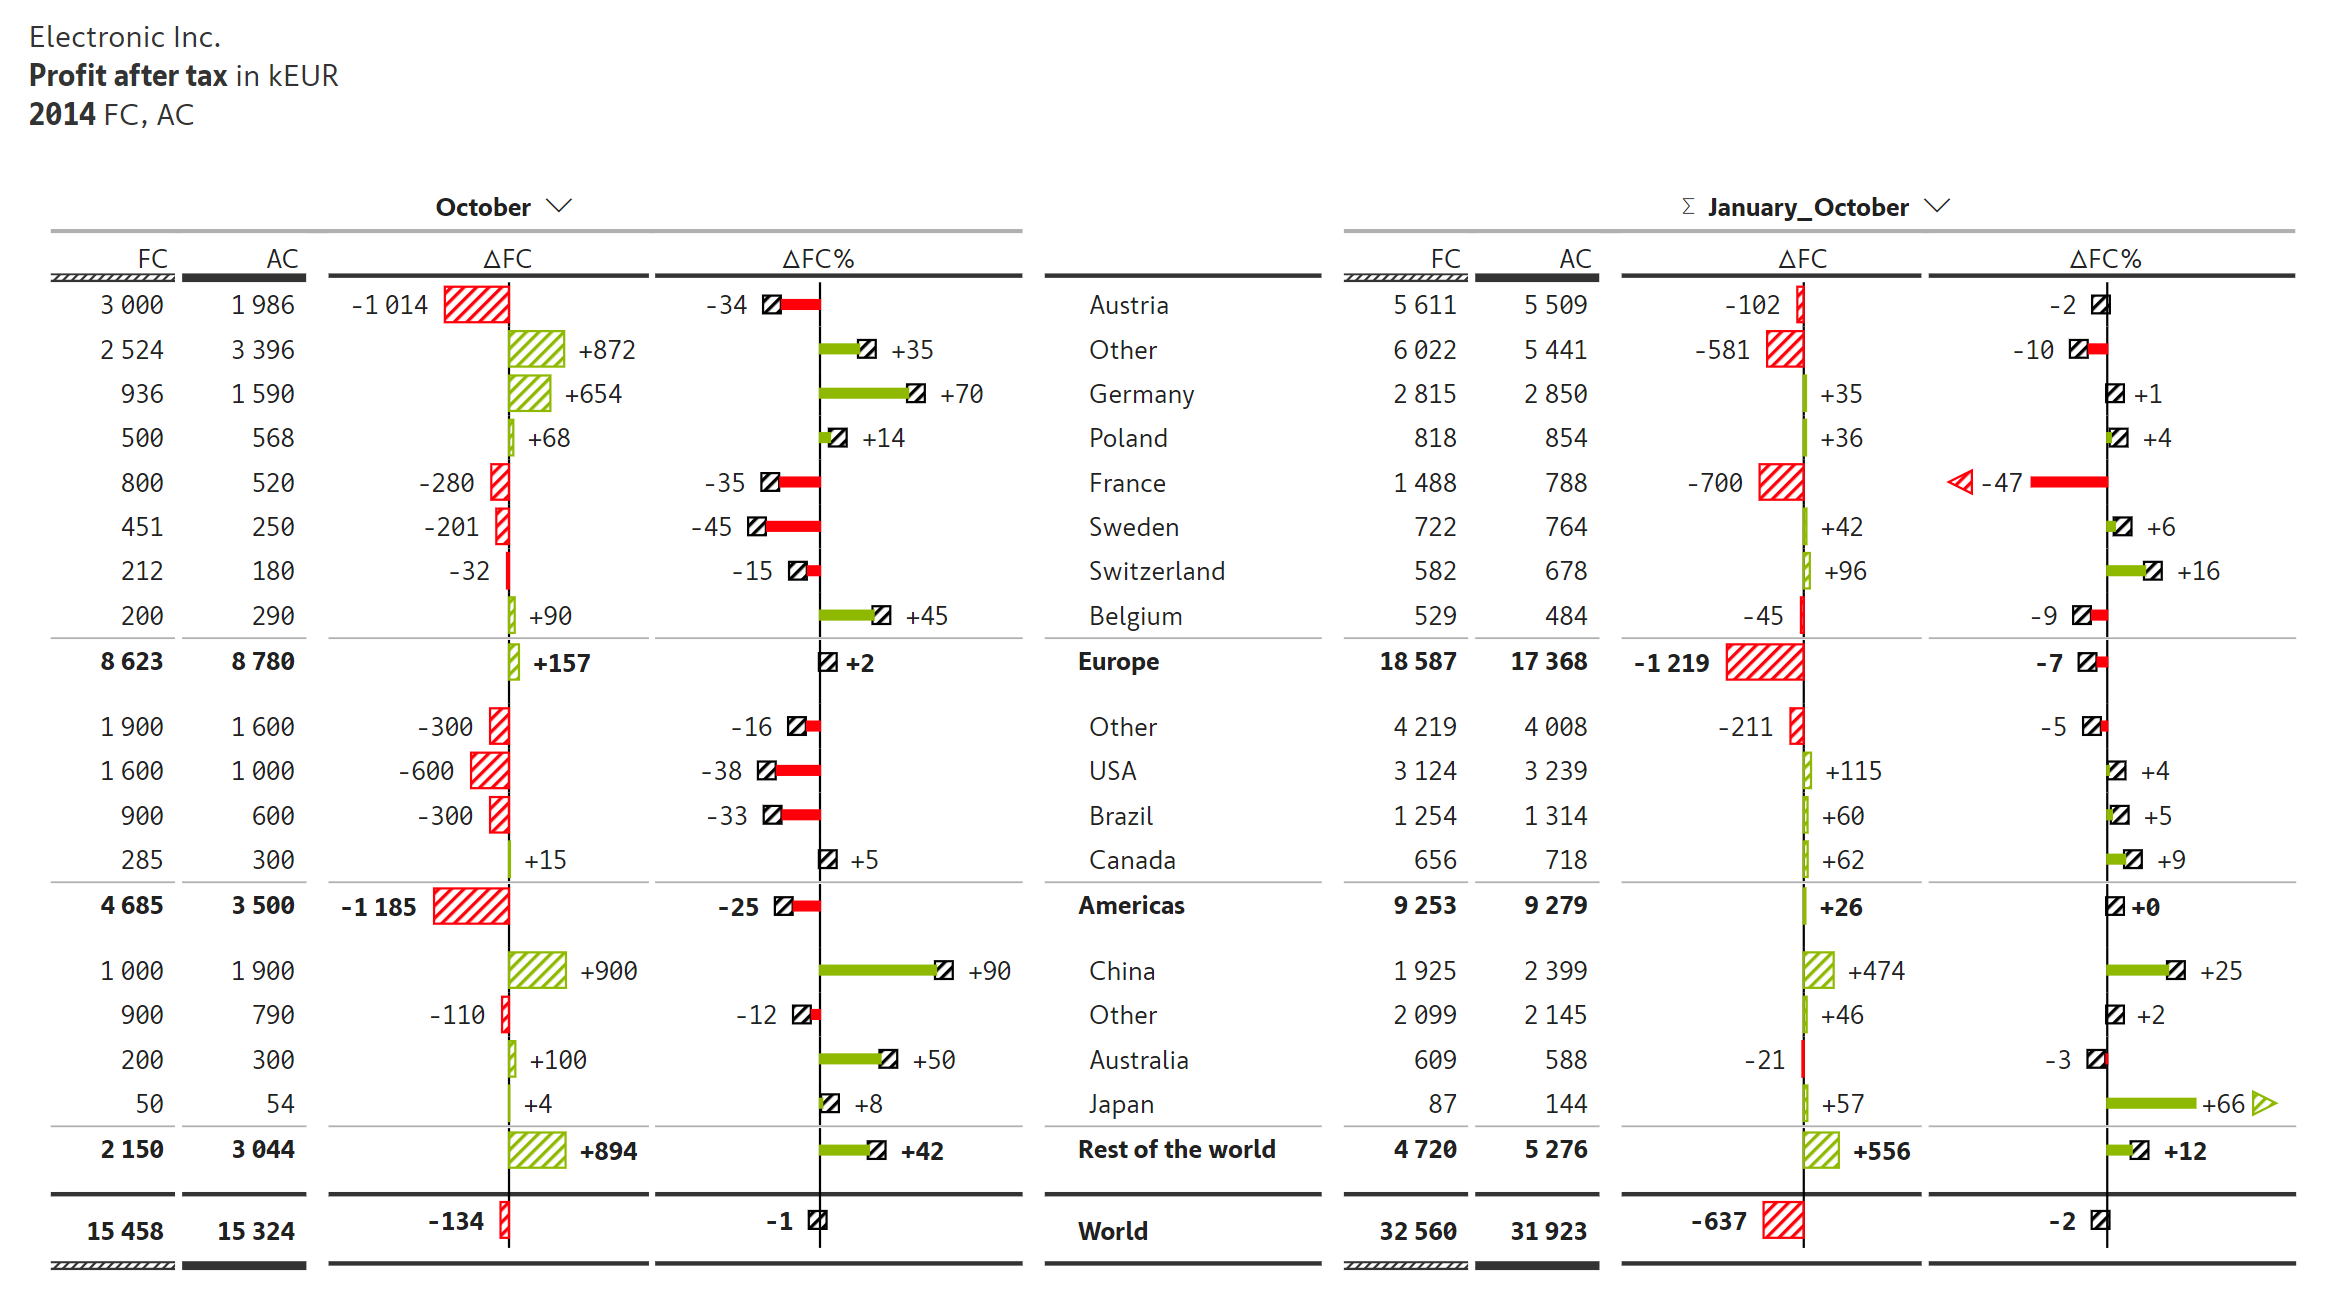
Inforiver provides IBCS table templates (T01 and T02) out-of-the-box for performing YTD/MTD/QTD analysis. As seen below, the categories are listed in the middle. Actuals (AC), Forecast (FC), and AC-FC variance in absolute & % terms are shown for the current month and year-till-date on either side. Performance can be analyzed dynamically by changing the periods in the dropdown.
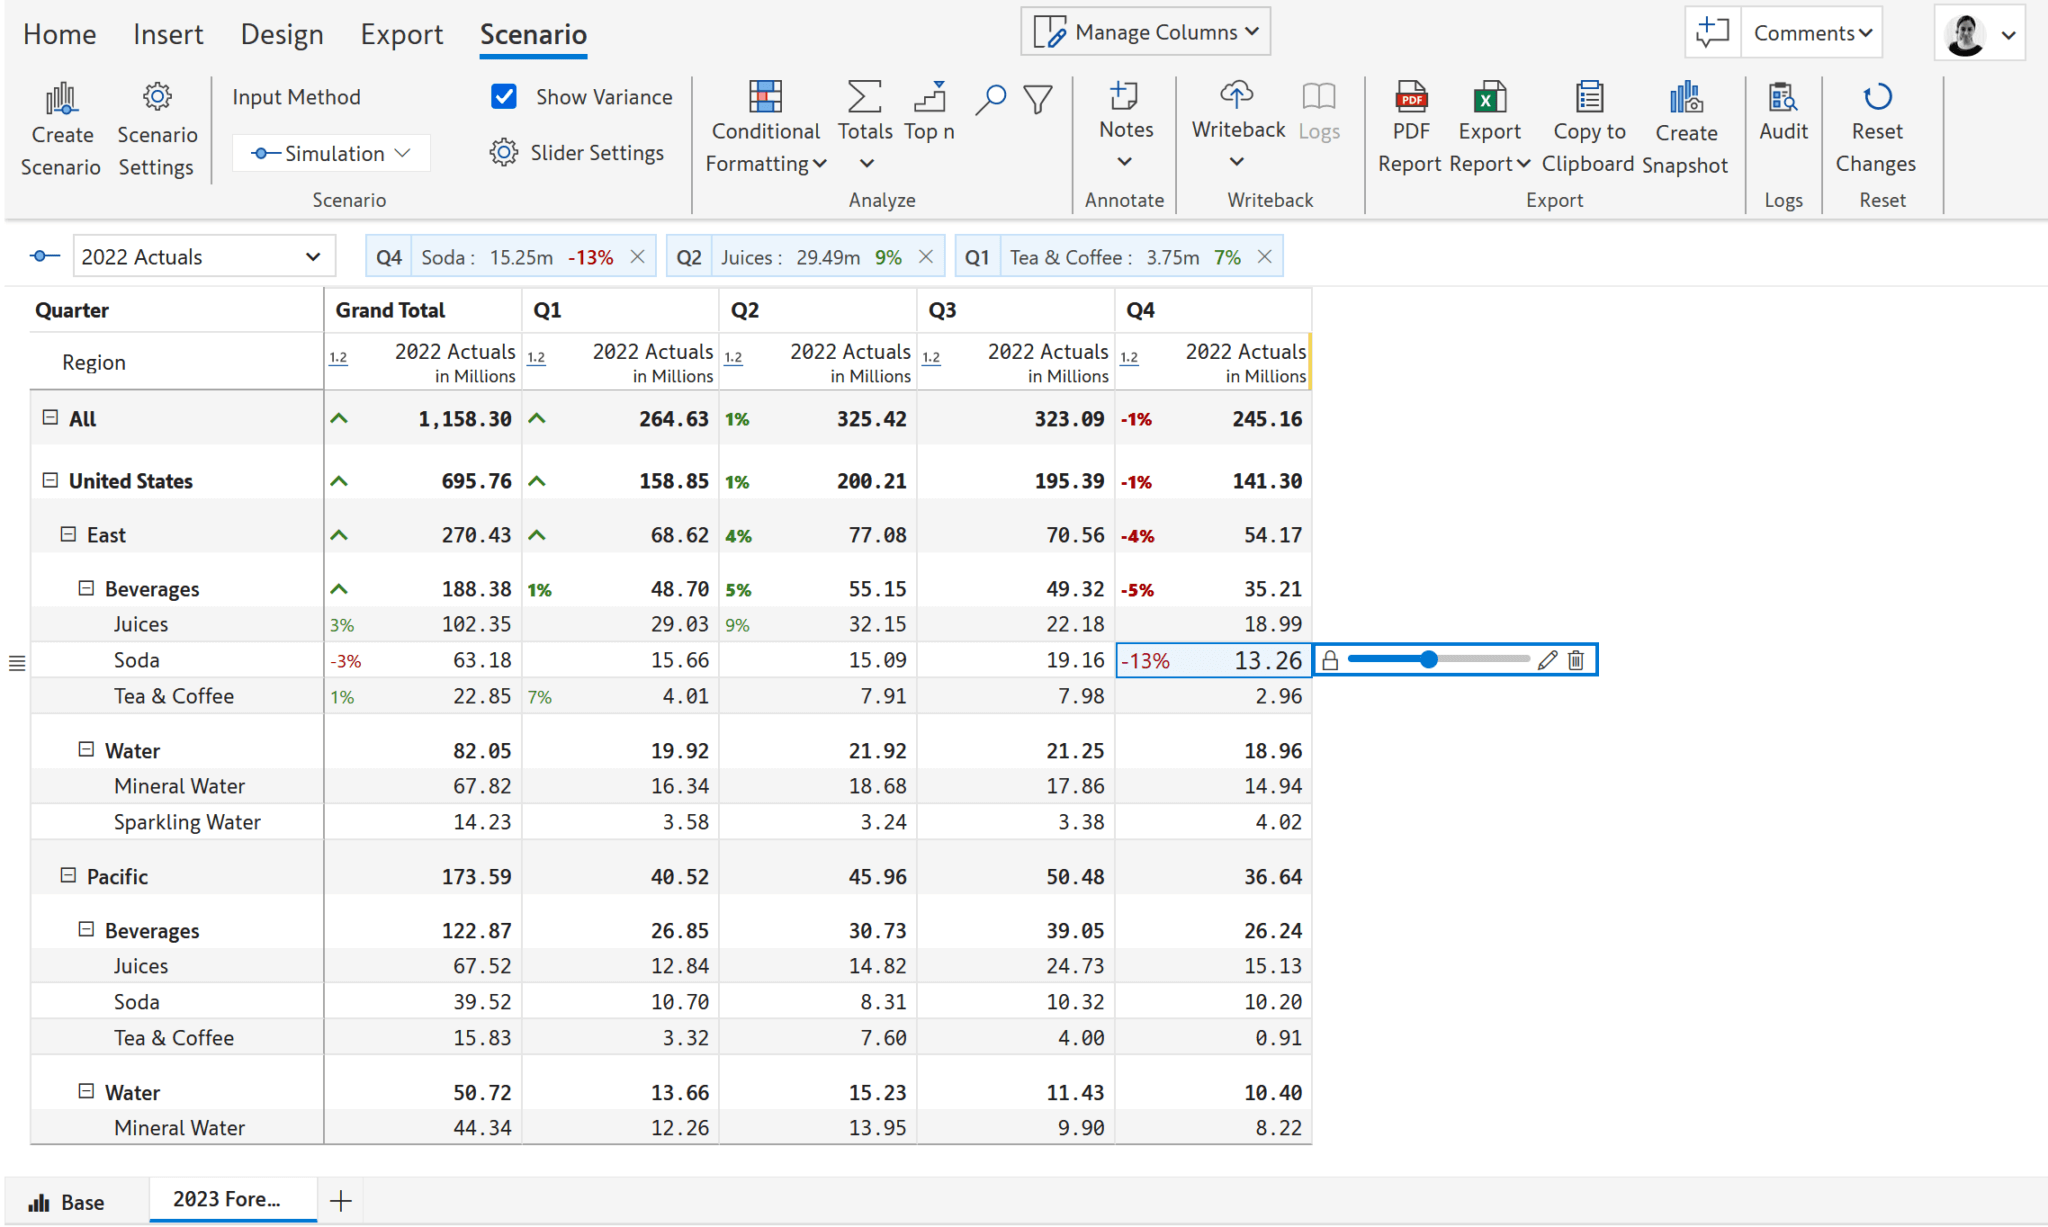
Perform what-if analysis on the fly using a graphical slider to simulate and roll-up or spread-down changes in hierarchies. Use in-cell editing that supports percentage calculations (e.g., +10%) as well as scaled values (e.g., -35m).
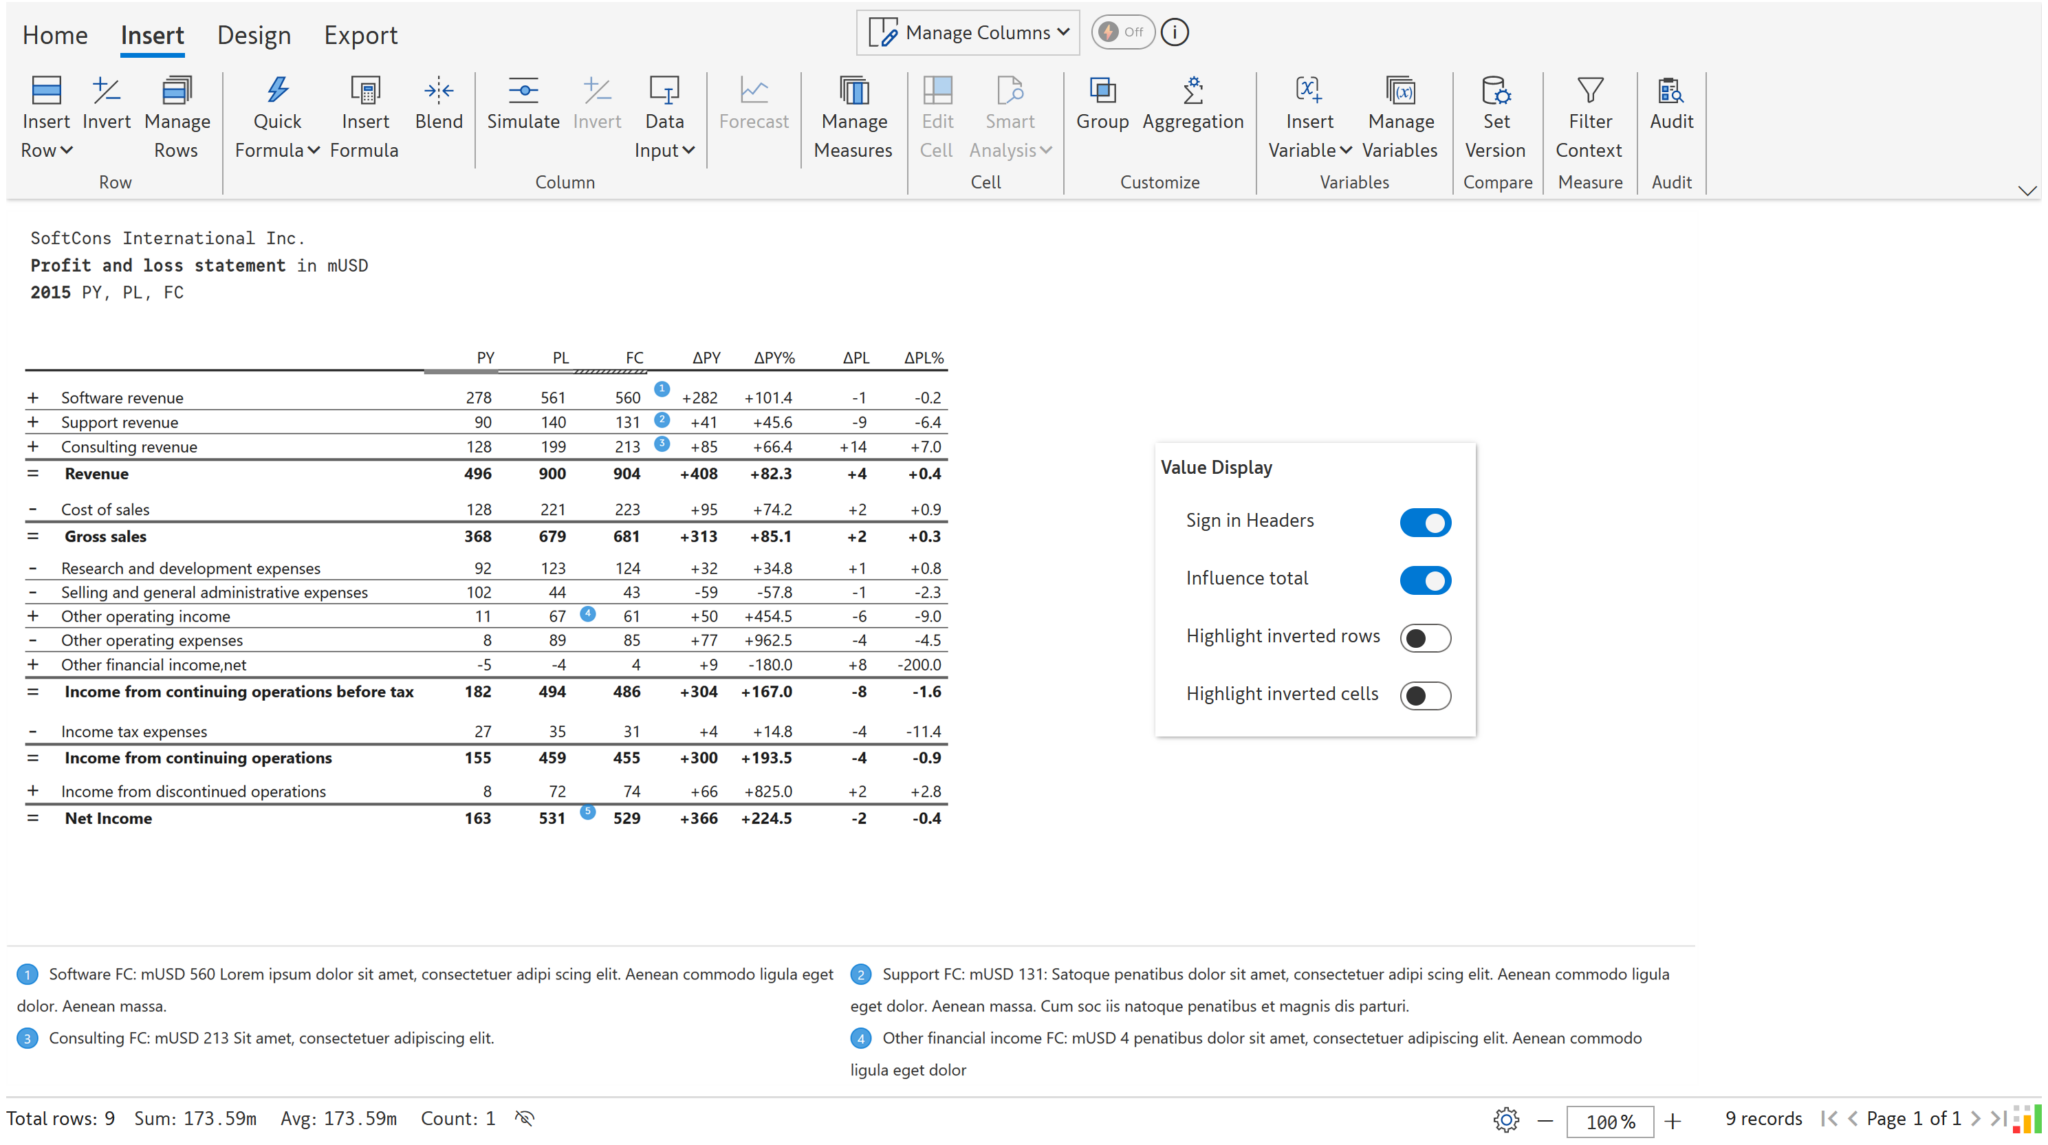
The data for financial statements may have positive numbers for expense or deduction items, especially when the income and expense values come from different tables. Inverting signs to accommodate the accounts can be achieved by simply selecting the line item and using the ‘Invert Sign’ option. The +/- signs can be displayed in the table or hidden.
You can also configure whether the sign inversion affects only the display or the aggregation as well using the ‘Influence Total’ option.


Inforiver helps enterprises consolidate planning, reporting & analytics on a single platform (Power BI). The no-code, self-service award-winning platform has been recognized as the industry’s best and is adopted by many Fortune 100 firms.
Inforiver is a product of Lumel, the #1 Power BI AppSource Partner. The firm serves over 3,000 customers worldwide through its portfolio of products offered under the brands Inforiver, EDITable, ValQ, and xViz.