
Upcoming webinar on 'Inforiver Charts : The fastest way to deliver stories in Power BI', Aug 29th , Monday, 10.30 AM CST. Register Now
Upcoming webinar on 'Inforiver Charts : The fastest way to deliver stories in Power BI', Aug 29th , Monday, 10.30 AM CST. Register Now
Creating formatted financial reports & statements in Power BI can be a challenging task for a typical user with intermediate DAX skills. A medium complexity report can take anywhere from 2 to 5 days, and it would still fall short in formatting, editing & interaction capabilities. With Inforiver, your financial models & reports can incorporate Excel-like interaction, navigation & editing capabilities. You can go beyond data editing and perform simulations, forecasting and allocations to deliver accurate and dynamic financial planning and analysis (FP&A).

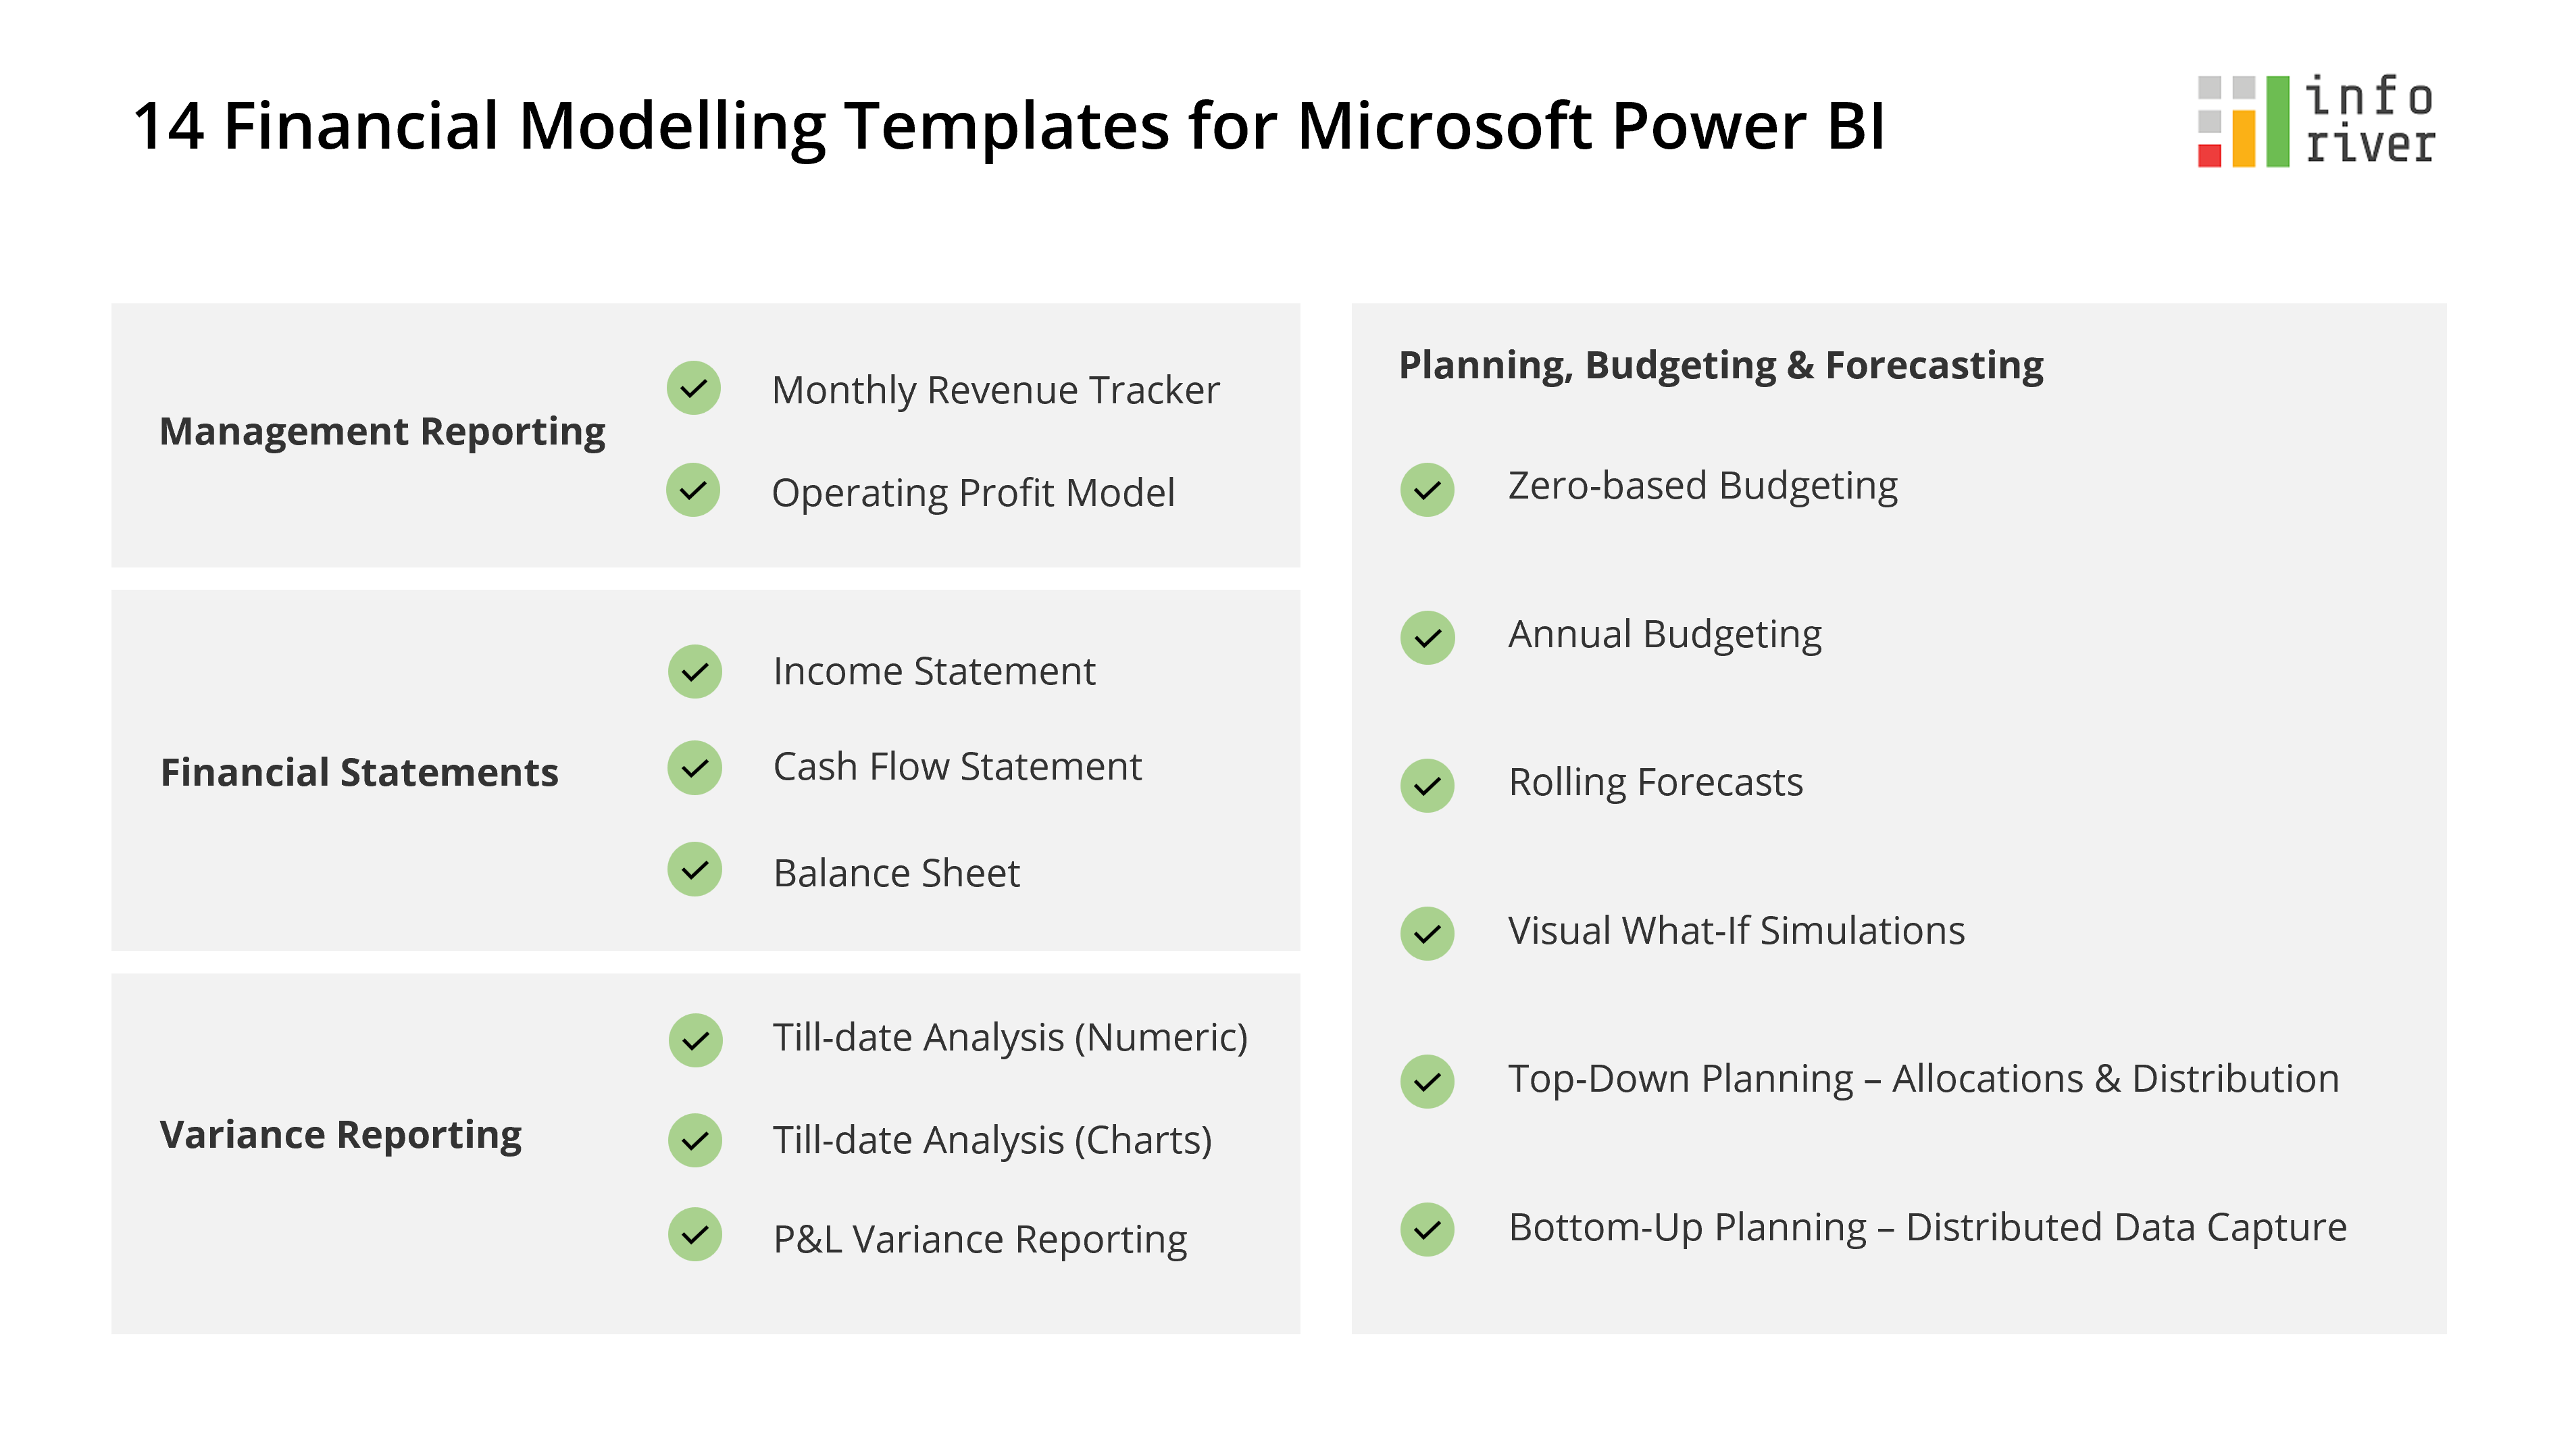
Here are 14 financial modelling templates you can create in Power BI in less than an hour each with properly structured and clean data.
Here is a monthly tracker where we have actuals till prior month (April), highlighted in green. We are actively tracking actuals for the current month (May), highlighted in orange. We have forecasts data for three months from May to July.
The vertically oriented column headers facilitate columns to be tightly packed. You also have several options to update your report – excel-like cell editing, manual data entry, allocations, forecasting & simulations, and more.
This operating profit model visualizes account hierarchies along with variances in a expand/collapse-enabled interface.
Inforiver provides support for unbalanced/ragged hierarchies out-of-the-box. Note that IT Expenses and Other Expenses do not have child accounts whereas Sales and Marketing and Personnel Costs do. (A typical Power BI report would show blank row headers under IT Expenses & Other Expenses).
The scale-band (in blue) for the bar charts ensures scaling differences are highlighted.

Build highly customizable formatted financial statements 20x faster.
Inforiver helps you perform a variety of formatting that is harder to implement in Power BI such as:
Having multiple number formats in a single column
Indent row headers
Formatting cells with currency symbols, borders, etc
Support for multi-line headers
Custom row sorting using click-and-drag action
… and more
Create financial statements as it appears in annual reports. On the right is Nike’s cash flow statement from the 2020 Annual Report. On the left is the same reproduced in Power BI using Inforiver.

Here is an example of a formatted balance sheet built in Power BI using Inforiver.
Inforiver helps you insert calculated rows with the help of an intuitive formula editor. Rows can be reordered easily by drag-and-drop which means you no longer need to write complicated DAX queries for custom sort of GL accounts.
Also notice the multi-line headers, indentation for account names, borders, grouped columns and currency prefixes.

Here is an International Business Communication Standards (IBCS) T01 table template showing current (Oct) vs. till date (Jan-Oct) analysis.
The categories are listed in the middle. Values shown include Actuals (AC), Prior Year (PY), AC-PY variance in absolute & % terms.
You only have to bring your data to build reports like this. The layout and formatting is automatically handled by Inforiver when you select this template.

In the IBCS T02 table template variance in absolute & % terms are visualized using bar and pin charts.
MTD vs YTD performance can be analyzed dynamically by changing the month in the left side of the table from the dropdown.
Notice the solid, hatched and outlined notation for business metrics such as actuals, forecasts, plans and prior year.

Visualize calculation schemes in rows along with variances and footnotes with the IBCS T04 template. This is useful for financial statements such as the P&L/cash flow statement.
Inverting signs to accommodate the revenue/expense accounts can be achieved by simply selecting the line item and using the ‘Invert Sign’ option. The +/- signs can be displayed in the table or hidden.
You can also configure whether the sign inversion affects only the display or the aggregation as well using the Influence Total option.

Create budgets for the upcoming cycle using this financial modelling template.
You can select any cell and start keying in the data as you would do in Excel.
Values entered in child rows automatically roll up to the top. Similarly, any values entered in a parent row gets distributed to its children. By default, it is distributed equally, but you can also opt to distribute based on other data (e.g., prior year actuals).
The changes made in this input sheet also gets tracked in the audit log, so it is easy to revert any changes if needed.

Allocate budgets based on prior year actuals and continue to make finer adjustments by editing on cells directly.
Add notes to provide context to other users or comments to facilitate collaboration.

Get an accurate picture of your business’s future performance by leveraging rolling forecasts.
In this financial modelling template, we have the actuals for Jan – Aug using which we create a 3-month rolling forecast for Sep – Nov.

Perform what-if analysis on the fly using a graphical slider to simulate and roll-up or spread-down changes in hierarchies.
Use in-cell editing that supports percentage calculations (e.g., +10%) as well as scaled values (e.g., -35m)

Perform top-down planning by entering your budgets at the grand total level and distribute changes to descendants across rows & columns. Changes automatically roll-up to the top.
25k entered as 2022 Budget (highlighted in orange) gets distributed based on 2021 Actuals across quarters, product categories and subcategories (highlighted in yellow).

Capture data from multiple users in reading mode; the entered values automatically roll-up to the sub totals and totals. This can then be written back to a database along with the sales rep names and time stamp.
You can also have text, dropdown, and date columns to gather data. Rules can be configured to enable data input – for e.g., Actuals>25m. The Live Sync capability of Inforiver live updates other visuals in the Power BI report every time data is updated.

Download Inforiver Premium for free and start building your own financial modelling templates.
 In this webinar, learn how to leverage one-click IBCS report templates to deliver stunning and engaging visualizations in Power BI. Register today to learn more!