
Upcoming webinar on 'Inforiver Charts : The fastest way to deliver stories in Power BI', Aug 29th , Monday, 10.30 AM CST. Register Now
Upcoming webinar on 'Inforiver Charts : The fastest way to deliver stories in Power BI', Aug 29th , Monday, 10.30 AM CST. Register Now
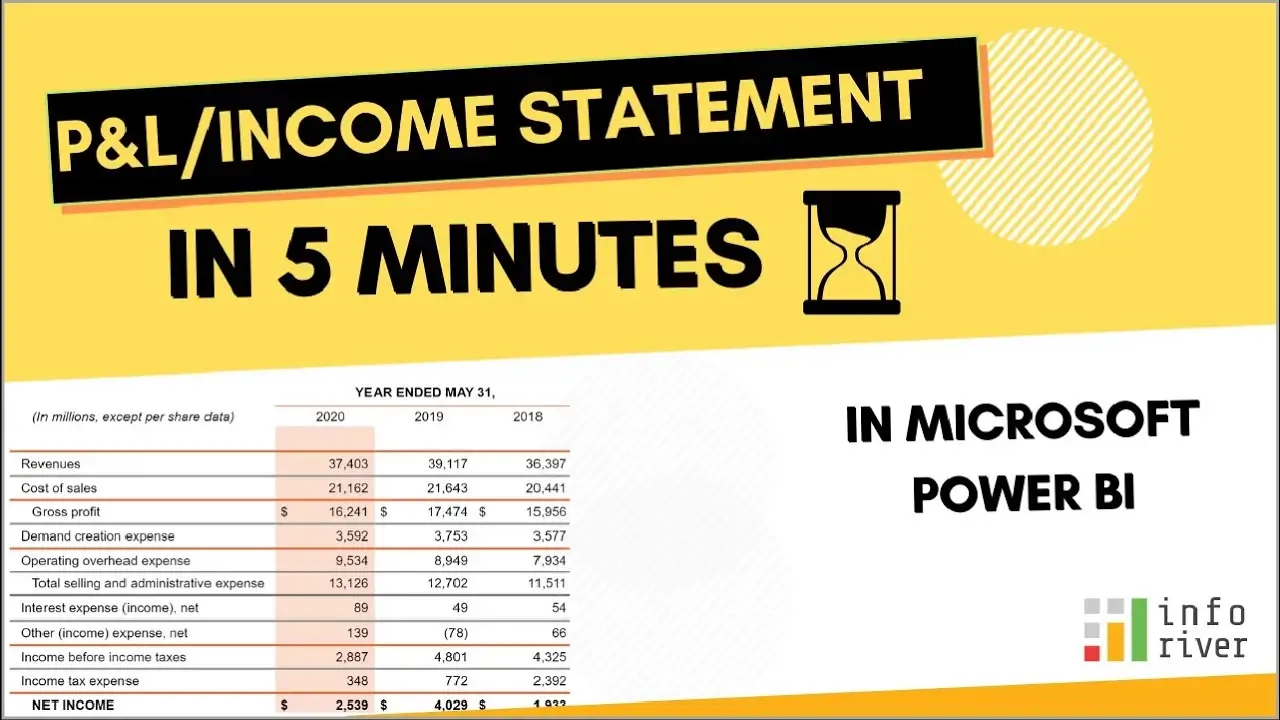
Anyone who has attempted building financial statements, including a P&L statement report, or an income statement in Power BI using the native table or matrix visual knows how time-consuming the task can be. The complication comes from several reasons, including but not limited to (a) having to encode a custom sort order for accounts in the data model (b) using DAX to not only perform calculations but also to conditionally populate rows based on GL accounts/subtotals (c) formatting limitations (d) limitations in handling accounting signs (+/-), and more.
Let’s take a quick look at how Inforiver can deliver a financial statement in less than five minutes in Power BI, without using DAX.
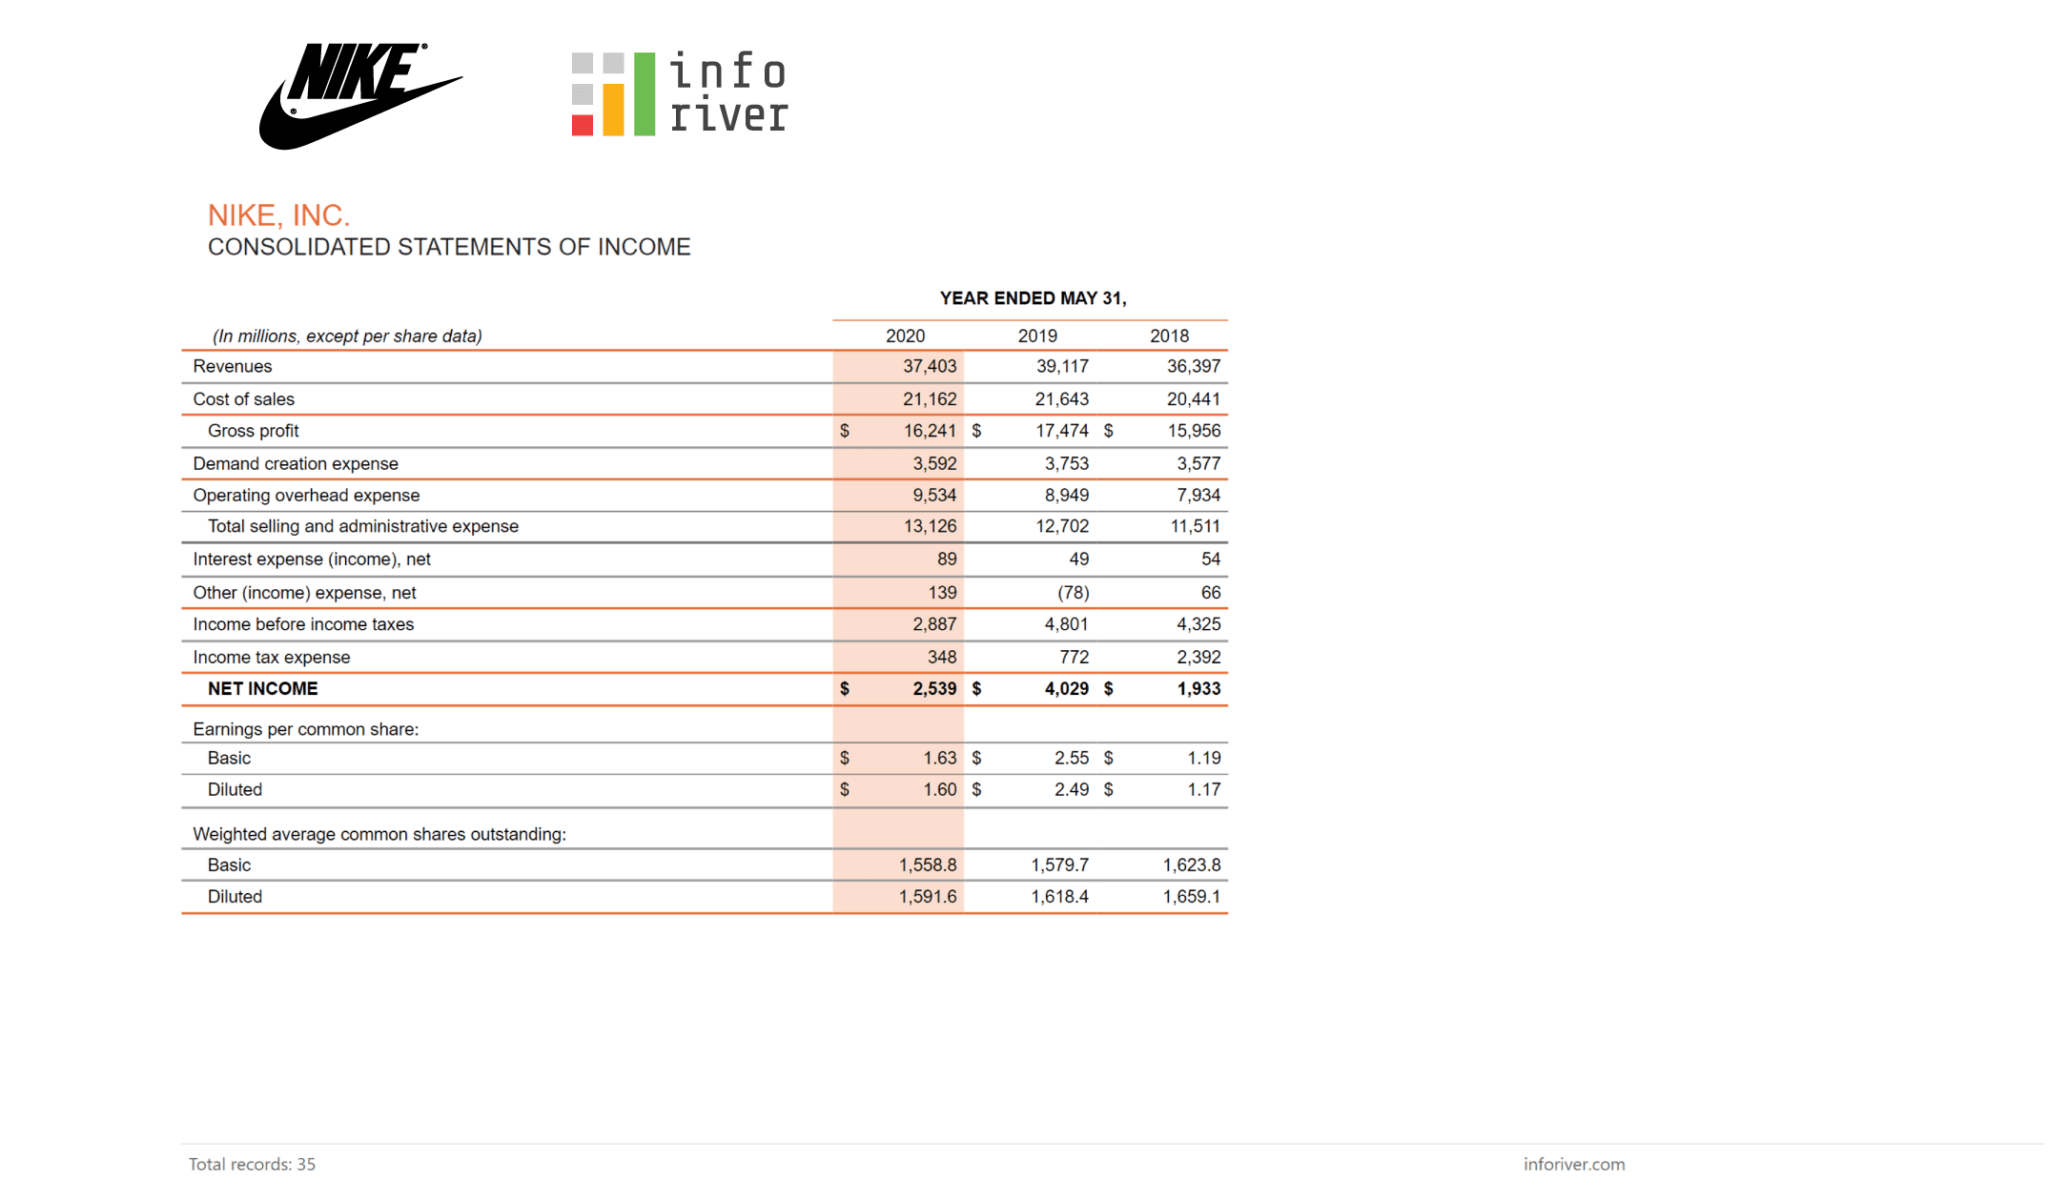
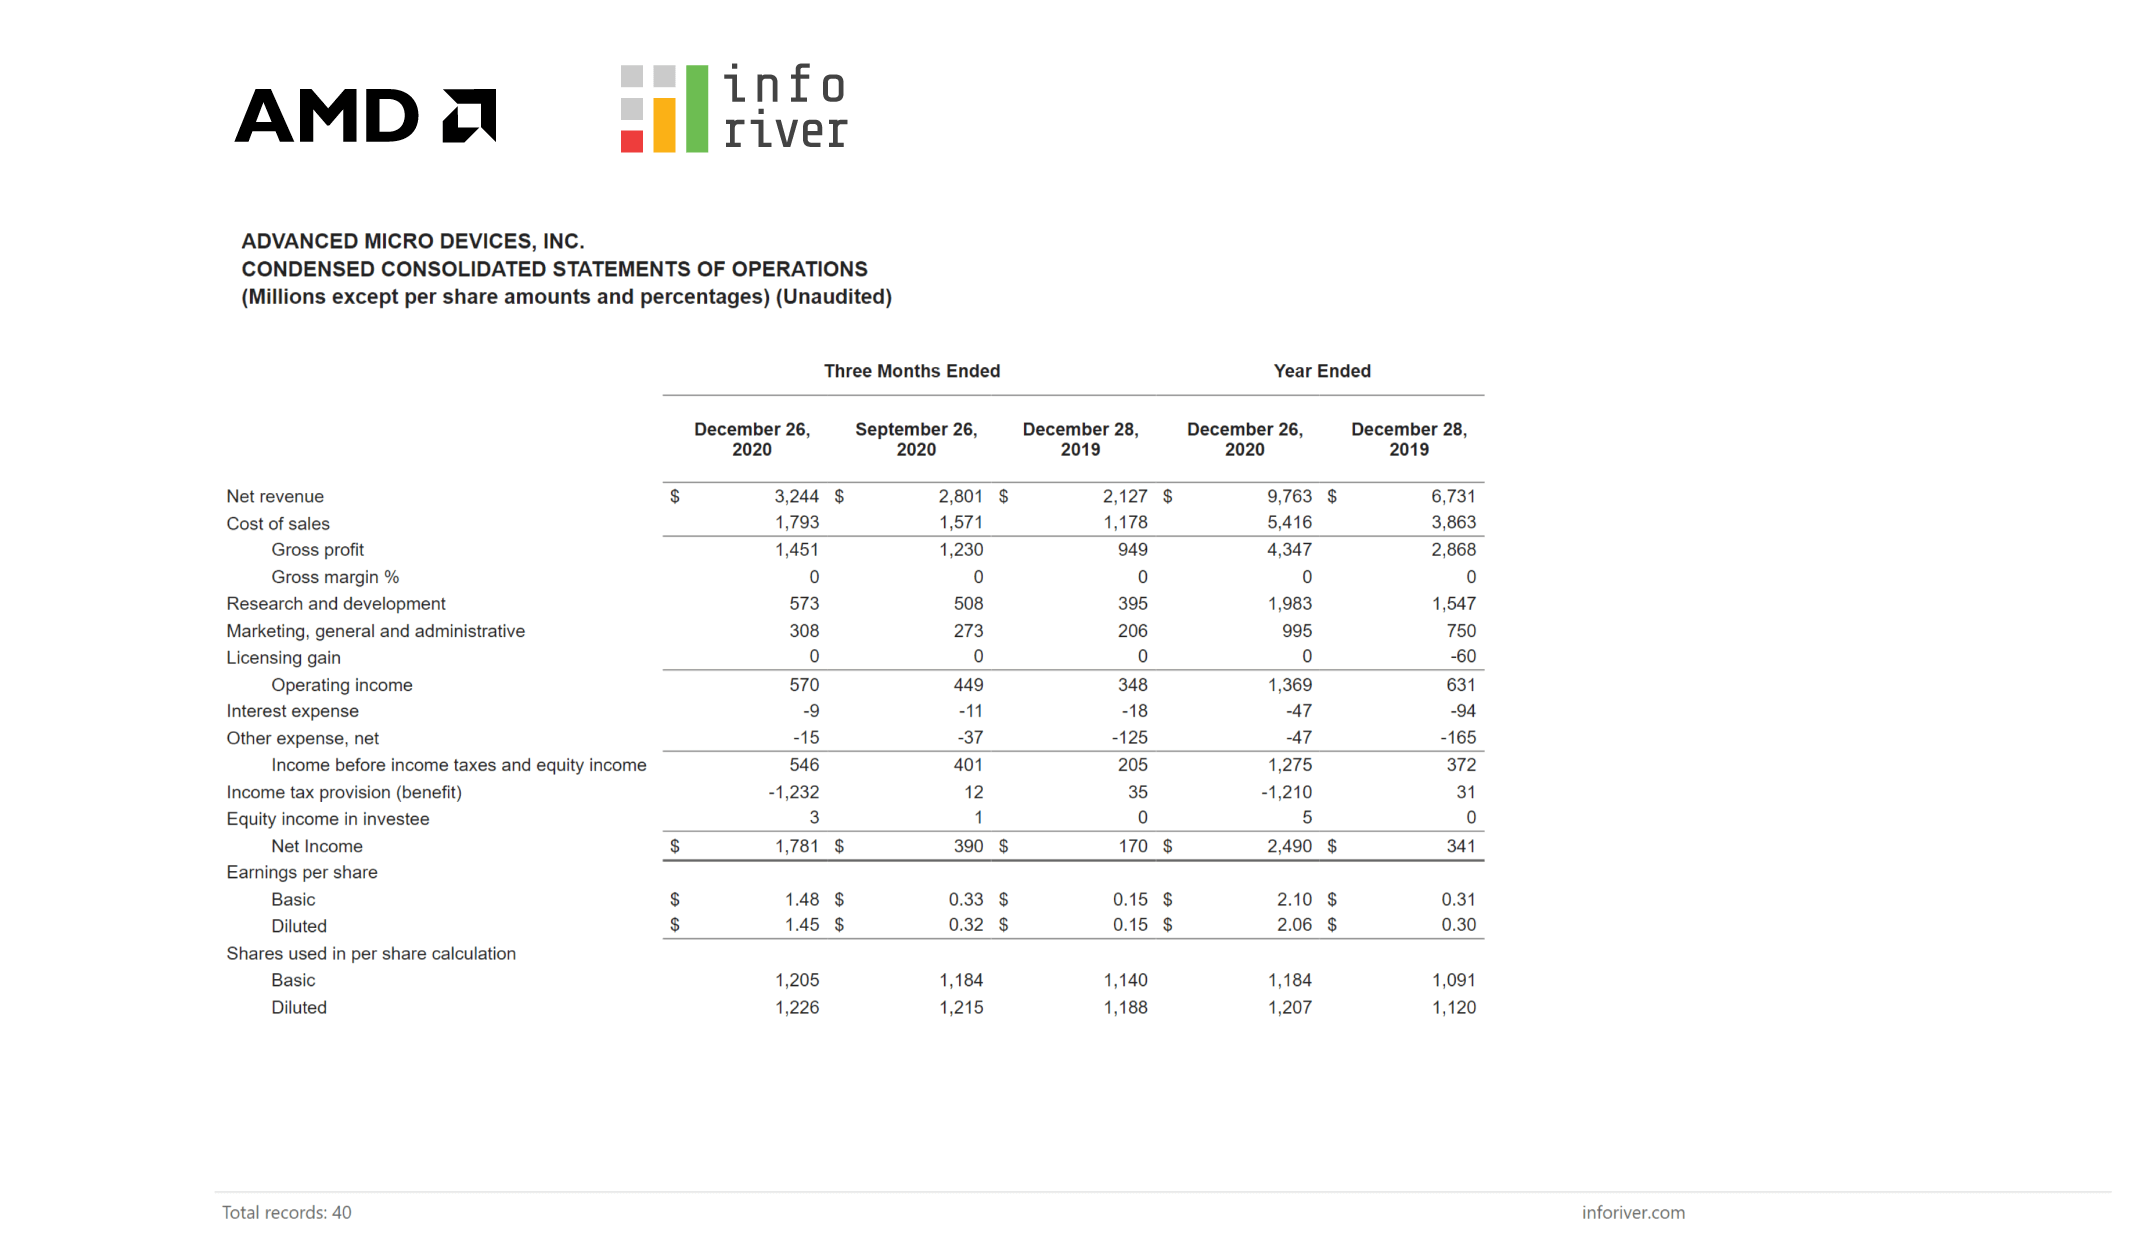
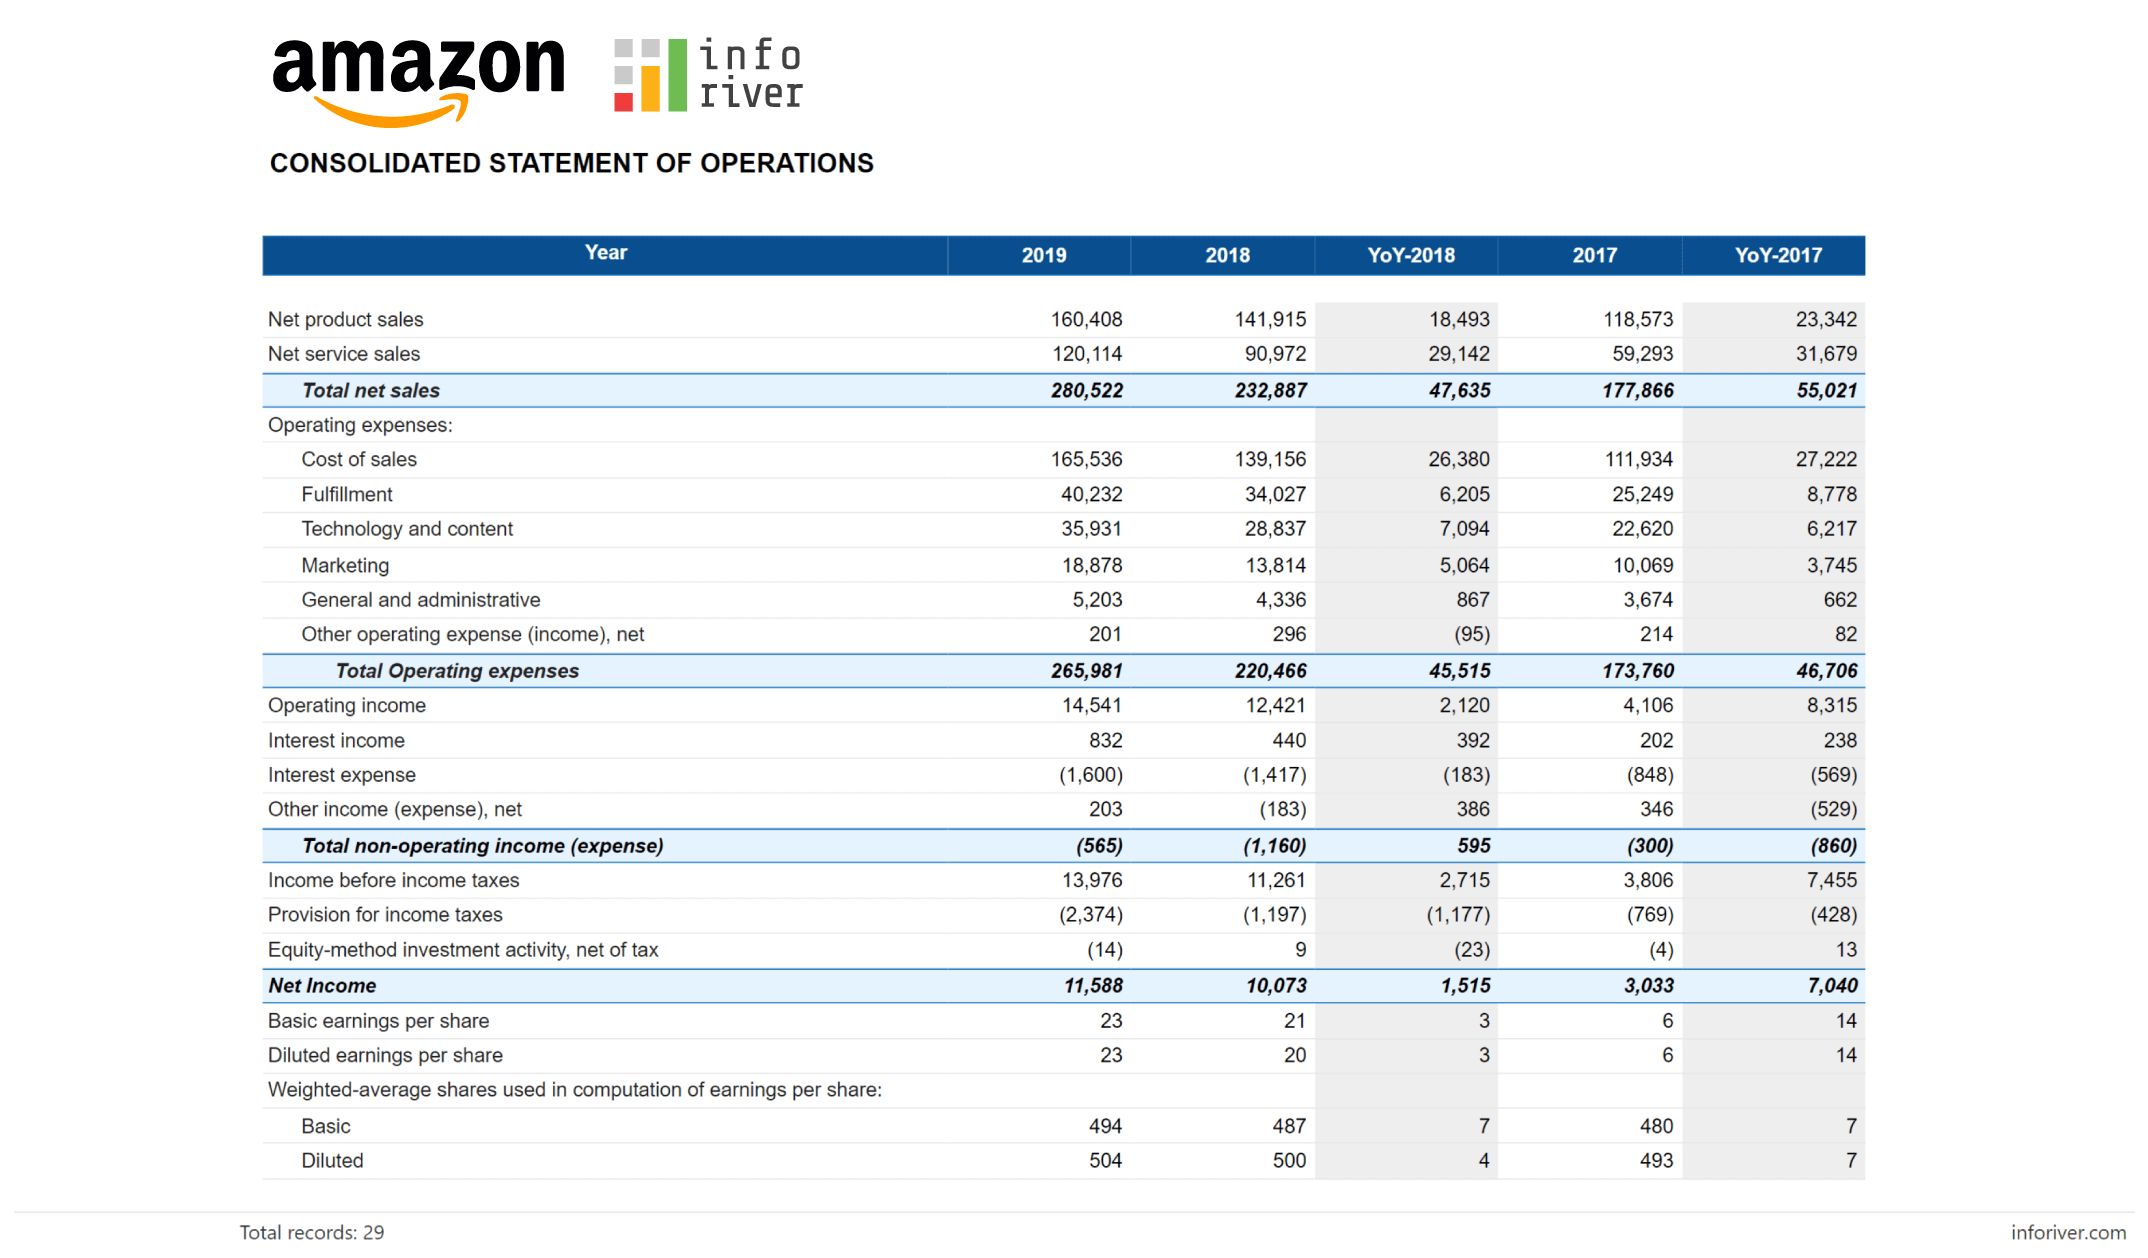
Once you have mapped your accounts (categories) and values (measures) to Inforiver, you can perform extensive formatting changes to get the desired format that you want in your profit & loss / income statement reports.
Here are some sample formatted financial statement reports built in Power BI. Click on the images to explore the interactive demo.
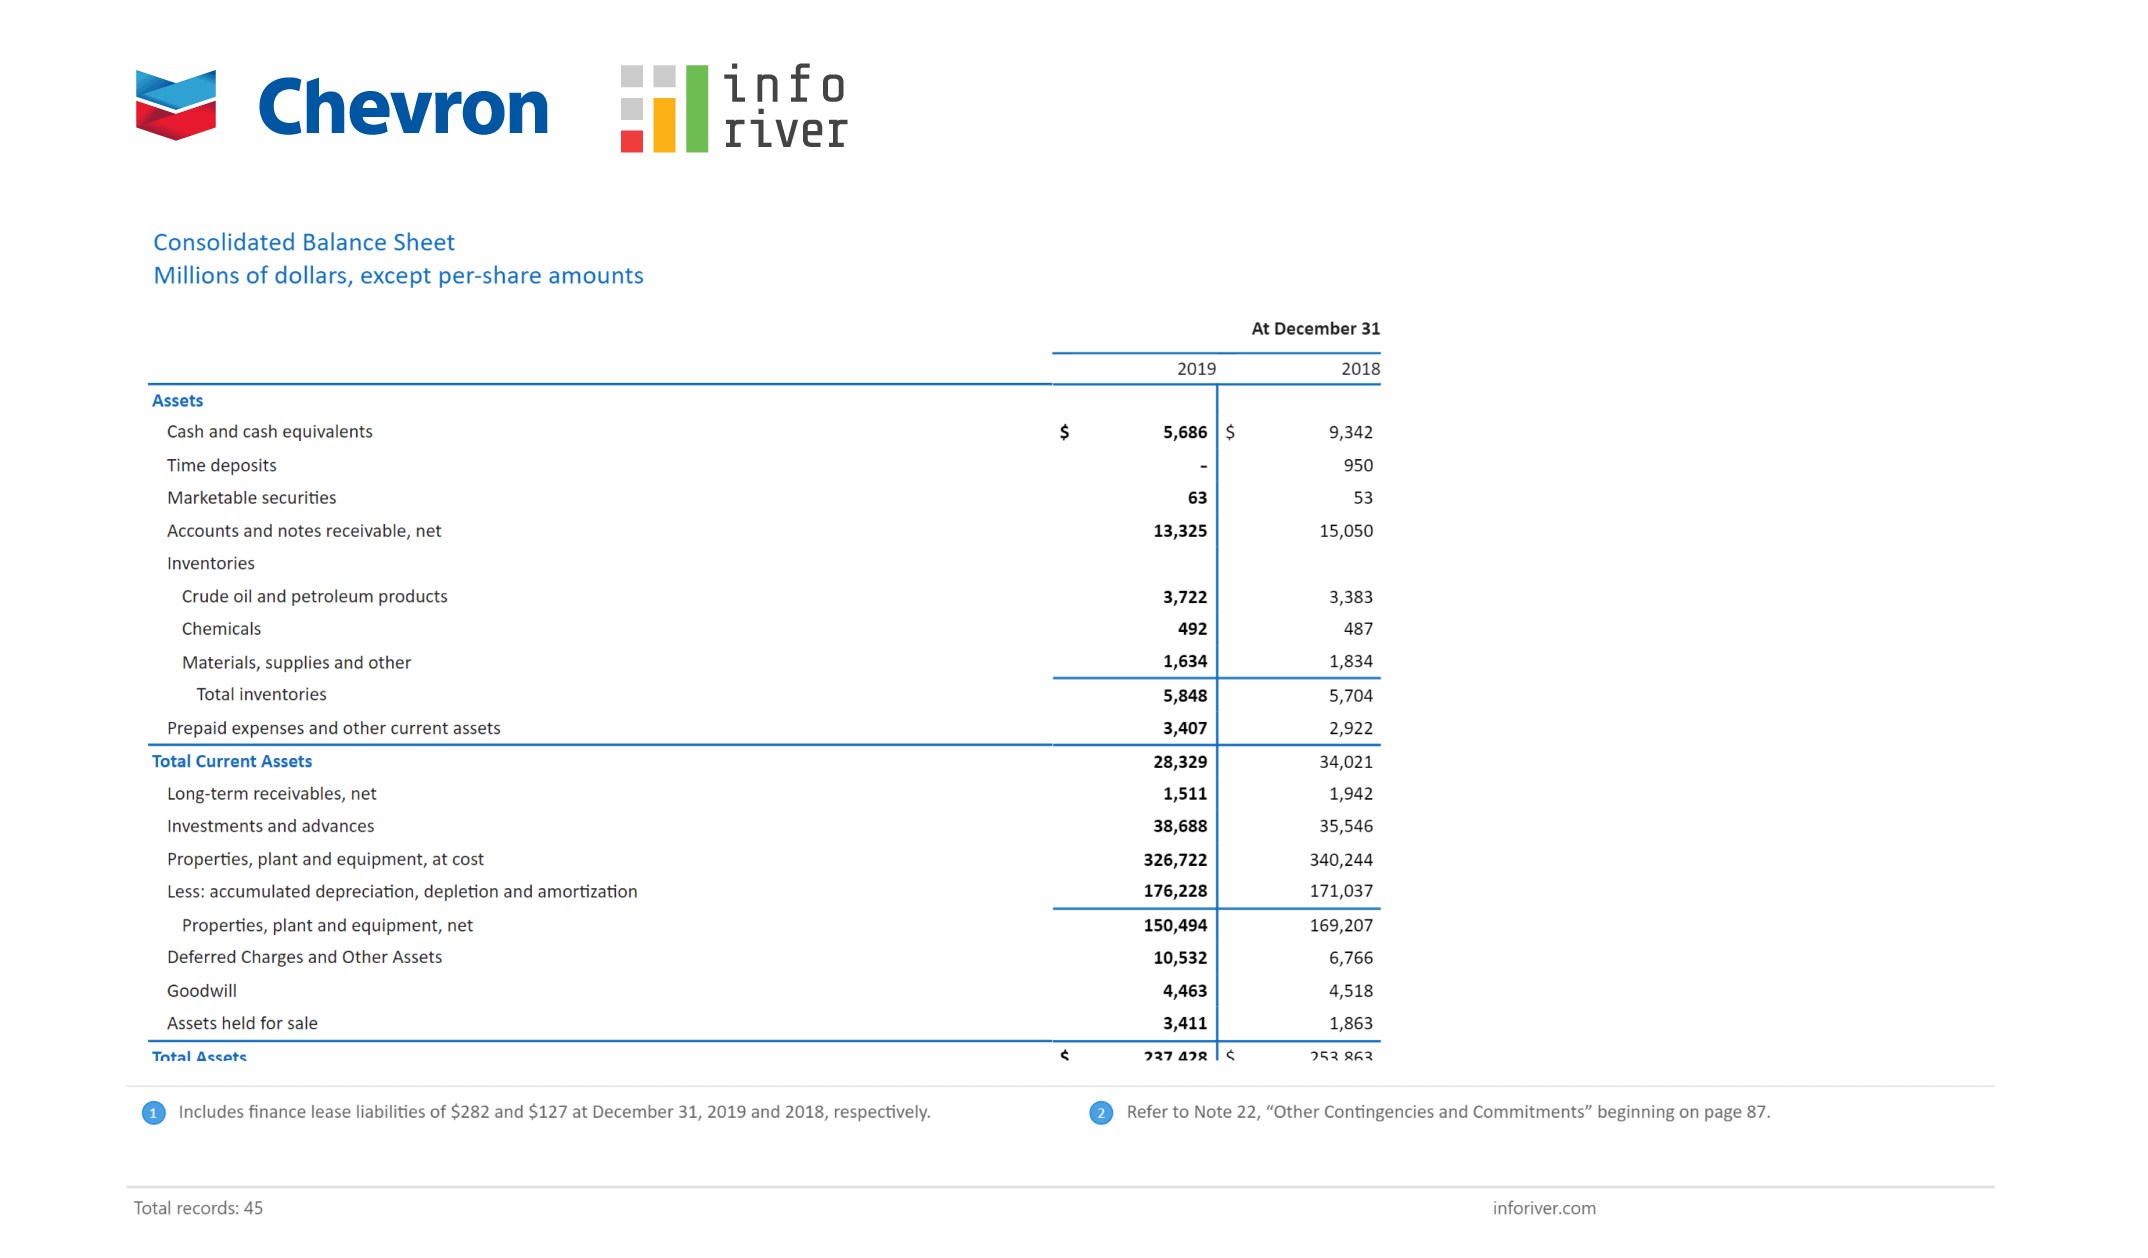
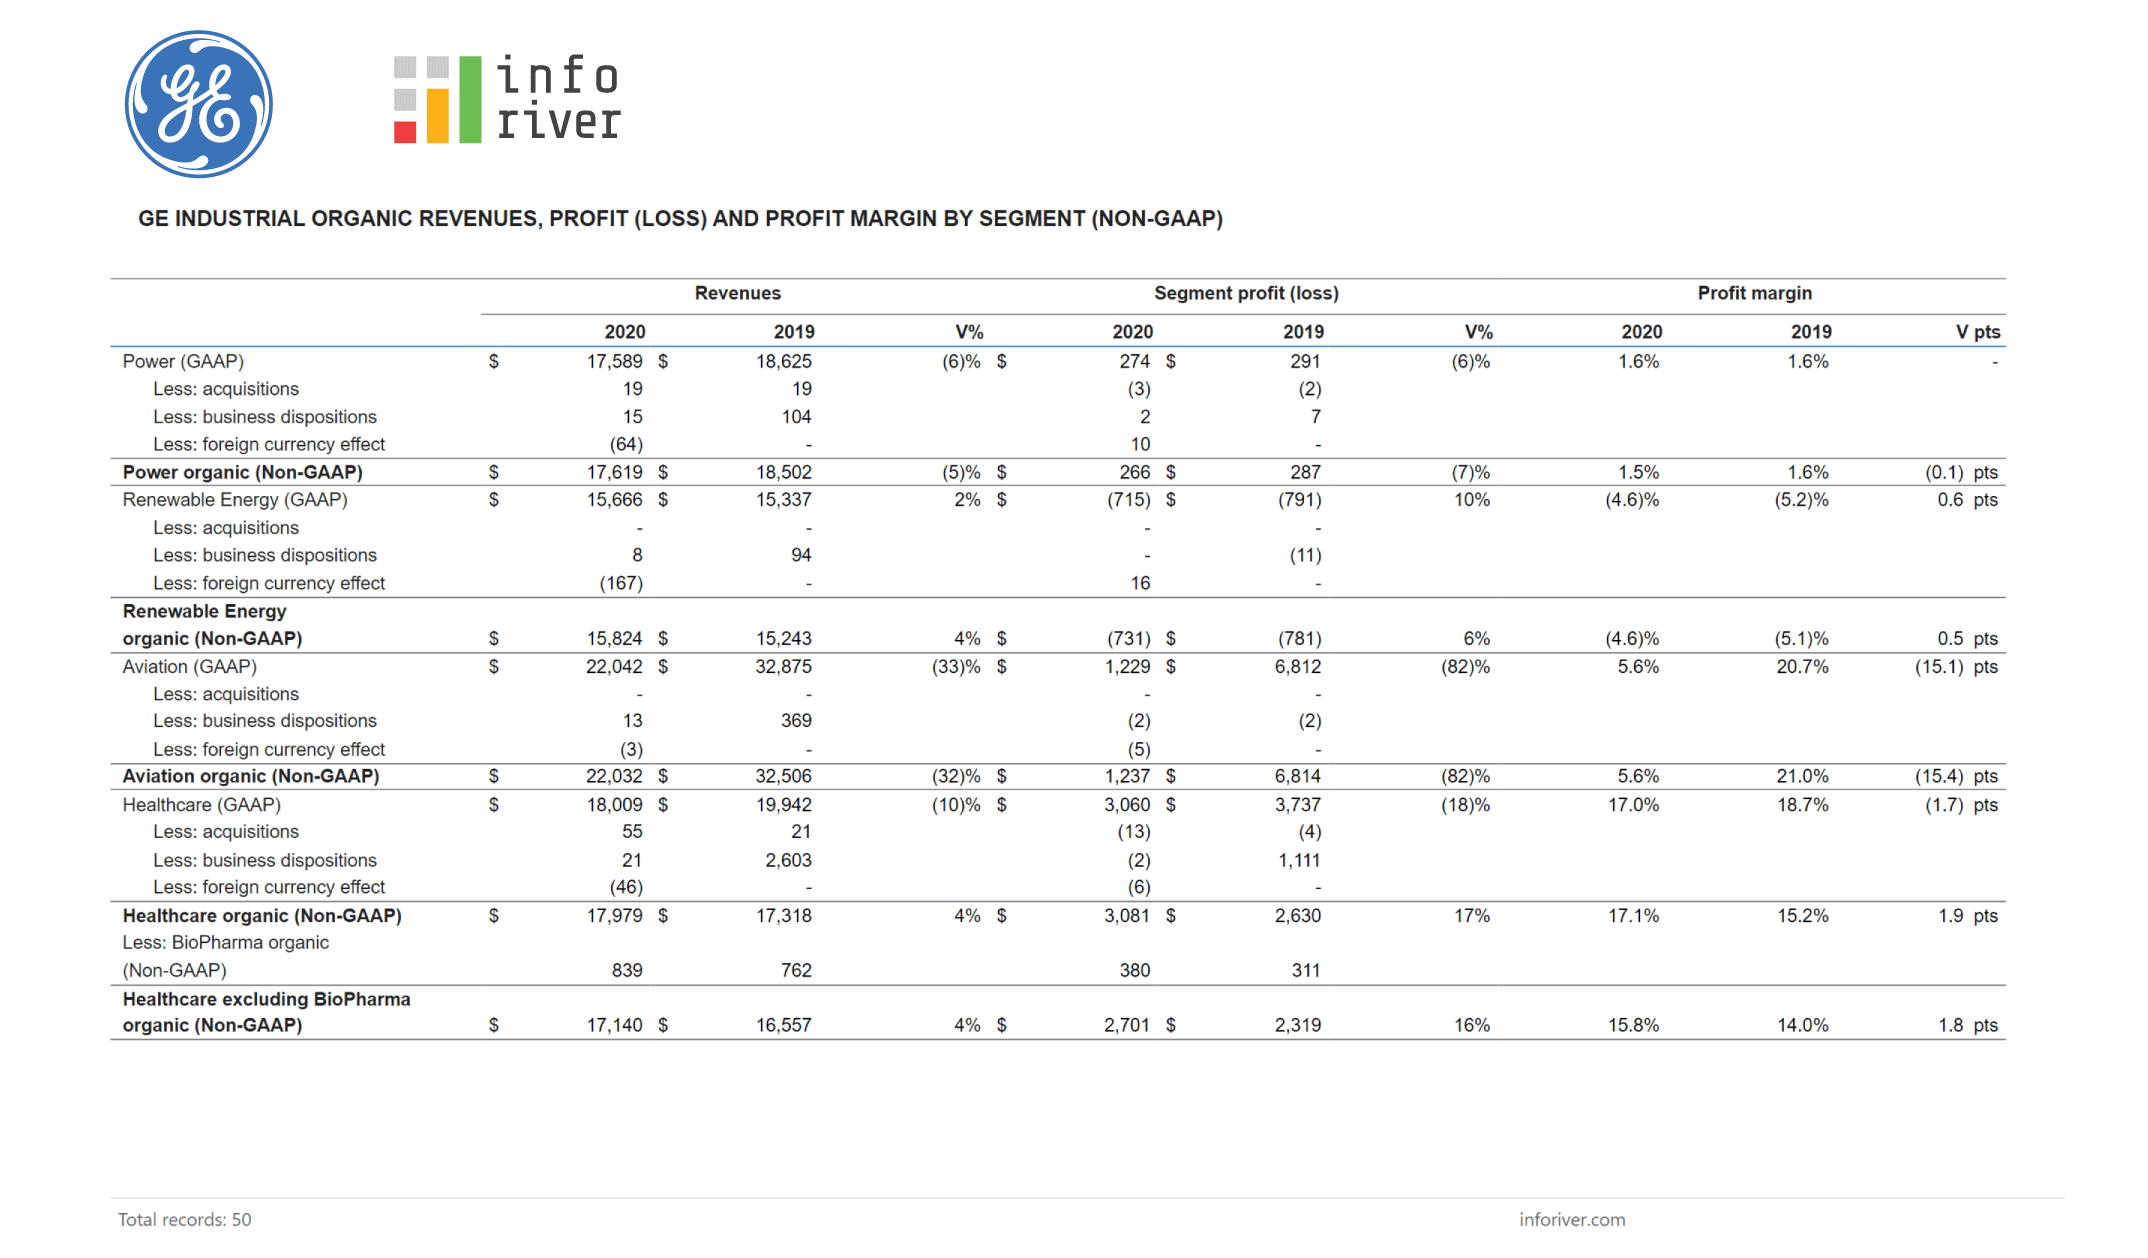
To download these demo files (.pbix) in Power BI, visit our demo page here.
Related content (Part 2 of the video): Formatting P&L/Financial Statements Power BI

Inforiver helps enterprises consolidate planning, reporting & analytics on a single platform (Power BI). The no-code, self-service award-winning platform has been recognized as the industry’s best and is adopted by many Fortune 100 firms.
Inforiver is a product of Lumel, the #1 Power BI AppSource Partner. The firm serves over 3,000 customers worldwide through its portfolio of products offered under the brands Inforiver, EDITable, ValQ, and xViz.


