Upcoming webinar on 'Inforiver Charts : The fastest way to deliver stories in Power BI', Aug 29th , Monday, 10.30 AM CST. Register Now
Upcoming webinar on 'Inforiver Charts : The fastest way to deliver stories in Power BI', Aug 29th , Monday, 10.30 AM CST. Register Now
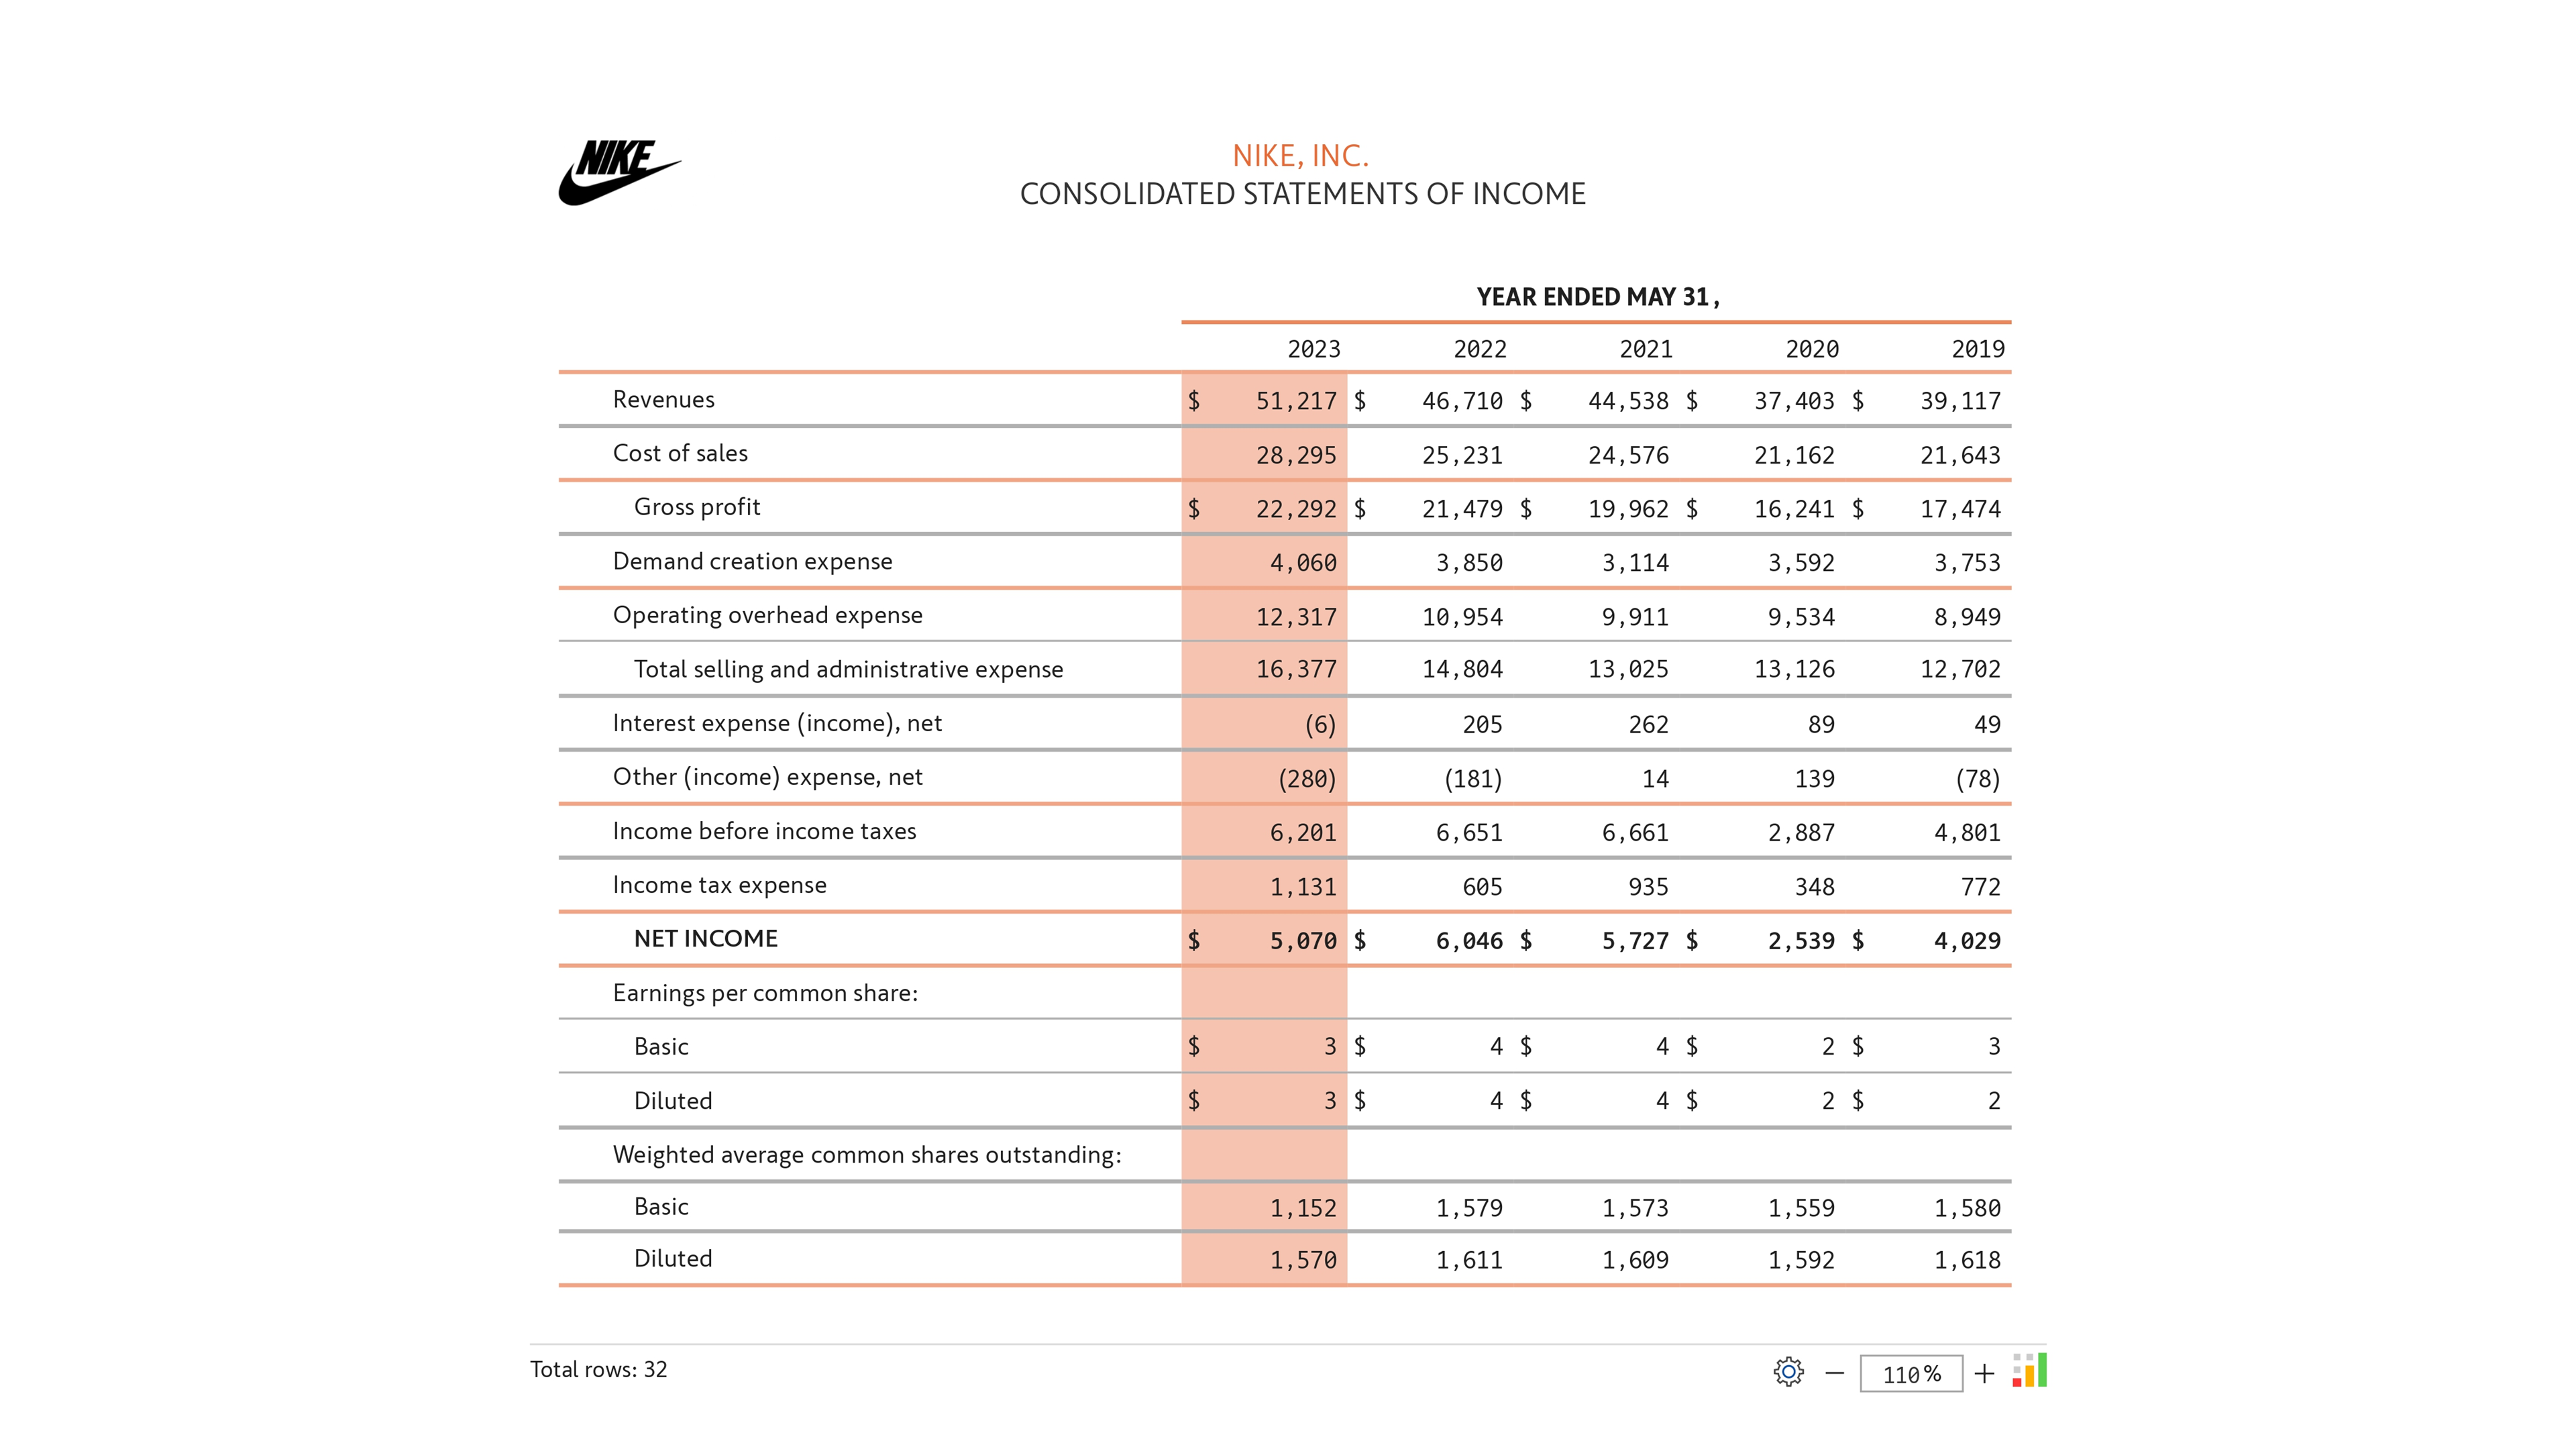
Nike's annual report showcases the P&L, Balance Sheet, Cash Flow statement and Statement of Shareholder's Equity for the year 2020.
You can create financial statements easily with the flexibility and power of spreadsheet-like features, functions and a familiar user interface.
to try advance features
[demo_download_modal title="Nike financial statements in Power BI | Inforiver" link="https://inforiver.com/wp-content/uploads/inforiver-demo-nike-report.zip"]
Inforiver helps enterprises consolidate planning, reporting & analytics on a single platform (Power BI). The no-code, self-service award-winning platform has been recognized as the industry’s best and is adopted by many Fortune 100 firms.
Inforiver is a product of Lumel, the #1 Power BI AppSource Partner. The firm serves over 3,000 customers worldwide through its portfolio of products offered under the brands Inforiver, EDITable, ValQ, and xViz.