
Upcoming webinar on 'Inforiver Charts : The fastest way to deliver stories in Power BI', Aug 29th , Monday, 10.30 AM CST. Register Now
Upcoming webinar on 'Inforiver Charts : The fastest way to deliver stories in Power BI', Aug 29th , Monday, 10.30 AM CST. Register Now
Conditional formatting in dashboards and reports are key to guide users’ attention to specific performance areas.
Compared to charts, tabular reports have higher information density which makes conditional formatting a lot more useful.
The Power BI table and matrix visuals provide conditional formatting that can be applied in the form of font color, background color, icons and data bars. Here are 5 additional ways in which you can supercharge conditional formatting in your Power BI reports using Inforiver and wow your users.
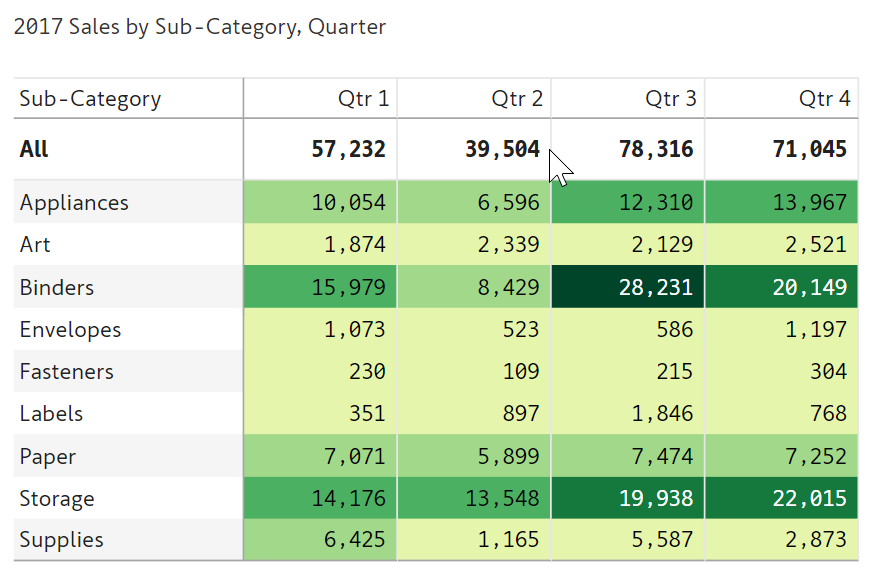
If you have tried out the conditional formatting for background colors in Power BI, you’ll know how the values get harder to read when the background is dark. Look at the example below, where Binders --> Q3 is quite hard to read.
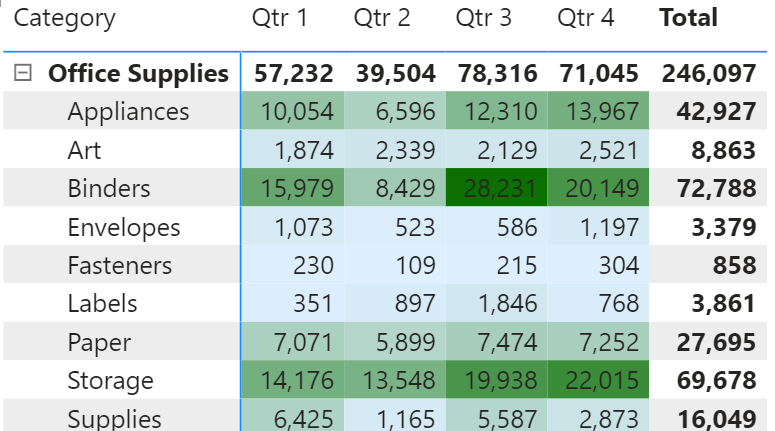
When you apply background conditional formatting in Inforiver, the font colors are automatically adjusted to be in contrast with their backgrounds. Check out the readability in this table below.
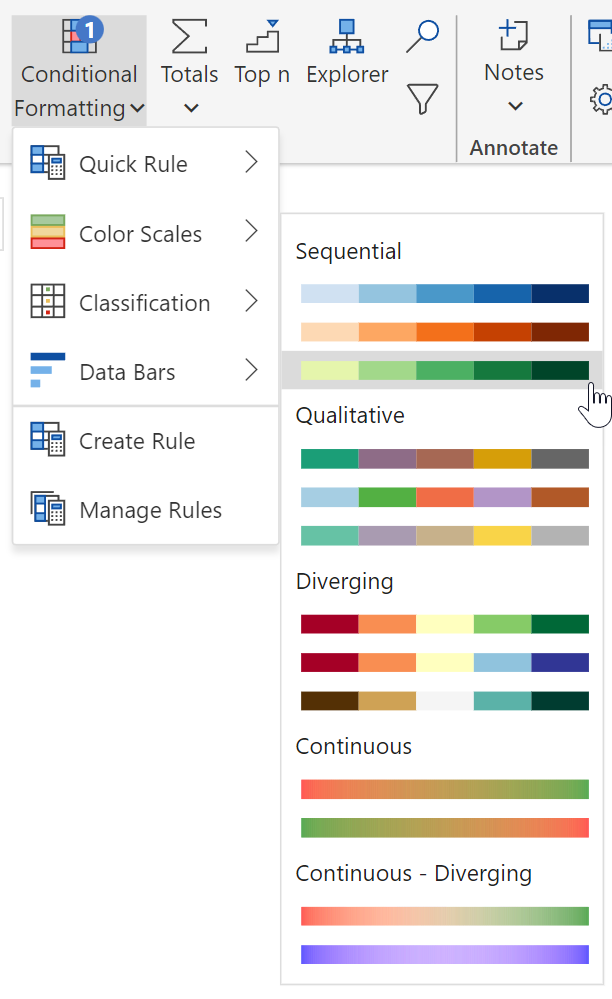
What’s more – you can deliver this in Inforiver in just two clicks. Choose any column or cell and click on Conditional Formatting from the toolbar to set a sequential scale of your liking. You will also have options to use various other scale types.
A big benefit of the one-click setting is that you do not need to create rules from scratch. After you create a quick rule, you will have the option to customize it in a detailed manner if your report requires it.
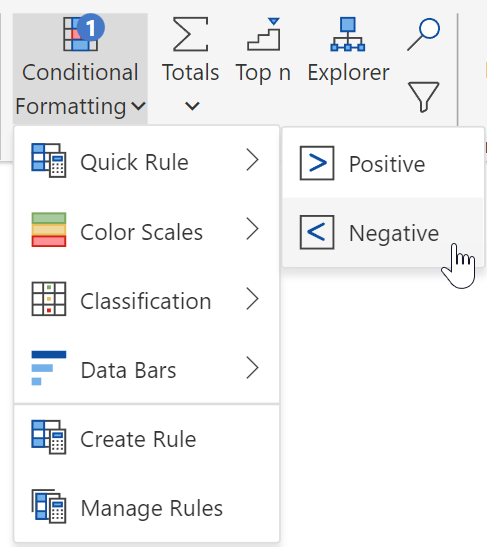
Highlighting negative values in your report can be done in a single click.

This is available as part of the Quick Rule option from the menu. Having a quick access to such formatting makes report development experience a breeze.
You can also change positive values to green by applying another formatting rule on the same measure.
Many times, it may become essential to categorize performance. A common technique used by enterprises to categorize inventory, vendors or materials is ABC analysis. Inforiver delivers this capability right out of the box.
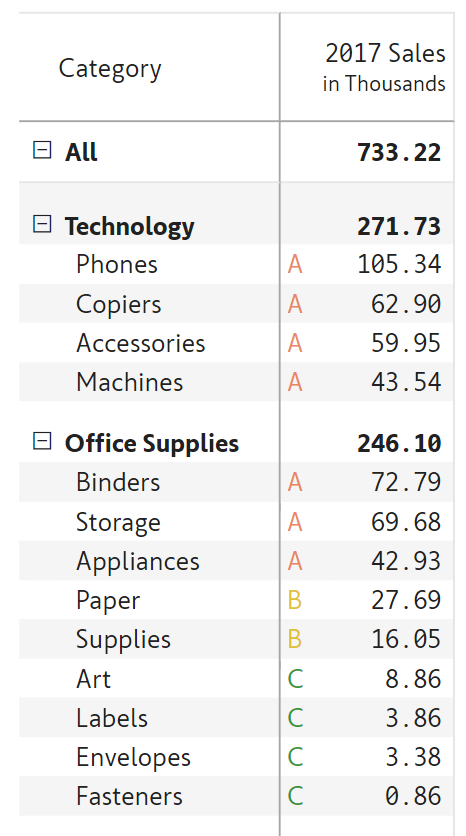
Here is how you can set up ABC classification.
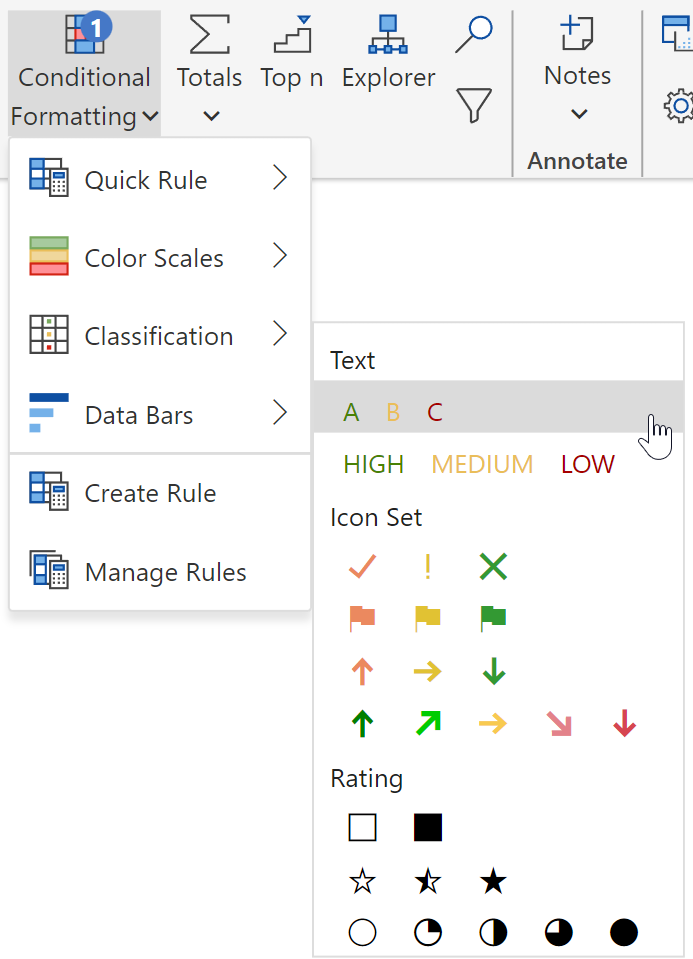
You can also have such classifications appear in a separate column if required. In the example below, we have used High/Medium/Low classification instead of A/B/C…
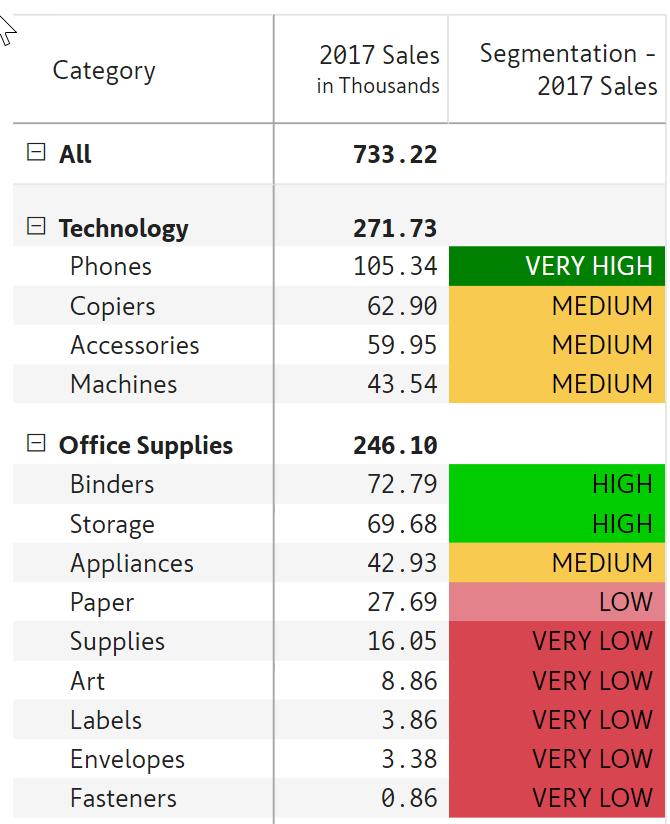
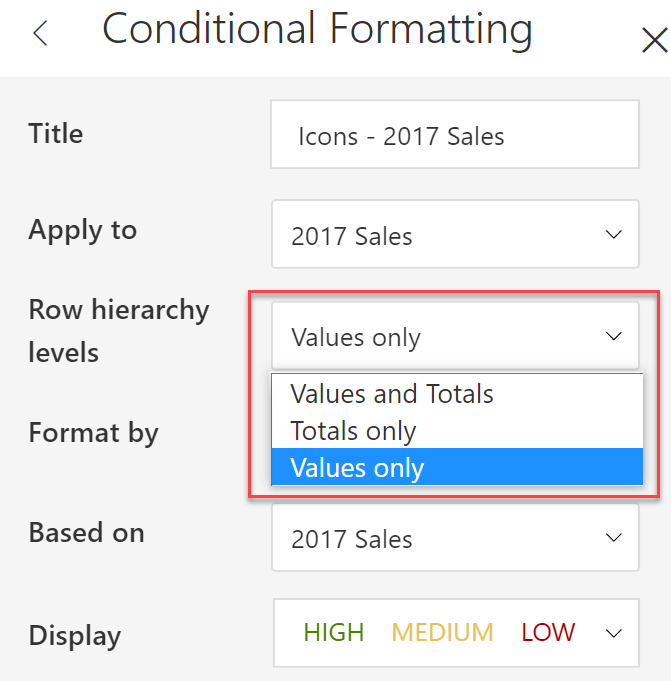
… and moved it to a separate column by indicating it in the property pane as shown below. The default range of values can be updated too if required.

Note that when it comes to classification scenarios, Inforiver automatically excludes totals & subtotals (as seen from the images above). The reason is that most measures follow a sum aggregation due to which subtotals are likely to fall in the higher performance bracket.
However, if you are using a measure like Margin %, you can include totals and subtotals in your conditional formatting rule. This is done as shown below.
You can also deliver conditional formatting using icons in a few clicks. Here is an example where items that contribute the most to sales are highlighted.
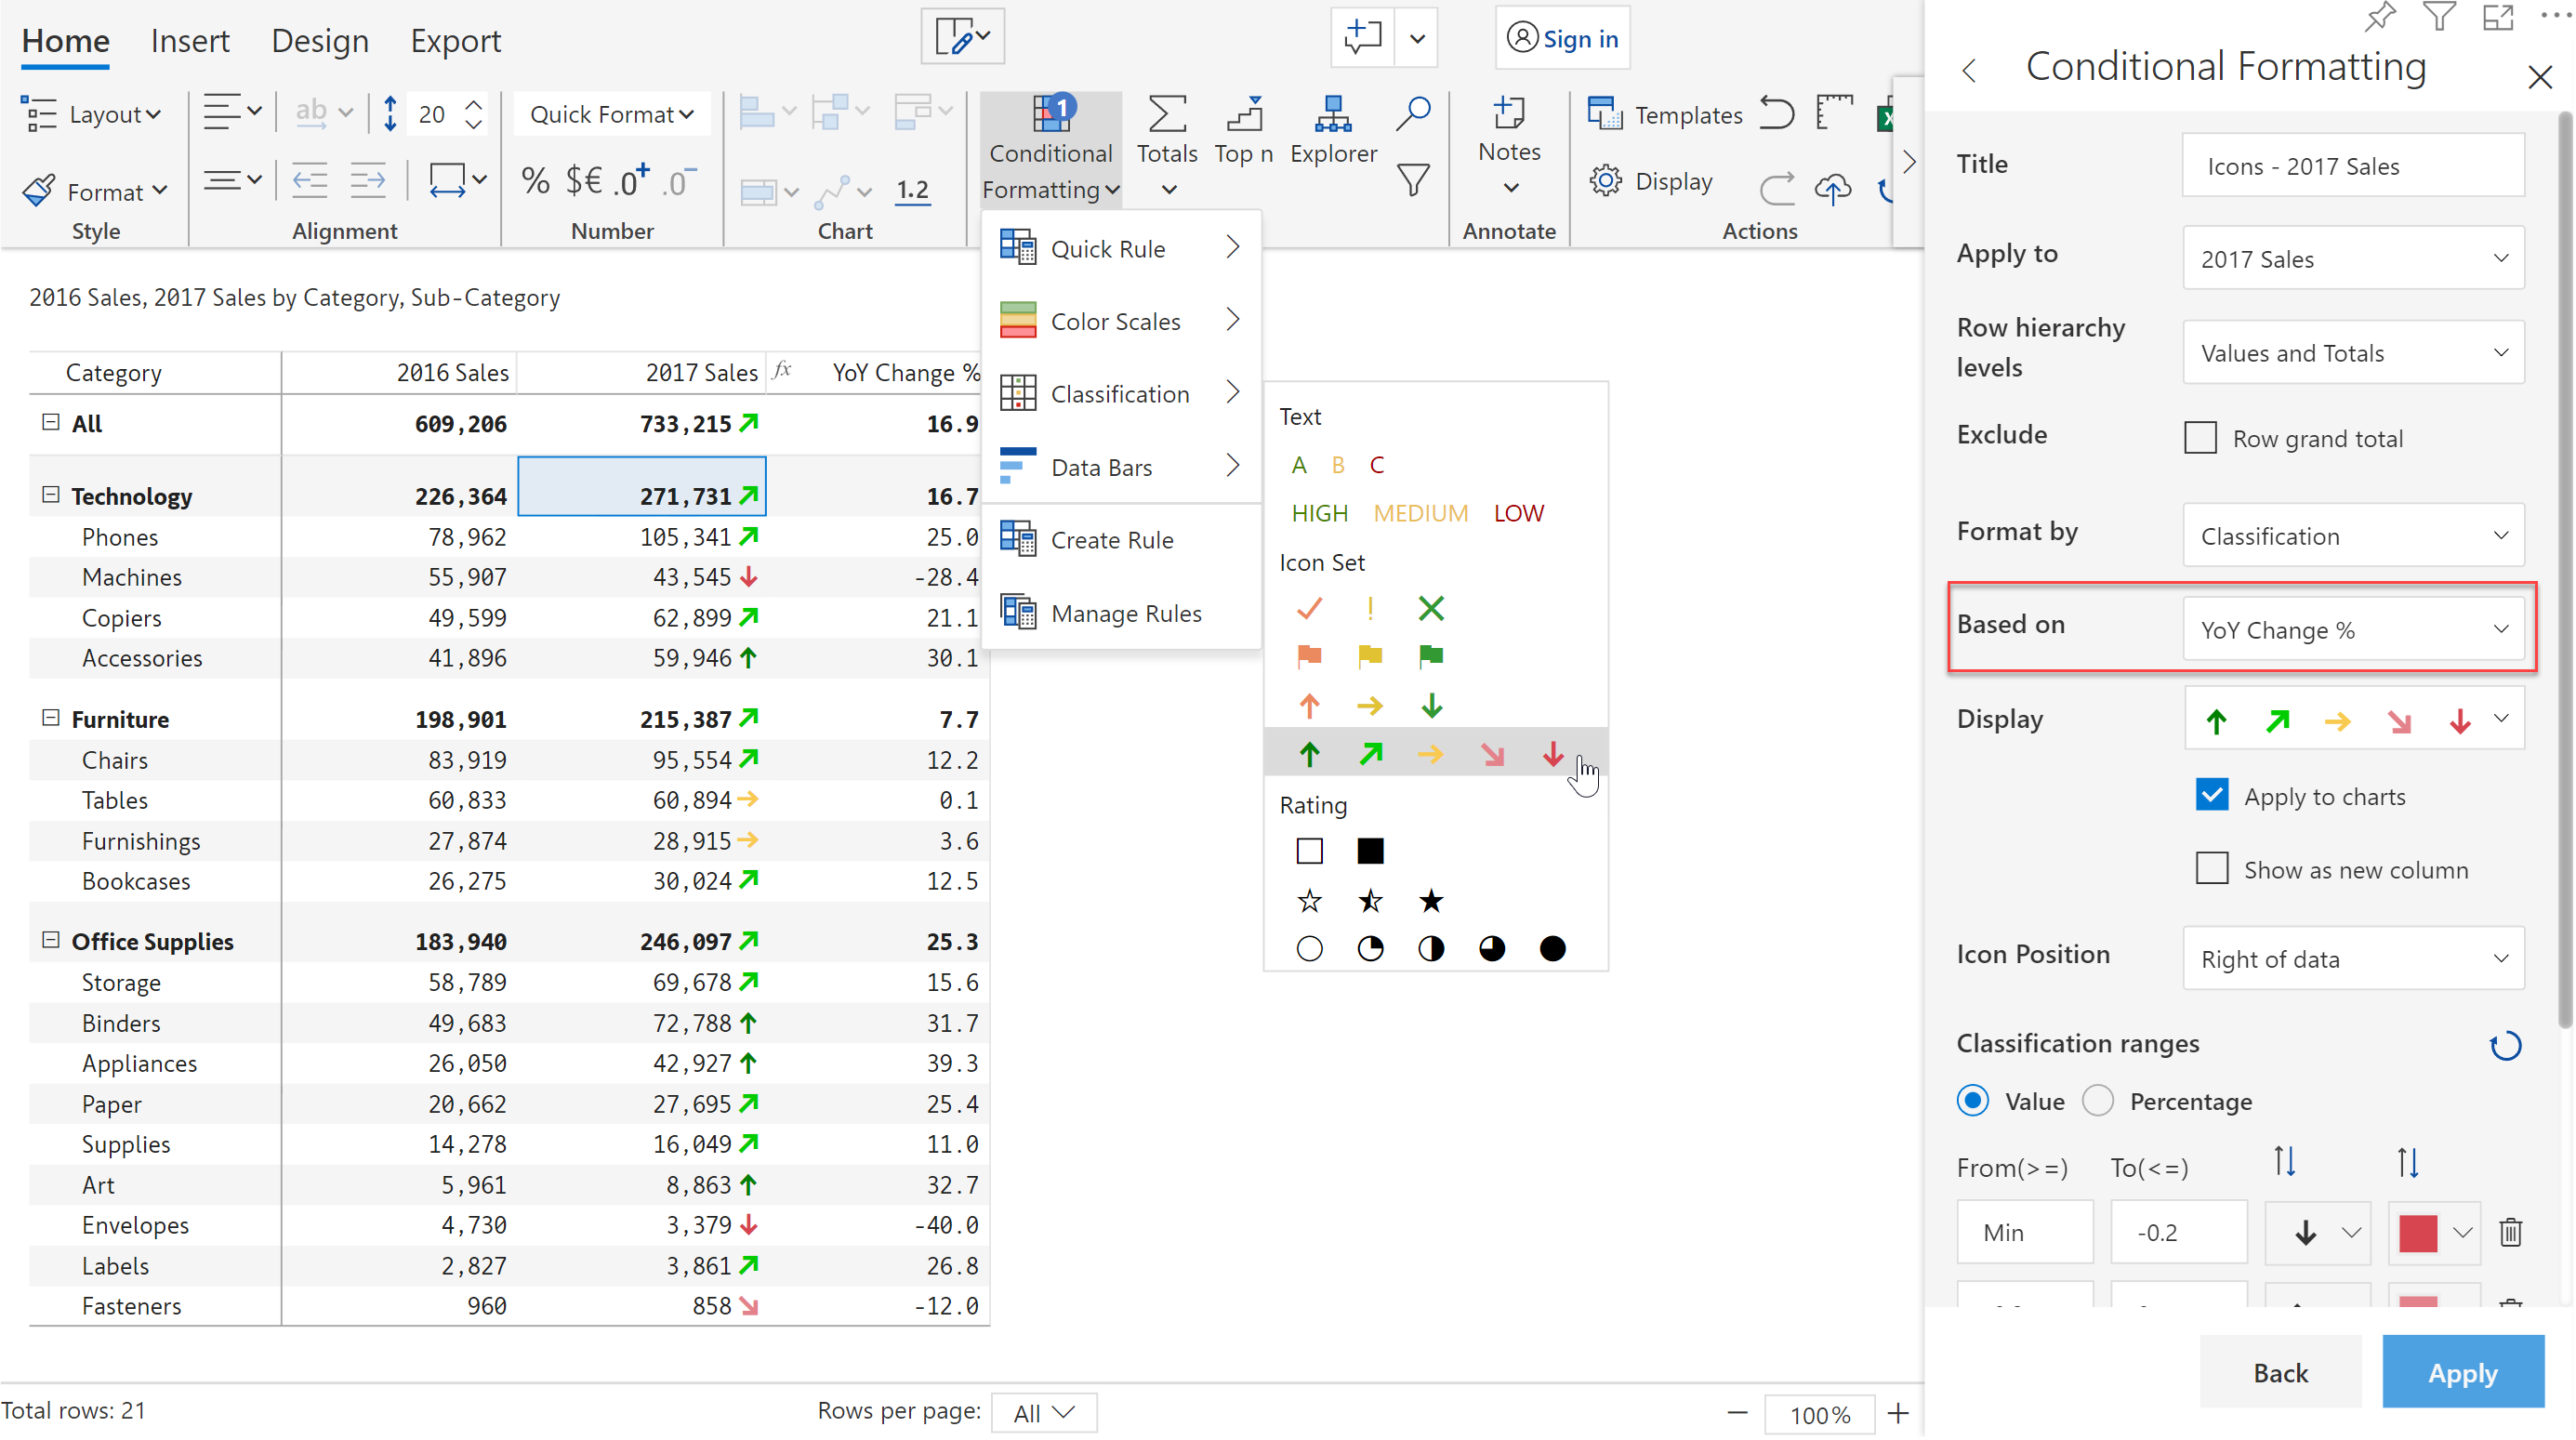
When you want to highlight how things have changed over time, a trend icon may be better. In the example below, we are adding trend icon to 2017 sales, based on another measure YoY Change %. The properties pane shows how to configure this.
Here is another example of a 1-5 rating scale icon. You can customize the number of icons (circles) that appear in your scale – this has been set to 5 in this case. You can also use star-based ratings as seen in ecommerce sites in the product feedback section.
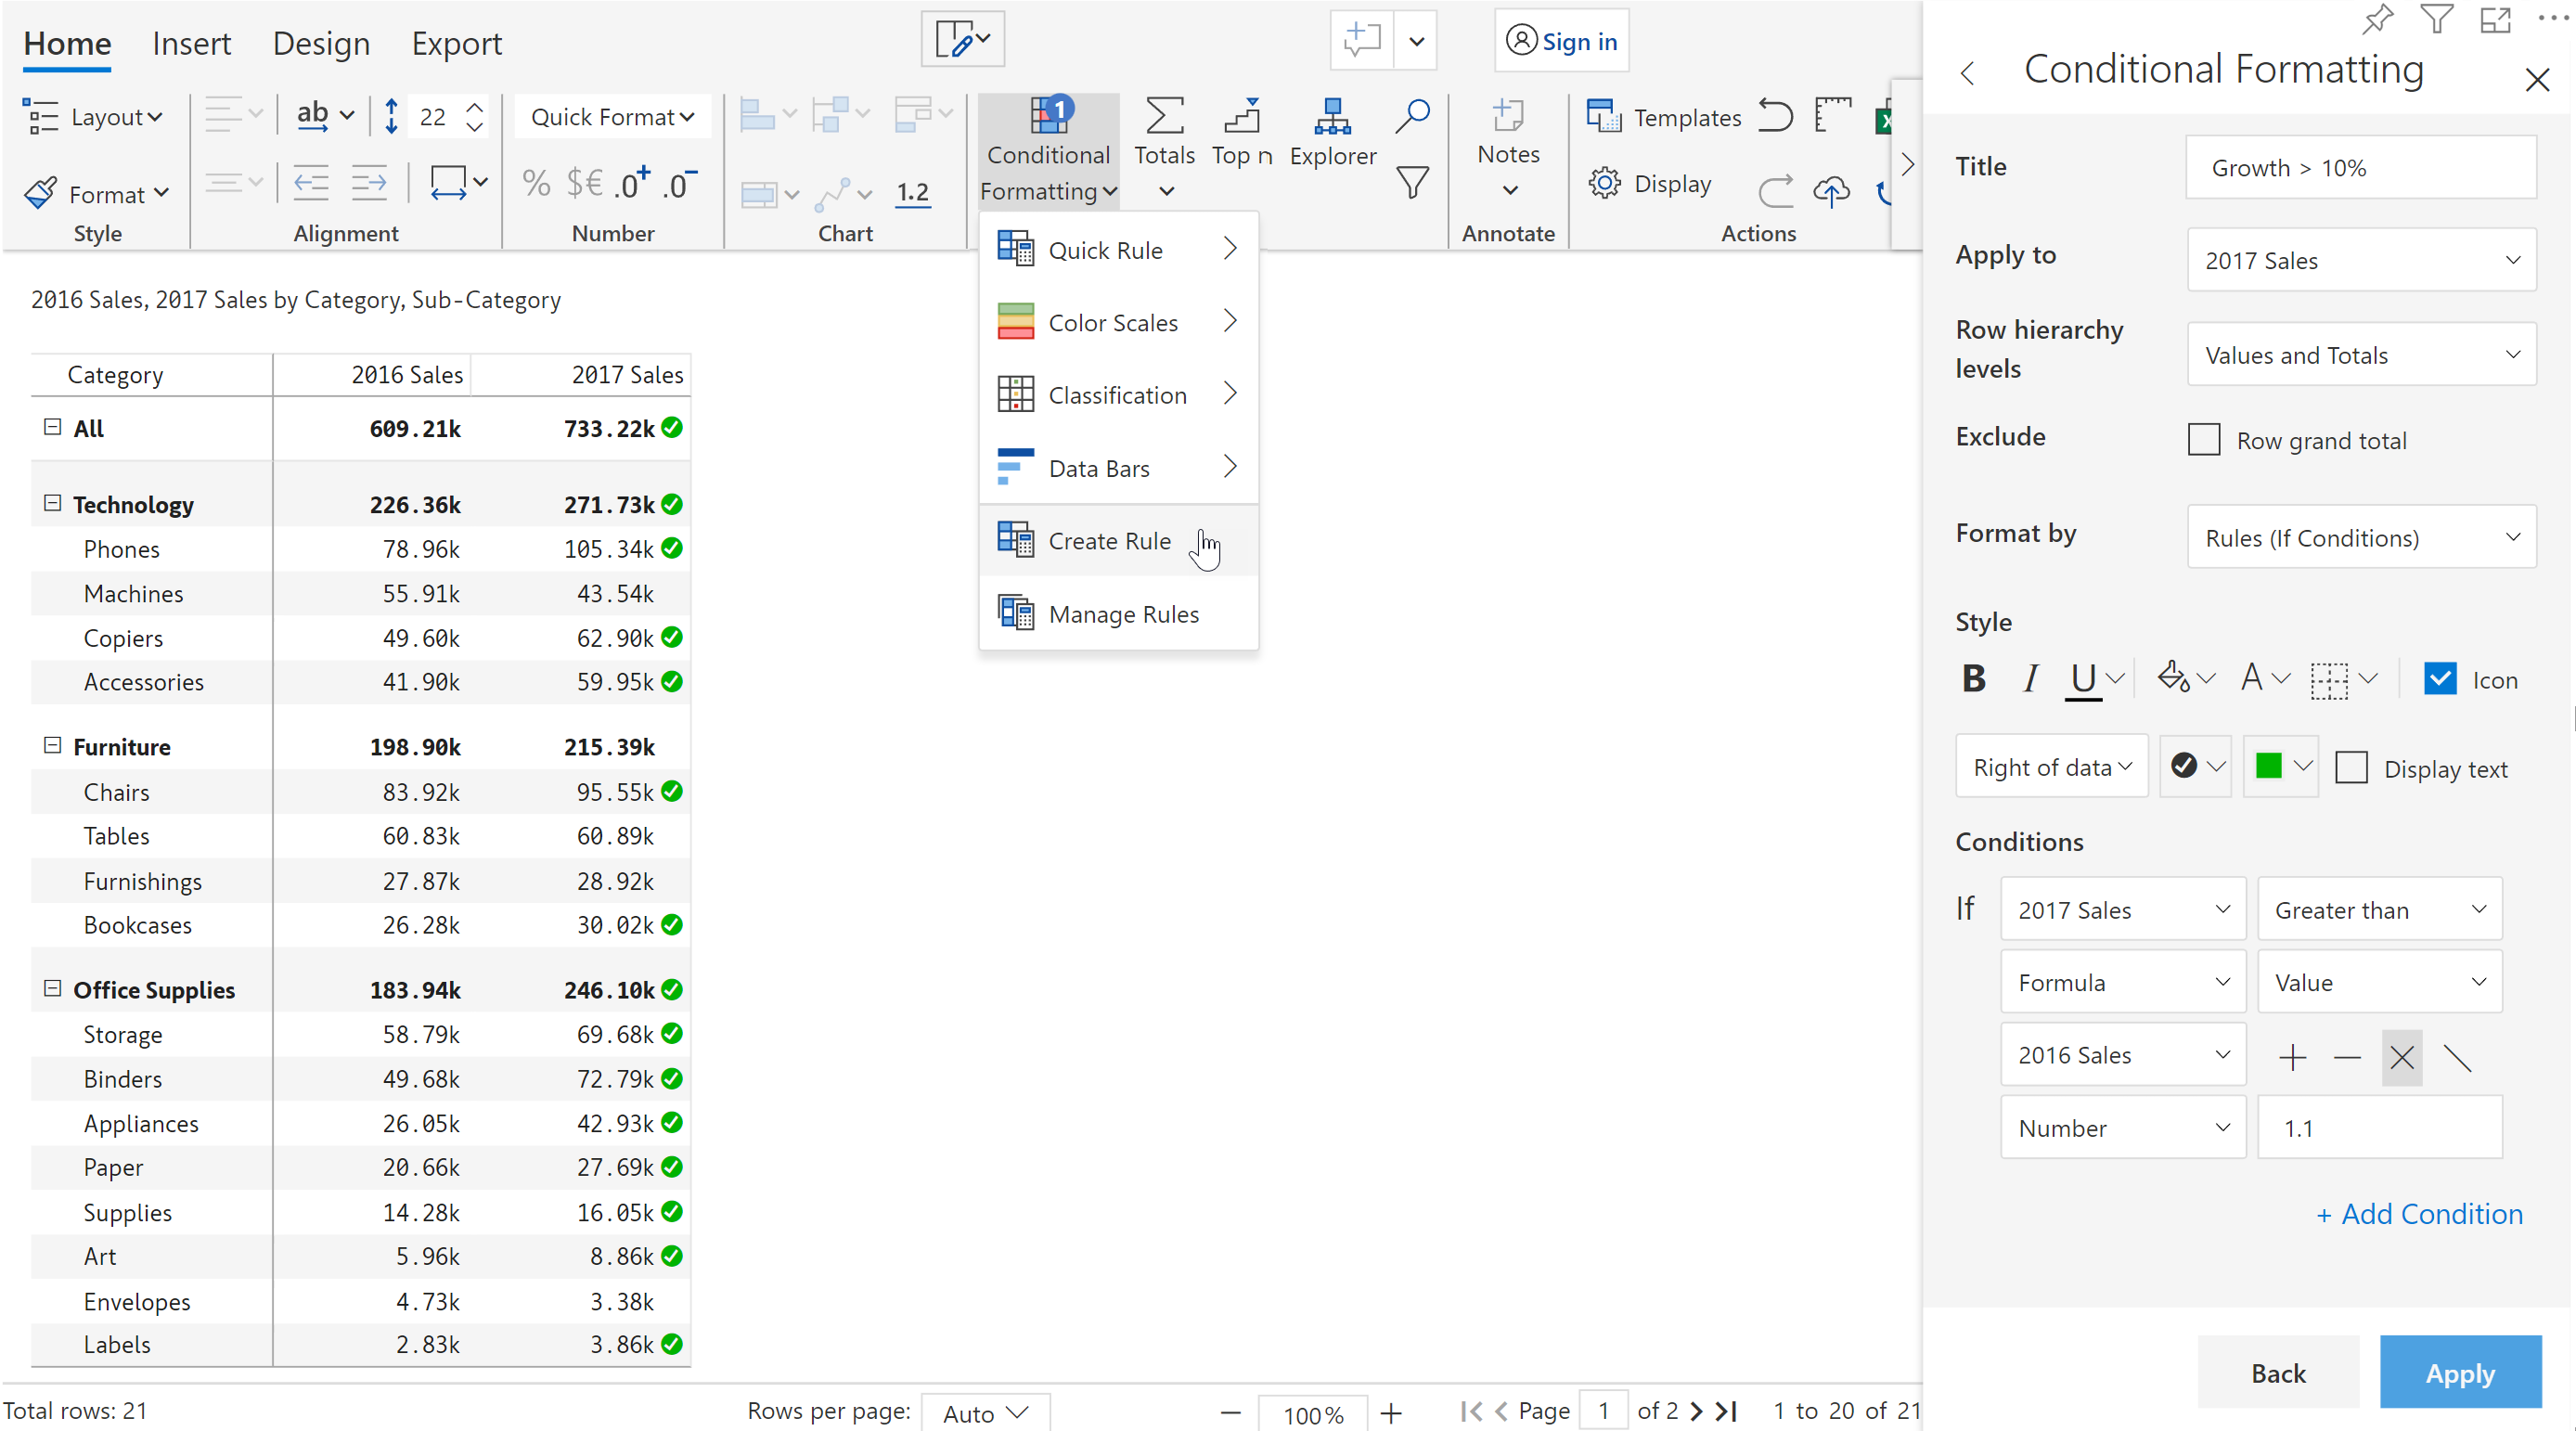
Let’s take a scenario where we want to highlight 2017 sales wherever it has exceeded 2016 sales by more than 10%. In another words, highlight when 2017 Sales > 2016 Sales * 110%.
How do we accomplish this in Power BI?
Inforiver gives you the ability to create custom conditional formatting rules without any coding or scripting. Our formatting requirement is captured as shown below.
You can also add several conditions by using the ‘Add Condition’ feature. For example, highlight items with Sales growth > 10%, and Margin > 25%.
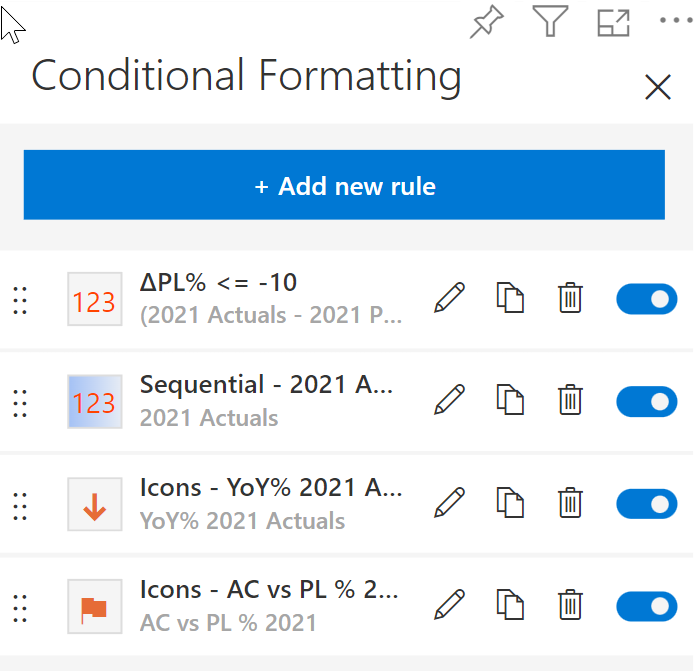
Finally, Inforiver provides you with an easy way to manage all the conditional formatting rules for the report from a single location. This is a much easier than tracking rules by each measure – as it is done in the native Power BI visuals.
Interested to try out conditional formatting with Inforiver? Download a free & certified edition of Inforiver directly from Microsoft AppSource today.

Inforiver helps enterprises consolidate planning, reporting & analytics on a single platform (Power BI). The no-code, self-service award-winning platform has been recognized as the industry’s best and is adopted by many Fortune 100 firms.
Inforiver is a product of Lumel, the #1 Power BI AppSource Partner. The firm serves over 3,000 customers worldwide through its portfolio of products offered under the brands Inforiver, EDITable, ValQ, and xViz.


