Inforiver

Upcoming webinar on 'Inforiver Charts : The fastest way to deliver stories in Power BI', Aug 29th , Monday, 10.30 AM CST.    Register Now

The fastest way to
explore data
in Power BI

Advanced data exploration

KPI Explorer

Filter rows, columns and measures using the interactive KPI explorer

Advanced AND/OR filtering

Use nested AND / OR filters and filter groups for a flexible and powerful data exploration experience

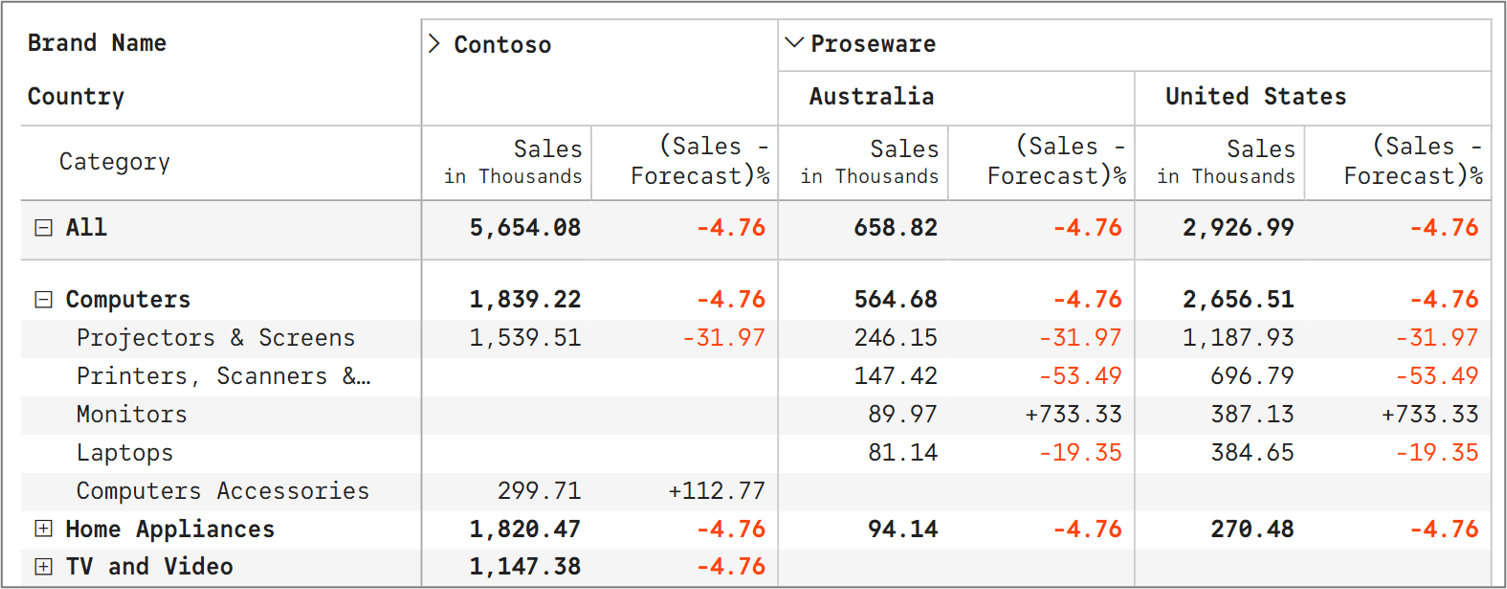
Hierarchy layout

Visualize as expand/collapse enabled row and column hierarchies​

Outline layout

Visualize row hierarchies as individual columns with expand/collapse for rows and columns

Table layout

Visualize row hierarchies in a tabular format; expand/collapse supported only for columns

Stepped layout

Visualize row hierarchies as individual columns including a separate total row for each branch of the hierarchy

Mixed layout

Visualize only important row hierarchies as individual columns

Drilldown layout

Drilldown one hierarchy branch at a time when you have a large number of rows

Highlights

1. KPI explorer

Filter rows, columns and measures, sort by name or value and highlight row hierarchies using rules or ranges ​

KPI explorer

2. Advanced AND/OR filtering​

Use a nested AND / OR filters and filter groups for a flexible and powerful filtering experience​

Advanced AND/OR filtering​

3. Hierarchy layout

Expand or collapse categories along both rows and columns​

Hierarchy layout​

4. Outline layout​

Visualize the row hierarchies in individual columns; expand/collapse rows and columns as needed​

Outline layout​

5. Table layout​

Visualize the row hierarchies in a tabular format, without expand-collapse support for rows​

Table layout​

6. Stepped layout​

Visualize the row hierarchies in individual columns including a separate total row for each branch of the hierarchy ​

Stepped layout​

7. Mixed layout​

Use mixed layouts when have 3 or more hierarchy levels and when want to visualize specific fields as separate columns. Available as part of the hierarchy layout.​

Mixed layout​

8. Drilldown layout​

Explore one hierarchy branch at a time using the drilldown layout; useful to handle a large number of rows

Drilldown layout​

Looking for more?​

Explore how you can perform excel-like pivot analysis in Power BI​

Continue
Inforiver Logo
IBCS Certified
Power BI certified
About Inforiver!

Inforiver drives business productivity and business performance with faster time to insights inside Power BI through an intuitive no-code experience. The product is developed by Lumel Technologies (formerly Visual BI), which has a decade of experience in building add-on solutions on top of BI platforms (SAP BI and Power BI) with our suite of innovative products such as ValQ, xViz, and BI Hub
Headquarters
5920 Windhaven Pkwy, #130
Plano TX 75093
ValQ
xViz
BI Hub
linkedin facebook pinterest youtube rss twitter instagram facebook-blank rss-blank linkedin-blank pinterest youtube twitter instagram