Upcoming webinar on 'Inforiver Charts : The fastest way to deliver stories in Power BI', Aug 29th , Monday, 10.30 AM CST. Register Now
Upcoming webinar on 'Inforiver Charts : The fastest way to deliver stories in Power BI', Aug 29th , Monday, 10.30 AM CST. Register Now
Be it a normal table or a hierarchical matrix style report in Power BI, Inforiver allows you to seamlessly manage subtotals and grand totals in a couple of clicks.
Let us take the case of the following dataset, with hierarchies across both rows & columns.
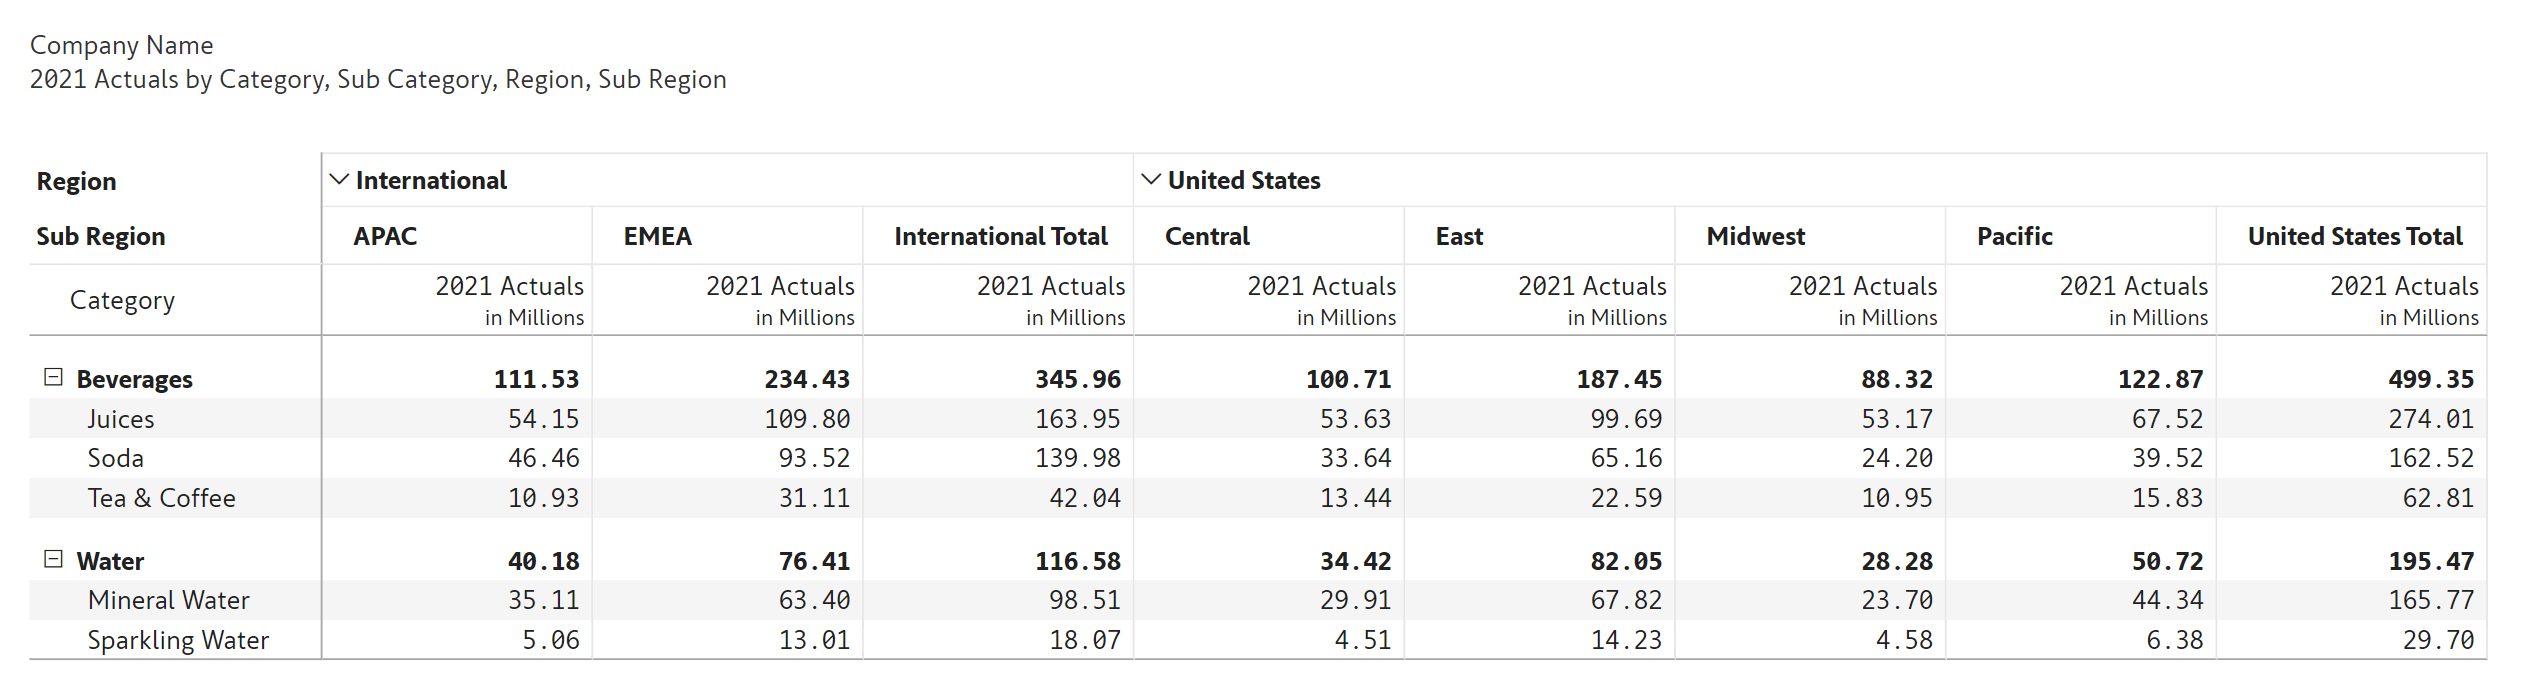
Note that
(a) The row subtotals (Beverages & Water) are the top, and
(b) The column subtotals (International Total & US Total) are at the right
(c) There are no grand totals for rows or columns.
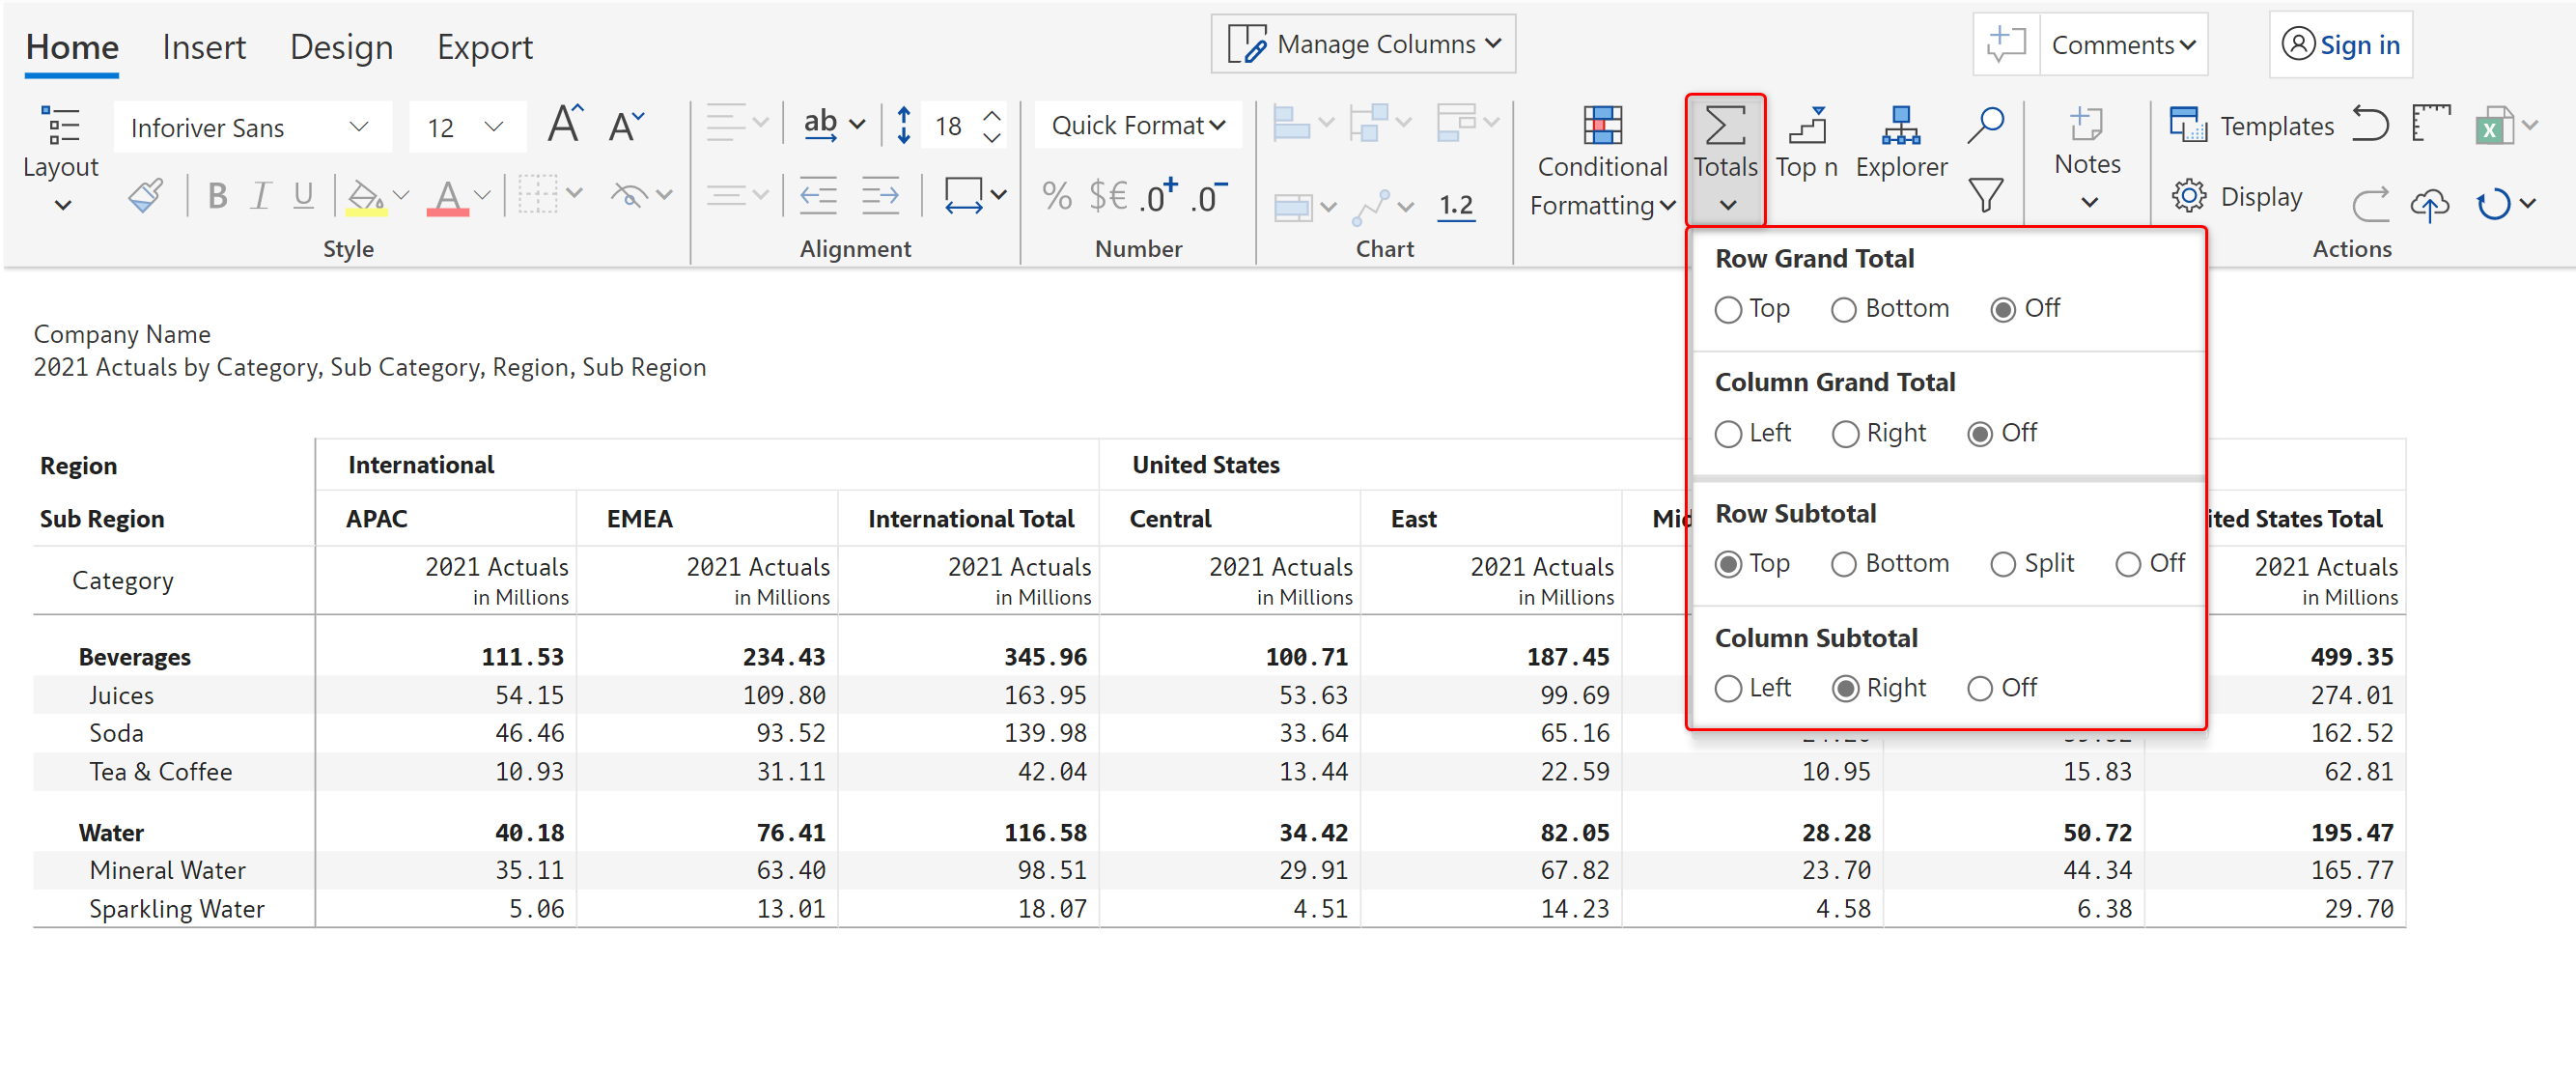
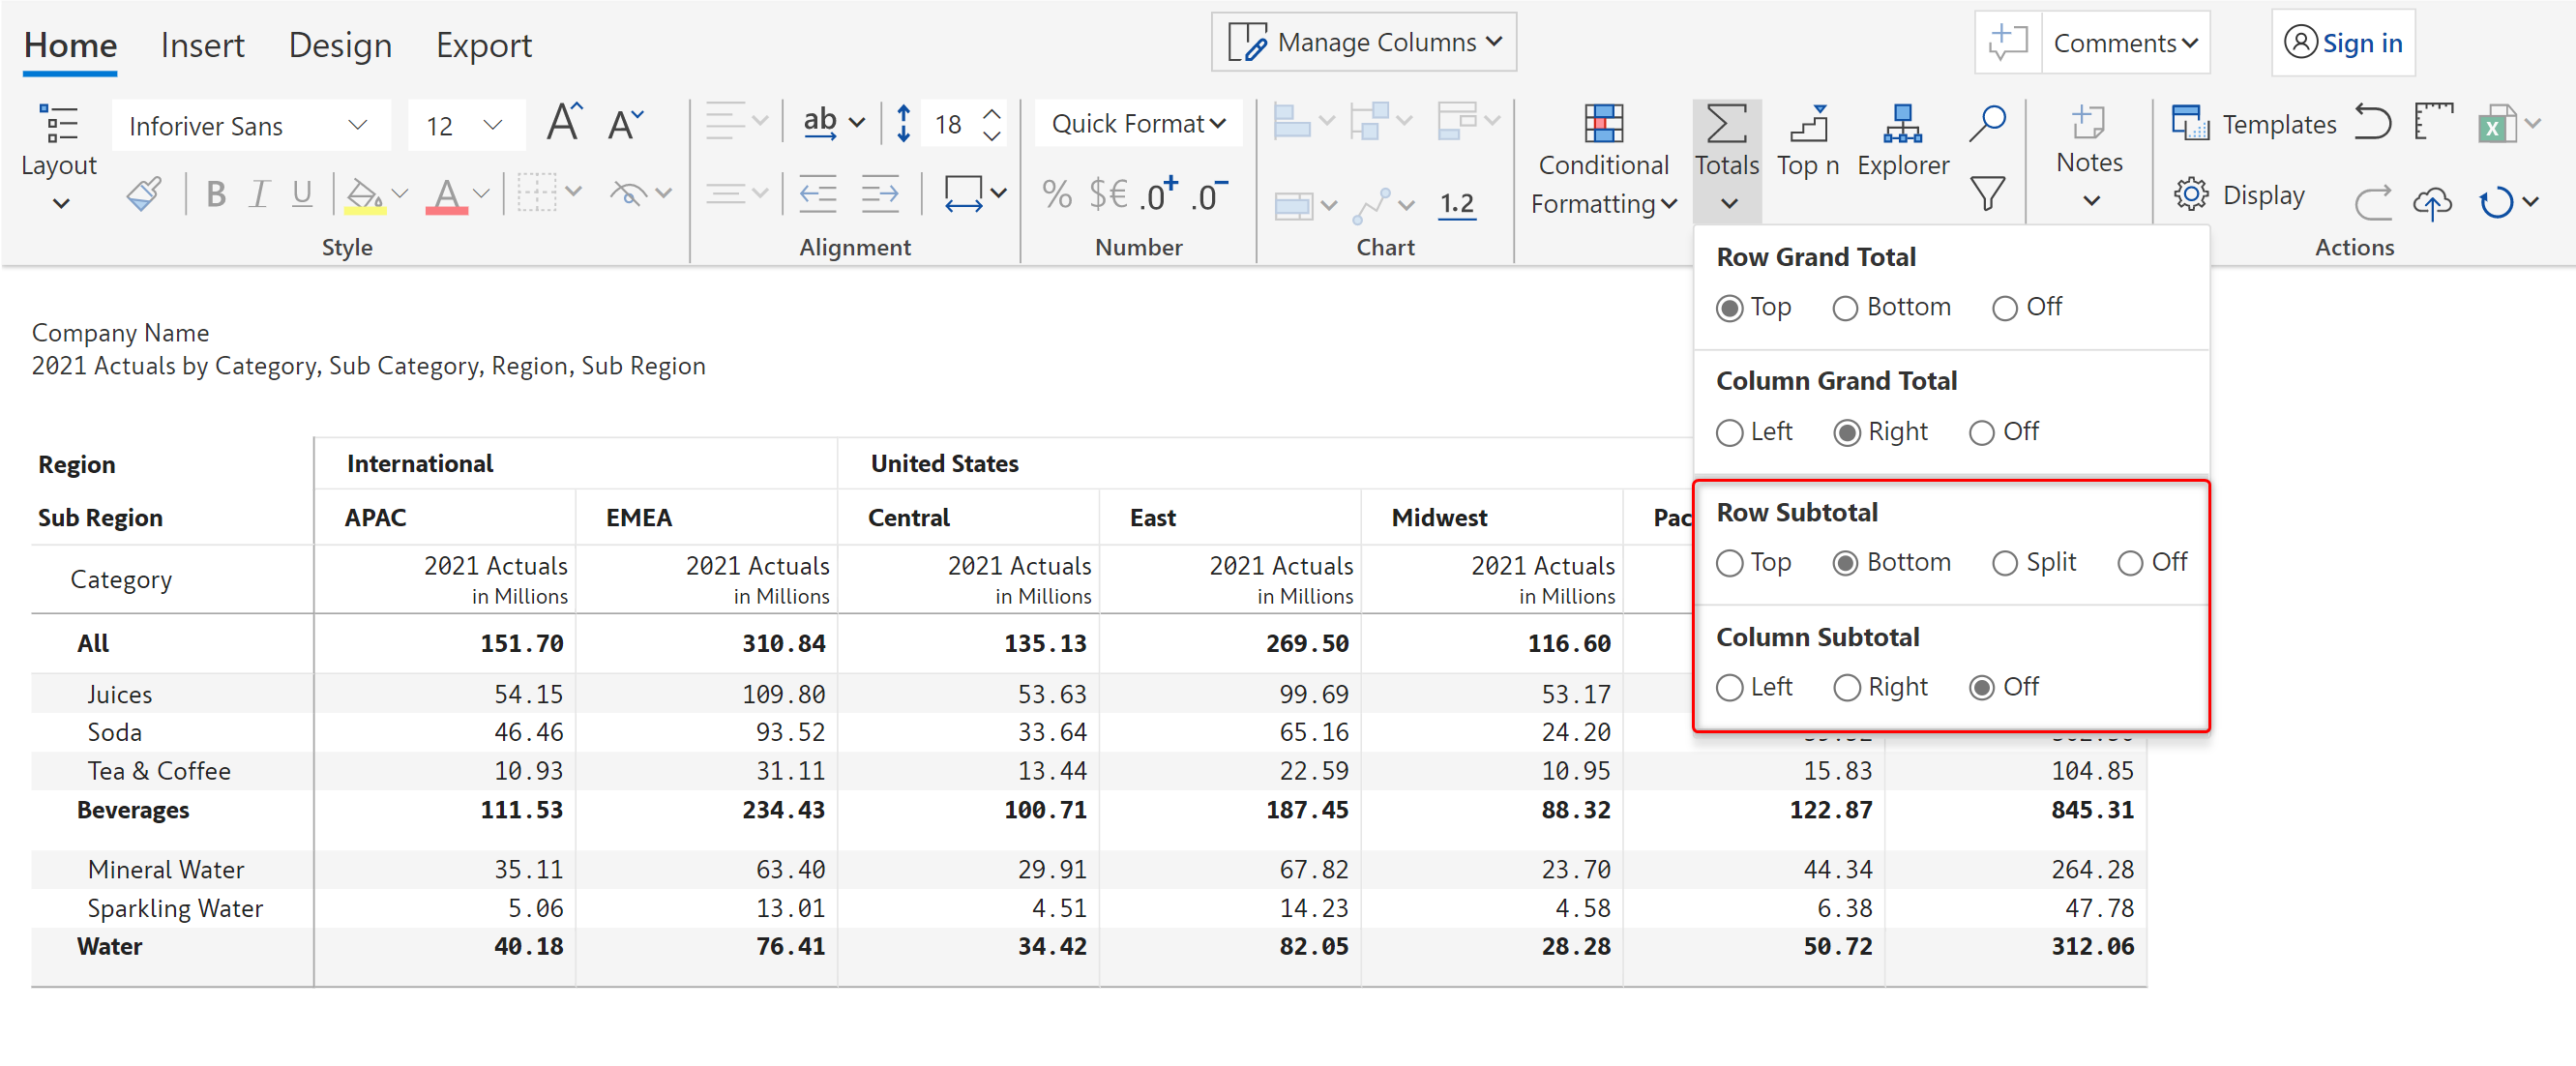
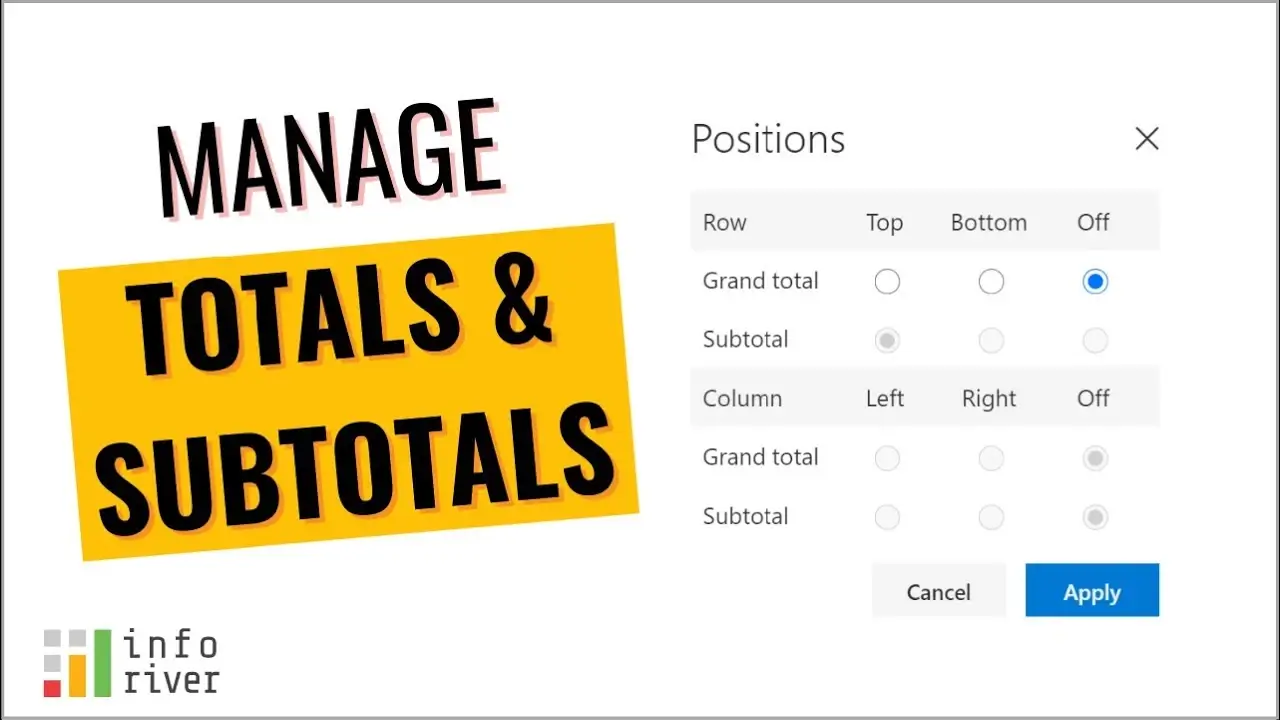
Let us add the grand total for rows & columns. Click on Home --> Total from the menu. A set of options drop down.
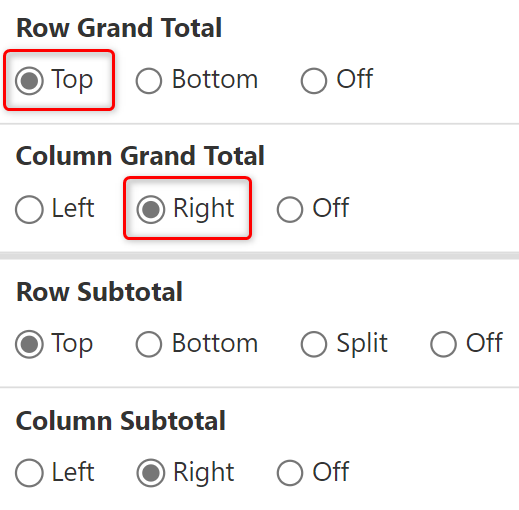
Select ‘Top’ and ‘Right’ as row and column grand total positions…
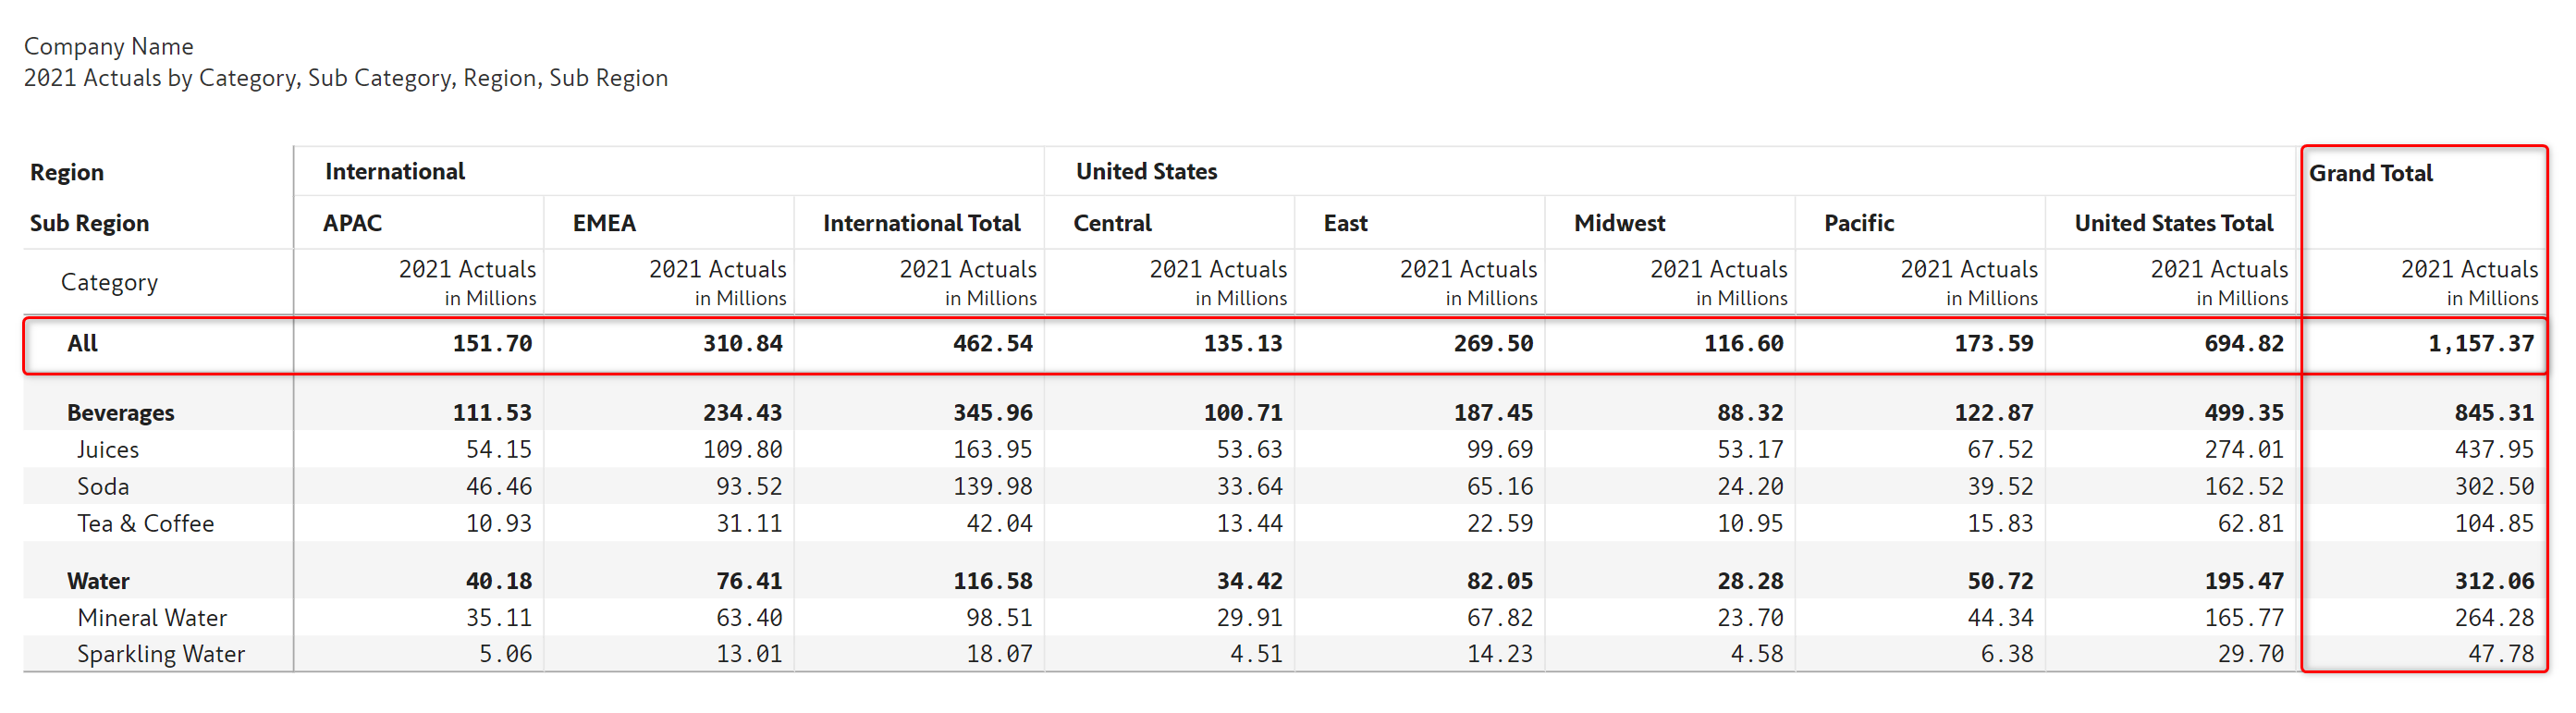
… and you would automatically see them reflected in the table.
You can also change the positions of row & column subtotals or turn them off.
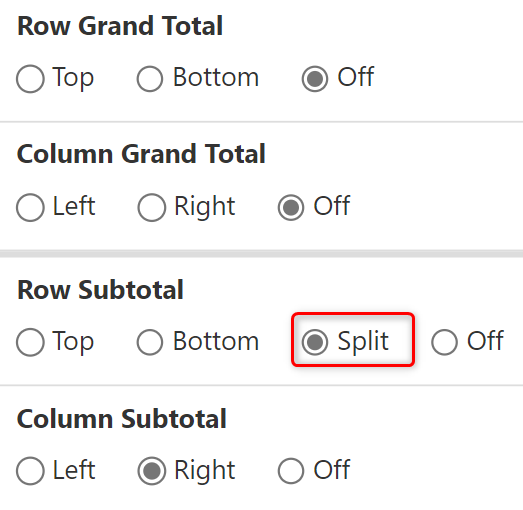
There is another final interesting option that we need to try – “Enable row subtotal split”. Let me enable this and disable both the grand totals.
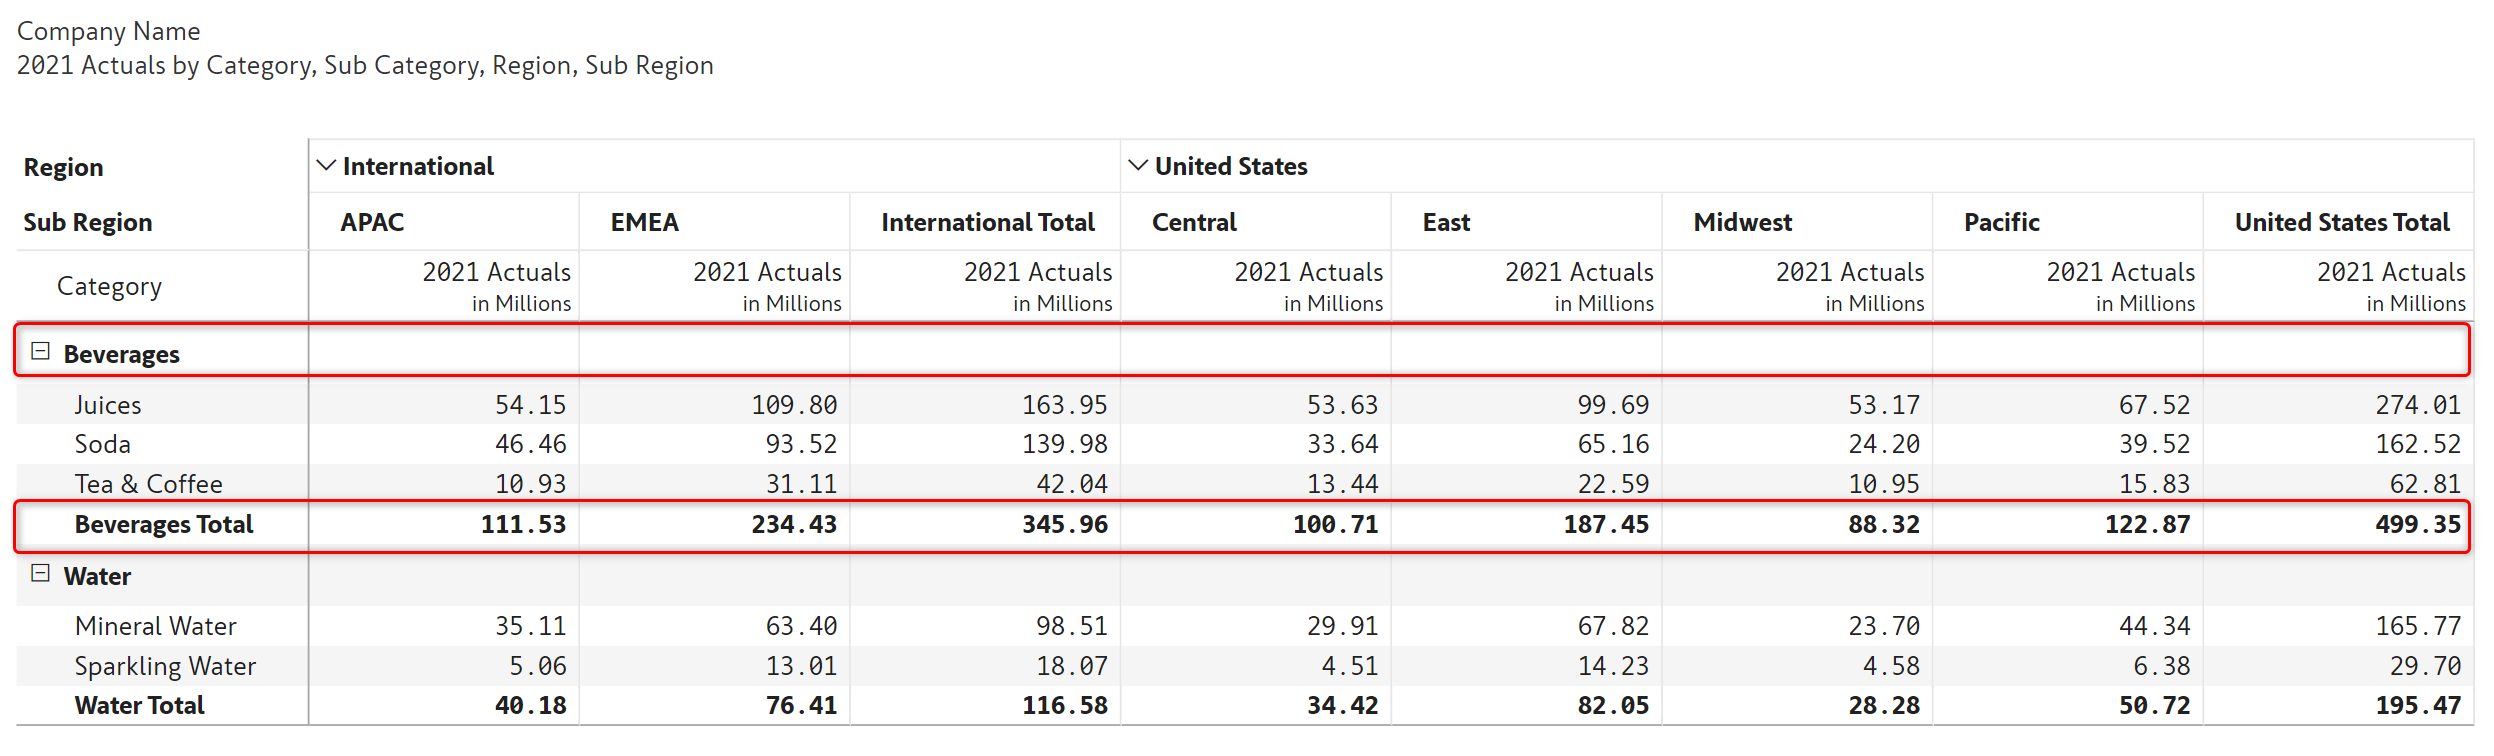
Let us now look at Beverages. There is a header row with no values, followed by a set of records. At the end of this section, the records are totaled. This is the ‘split subtotal’ option. We decided to include this option in Inforiver as this format is commonly used in spreadsheets.
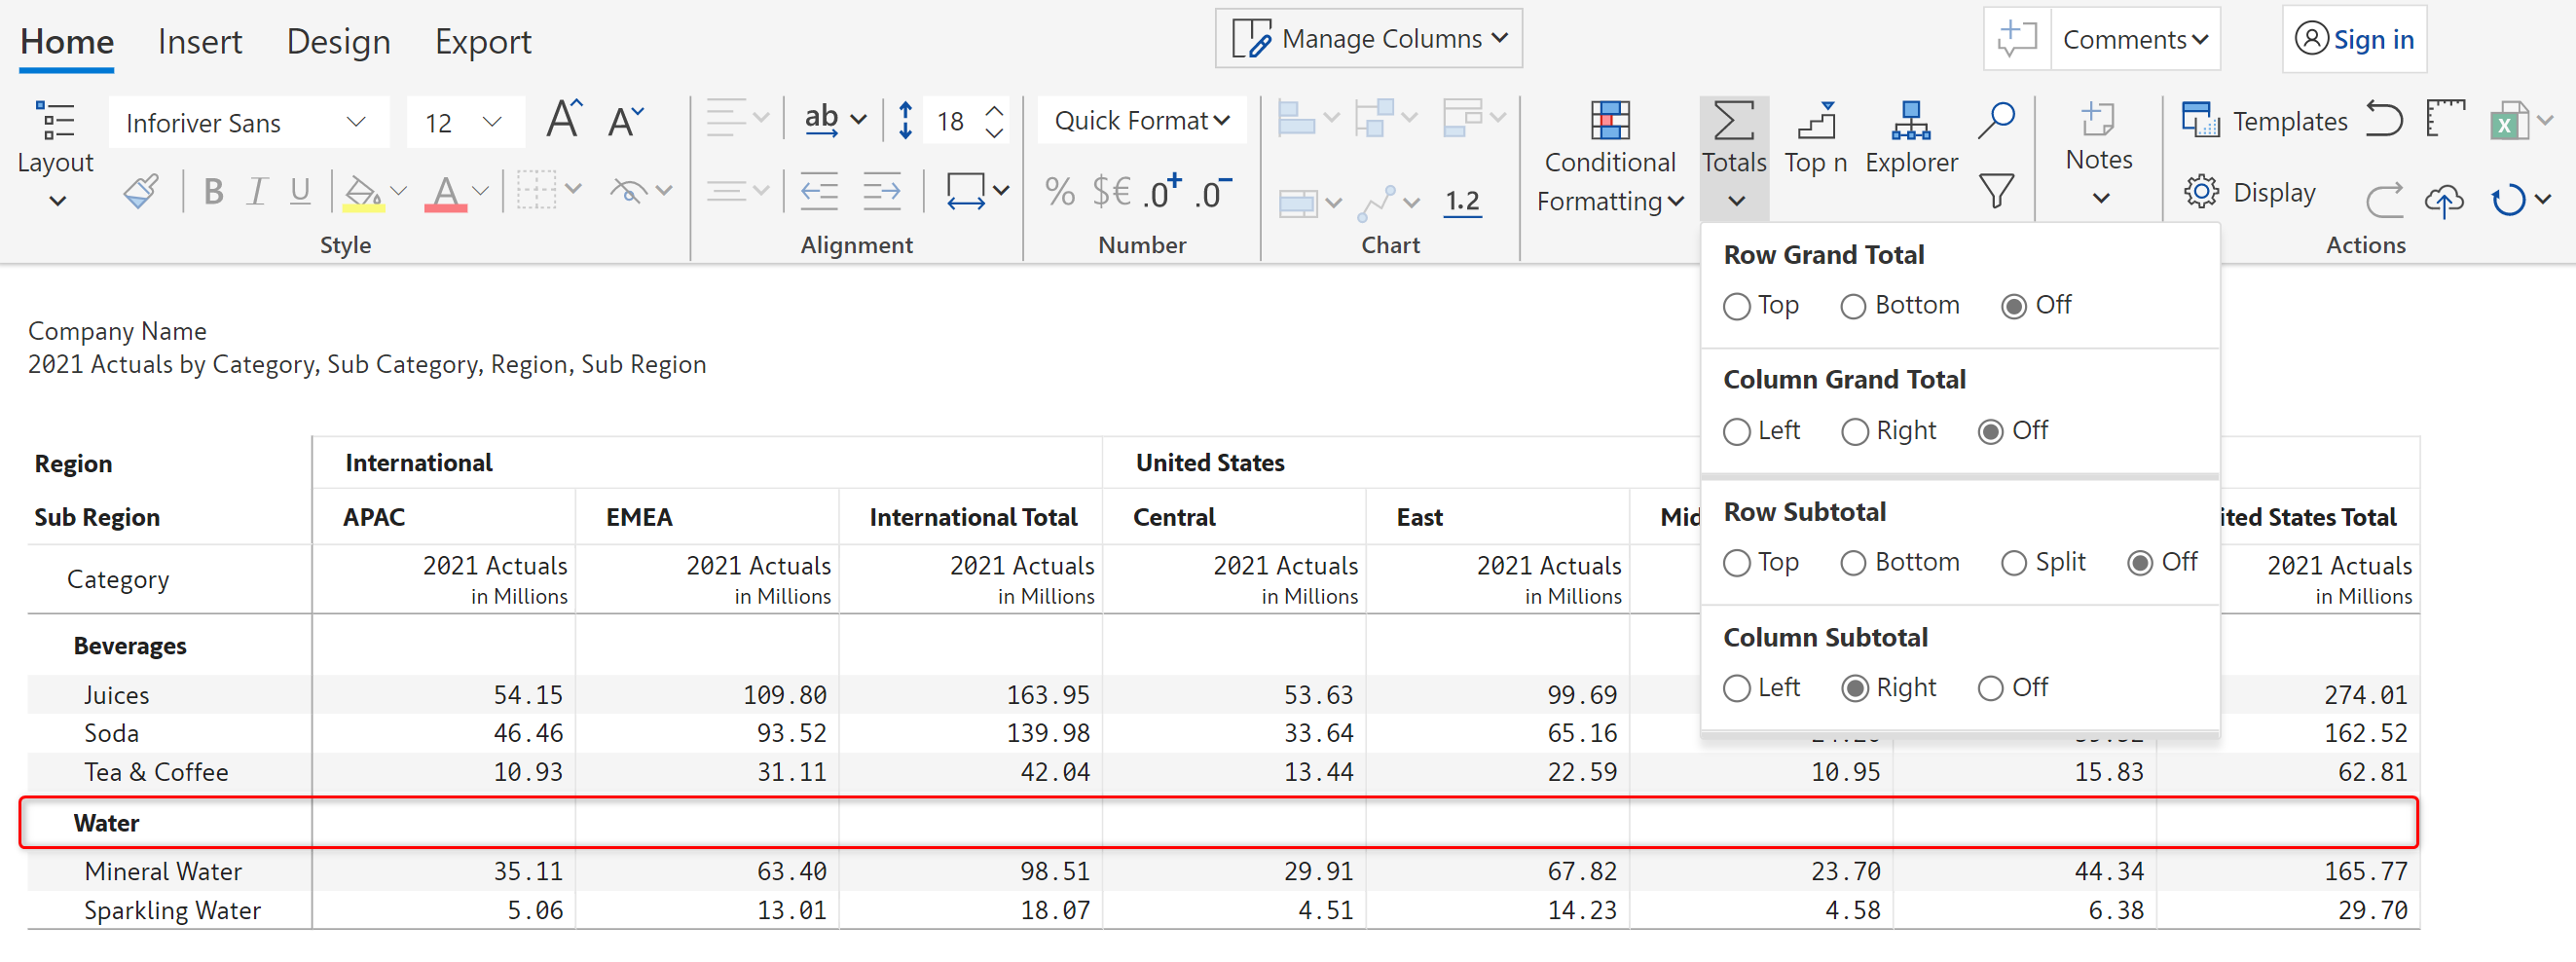
And finally, the options explored above also allow you to create interesting patterns as shown below – where records are just grouped – with no subtotals. (Hint: Disable split subtotals AND turn off row subtotals).
In summary, Inforiver allows you to manage row & column subtotals & grand totals the way you want in an intuitive & flexible manner. These methods work for both flat tables & hierarchies.
Learn more about Inforiver's reporting capabilities.

Inforiver helps enterprises consolidate planning, reporting & analytics on a single platform (Power BI). The no-code, self-service award-winning platform has been recognized as the industry’s best and is adopted by many Fortune 100 firms.
Inforiver is a product of Lumel, the #1 Power BI AppSource Partner. The firm serves over 3,000 customers worldwide through its portfolio of products offered under the brands Inforiver, EDITable, ValQ, and xViz.