Inforiver

Upcoming webinar on 'Inforiver Charts : The fastest way to deliver stories in Power BI', Aug 29th , Monday, 10.30 AM CST.    Register Now
Marimekko Chart

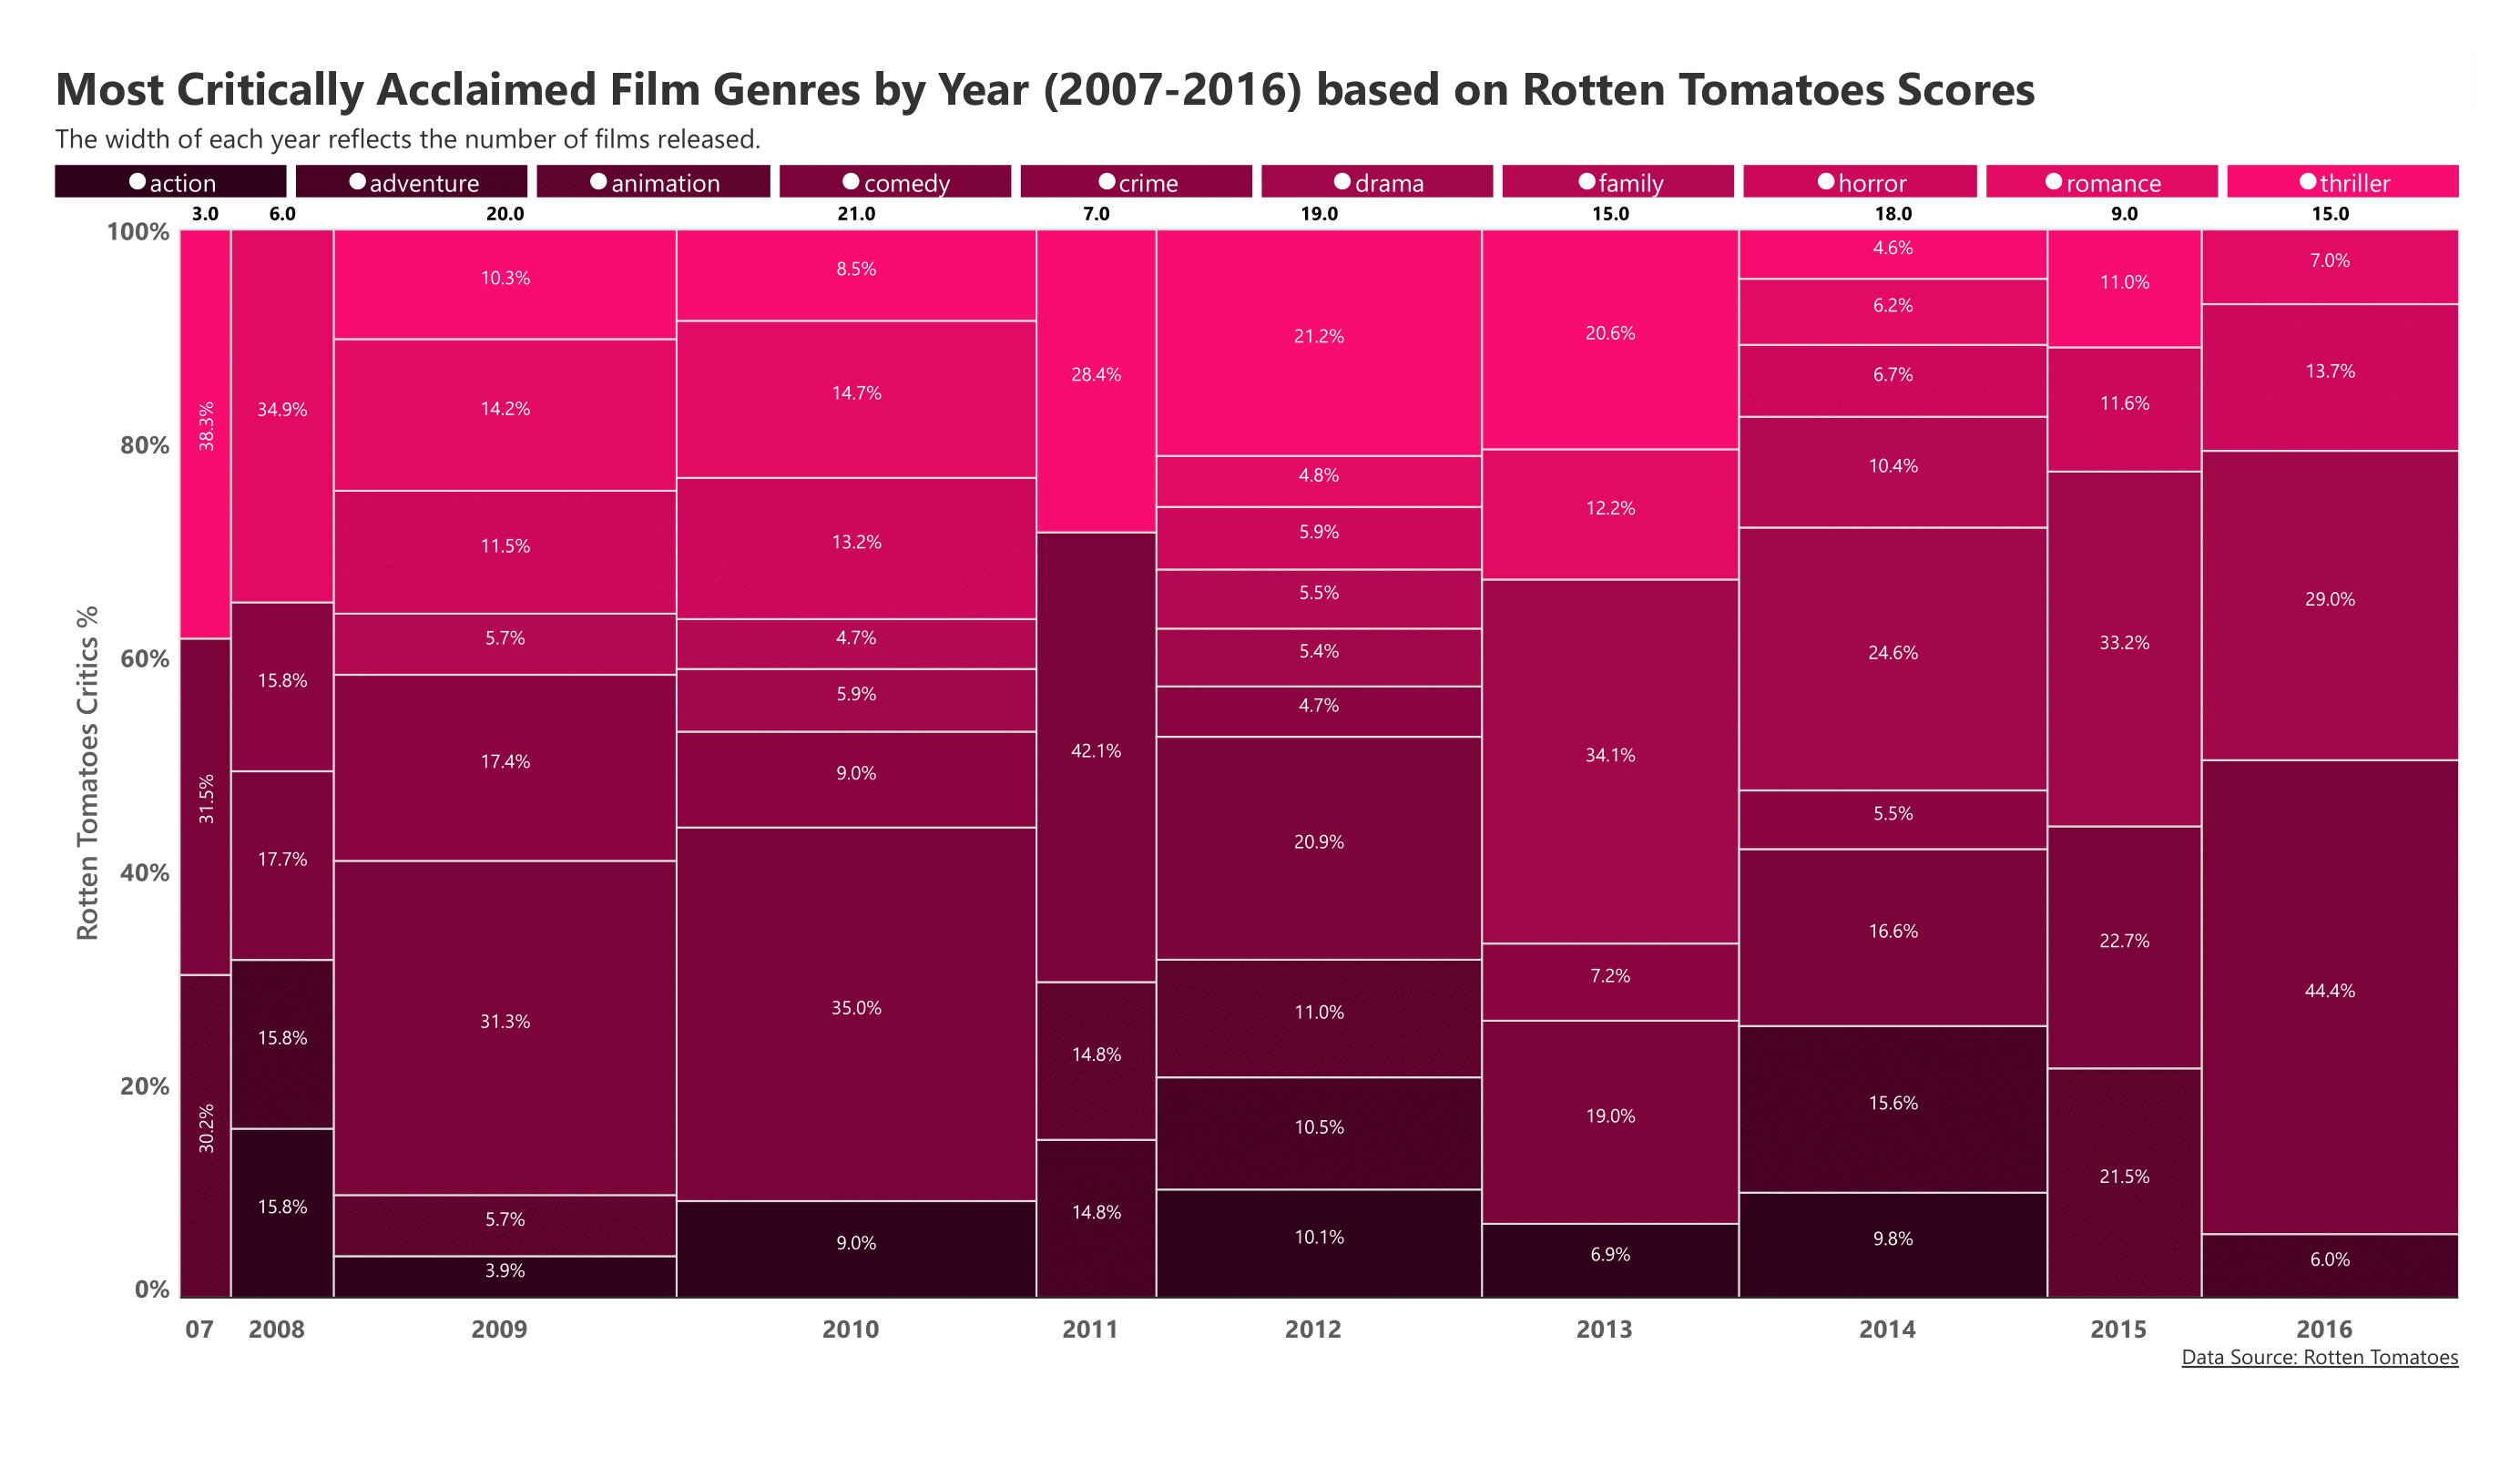
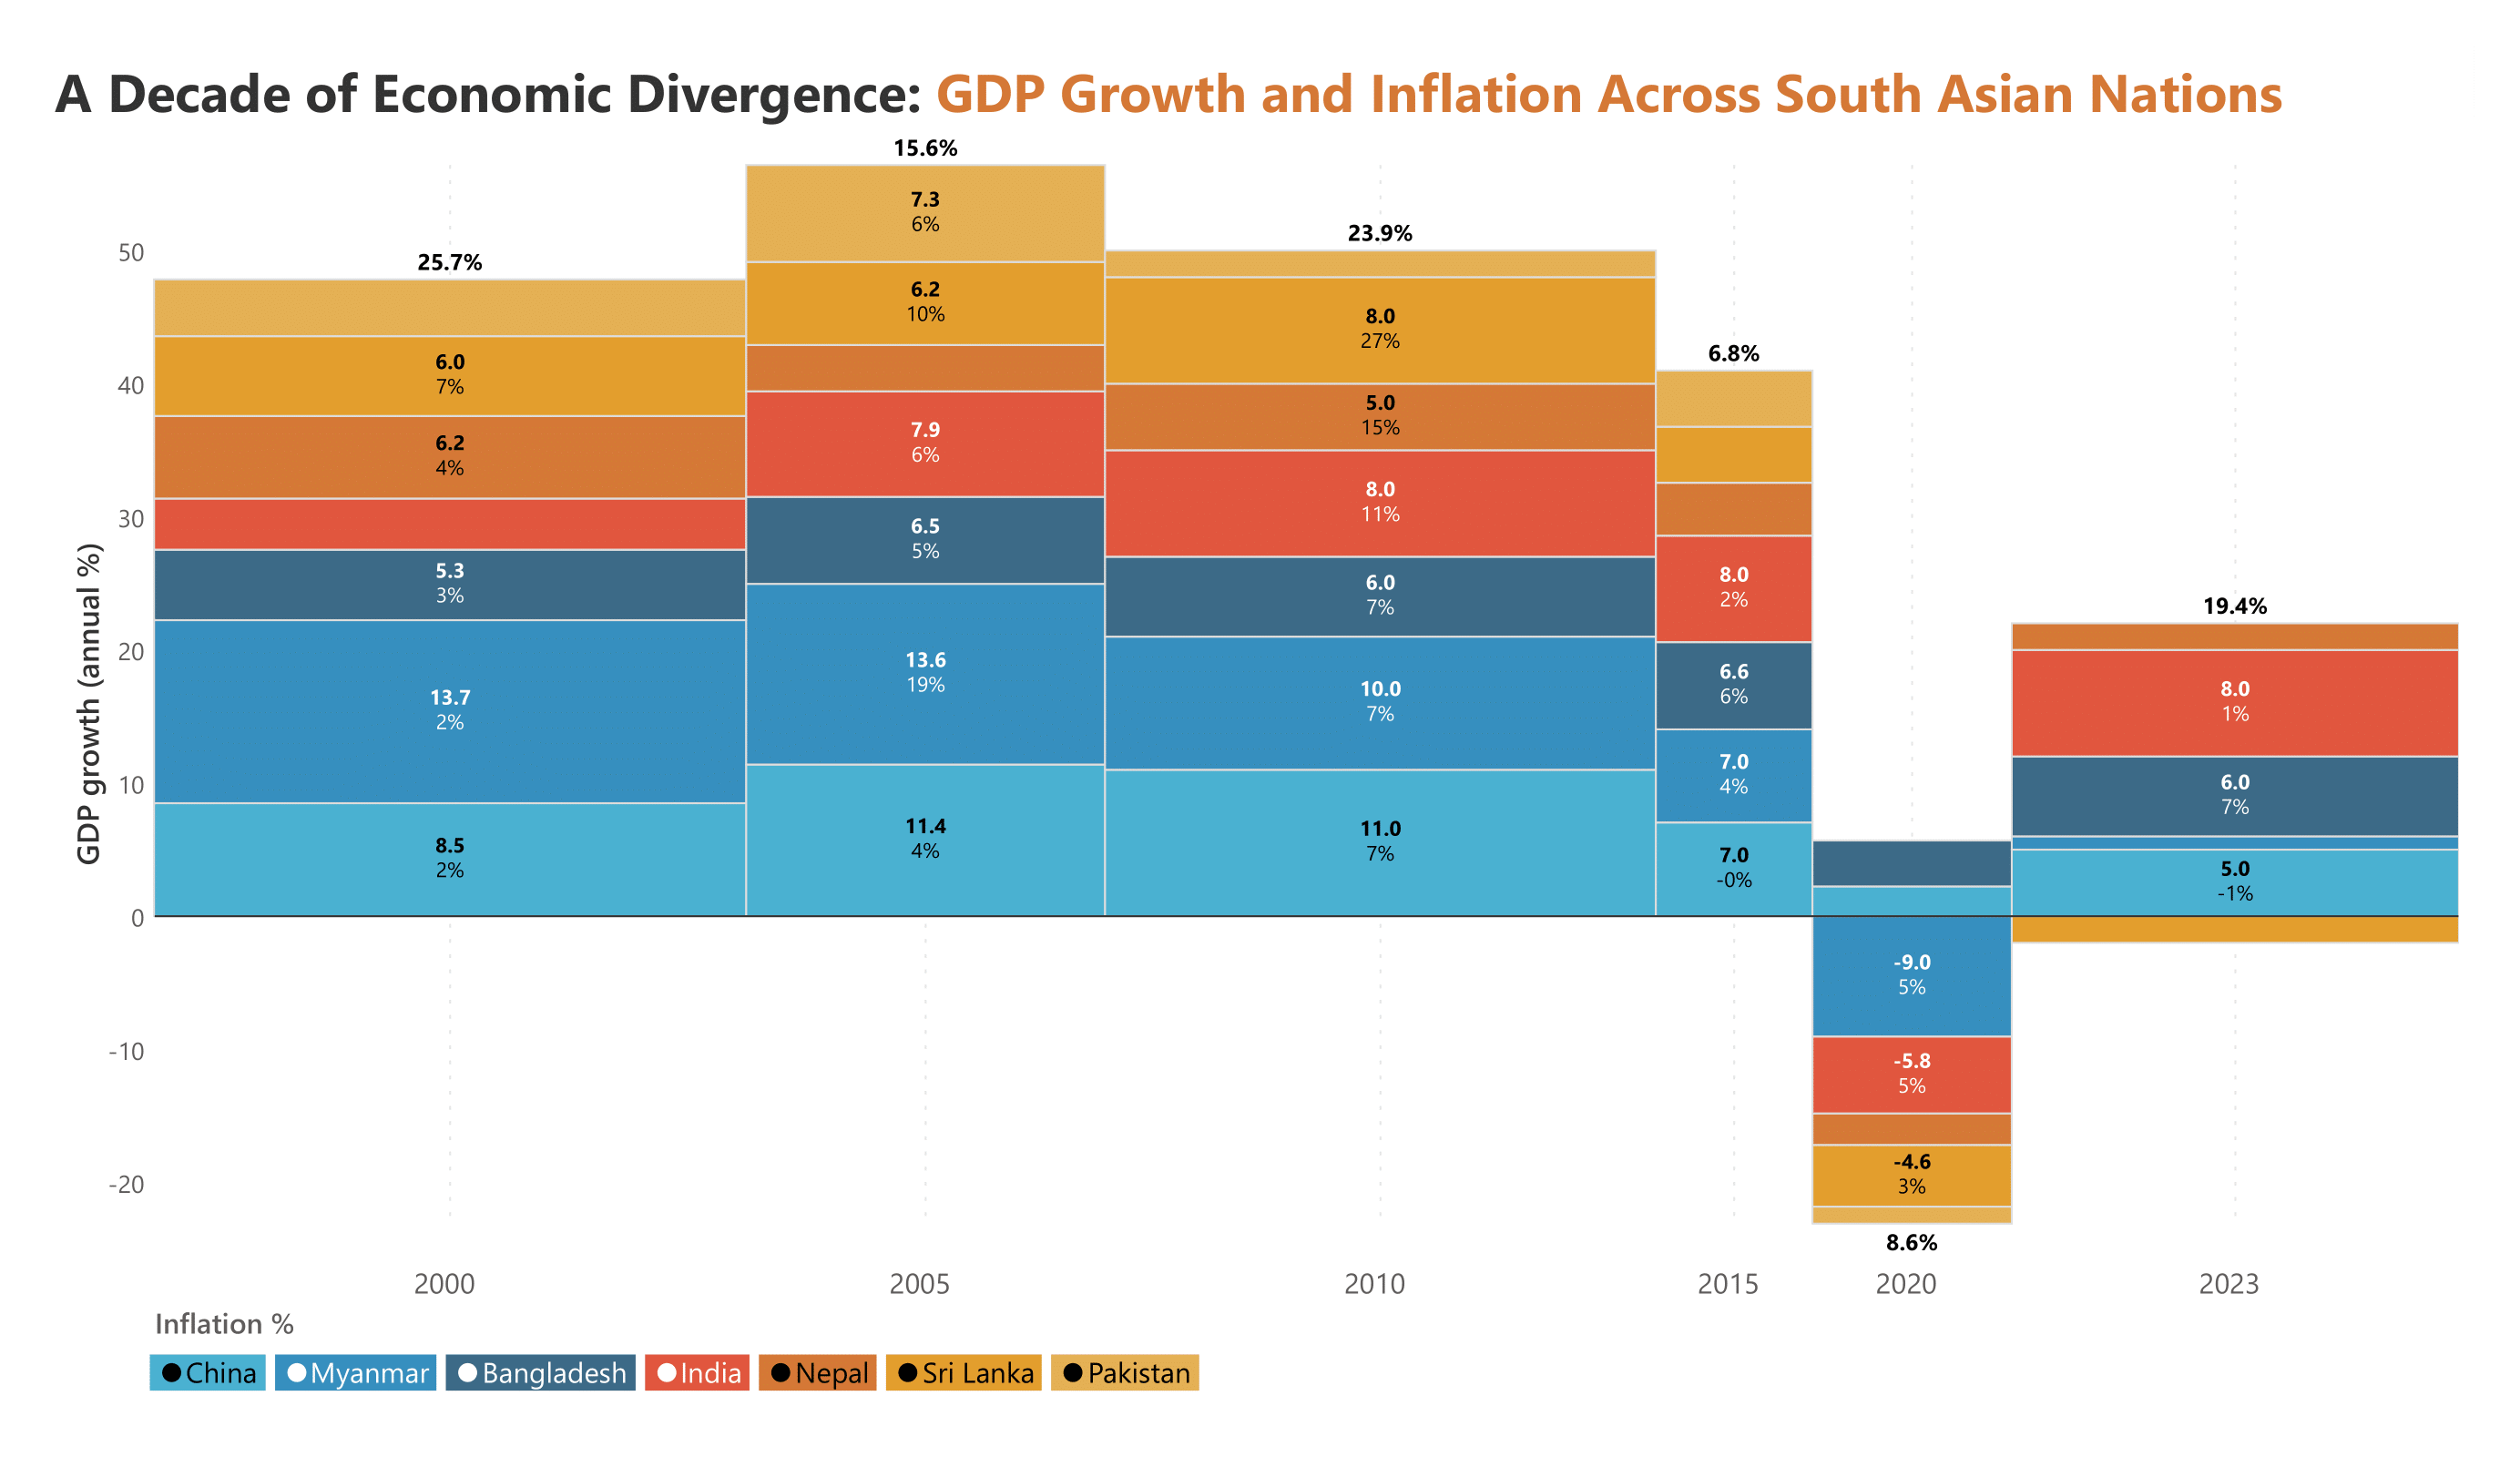
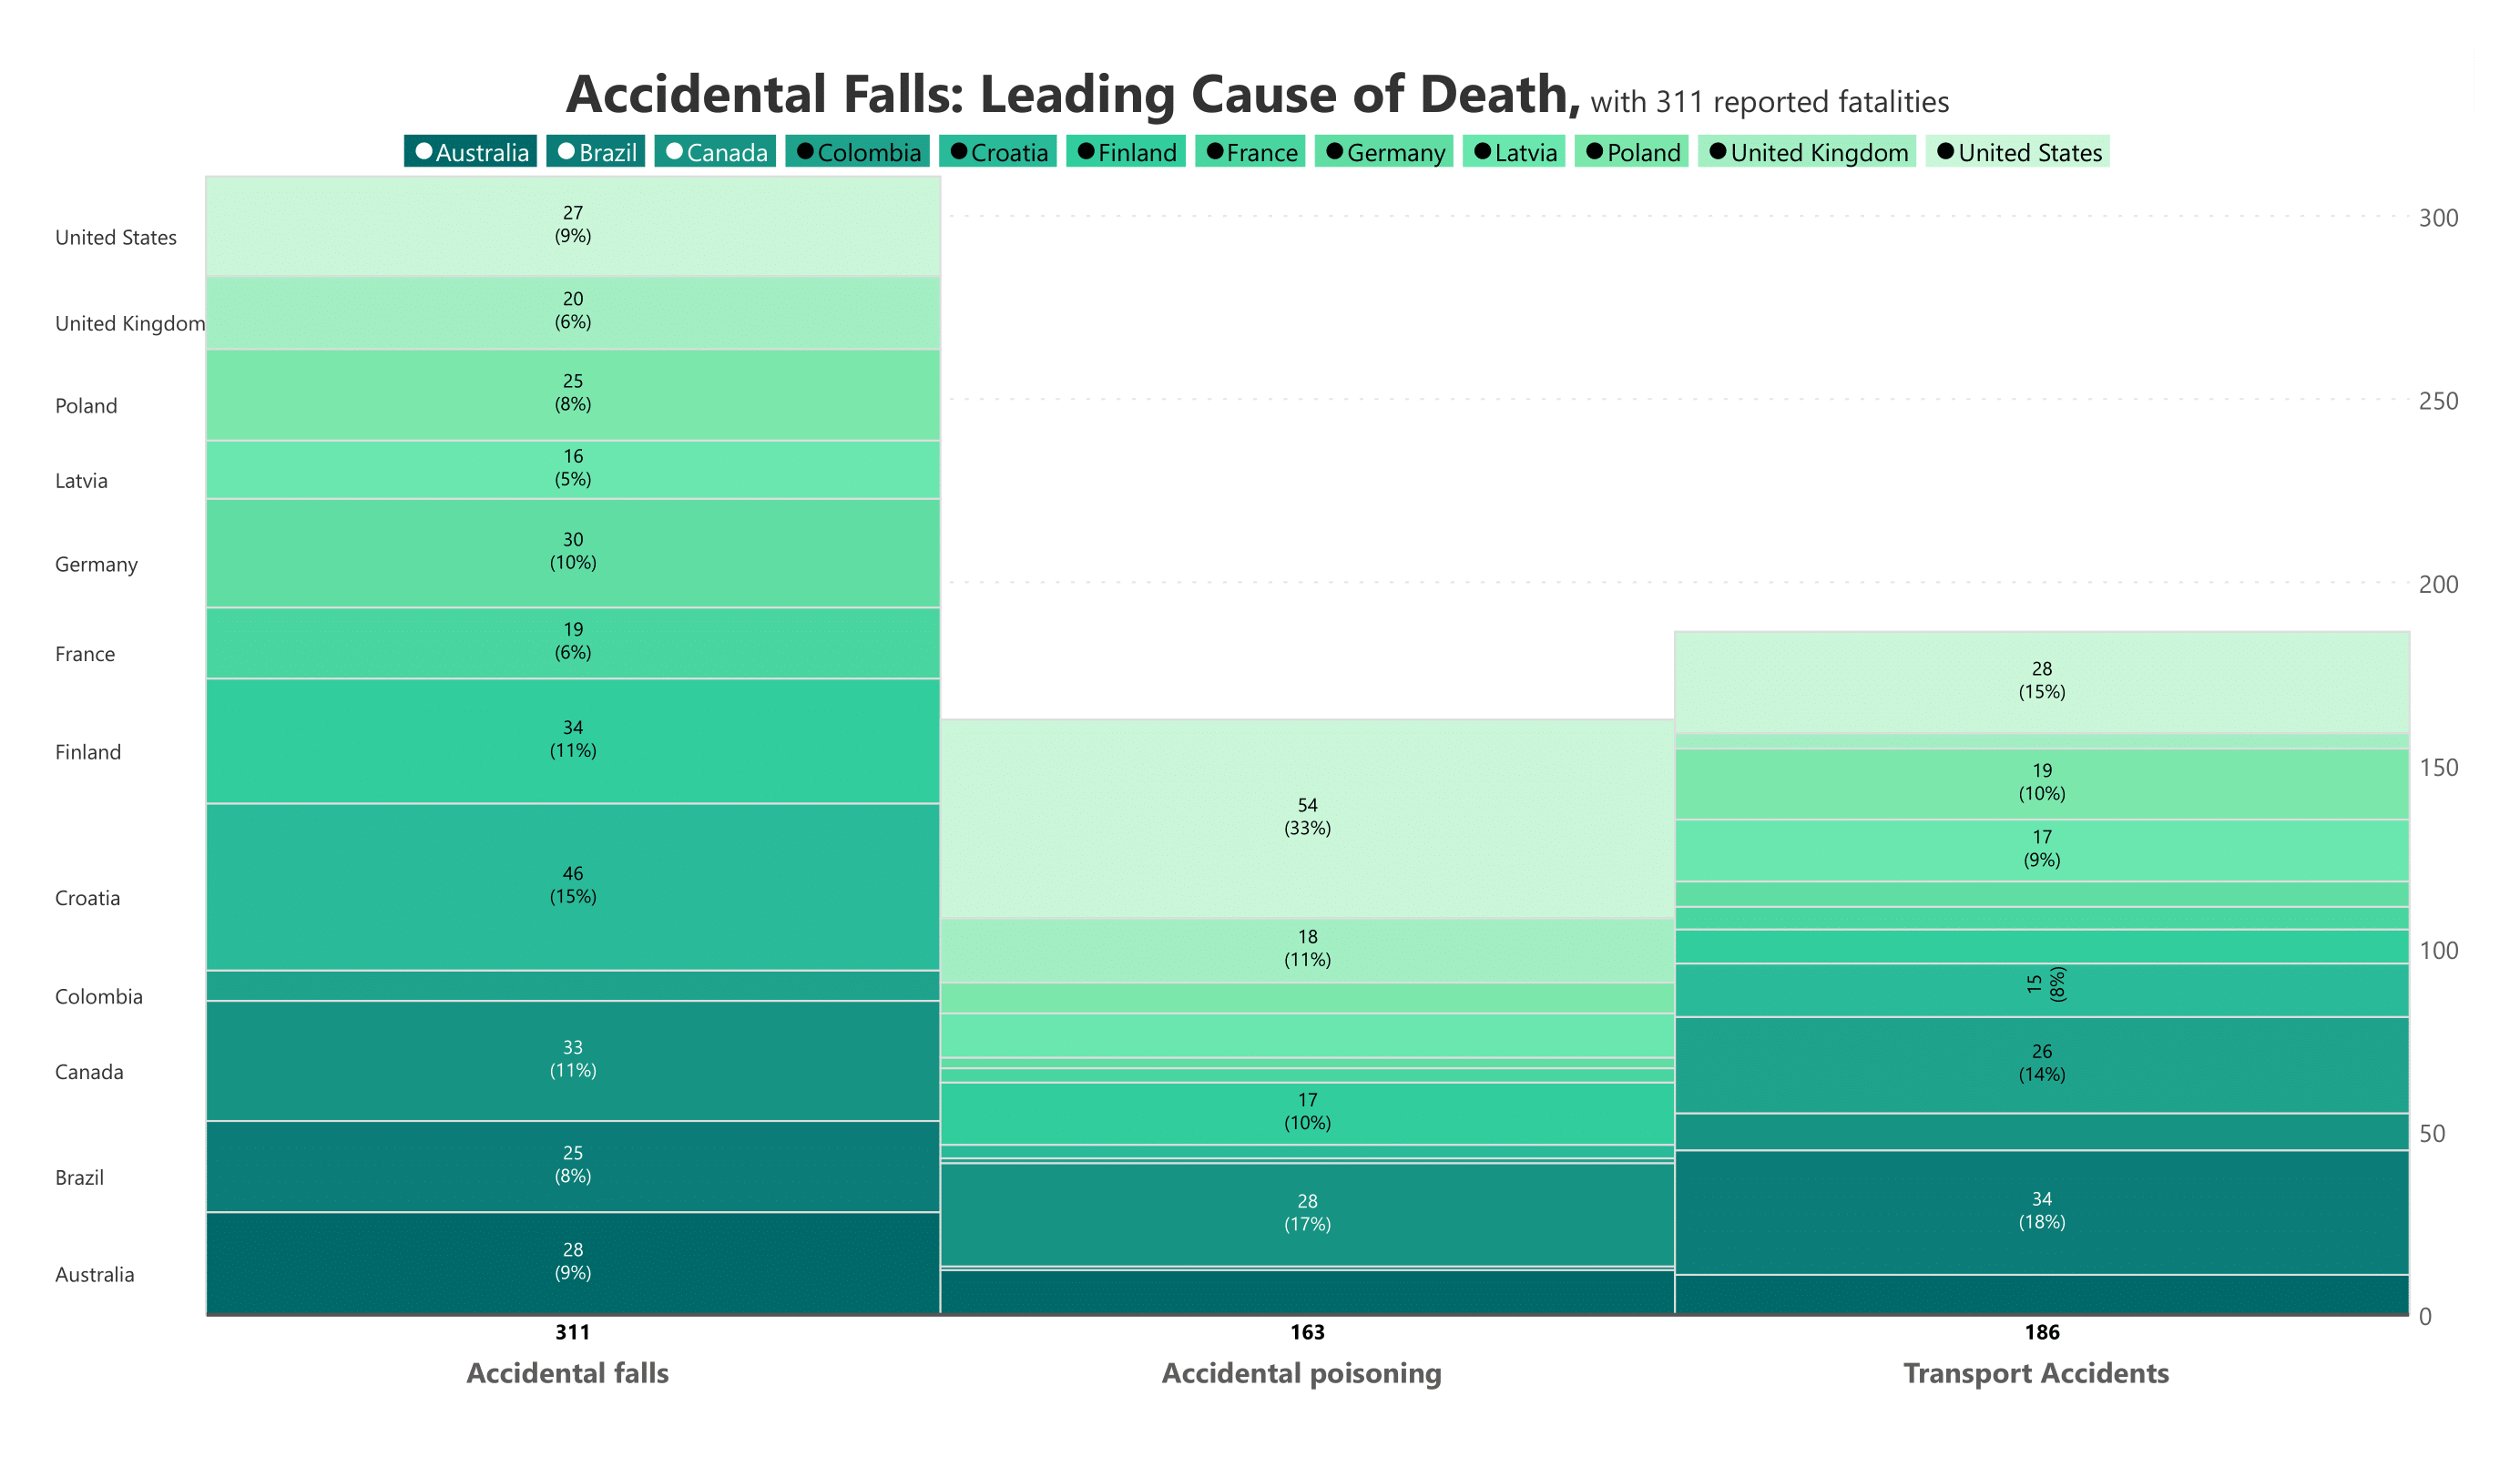
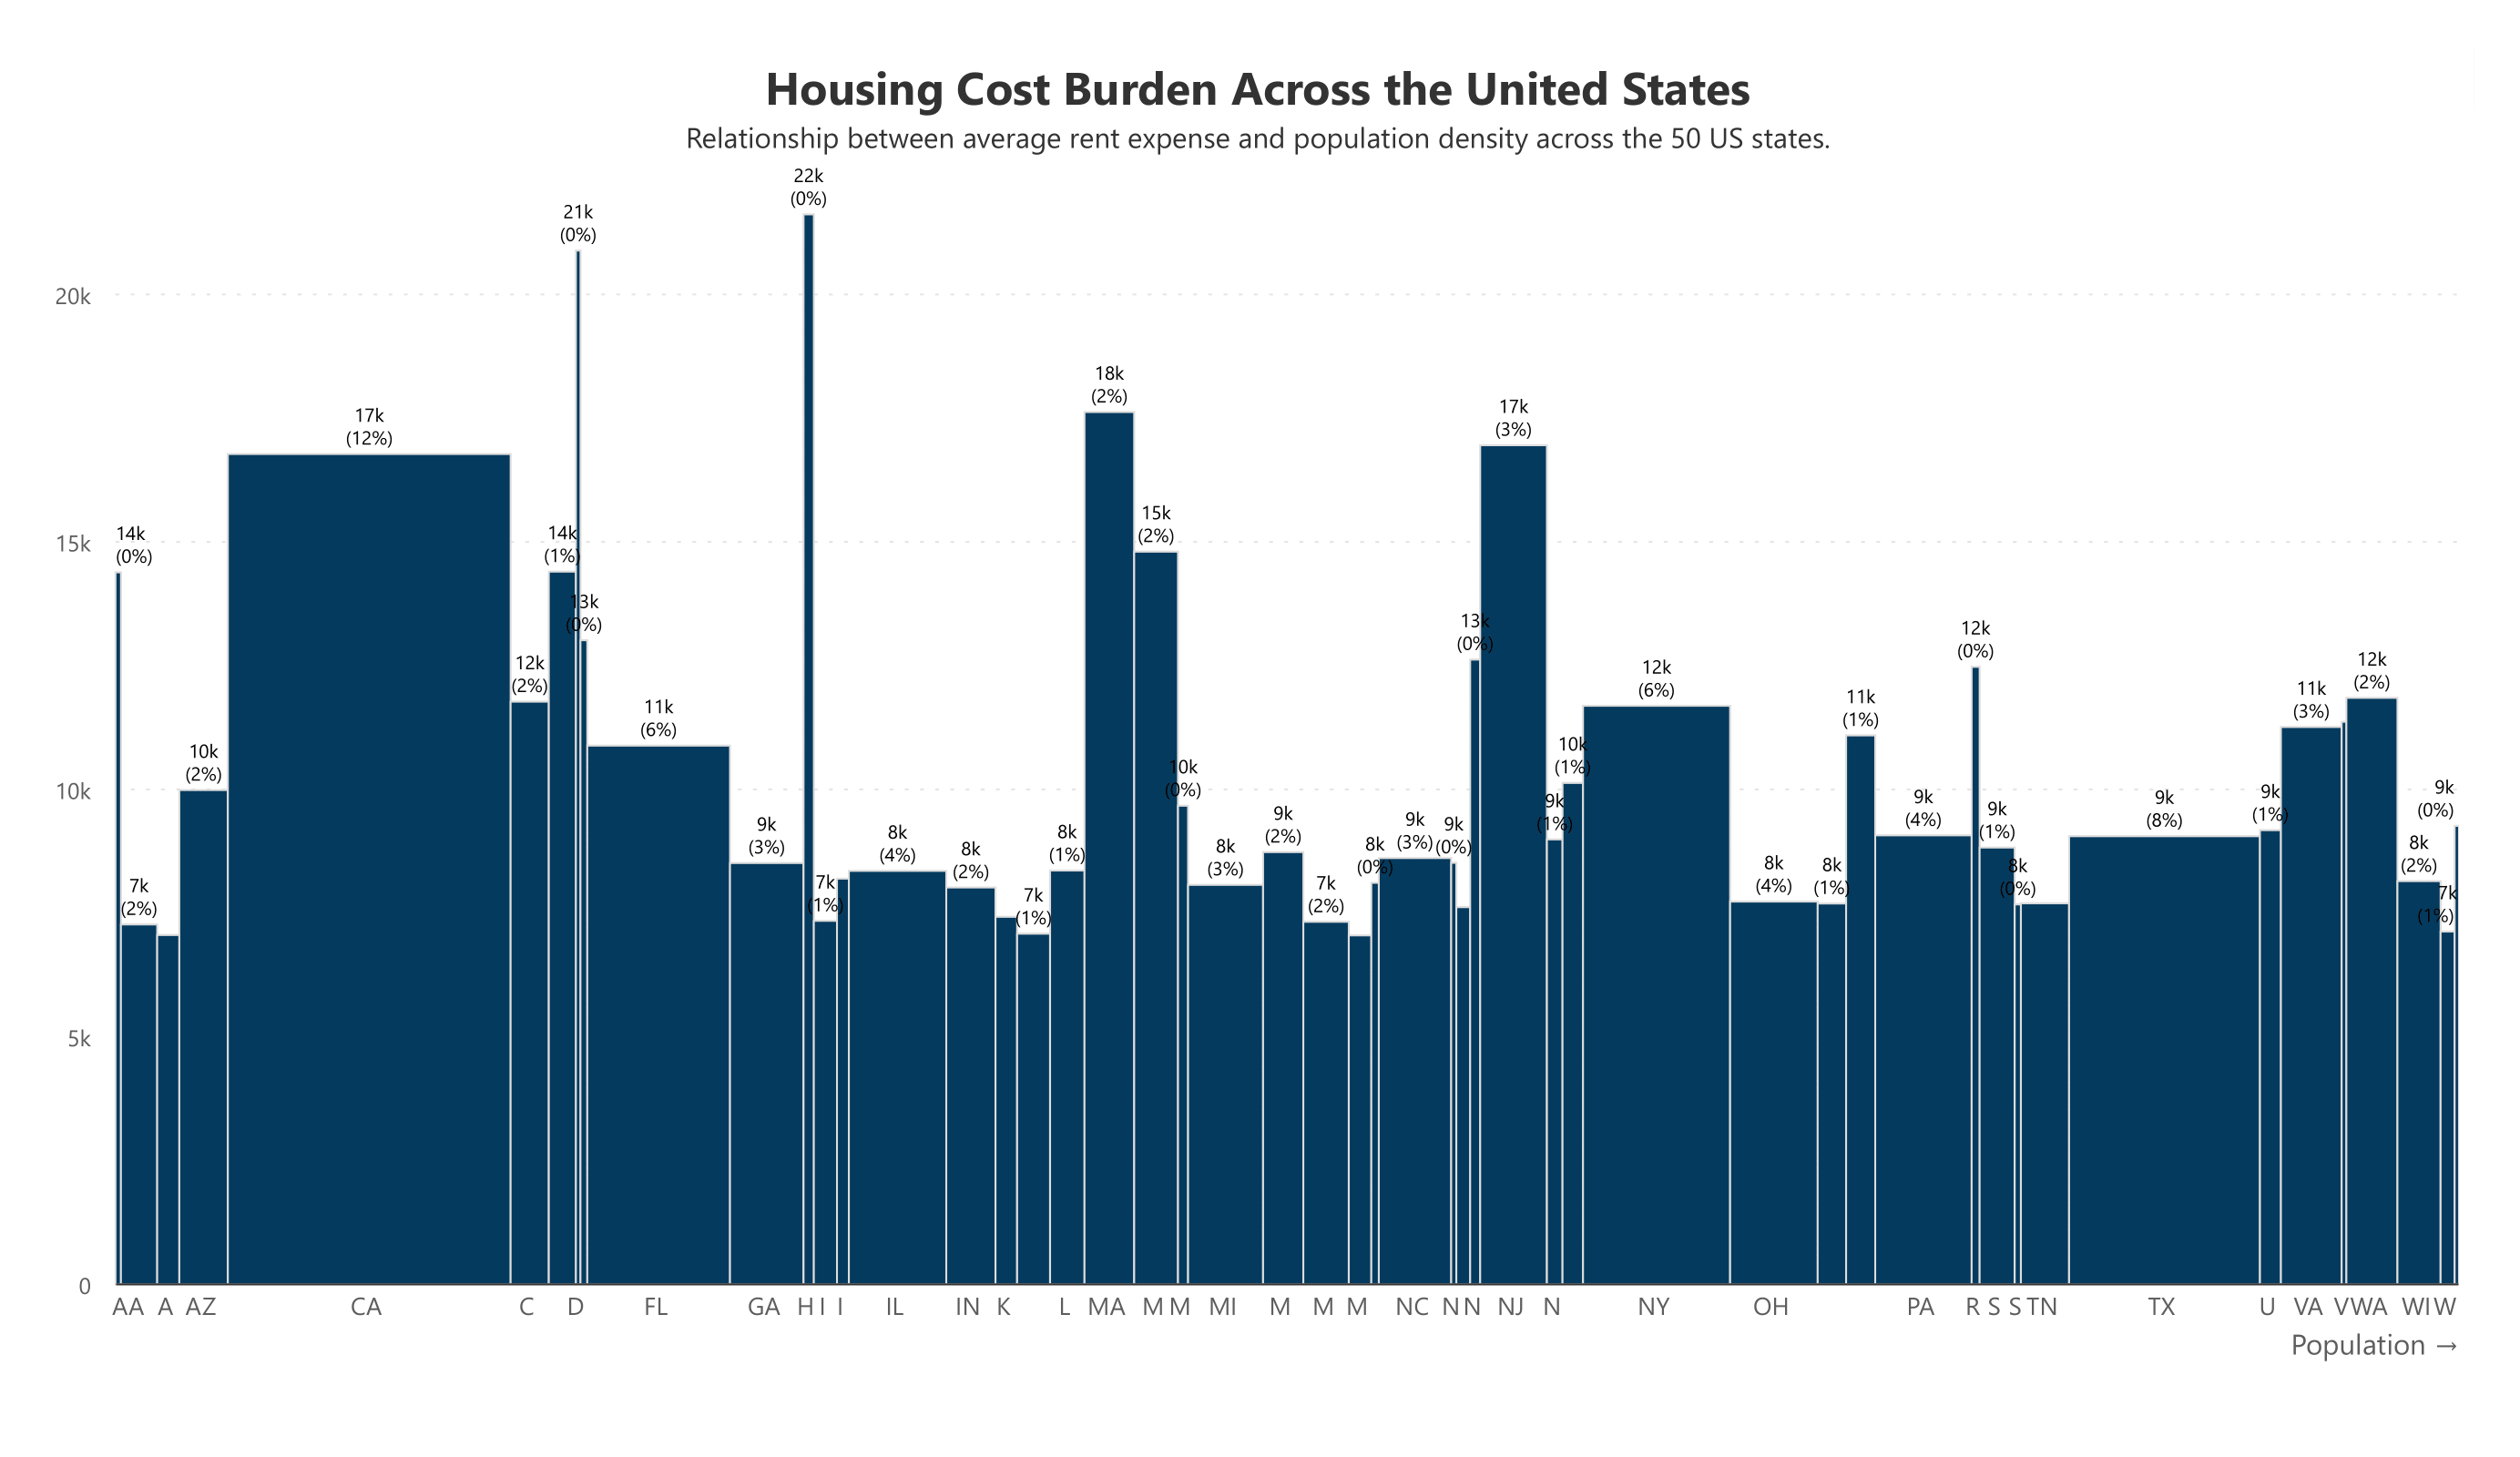
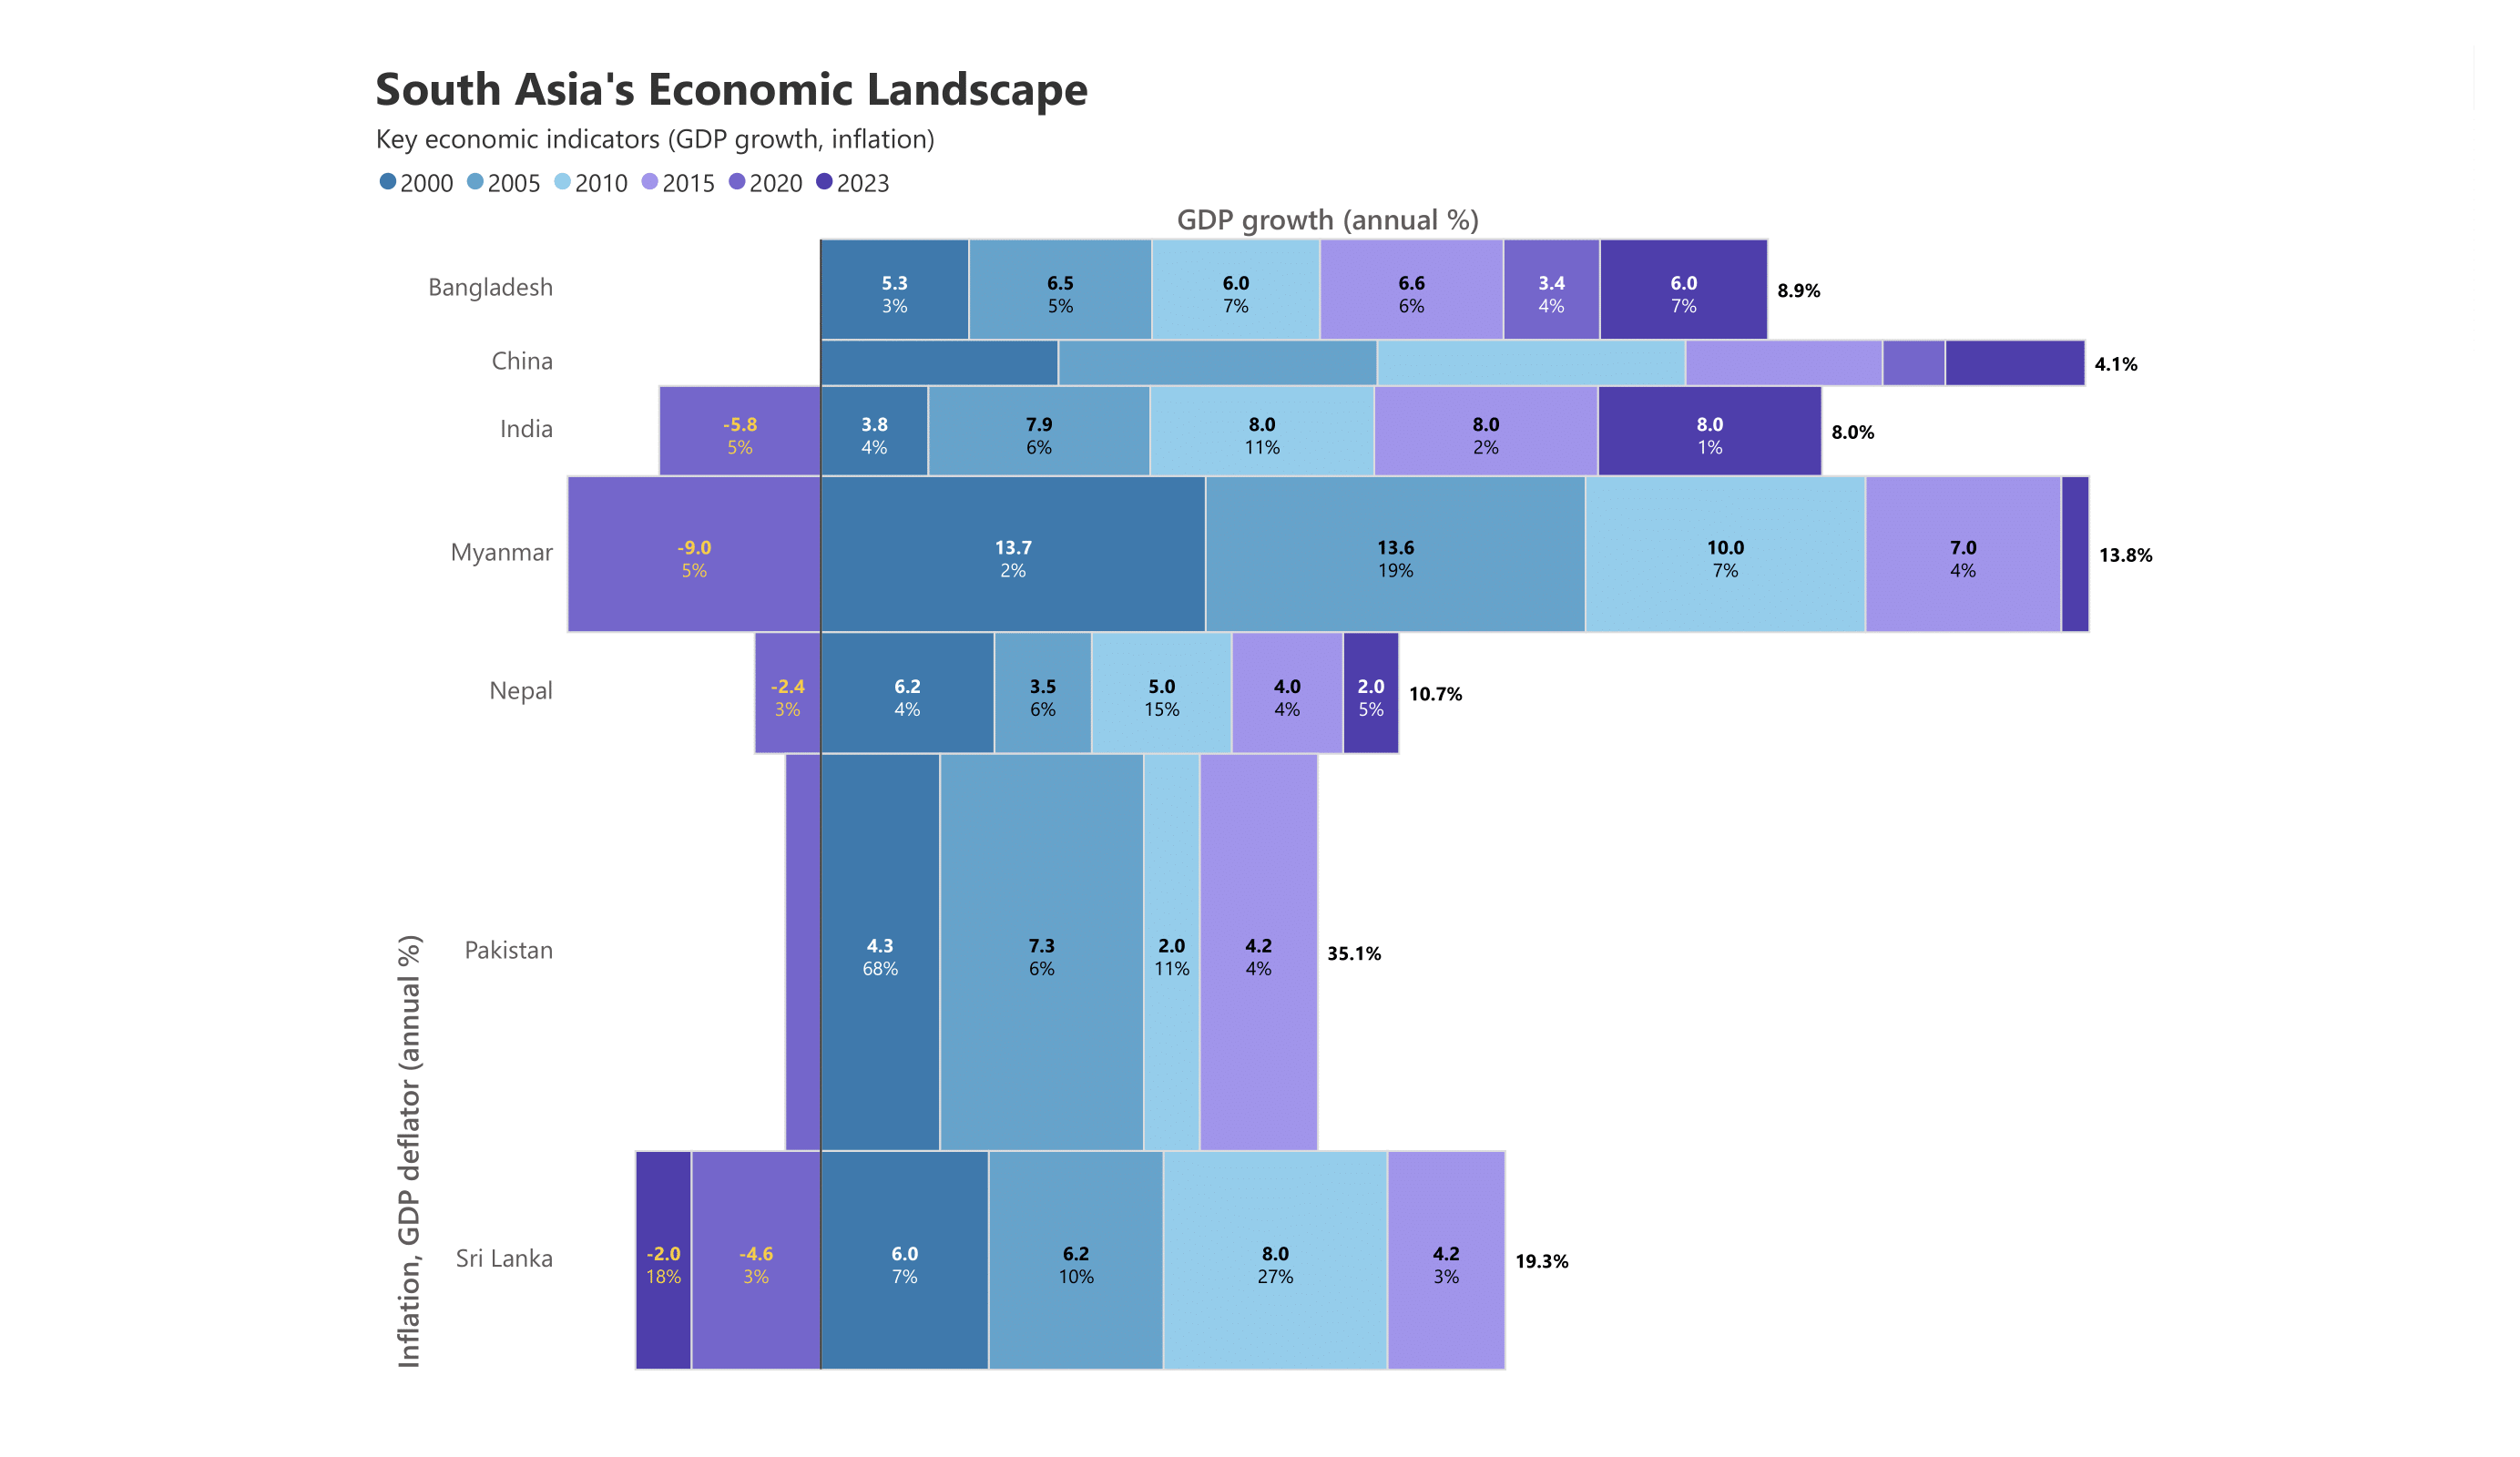
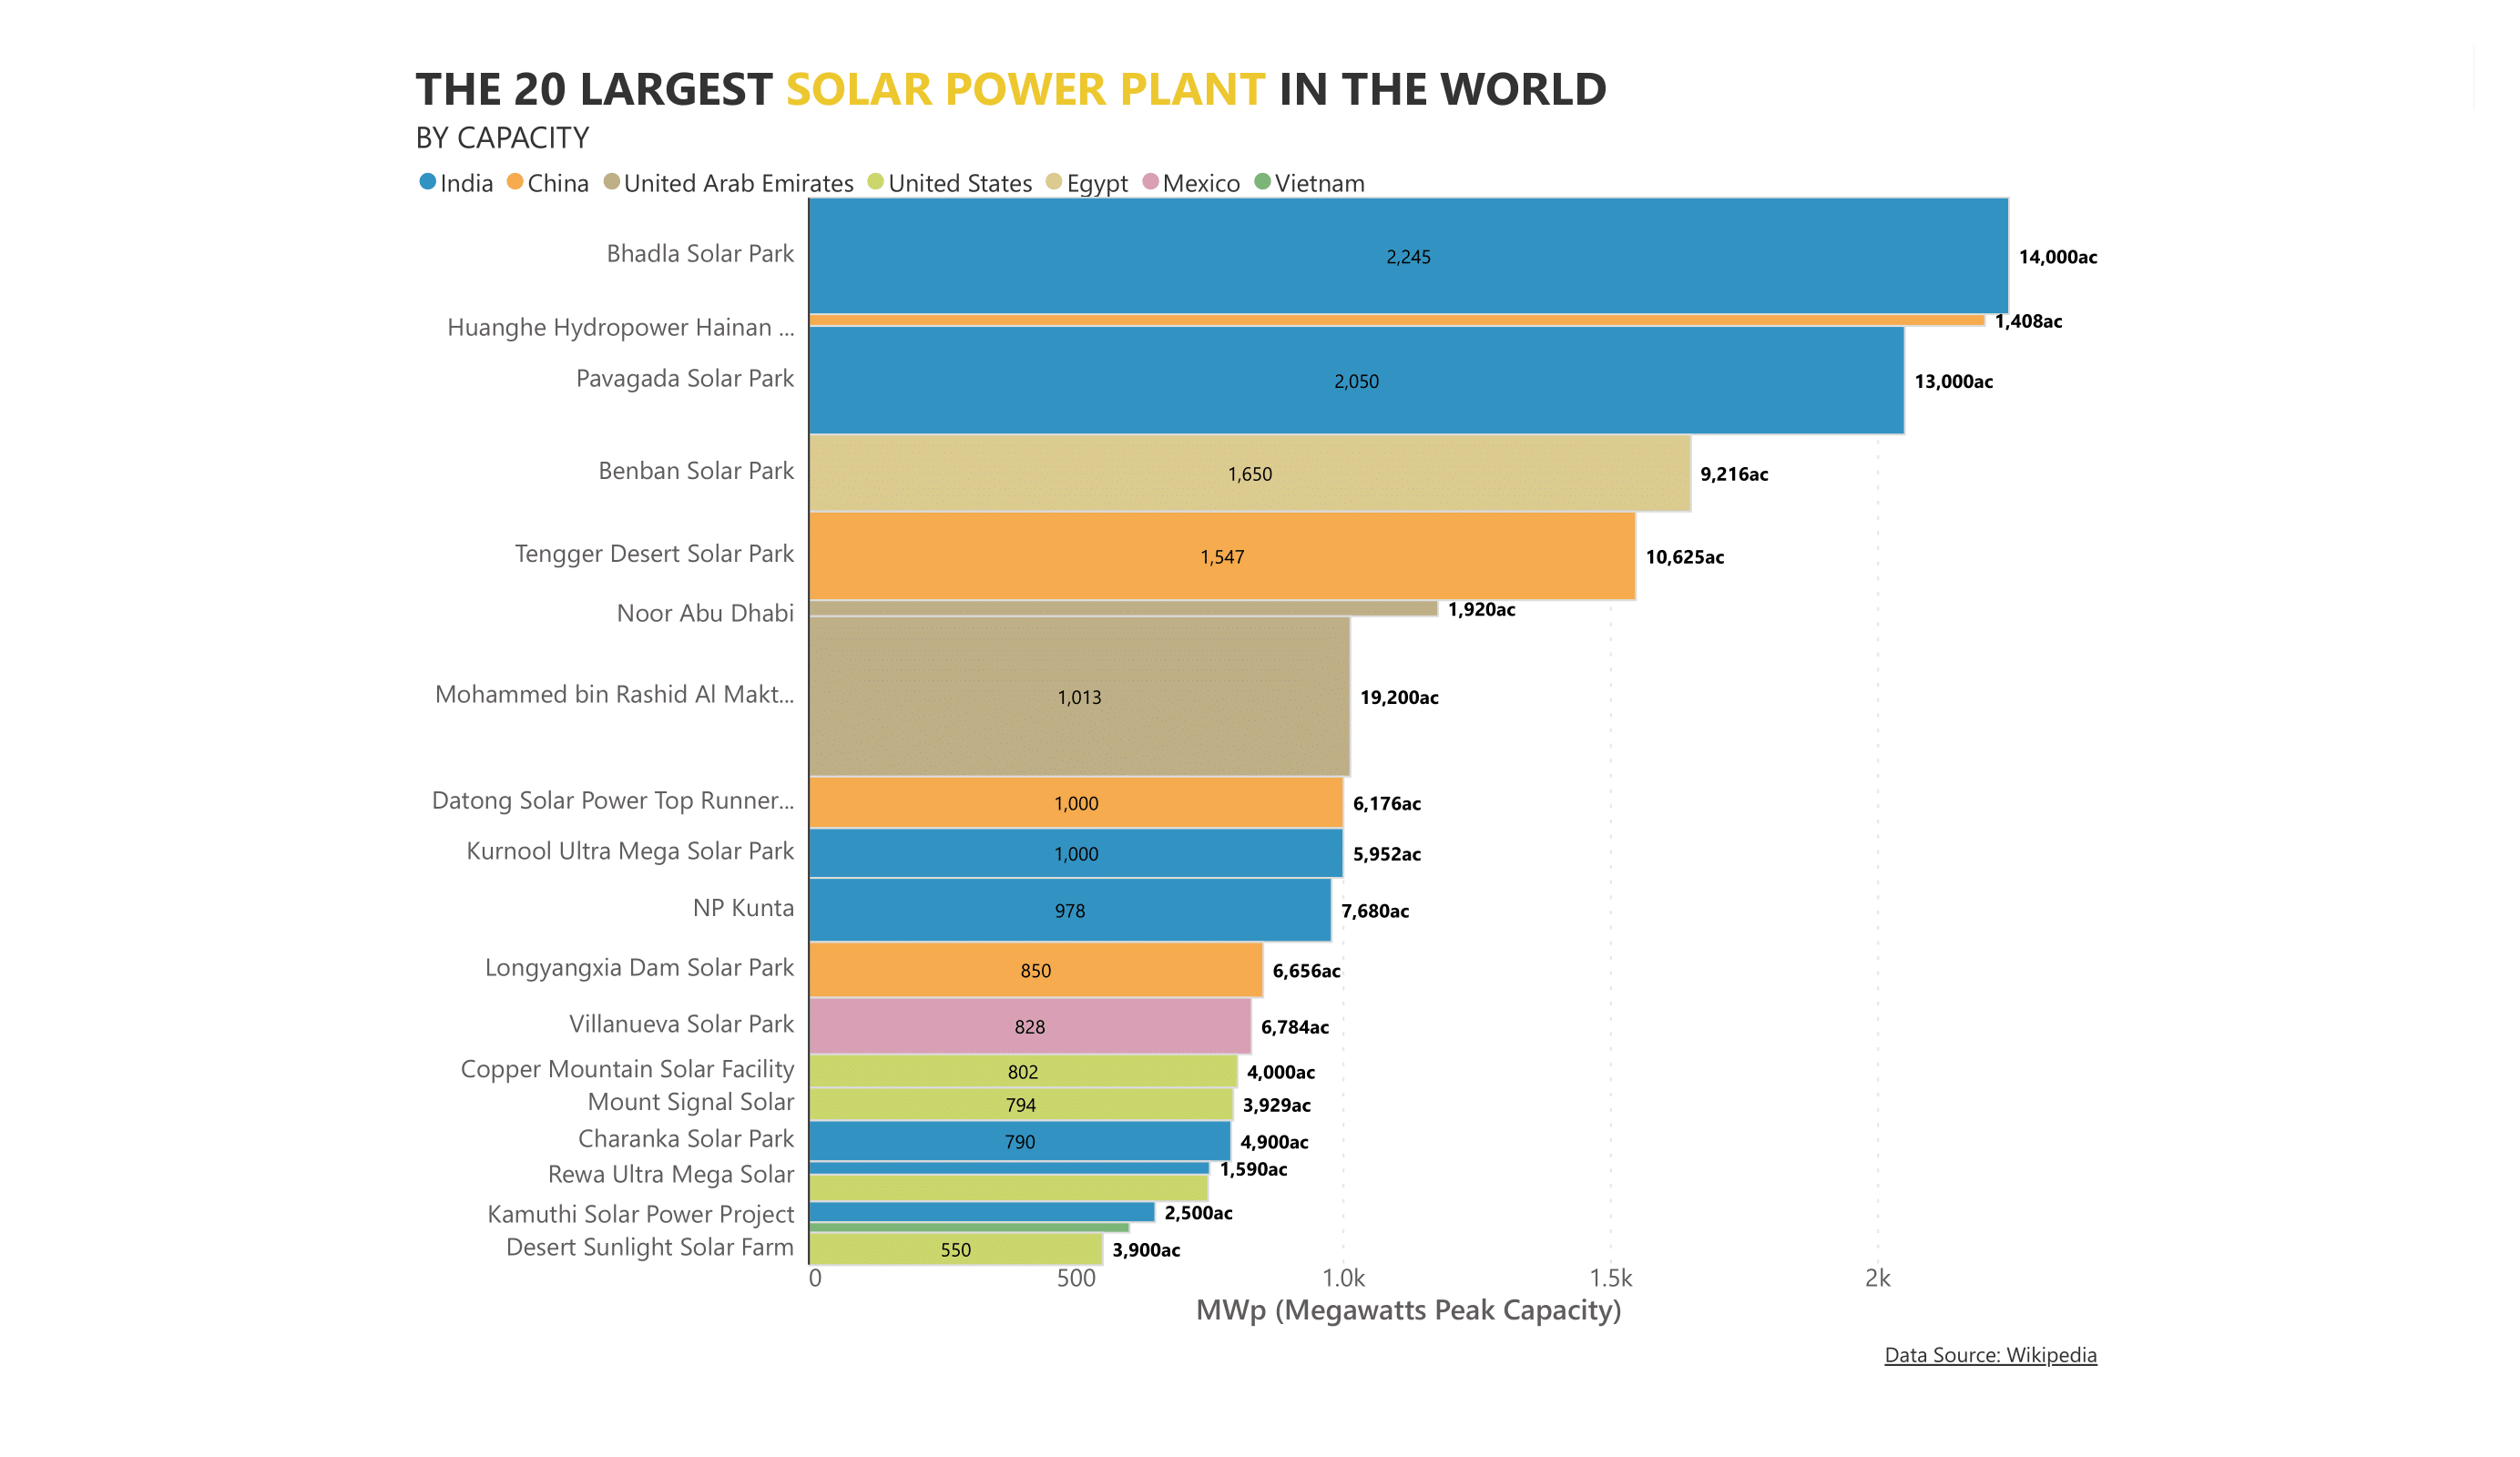
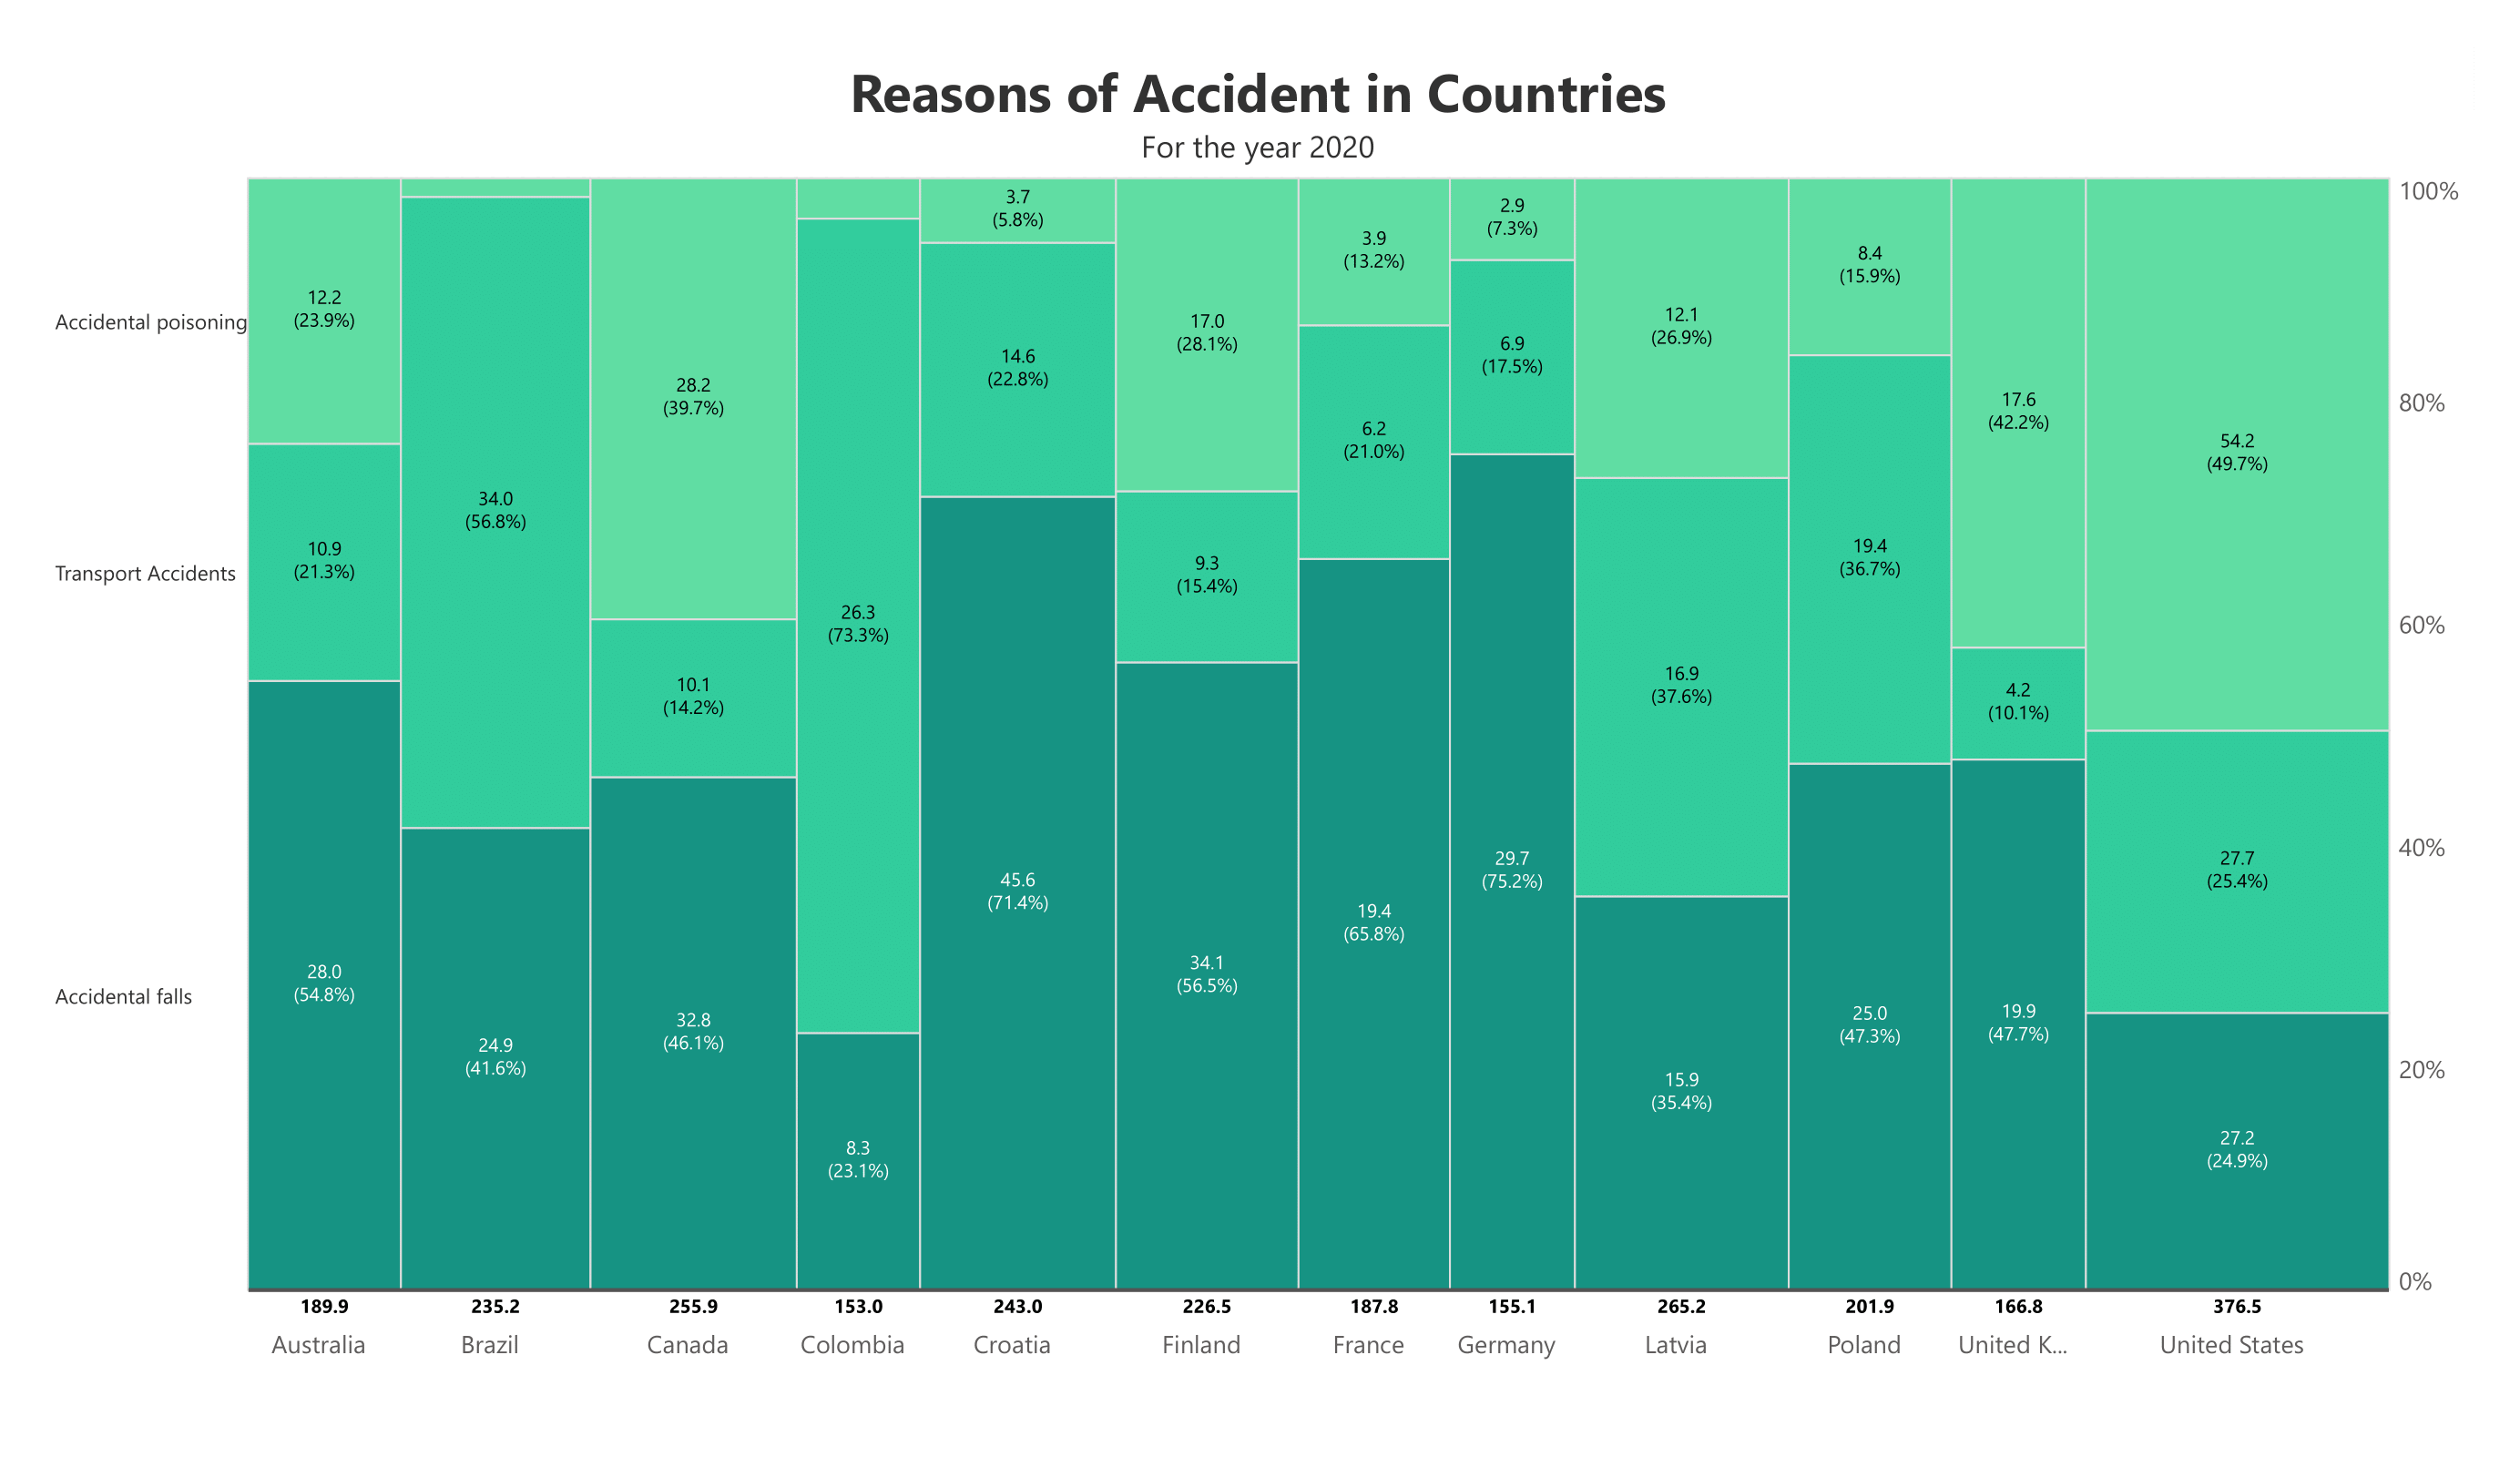
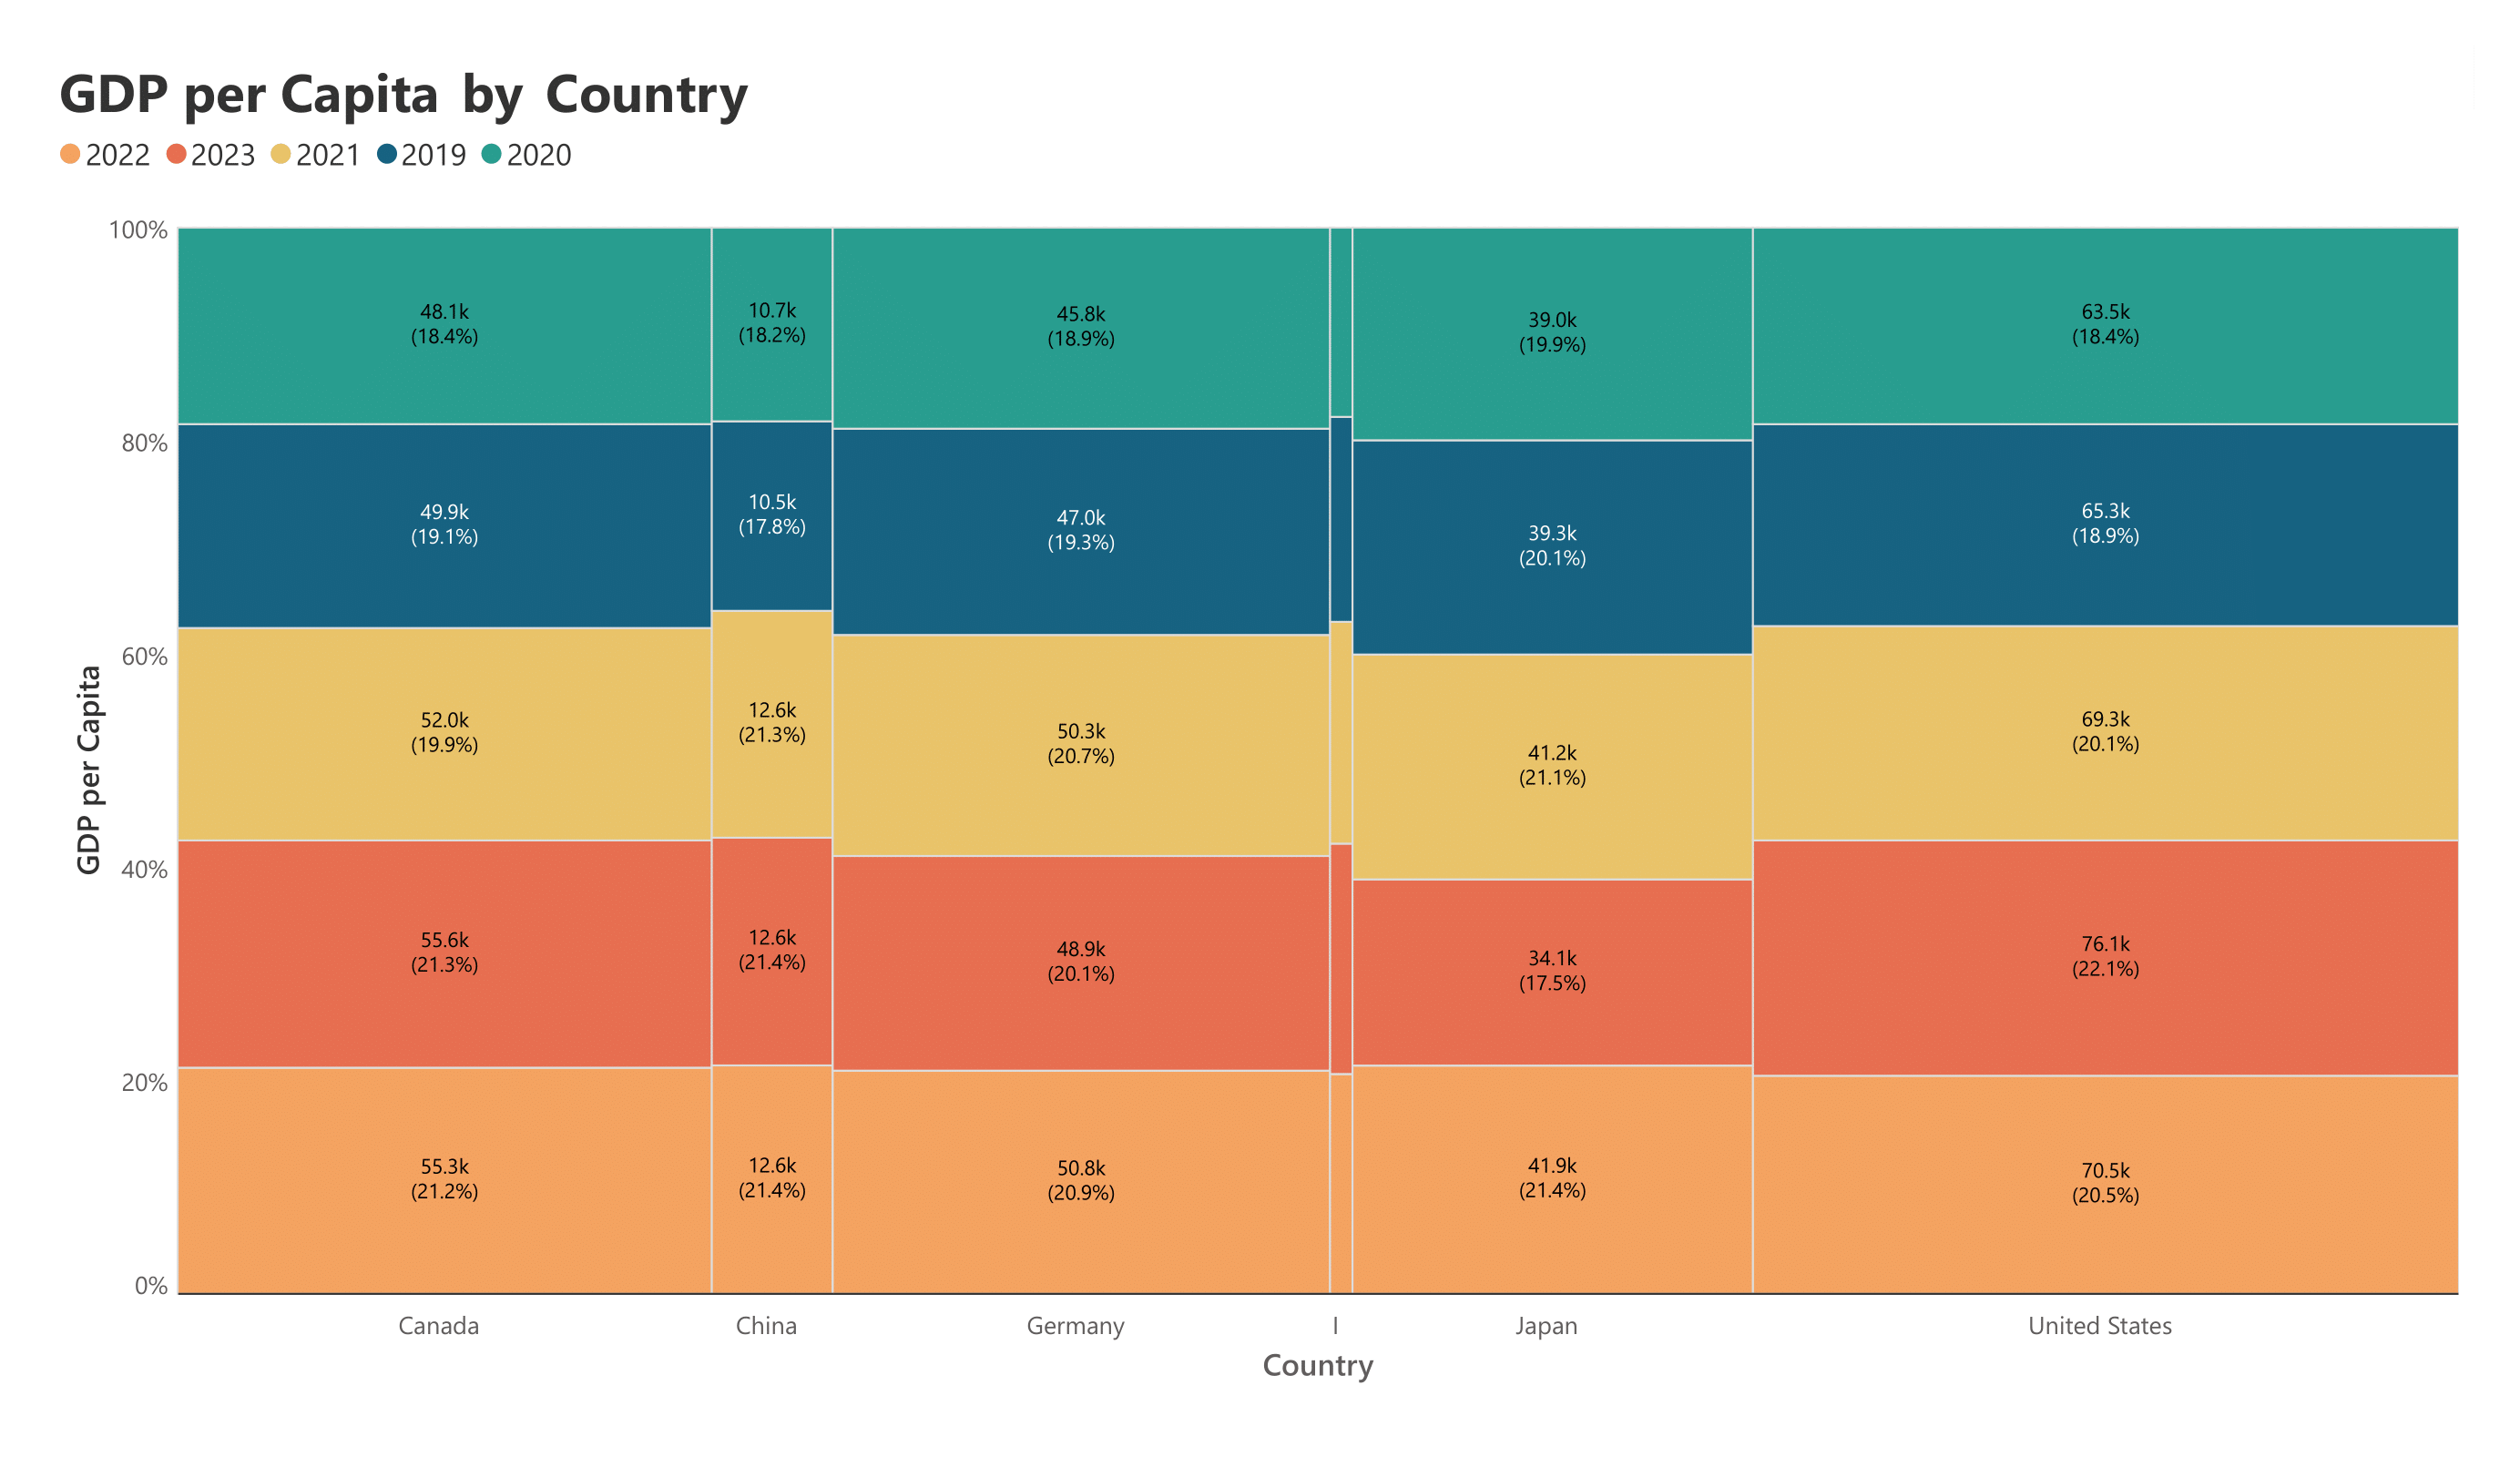
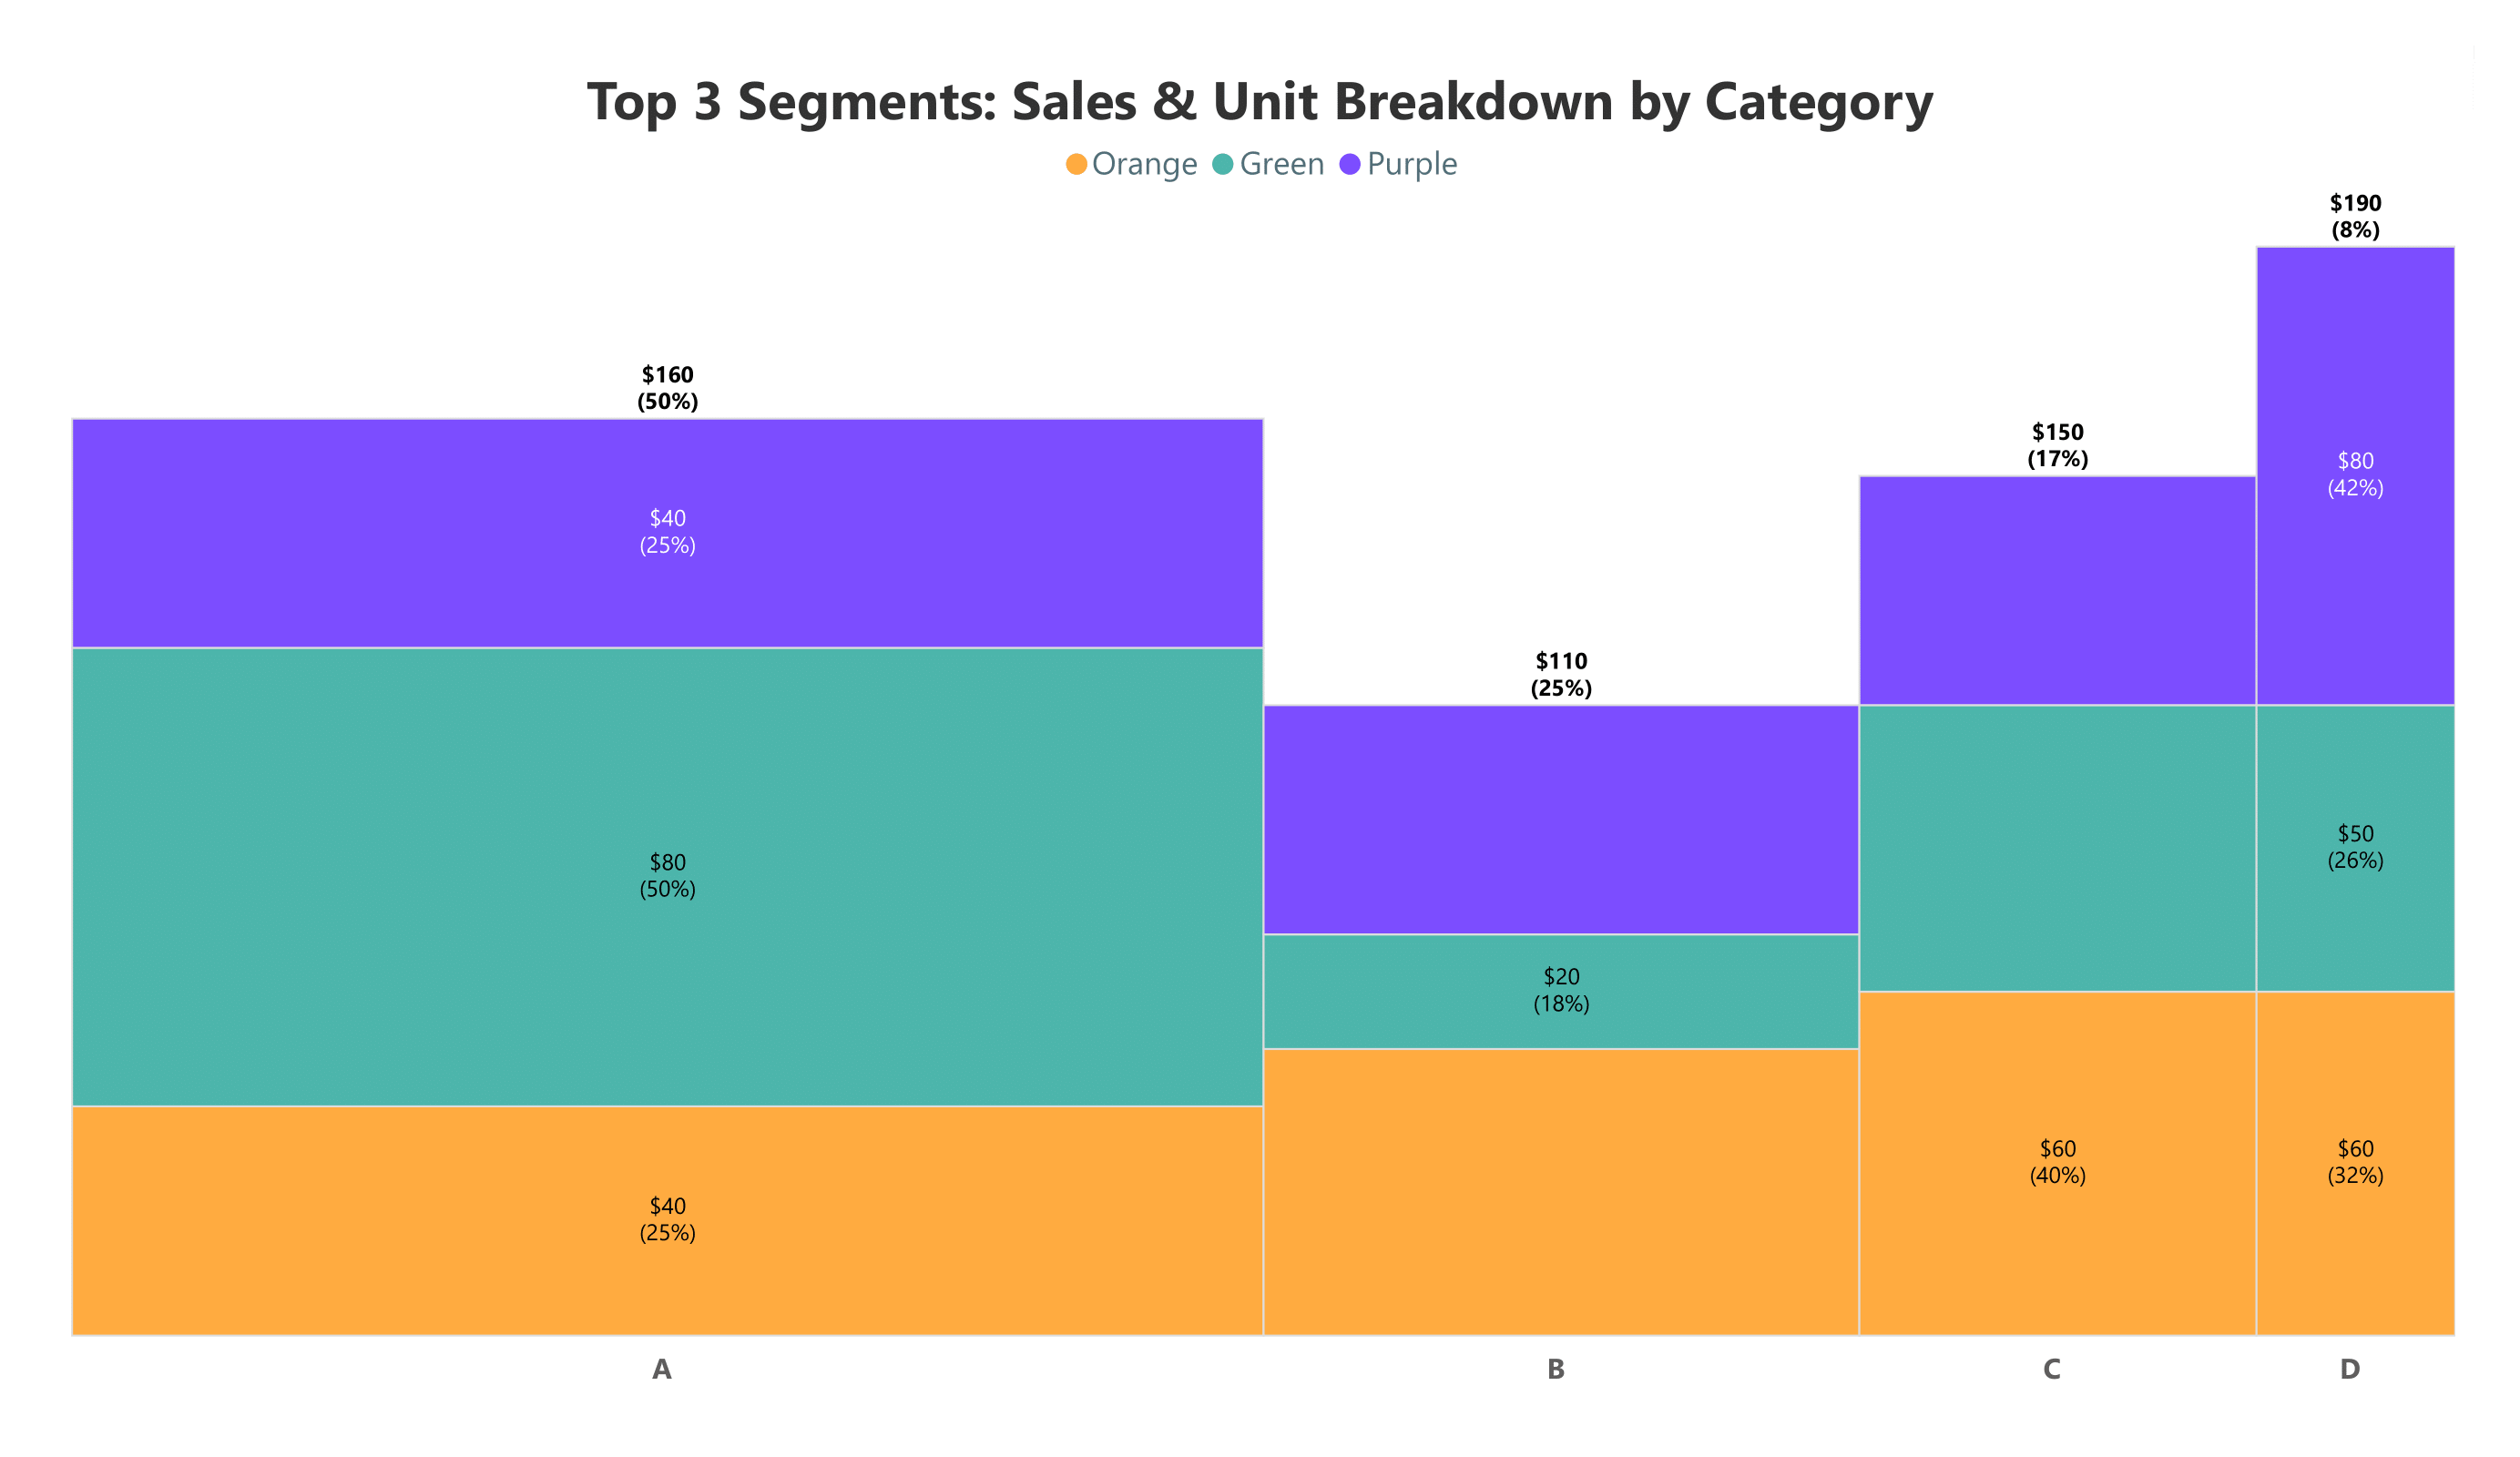
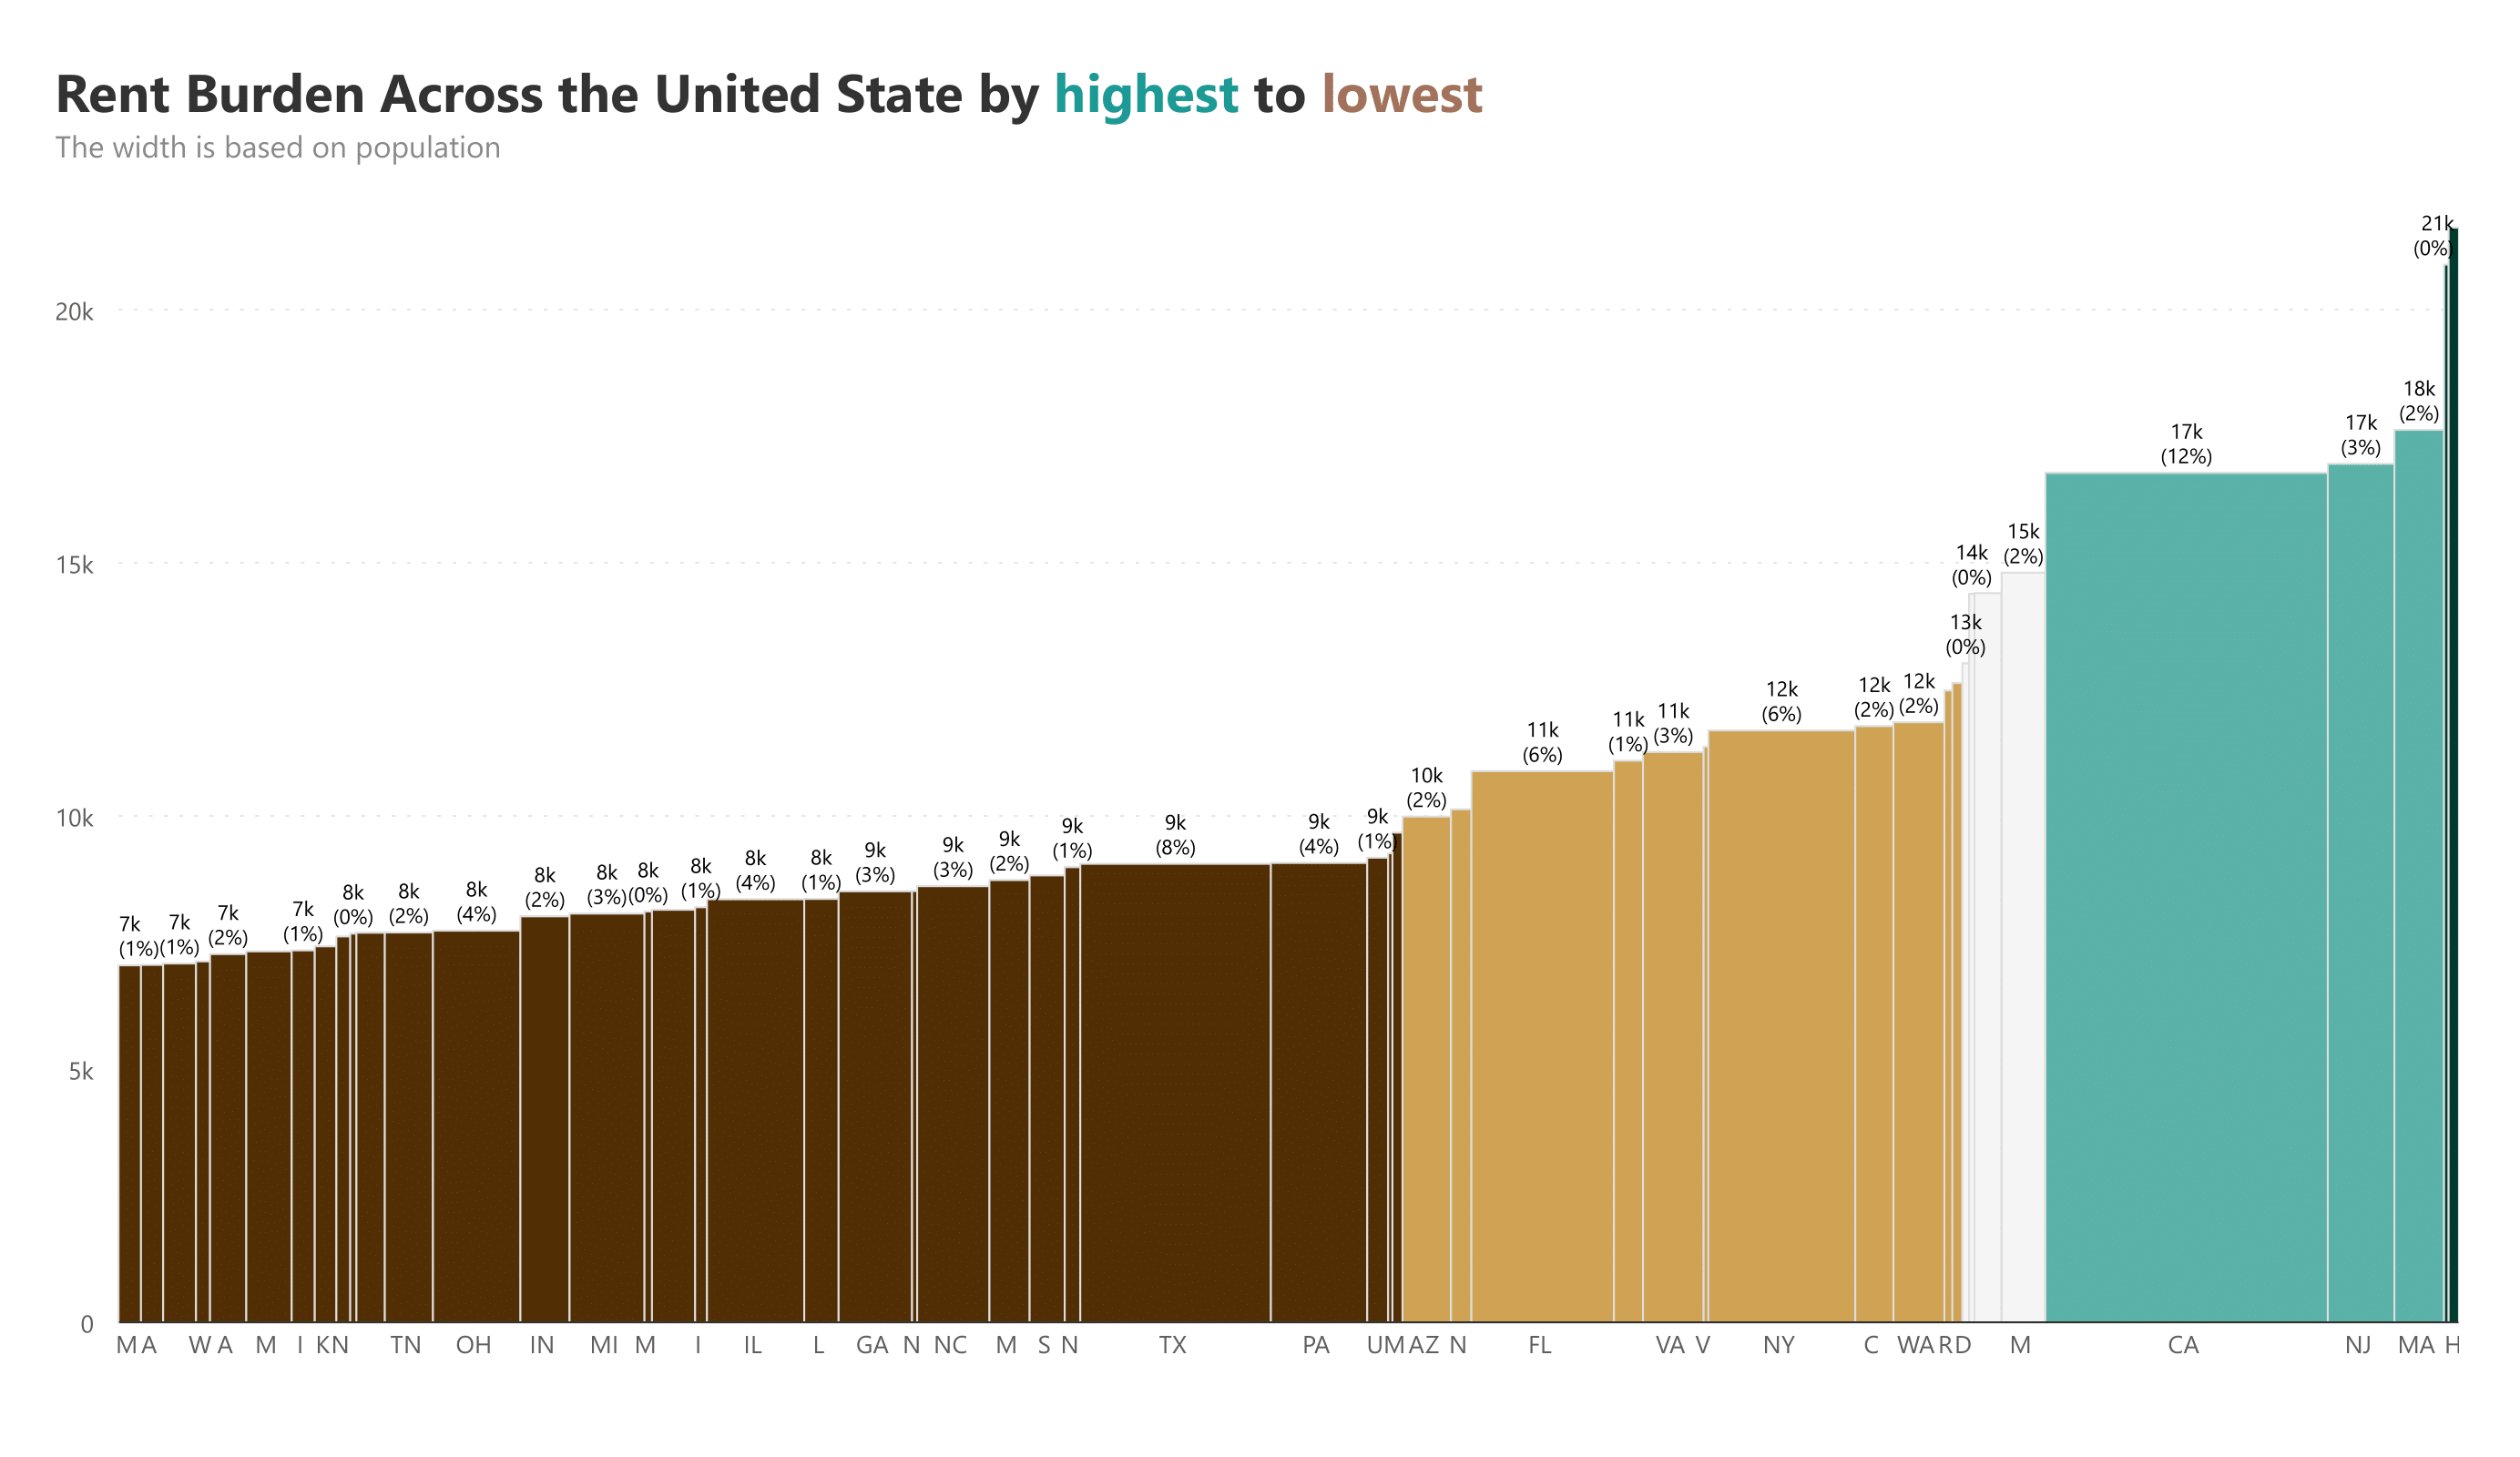
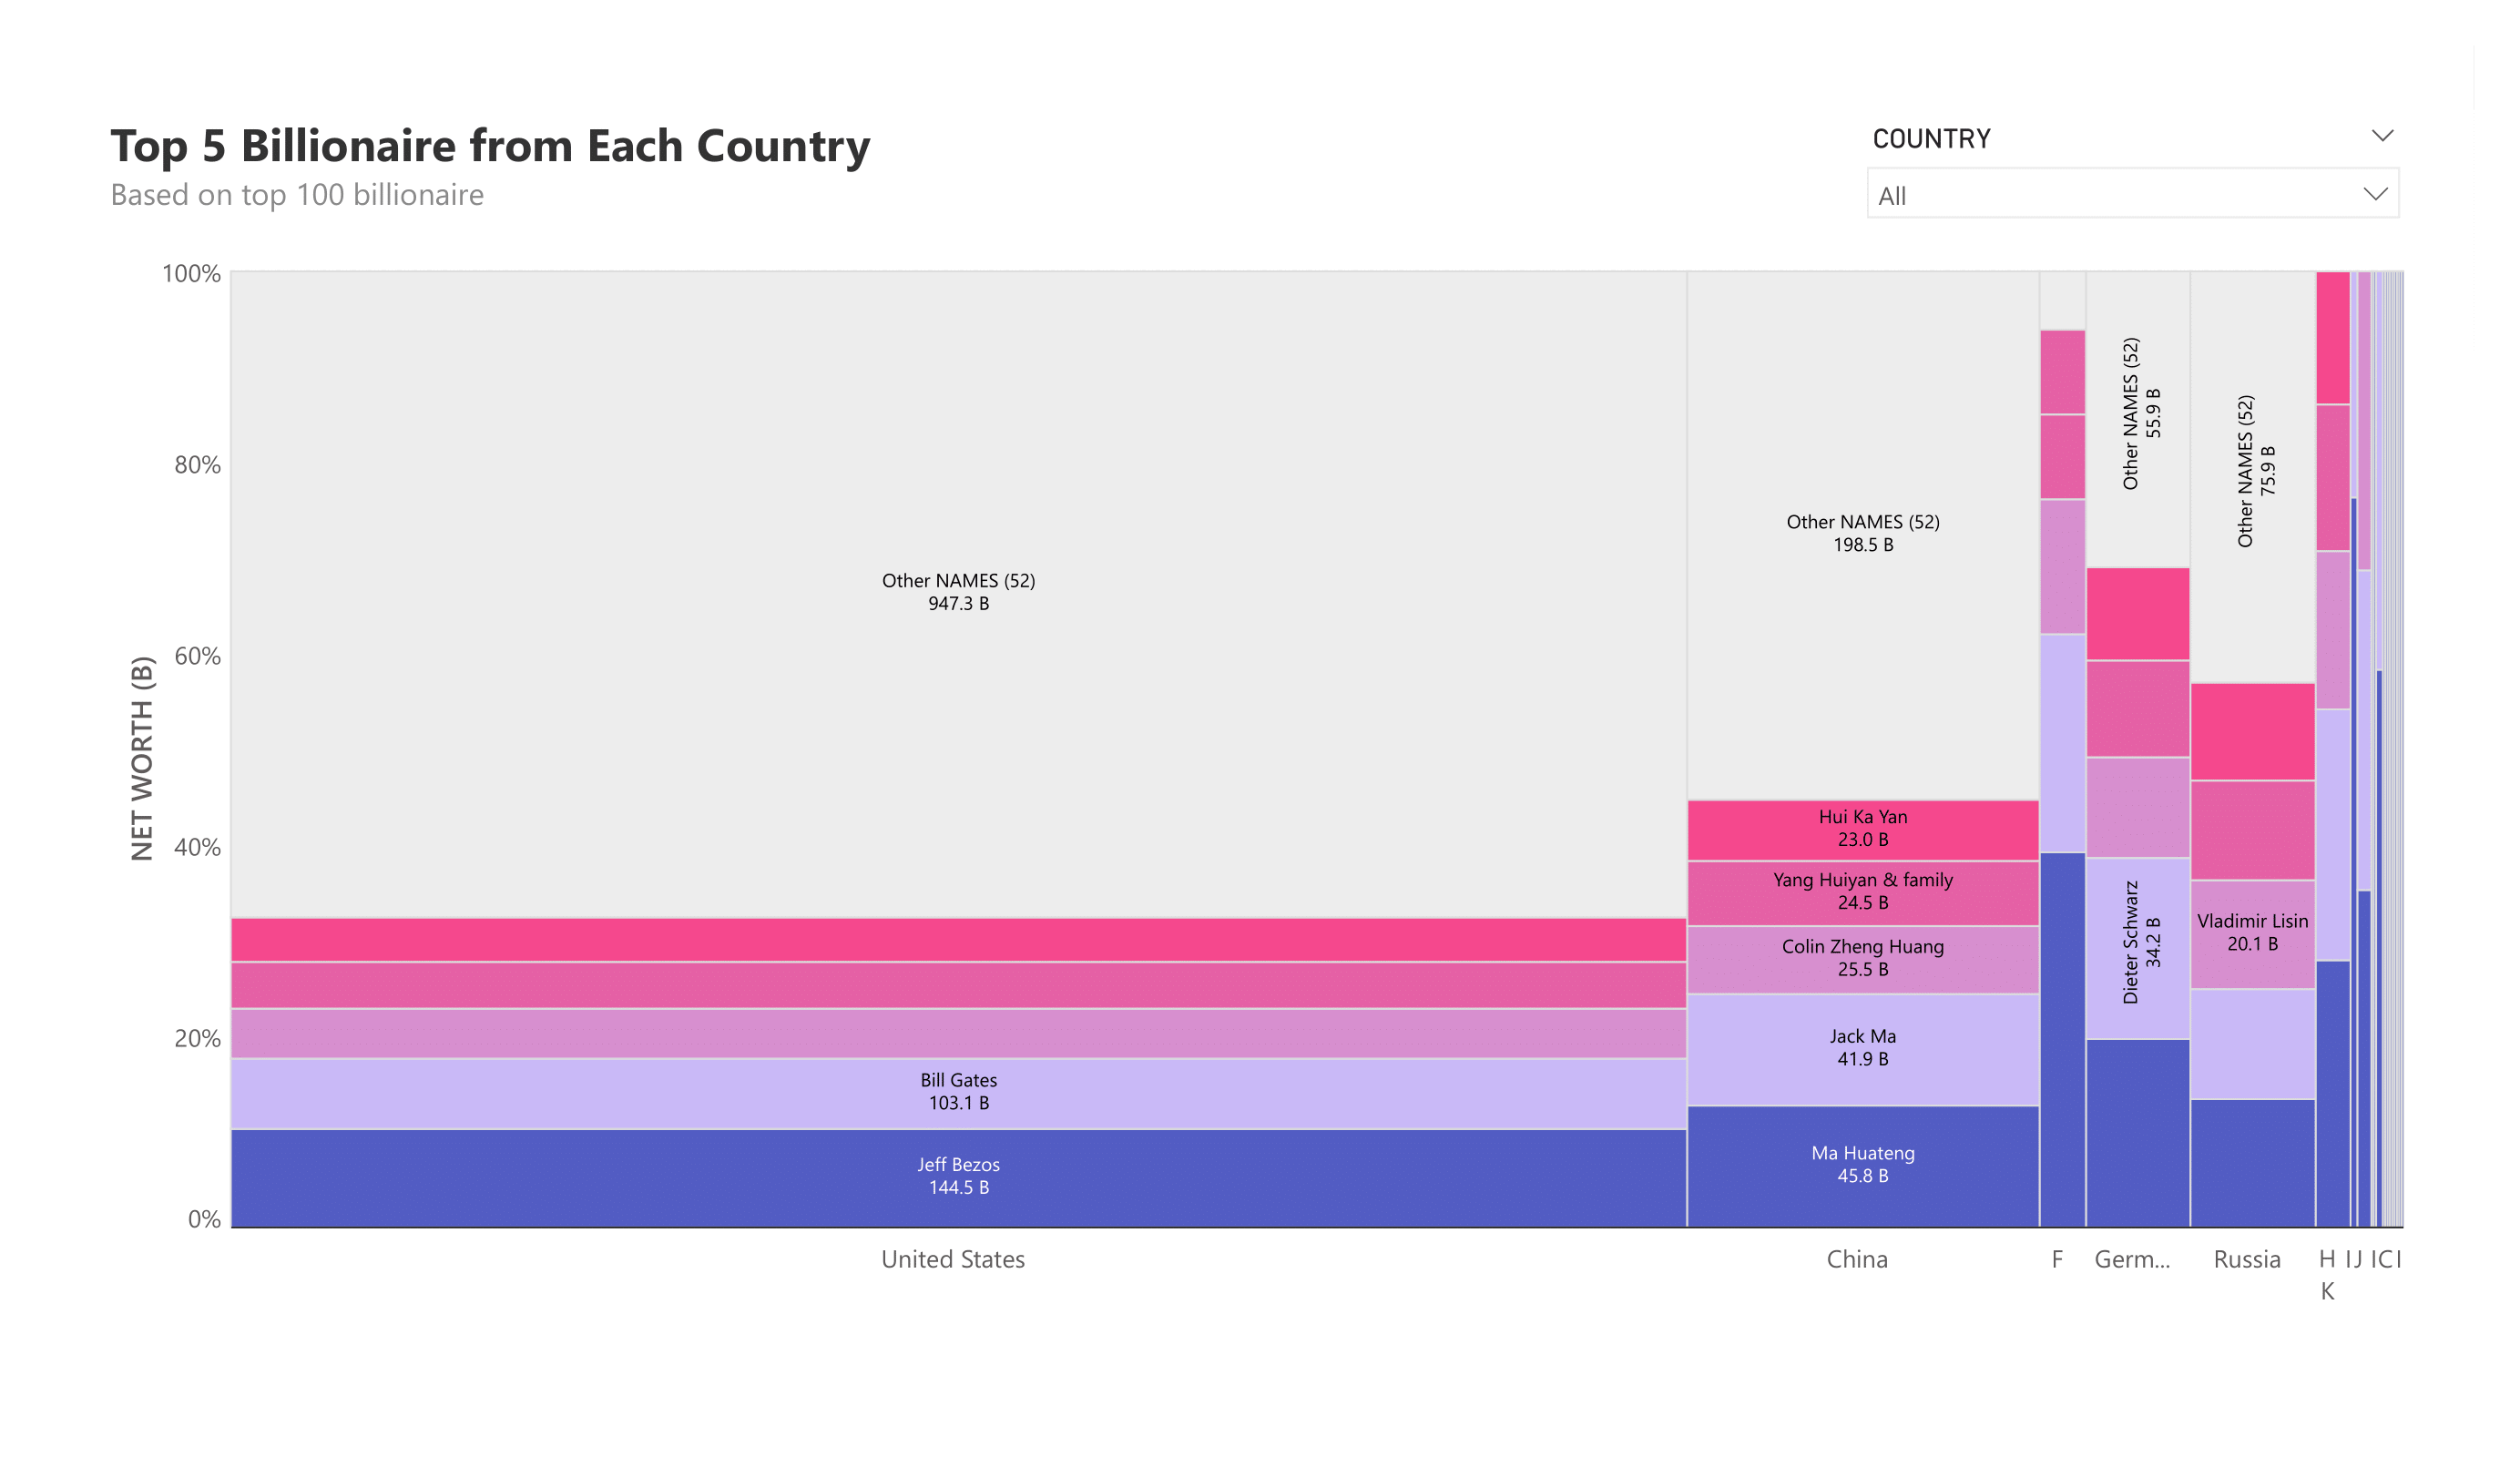
Inforiver Analytics+ Marimekko chart for Power BI enabled you to visualize categorical data over a pair of numeric variables. The advanced custom visual allows you to encode two values (e.g. Revenue & profit margin) along its width and height of each dimension (e.g. product) or a combination of two dimensions (e.g. Products in New York). Marimekko chart is used to determine the relationship between 2 categories alongside 2 measures. 

Inforiver Analytics+ delivers the best of both worlds – spreadsheets & standardized BI reporting and visualizations – through a low-code / no-code architecture that drives excellent authoring, consumer & collaboration experiences for unrivaled analysis, productivity and ROI.
Download PBIX
View interactive content

Key features

Orientation

Chart Orientation

Both vertical and horizontal orientation is available
Stacked absolute

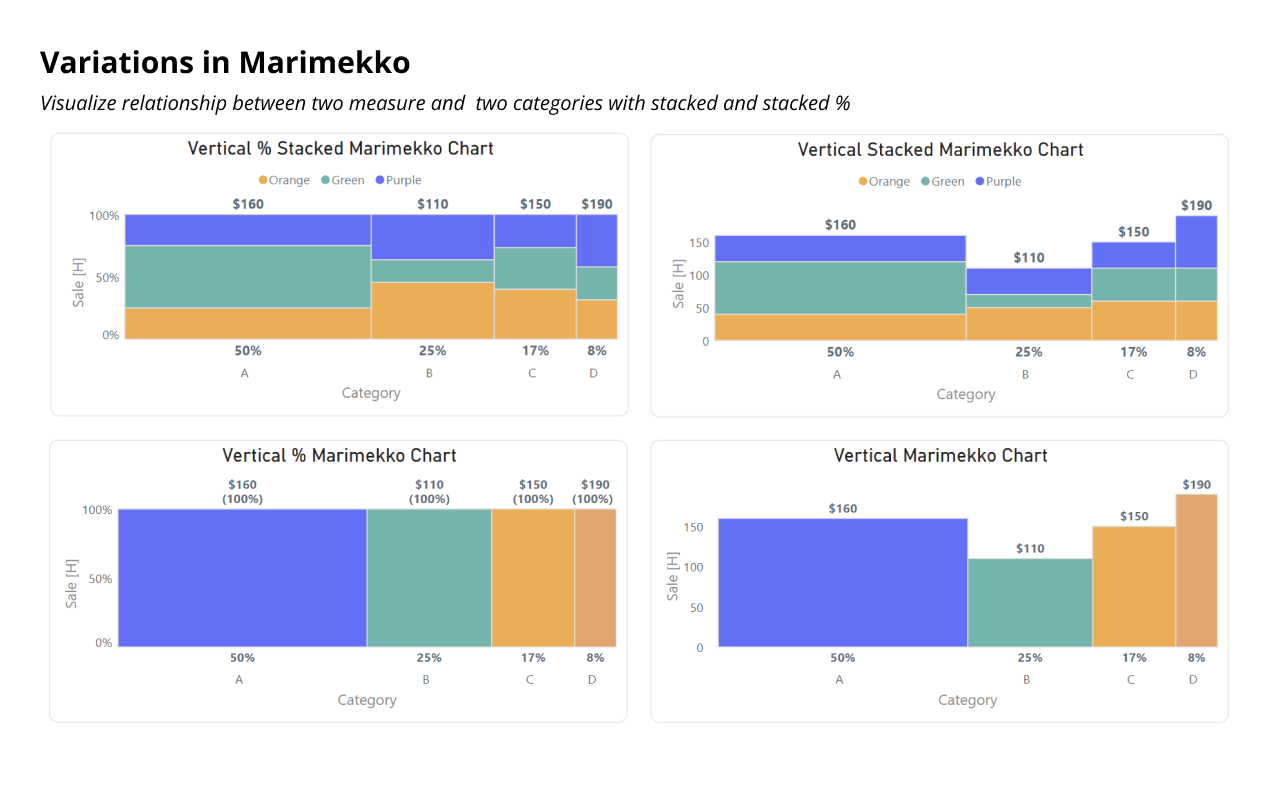
Stacked Absolute and 100%

Switch between absolute and 100% stacked chart types for comparison.
Data labels

Data Labels – Width and Height

Control data label value and percentage display based on height, width and both to get the maximum insights.
Conditional formatting

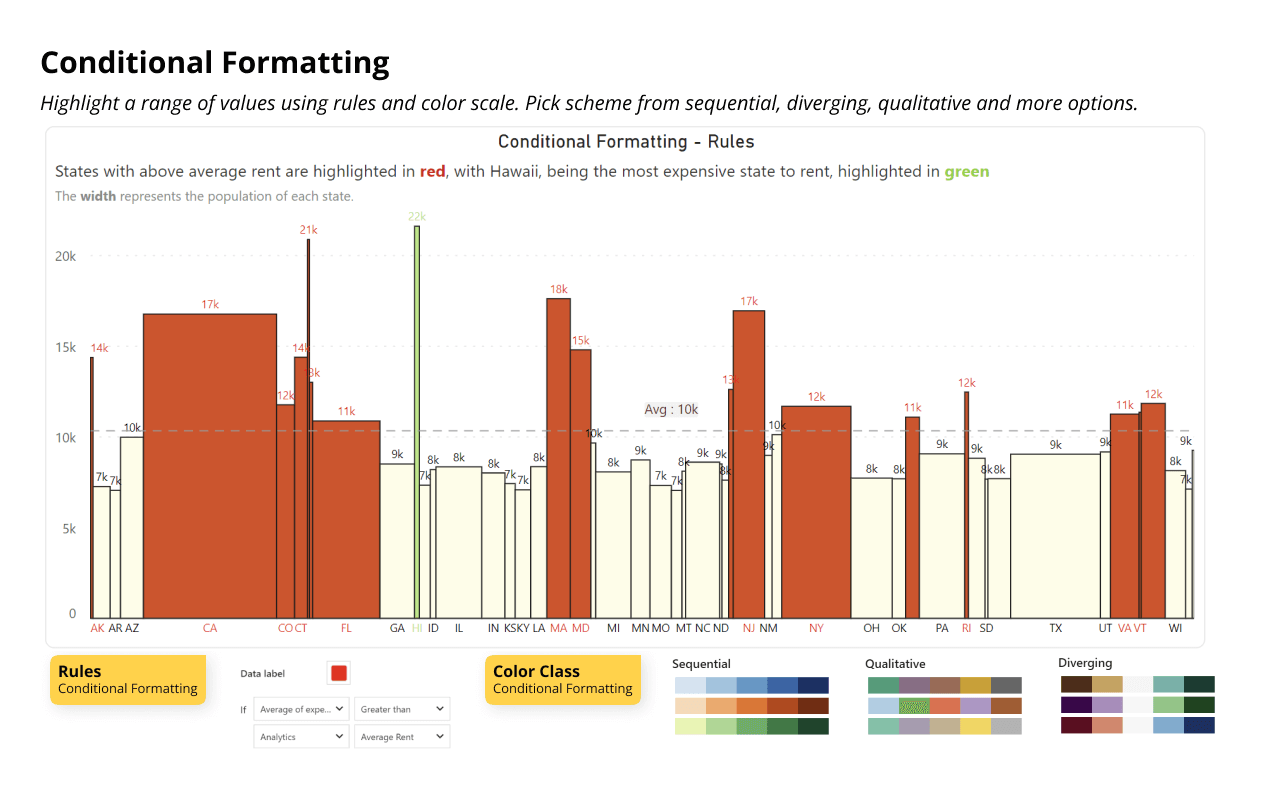
Conditional Formatting

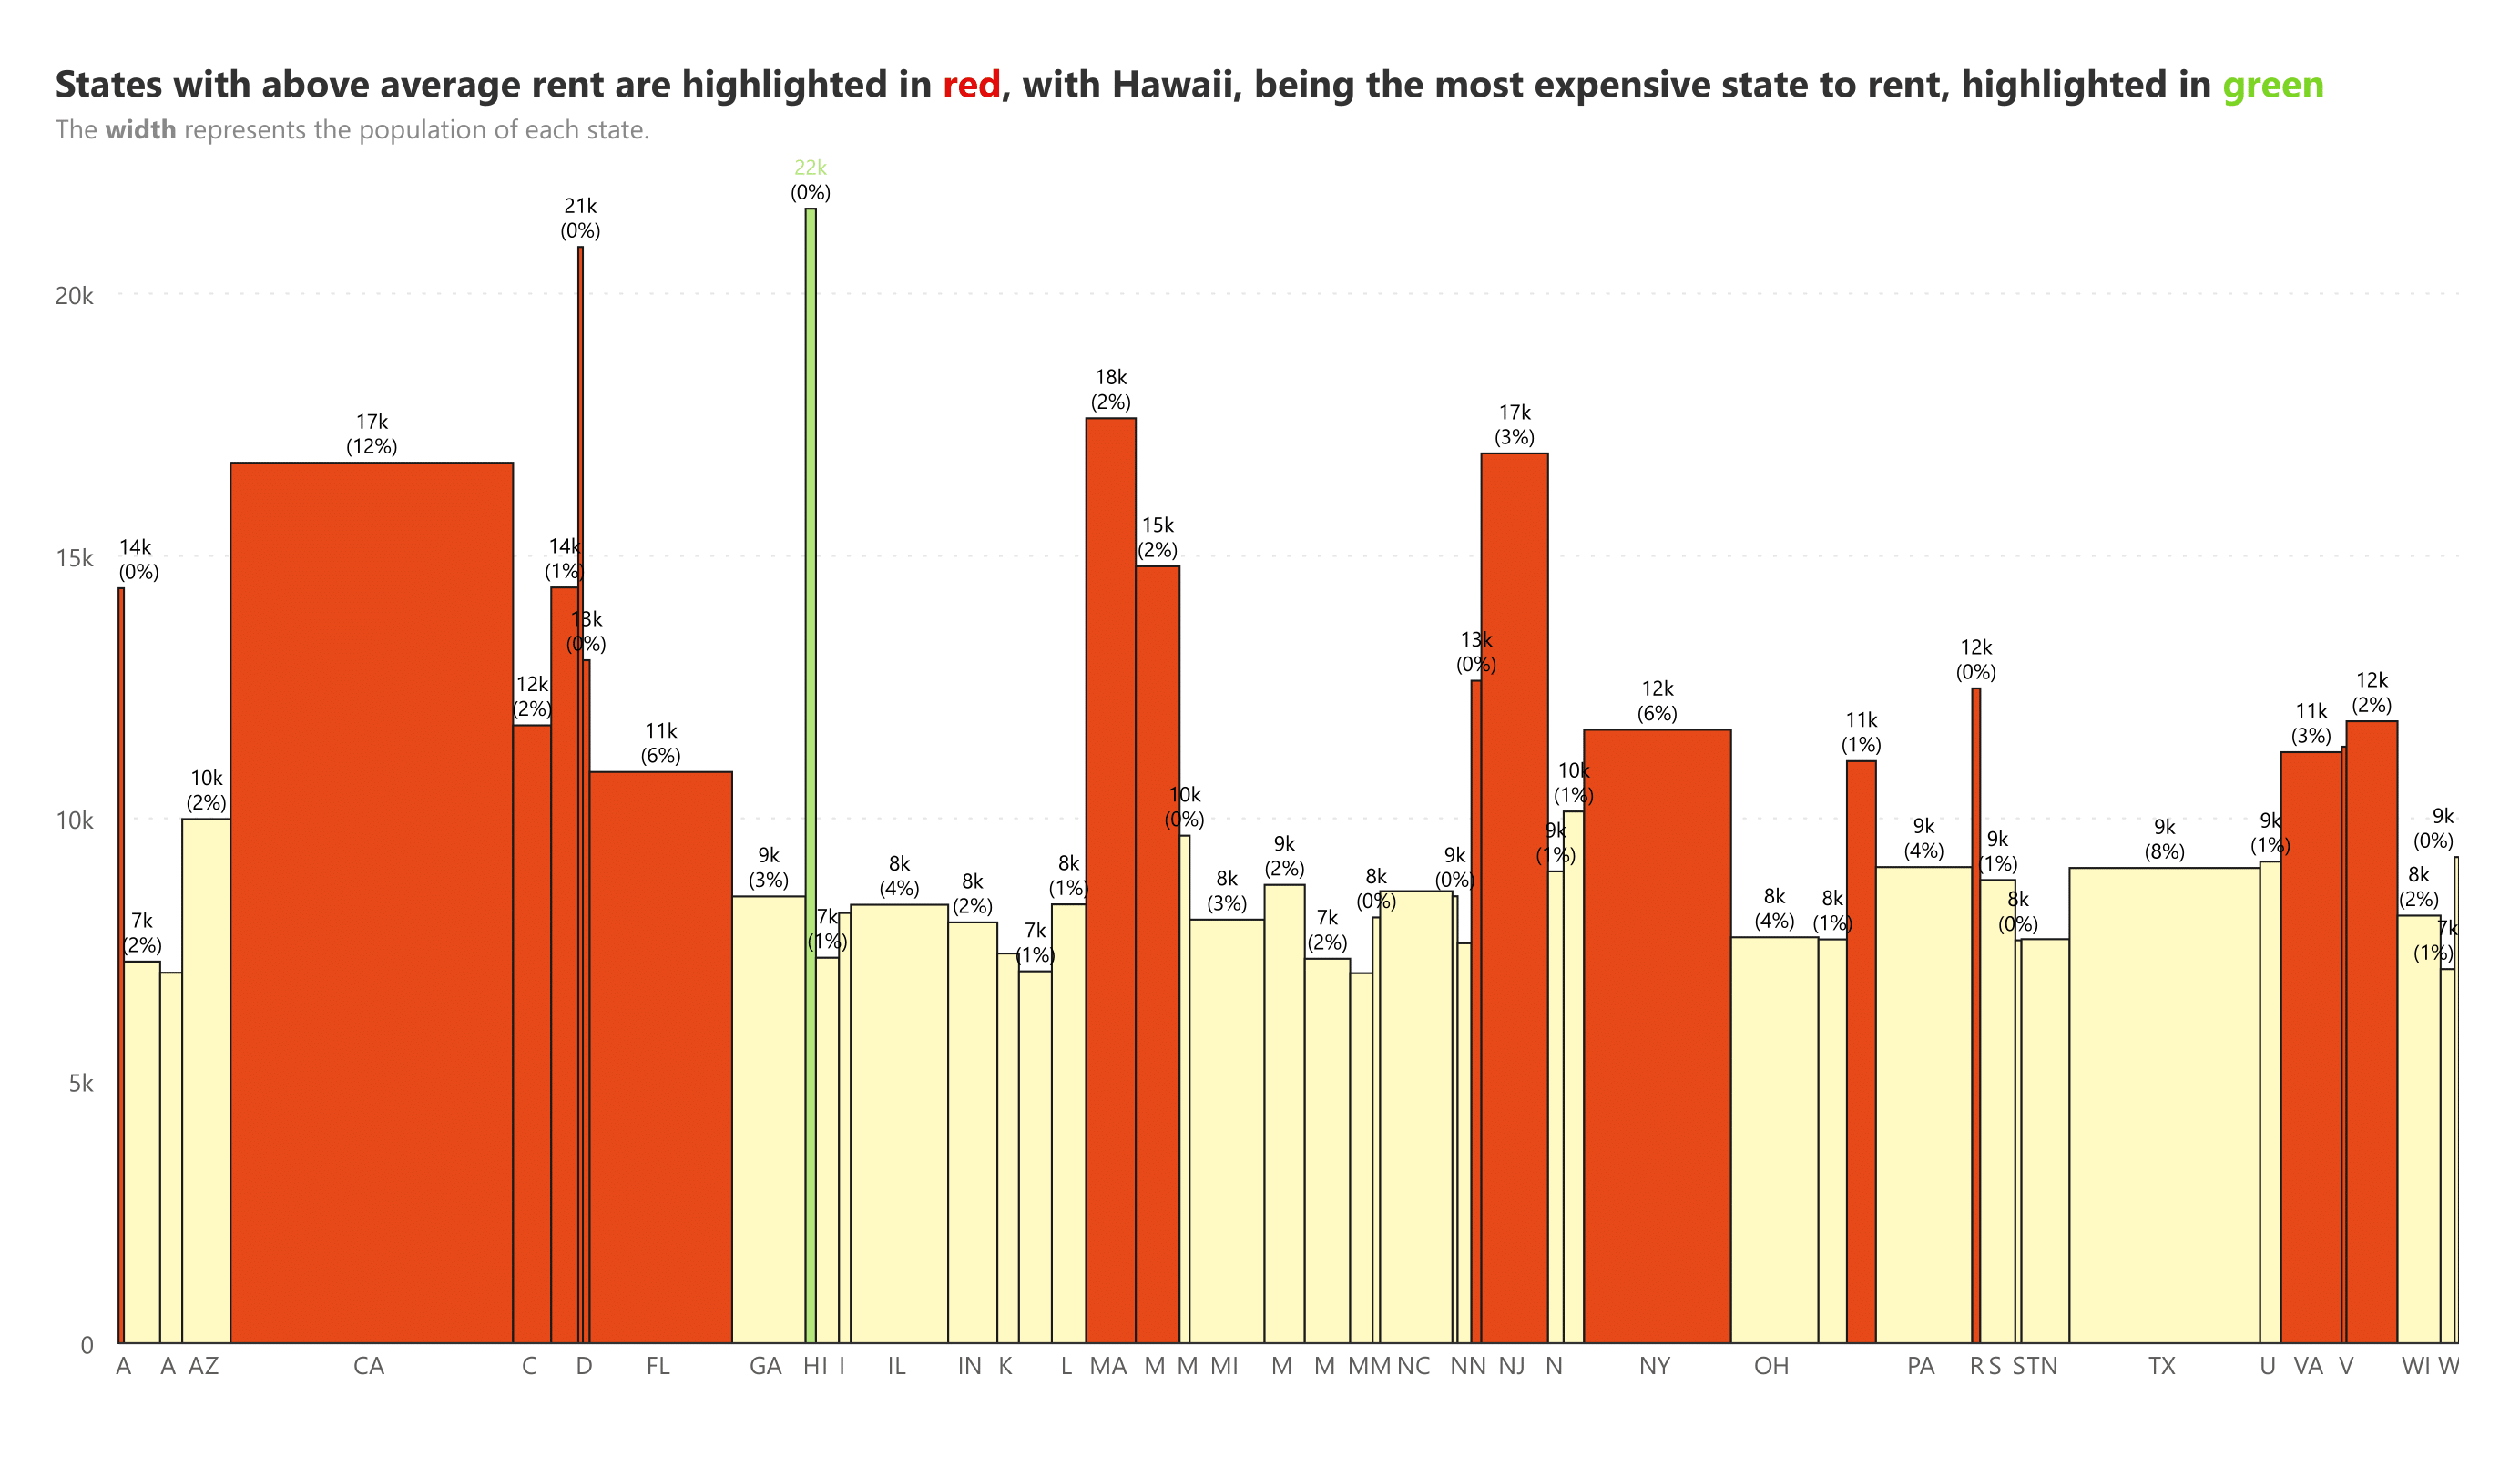
Highlight data points by creating rules or color scale based on custom conditions
Legend

Legend

Customize legend interactions (highlight, include, exclude) and styles with 5 different options covers background, icon and total display.
Small multiples

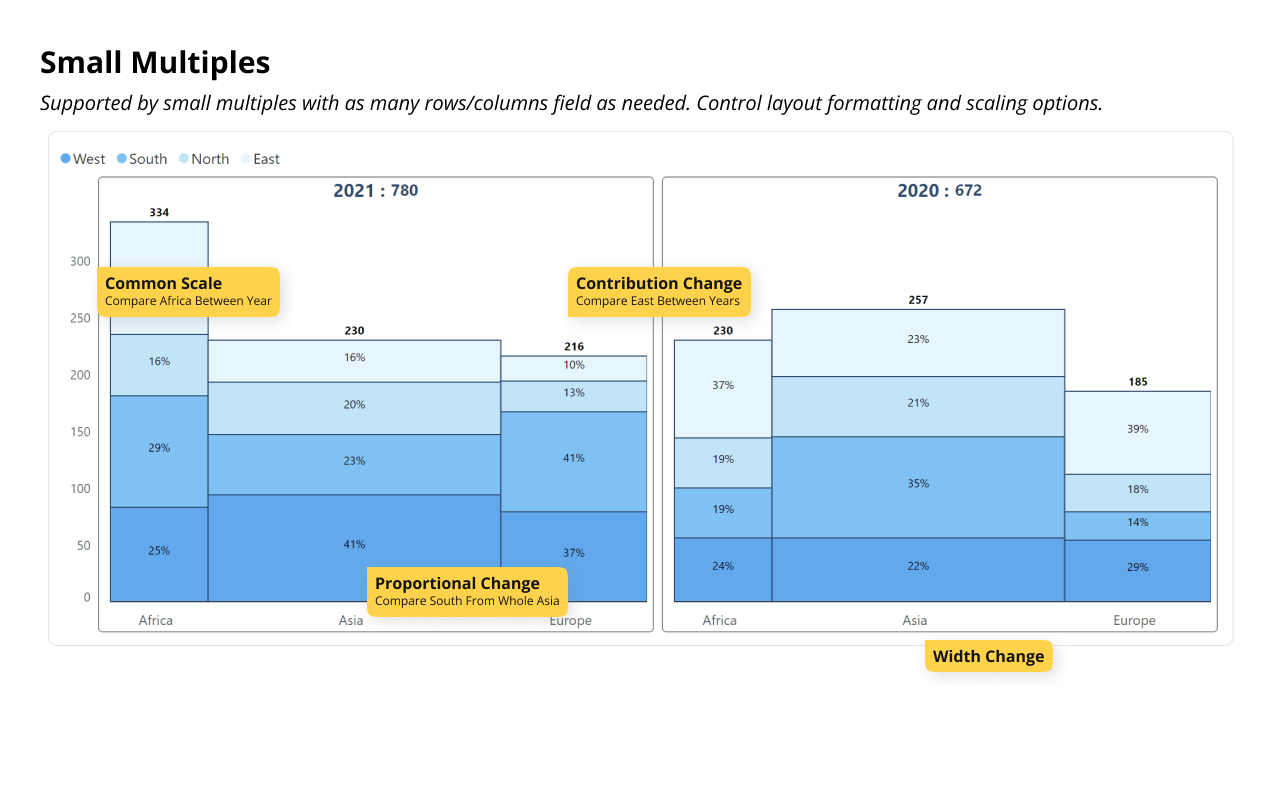
Small Multiples

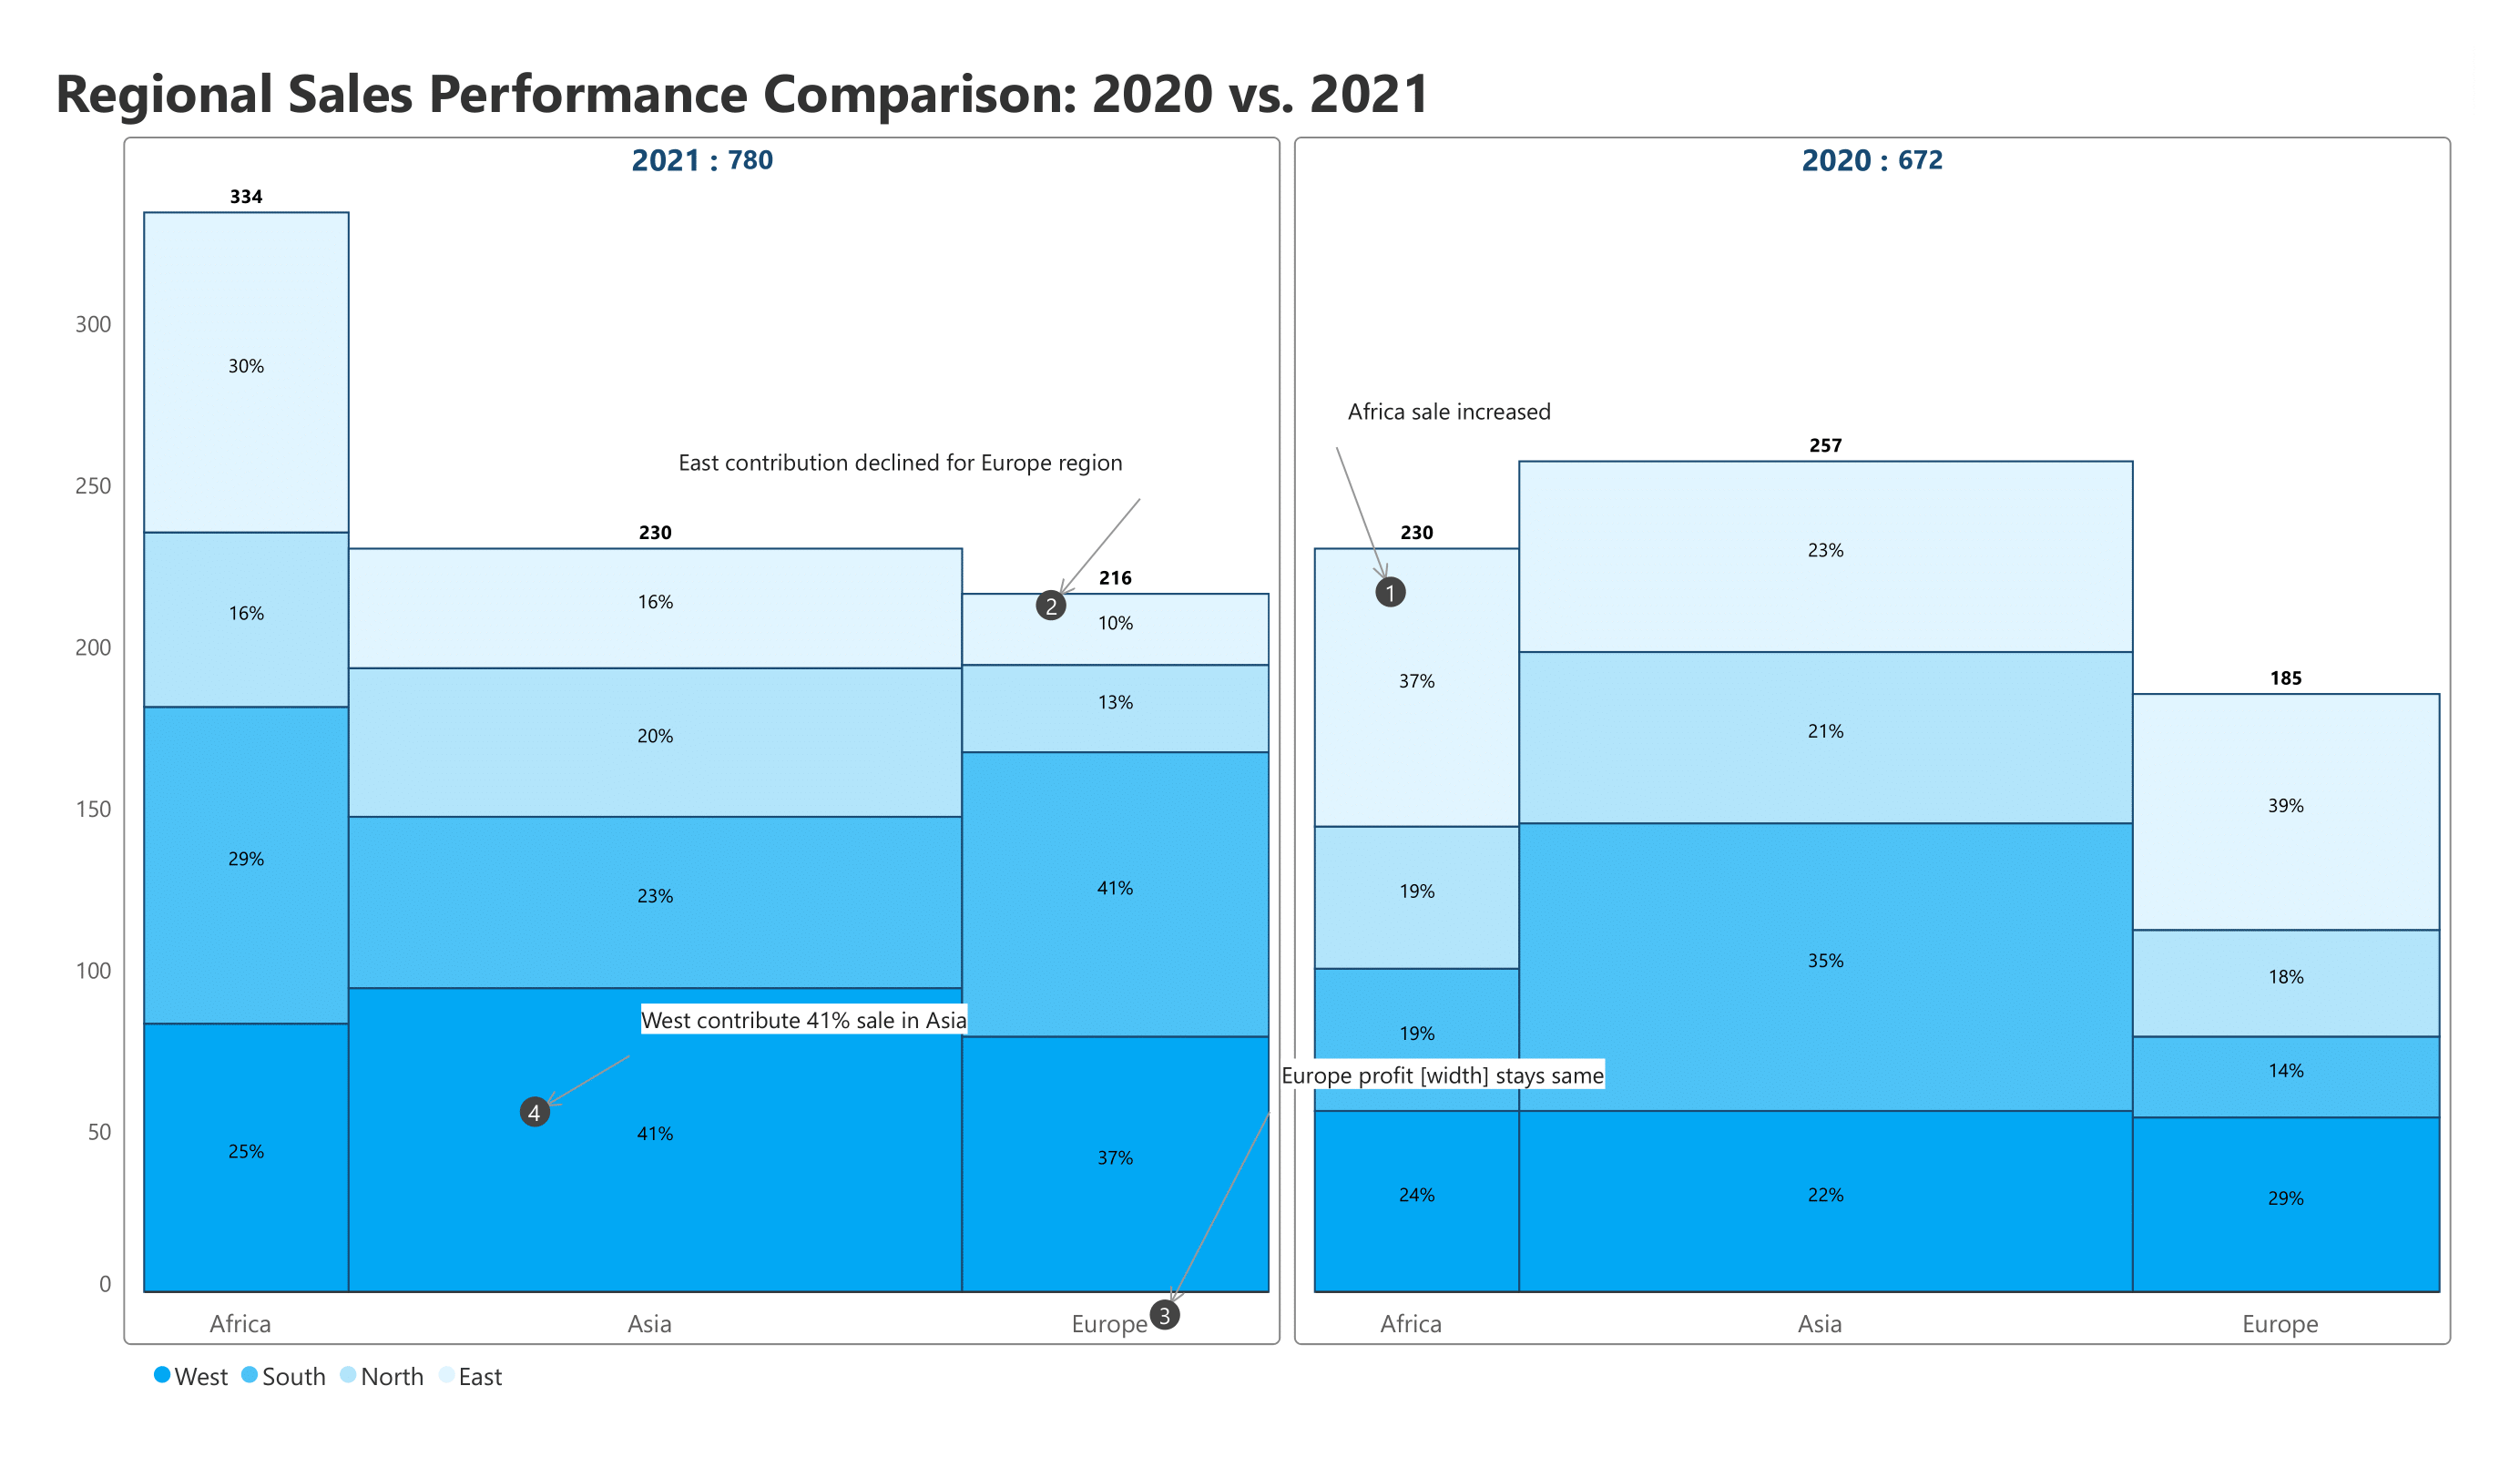
Experience advanced trellis charts with multiple hierarchy, grid layouts, axis and more. Merge rows/columns for matrix layout view.
Formatting options

Formatting Option

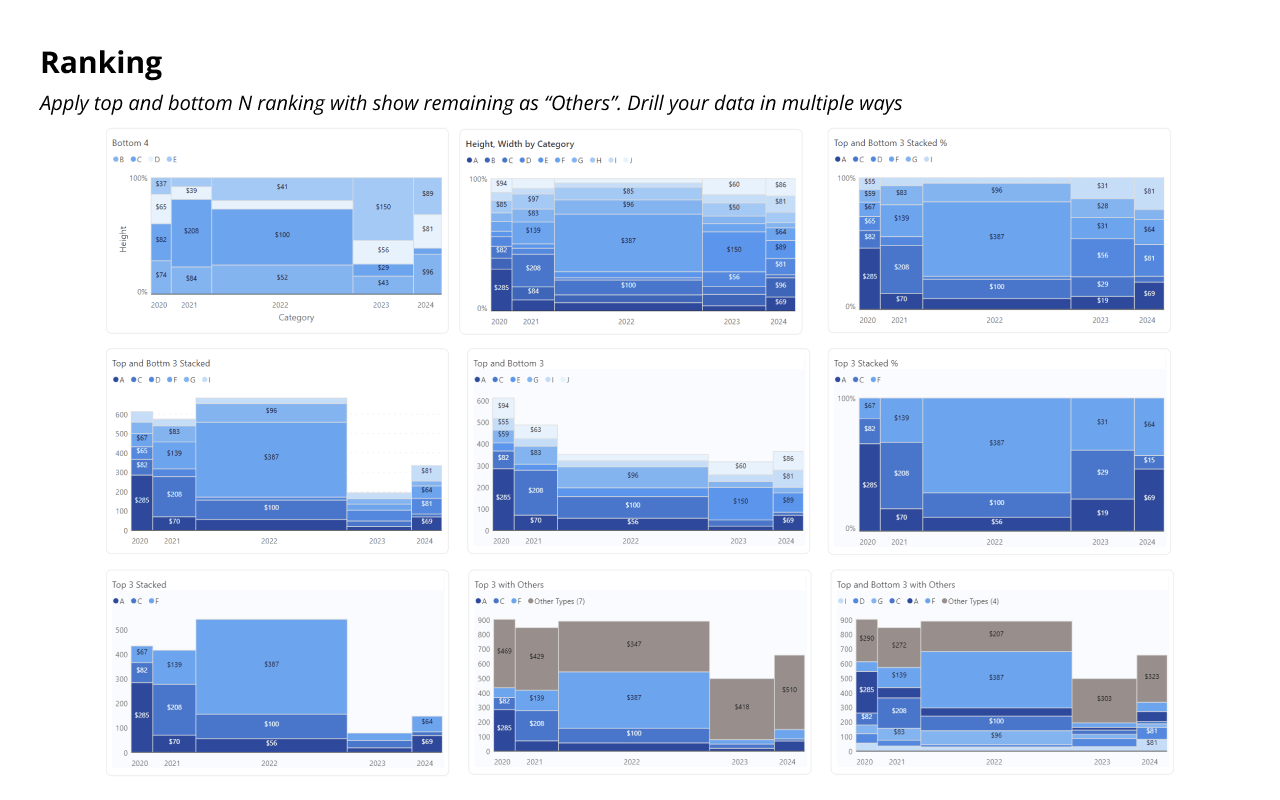
Control sorting, ranking, number formatting and summary table for excel like experience.
Export options

Export Option

Save the template and generate pixel perfect export to PDFs.

Gallery

Pricing

Get Marimekko chart Family

Billed at

$9995

/year
Buy marimekko chart family for your entire organization;
Buy now

Get the entire Analytics+ suite

Starts at

$3

/user/month
Buy all the 100+ Charts, KPI cards and Tables (includes bullet charts);
Buy now

Featured blog

marimekko-charts-in-power-bi-a-deep-dive-register

Marimekko charts in Power BI – A deep dive

Jump into the colorful world of Marimekko charts with this webinar that explores their history, uses, and challenges, and includes a LIVE DEMO on creating these charts within Power BI.
Watch now

What’s New with Analytics+: Chart wizard, Flexible KPI containers, Tornado, Parallel coordinates, Ribbon charts & more  

What’s New with Inforiver Writeback Matrix: Scheduled writeback, row forecasts, and live-streaming dropdown values

From Resistance to Results: Embracing Power BI Migrations

What’s New with Inforiver Writeback Matrix: Lookup visuals for dropdowns, text measure support in Infobridge, and more!

Simplified data cross-referencing with Inforiver lookup visuals for Power BI 

What’s New with Inforiver Writeback Matrix: Added Support for Databricks & More  

Better BI Reporting: New Inforiver Features Integrated from Writeback Matrix to Reporting Matrix  

Inforiver Reporting Matrix Release Updates – Version 3.3 

Inforiver Writeback Matrix August 2024 Interim Release – Version 3.2.2 

Microsoft Power BI Sandbox for Inforiver: A Guide  

Inforiver Writeback Matrix August 2024 Release Updates – Version 3.2 

Inforiver Writeback Matrix July 2024 Release Updates – Version 3.1

Inforiver Analytics+ July 2024 update - Major Release 4.0

Inforiver Writeback Matrix June 2024 Release Updates – Version 3.0

Inforiver Enterprise May 2024 Release Updates – Version 2.9.8 

Inforiver Enterprise April 2024 Update – Version 2.9.5 

Marginal Abatement Cost Curves – A comprehensive guide 

Managing Power BI Tenant Settings for Custom Visuals / Organizational Visuals 

Inforiver Enterprise April 2024 Release Updates – Version 2.8.5 

Inforiver Premium March 2024 update – Version 2.9 

Inforiver Analytics+ March 2024 update - Release 3.6 

Assign Power BI custom visual licenses to users, teams, or departments  

Inforiver Analytics+ February 2024 update - Major Release 3.5

Inforiver Enterprise February 2024 Update – Version 2.8

1 2 3 141
post_type=post&terms%5B0%5D=marimekko

Get your FREE eBook

The ultimate guide to Marimekko charts in Power BI

Explore Marimekko templates that you can create in Power BI without using scripting or DAX.​

marimekko-chart-ebook

Get Inforiver brochure

Maximize your business potential with Inforiver's paginated reporting, data entry, planning & budgeting capabilities
Download now
Inforiver

Inforiver helps enterprises consolidate planning, reporting & analytics on a single platform (Power BI). The no-code, self-service award-winning platform has been recognized as the industry’s best and is adopted by many Fortune 100 firms.

Inforiver is a product of Lumel, the #1 Power BI AppSource Partner. The firm serves over 3,000 customers worldwide through its portfolio of products offered under the brands Inforiver, EDITable, ValQ, and xViz.

linkedin facebook pinterest youtube rss twitter instagram facebook-blank rss-blank linkedin-blank pinterest youtube twitter instagram