Upcoming webinar on 'Inforiver Charts : The fastest way to deliver stories in Power BI', Aug 29th , Monday, 10.30 AM CST. Register Now
Upcoming webinar on 'Inforiver Charts : The fastest way to deliver stories in Power BI', Aug 29th , Monday, 10.30 AM CST. Register Now
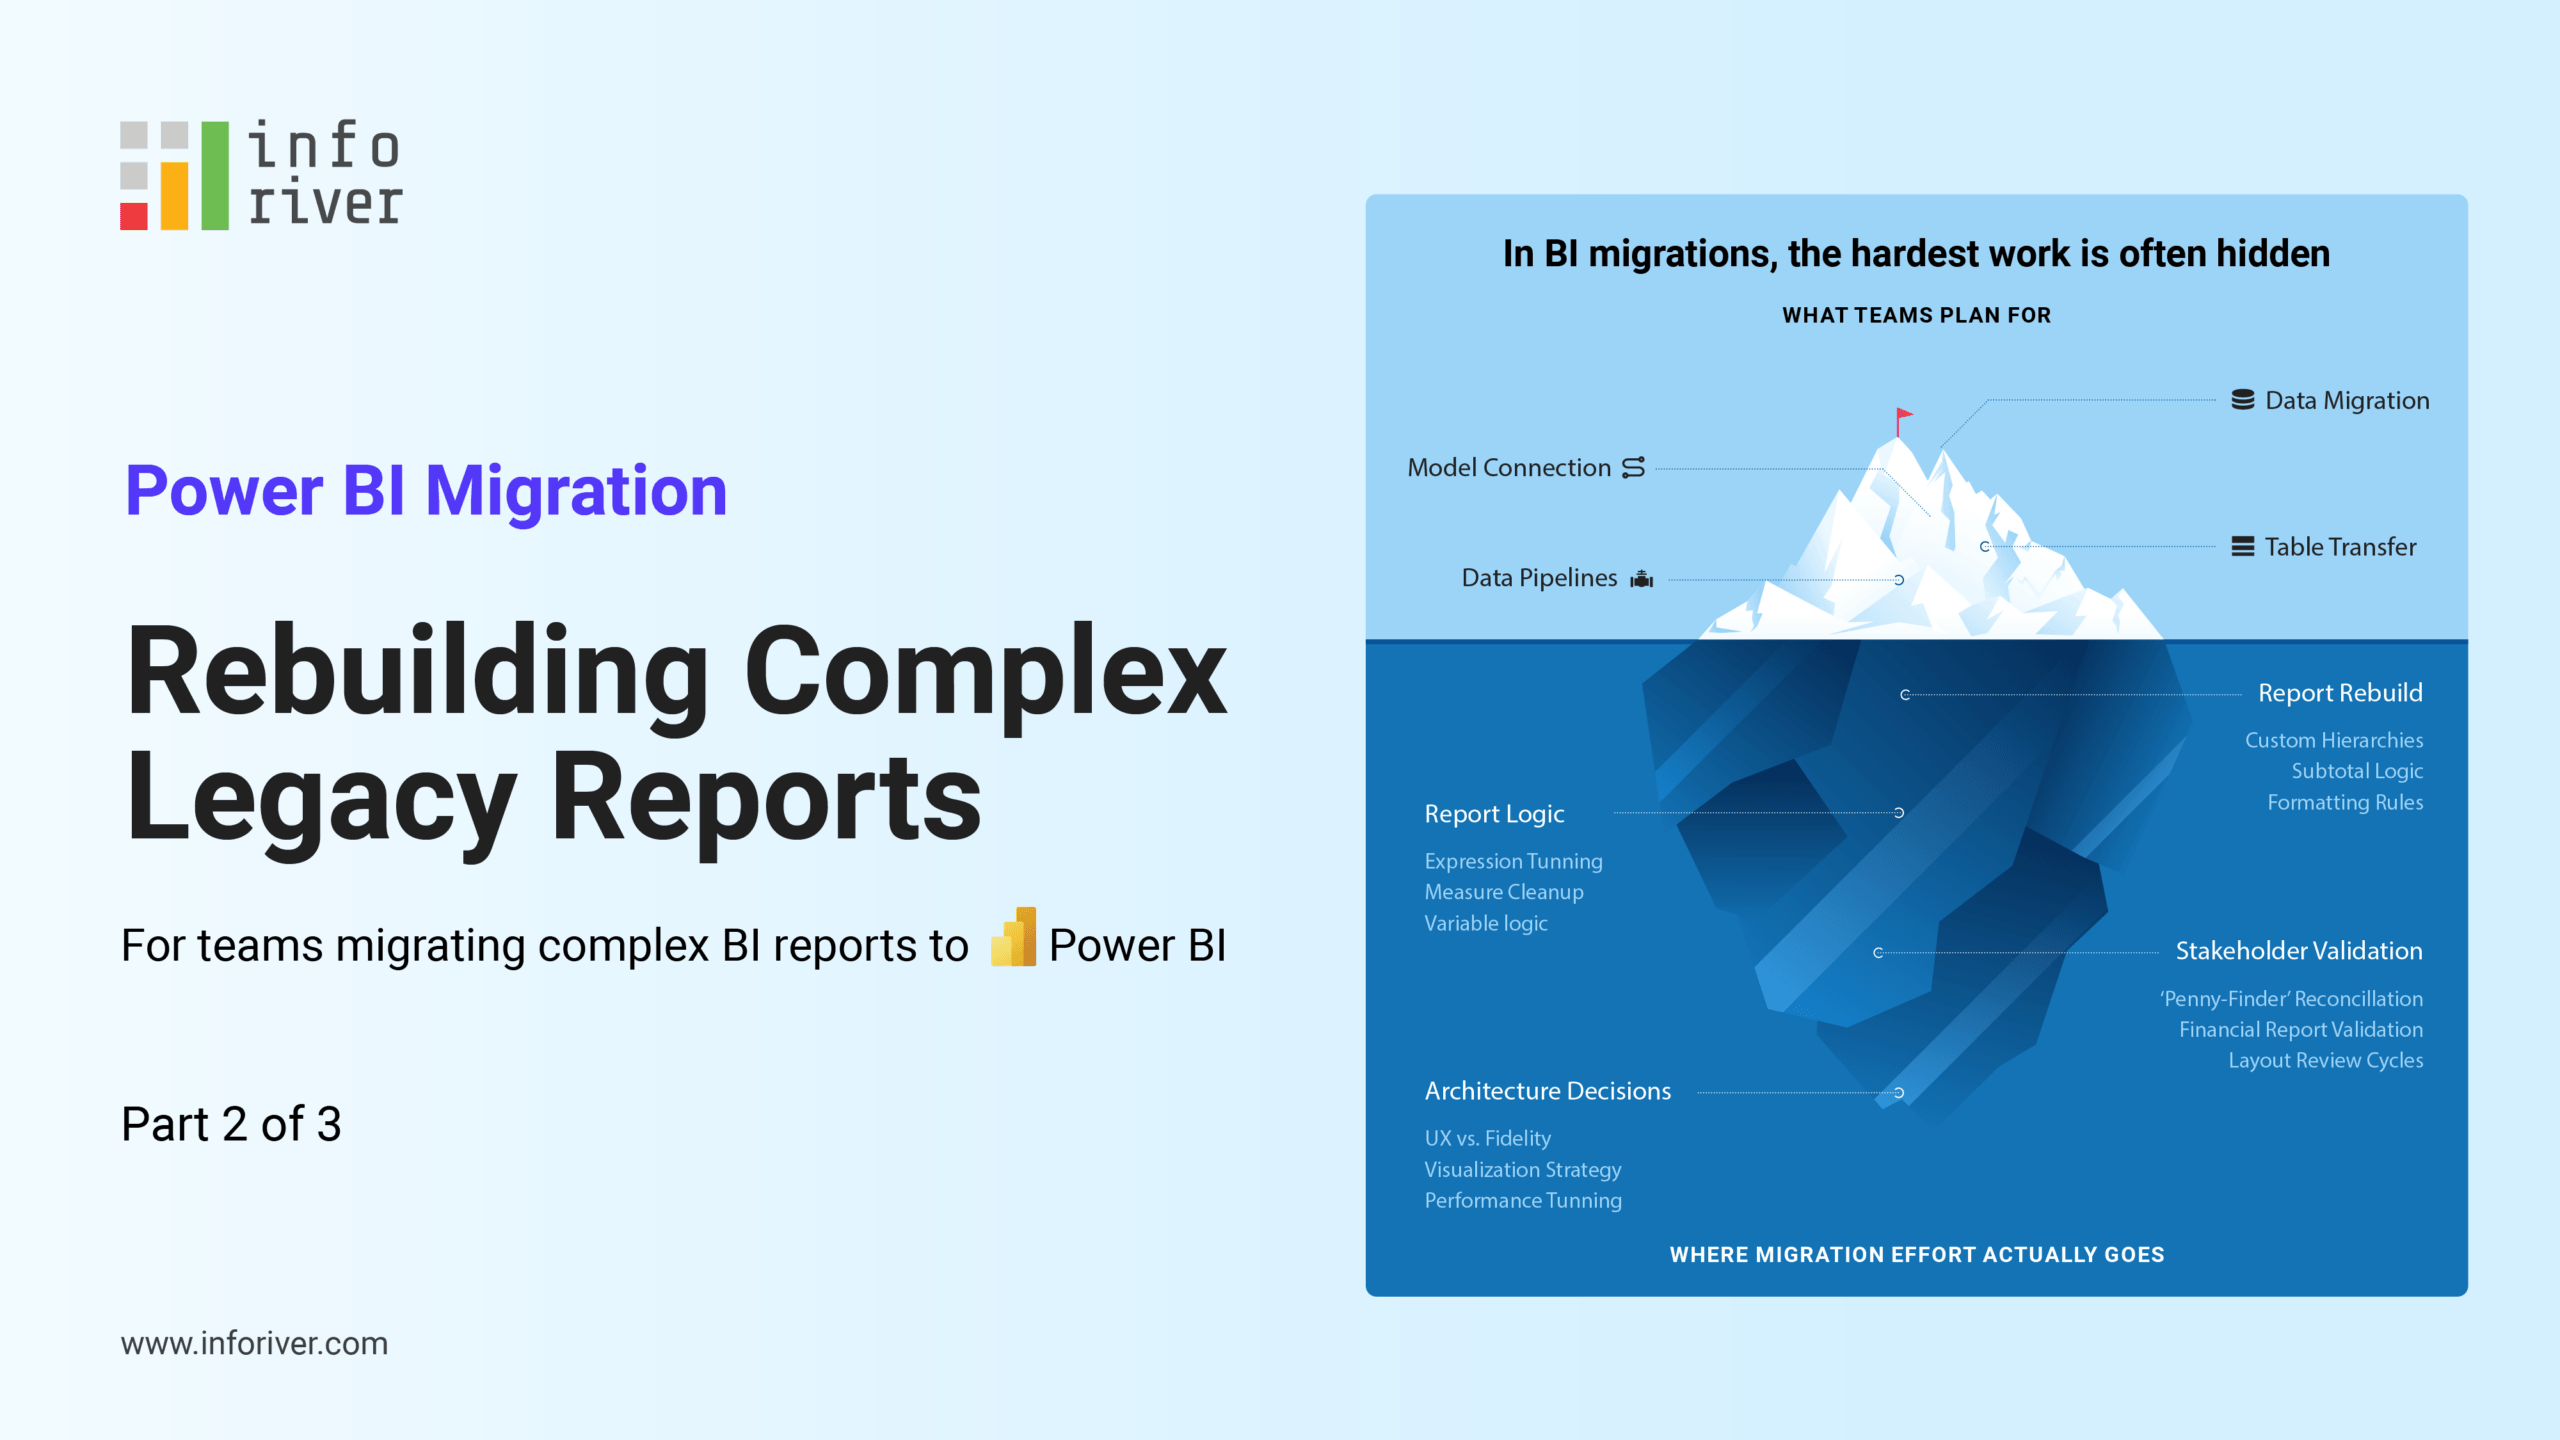
When organizations migrate from platforms such as SAP BusinessObjects, Cognos, Tableau, or Qlik to Power BI, the early stages often look smooth. Data connects. Visuals render. Core reports are rebuilt. At first, migration feels like a straightforward data movement task.
But early success can hide structural debt. Teams sometimes celebrate a rapid rollout, only to see refresh times stretch and troubleshooting multiply weeks later. The initial success masked architectural choices that did not scale.
The real challenges appear later—inside the semantic model. These are not isolated issues. They are architectural consequences.
This Blog examines the architecture behind these challenges. Our focus is on three principles: placing logic where it belongs, separating calculations from presentation, and anticipating complexity before it scales.
We’re hosting a live session on the migration challenges discussed in this article and the architecture patterns teams use to keep Power BI models scalable. You can learn more and register for the Power BI Migration Masterclass.
Power BI’s flexibility is a strength. It also means that where logic lives directly affects performance.
For example, centralizing fiscal logic in a well-designed date table—rather than scattering it across multiple DAX measures—can significantly reduce redundant computation. If twelve measures each execute their own fiscal logic, that logic runs twelve times. When moved into a shared lookup structure, it runs once and serves all measures.
Another common example is localization. Some teams use USERCULTURE() DAX logic to switch measure output based on the viewer’s language. While this works, each language condition adds branching inside the measure. Power BI supports localization at the metadata level. When translation logic is embedded in DAX instead, calculation begins to absorb presentation concerns. As languages increase, so does complexity.
Like fiscal logic, localization is a placement decision. Where it lives determines how well the model scales.
As projects move from dashboards to structured reporting, logic accumulates. Financial sign handling, fiscal calendars, and custom row ordering are common requirements. In Power BI, these often end up inside DAX.
Under time pressure, teams consolidate business rules quickly. Over time, those measures become tightly linked and harder to reason about. Model size increases. Refresh cycles lengthen. Dependency chains grow fragile.
A simple micro-audit can reveal early warning signs:
Performance problems rarely appear on day one. They surface as concurrency grows and usage expands. By then, structural refactoring is far more disruptive.
Live Masterclass:
Migrating reports from SAP BusinessObjects, Cognos, Tableau, or Qlik to Power BI often requires rebuilding complex models and reports. In this session, we will walk through the practical challenges teams encounter and how they deliver scalable reporting without unnecessary complexity.
Register here: [Power BI Migration Masterclass: Fixing Modeling & Rebuild Challenges]
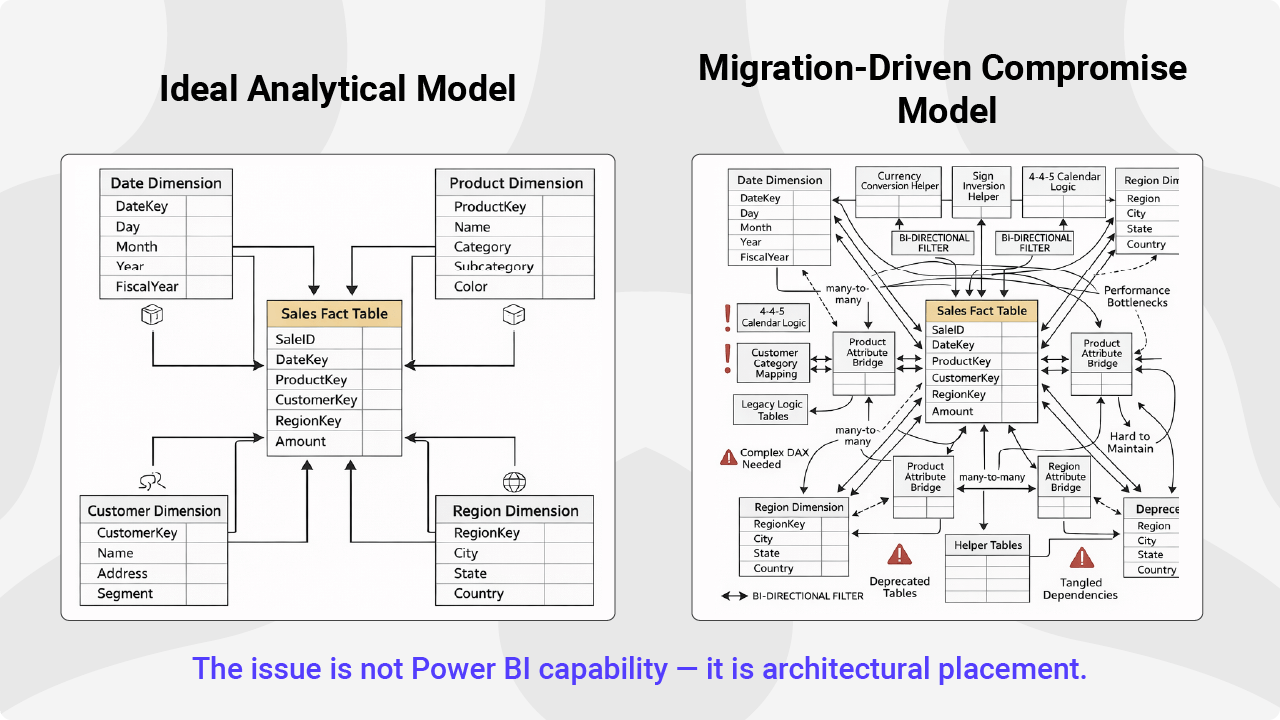
Date logic is a frequent pain point. Many organizations use 4-4-5 calendars or fiscal years that diverge from the standard calendar. In legacy tools, this logic was often predefined. In Power BI, developers must build it deliberately.
A simple date table is rarely sufficient. A robust version should include fiscal year, quarter, and month attributes, standard calendar equivalents, and clear period boundaries. If the model does not support these hierarchies from the start, time intelligence calculations become inconsistent. What looks like a minor shortcut early in delivery becomes a recurring correction later.
Financial reports introduce additional complexity. Developers often embed sign inversion logic directly into DAX to make expenses appear negative.
This works. But it mixes calculation logic with presentation rules. Over time, formatting requirements—such as parentheses for negative values—become embedded in measures instead of handled at the display level.
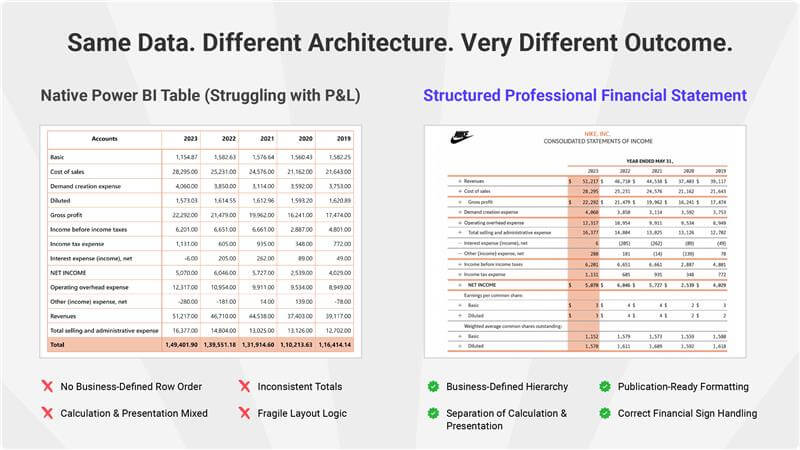
A useful rule of thumb: calculate in the model, present in the report. When calculation and presentation remain separated, models stay cleaner and easier to evolve.
Financial statements require specific row order and indentation. Native Power BI often requires helper columns to control layout.
Each column seems minor. Across dozens of reports, they accumulate. The semantic layer becomes harder to validate and sustain. The limitation is rarely capability. It is architectural placement.
Separating calculation logic from presentation logic does more than protect performance. It improves clarity. New developers can understand the model faster when business rules are not tangled with layout adjustments. Change becomes safer. Governance becomes more manageable.
Successful migrations recognize these distinctions early. Teams that make these decisions deliberately avoid the performance plateaus that often stall enterprise projects.
Q: How can BI leads identify architectural issues before they escalate?
A: Monitor dependency chains. If a base measure has dozens of downstream measures, the model is becoming fragile. Most performance issues are not isolated bugs. They are structural consequences of accumulated logic.
Q: Is embedding logic in DAX ever unavoidable?
A: Yes. Dynamic Row-Level Security (RLS) and advanced Calculation Groups belong in DAX. The goal is not to minimize DAX usage, but to ensure DAX handles calculation—not formatting or layout.
Q: What is the most common model risk in enterprise migrations?
A: Helper column sprawl. Individually, these columns appear harmless. At scale, they increase model size, reduce compression efficiency, and degrade refresh performance.
These architectural tradeoffs deserve deeper exploration. In our upcoming masterclass, we will move from principle to practice—examining how to apply these patterns in active migration projects.
Planning a Power BI migration?
If you're migrating reports from SAP BusinessObjects, Cognos, Tableau, or Qlik to Power BI, join the upcoming Power BI Migration Masterclass to learn the modeling decisions and architecture patterns that help teams avoid performance issues and long-term complexity.
Register Here: [Power BI Migration Masterclass: Fixing Modeling & Rebuild Challenges]

Inforiver helps enterprises consolidate planning, reporting & analytics on a single platform (Power BI). The no-code, self-service award-winning platform has been recognized as the industry’s best and is adopted by many Fortune 100 firms.
Inforiver is a product of Lumel, the #1 Power BI AppSource Partner. The firm serves over 3,000 customers worldwide through its portfolio of products offered under the brands Inforiver, EDITable, ValQ, and xViz.