Upcoming webinar on 'Inforiver Charts : The fastest way to deliver stories in Power BI', Aug 29th , Monday, 10.30 AM CST. Register Now
Upcoming webinar on 'Inforiver Charts : The fastest way to deliver stories in Power BI', Aug 29th , Monday, 10.30 AM CST. Register Now
Welcome to the Inforiver Enterprise 2.9.5 release update!
In this milestone release, we have introduced much-anticipated features like column aggregation, the ability to import Excel files, and context awareness for data inputs. We also have numerous enhancements across writeback, forecasting, aggregation, built-in formulae, and the admin console. Discover the innovations driving our product as we continue delivering features most anticipated by the Inforiver community. Thank you for choosing Inforiver!
Feel free to explore the sections that interest you.
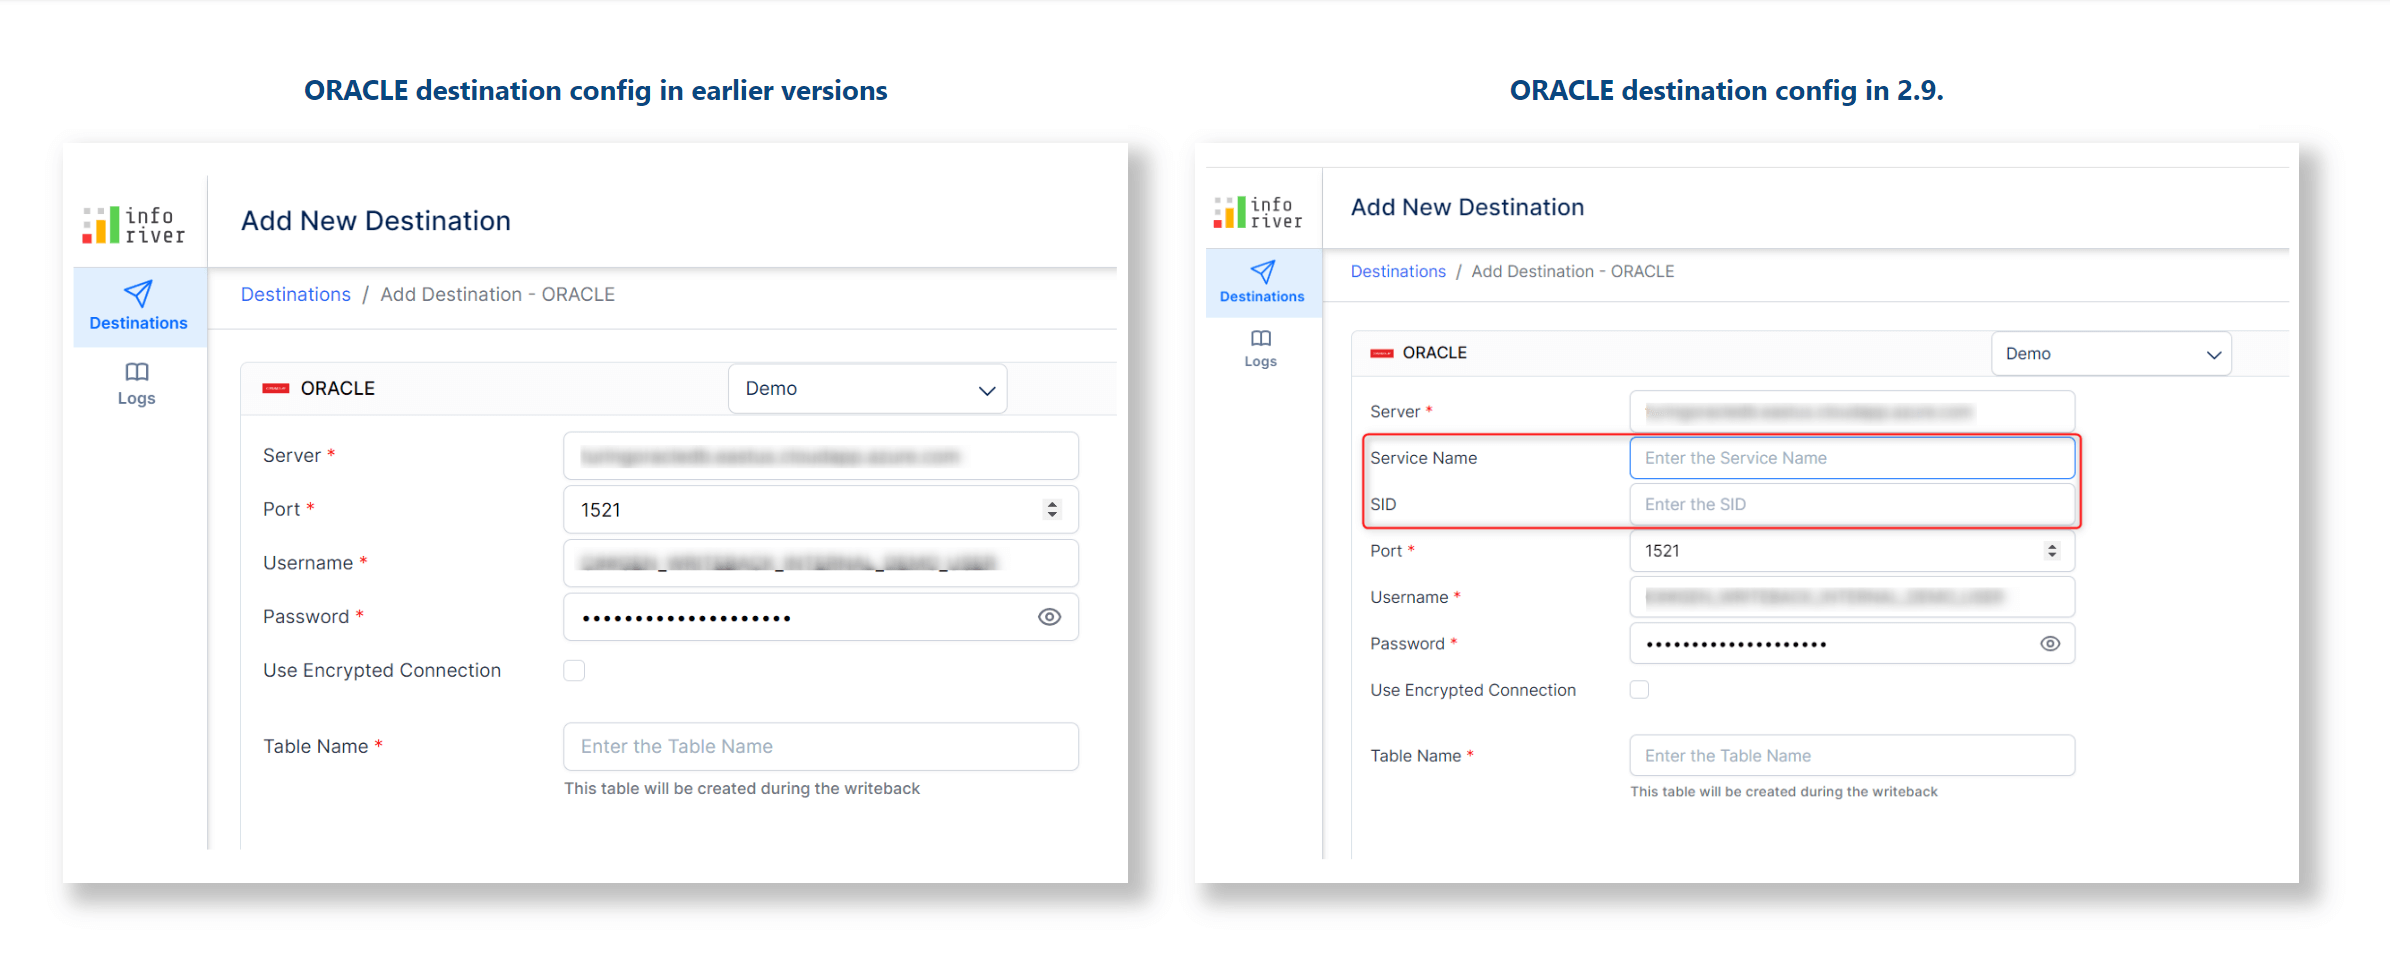
1.1. SID and service name for Oracle destinations
1.2. Additional information in the log console
1.4. Auto-writeback for derived data input fields
1.5. Writeback destination structure changes
2.1. Context awareness for data input measures
2.2. Context awareness for writing back data input fields
2.3. Import from file option for numeric data input
3.1. Import from file option for forecast values
5.1. Custom column aggregation
6.2. Reference data input visual columns in visual measures
8.1. Reference bookmark names in the export file name
8.2. Dynamic size adjustment in preview based on number of rows
8.3. Hourly refresh option for on-prem users
8.4. On-prem users – generate ad-hoc builds
8.6. Support for tabloid page size
8.7. Build details in admin console
8.8. Additional details captured in log files
Oracle databases can have multiple instances; for example, you can have an HR database that runs out of a server in Texas and another server in Arizona. During writeback, it is essential to specify which database instance to write back to. With the latest release, you can optionally specify the Oracle SID and Service name necessary to identify an instance of the database.
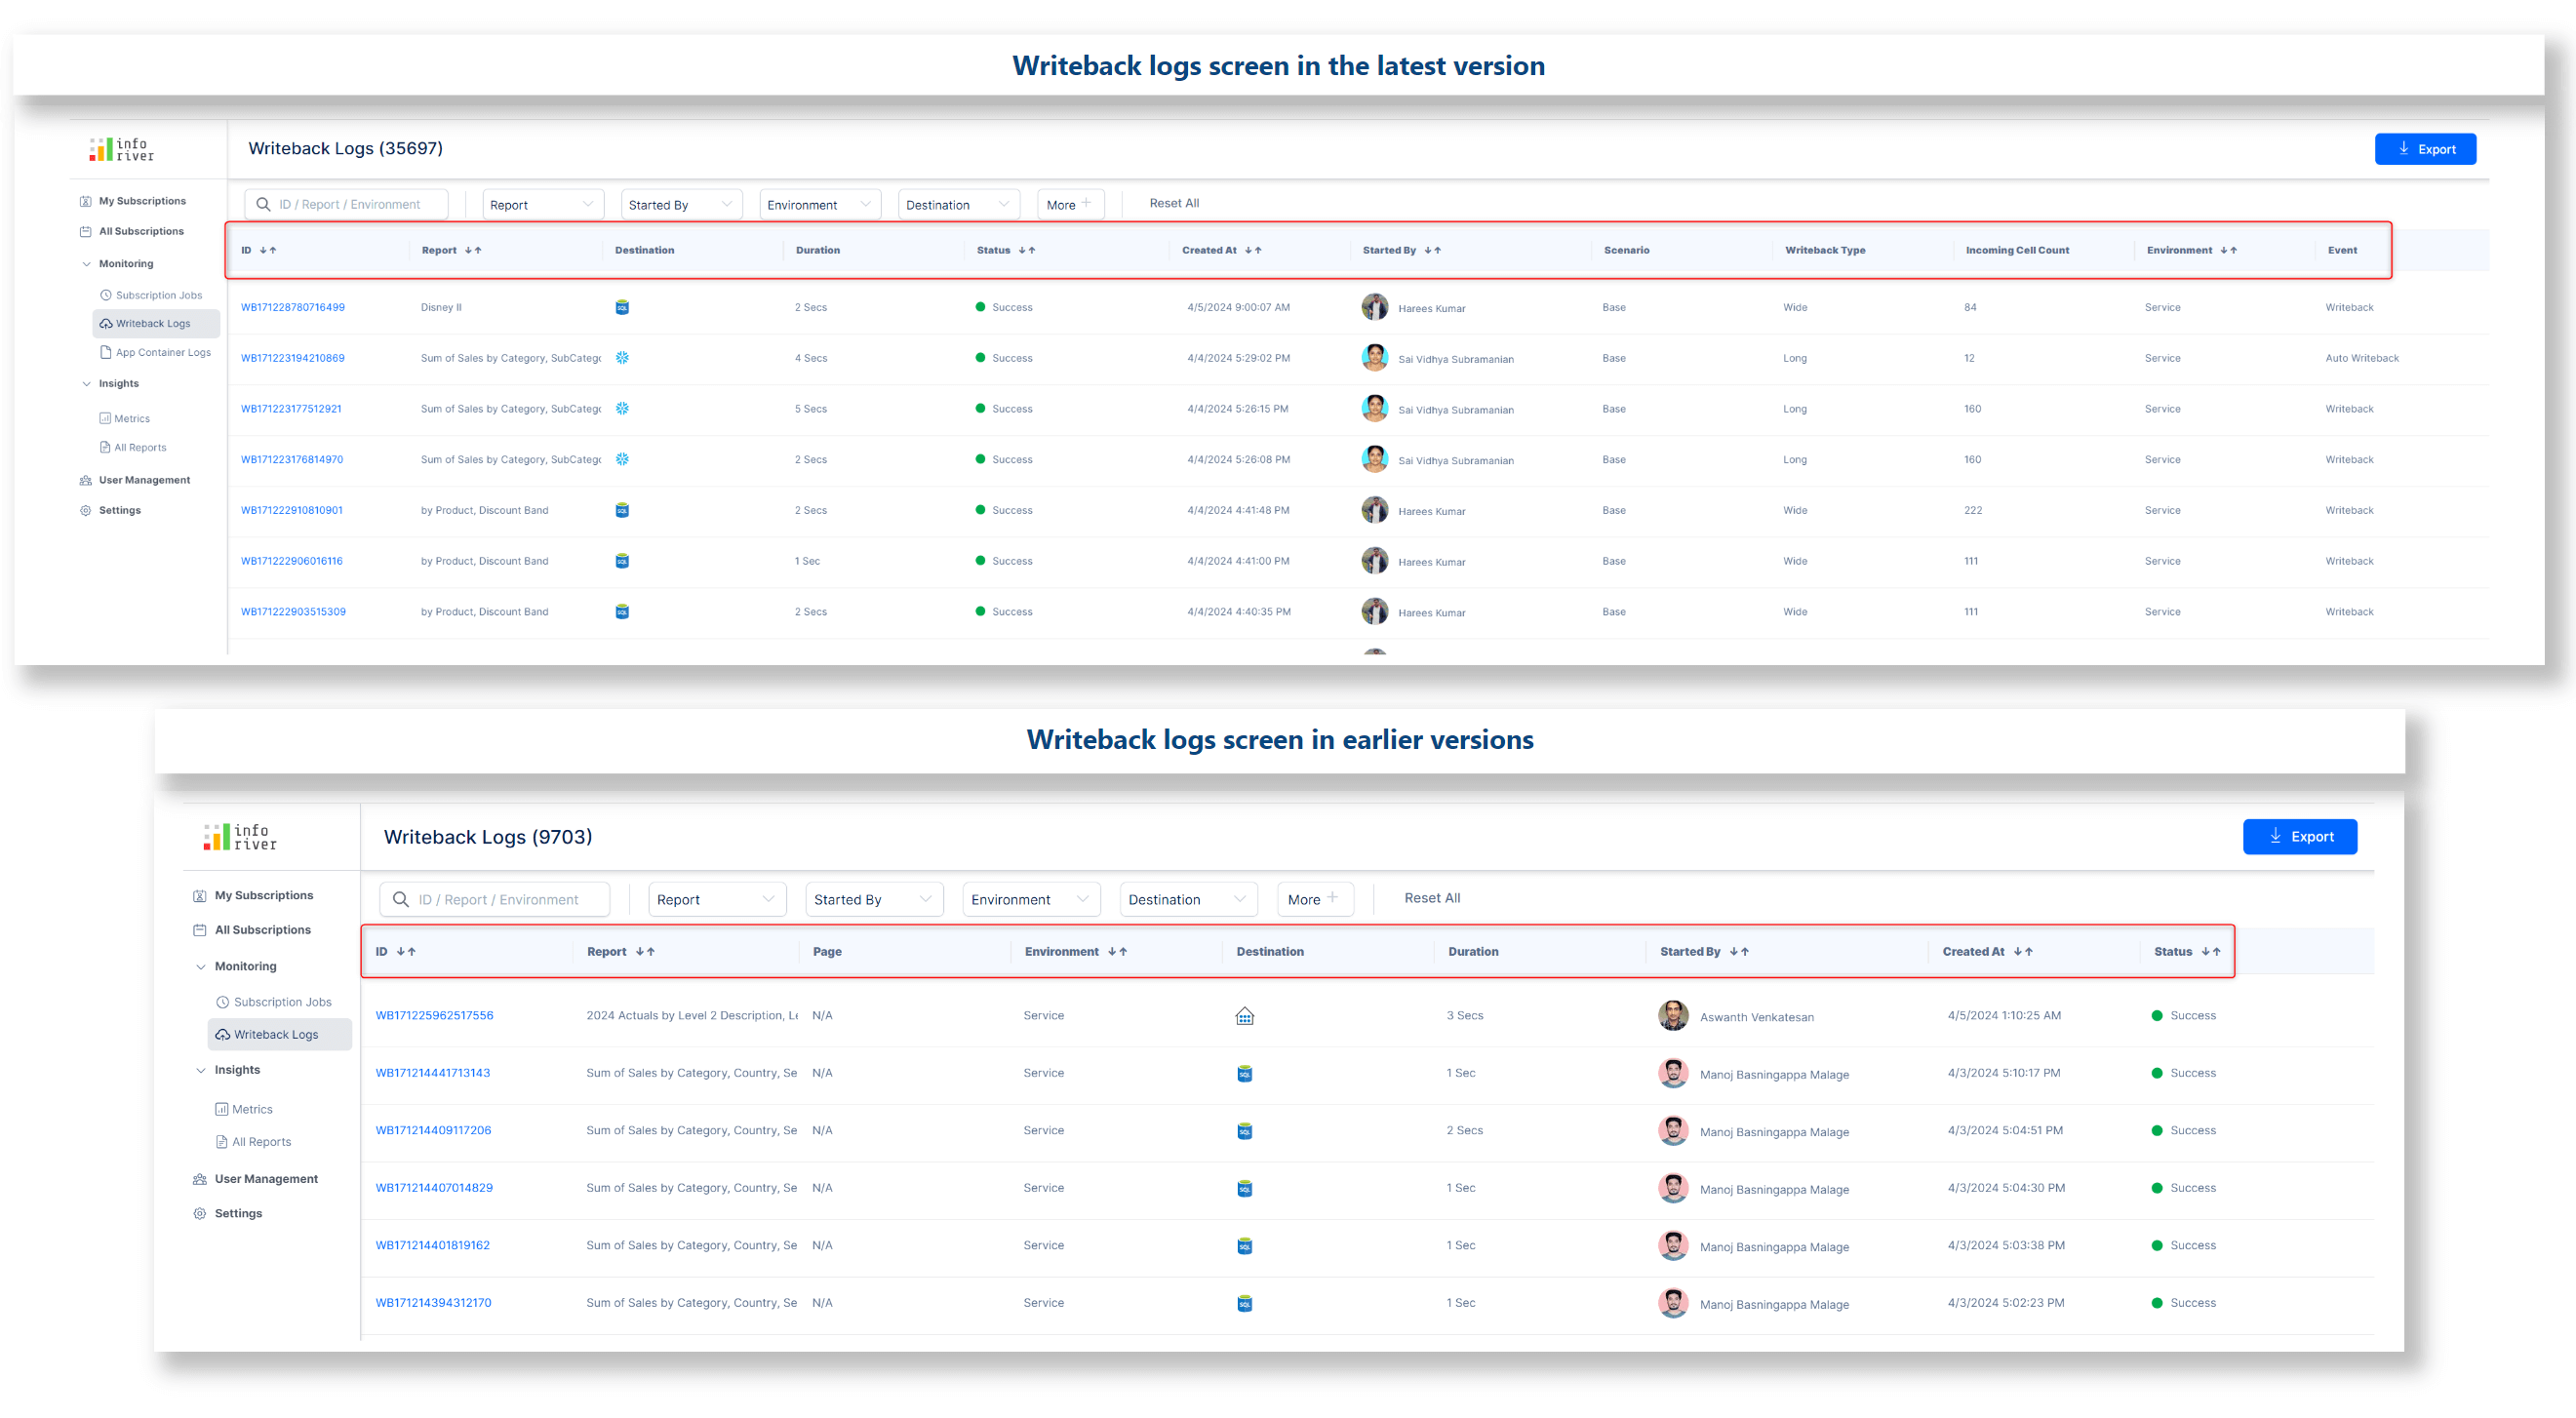
We’ve restructured the writeback logs screen and added additional fields like duration, scenario, and writeback type, enabling you to draw conclusions about the status, performance, and outcome of each writeback quickly.
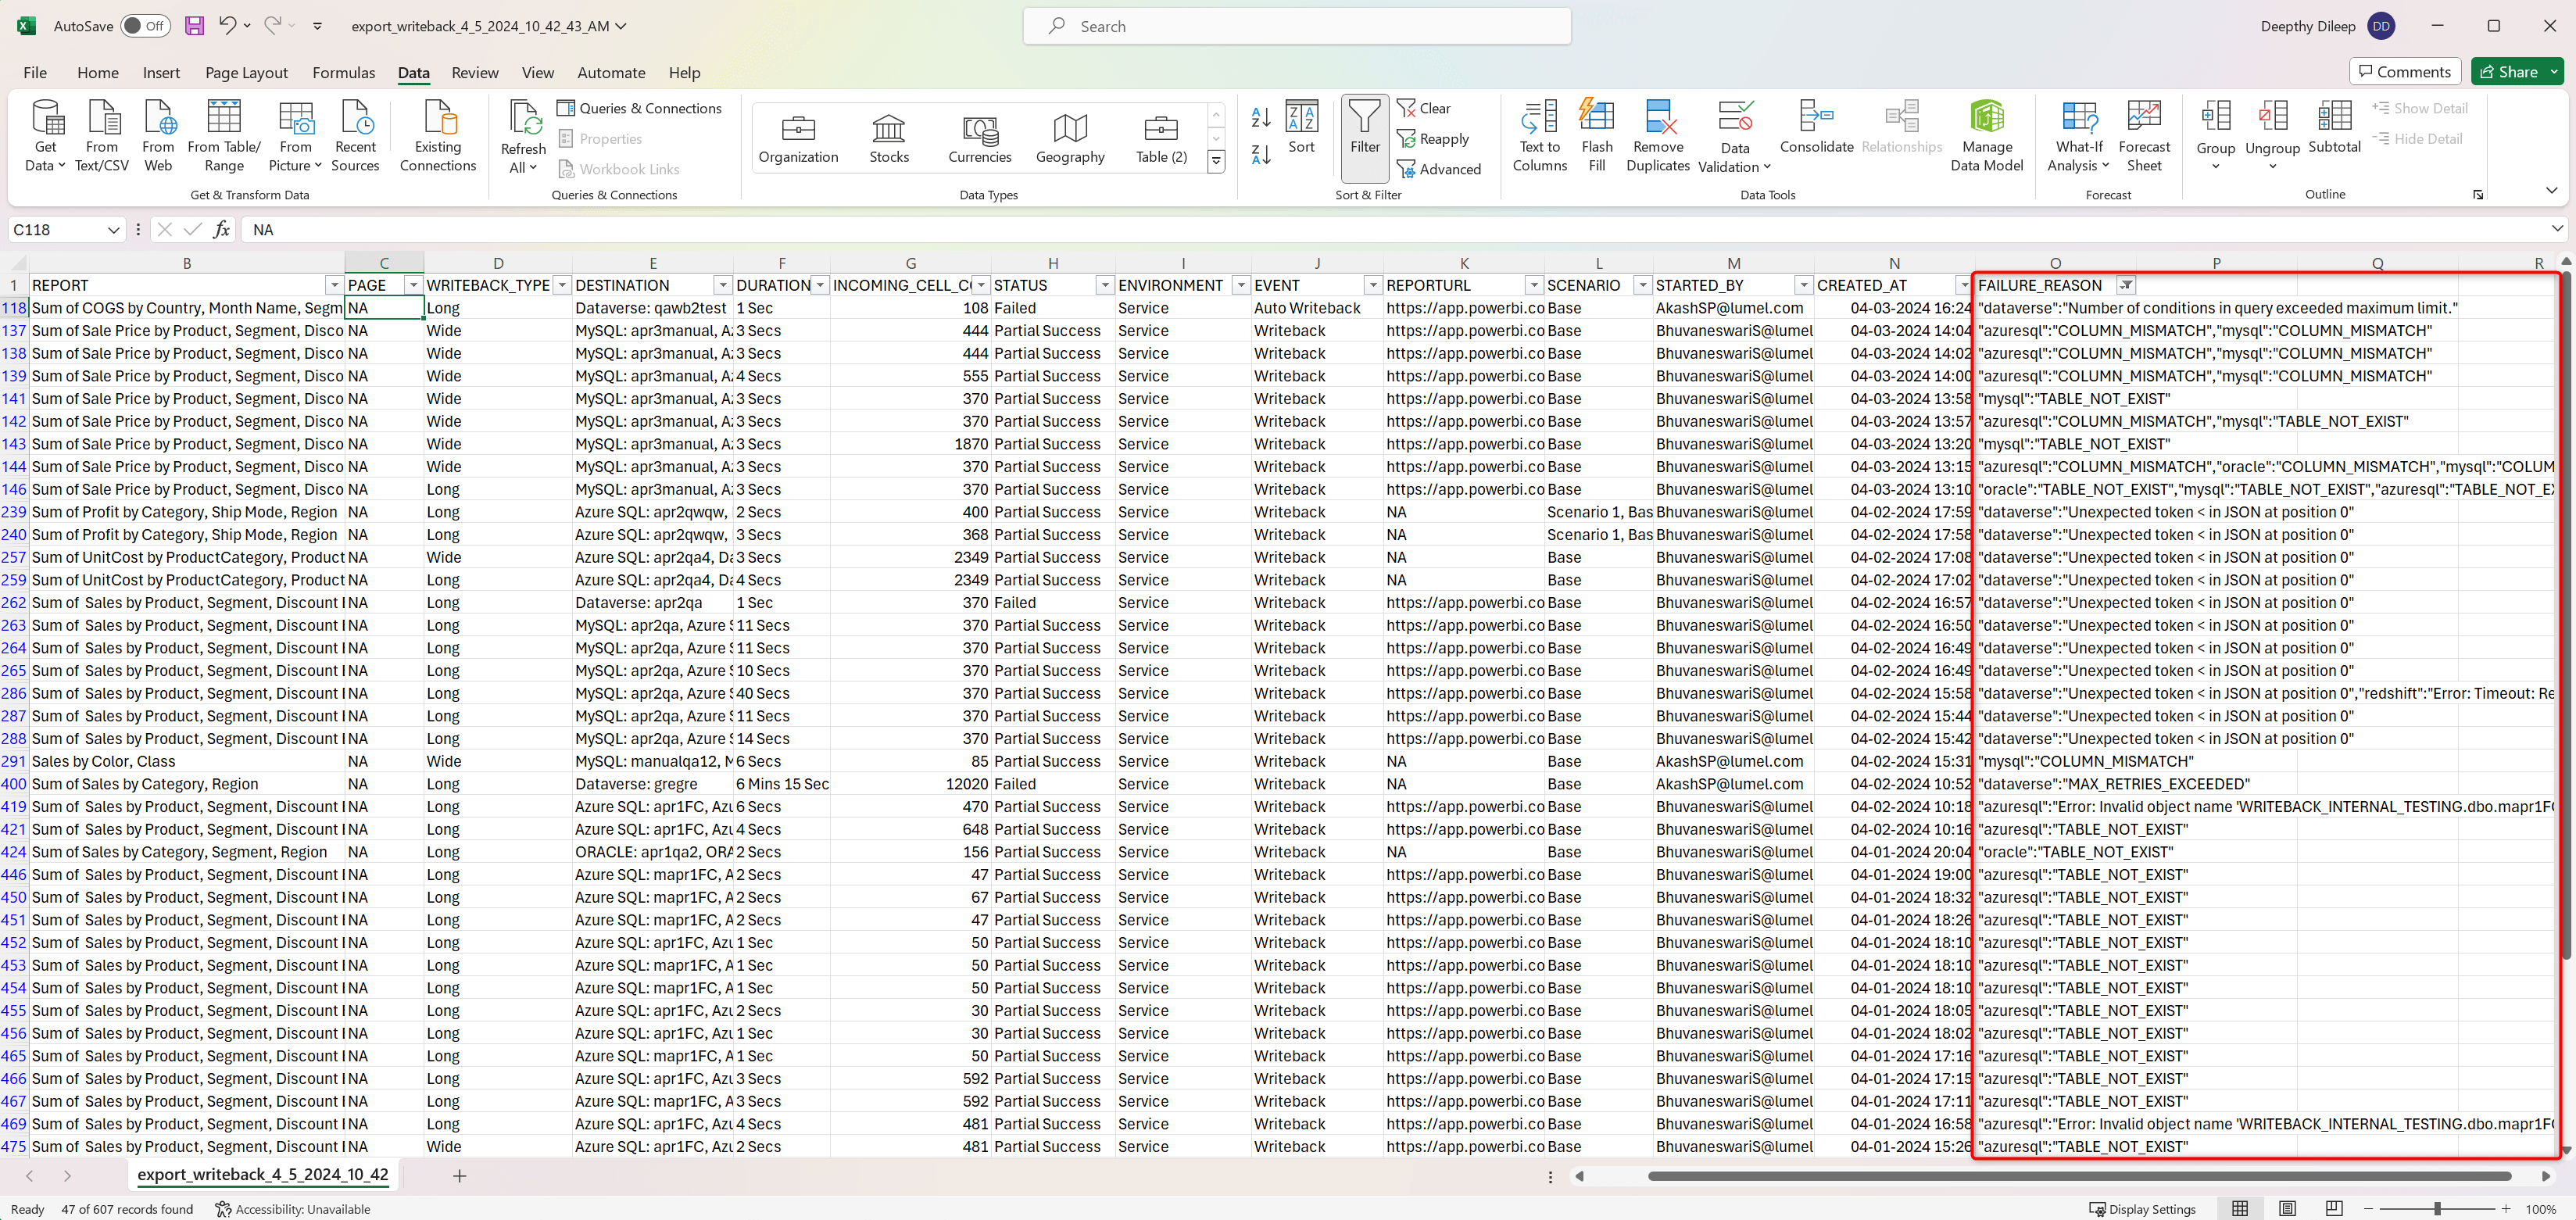
You can quickly root cause and debug writeback failures with the new Failure Reason column in the writeback log export.
It is common to have dependent columns in reports. The dependent field is driven based on the values of a data input field; any changes made to the data input field will impact the values of the dependent field.
Auto-writeback will now capture changes in derived fields as well. In earlier versions, changes to dependent fields would not be updated in the destination during auto writeback.
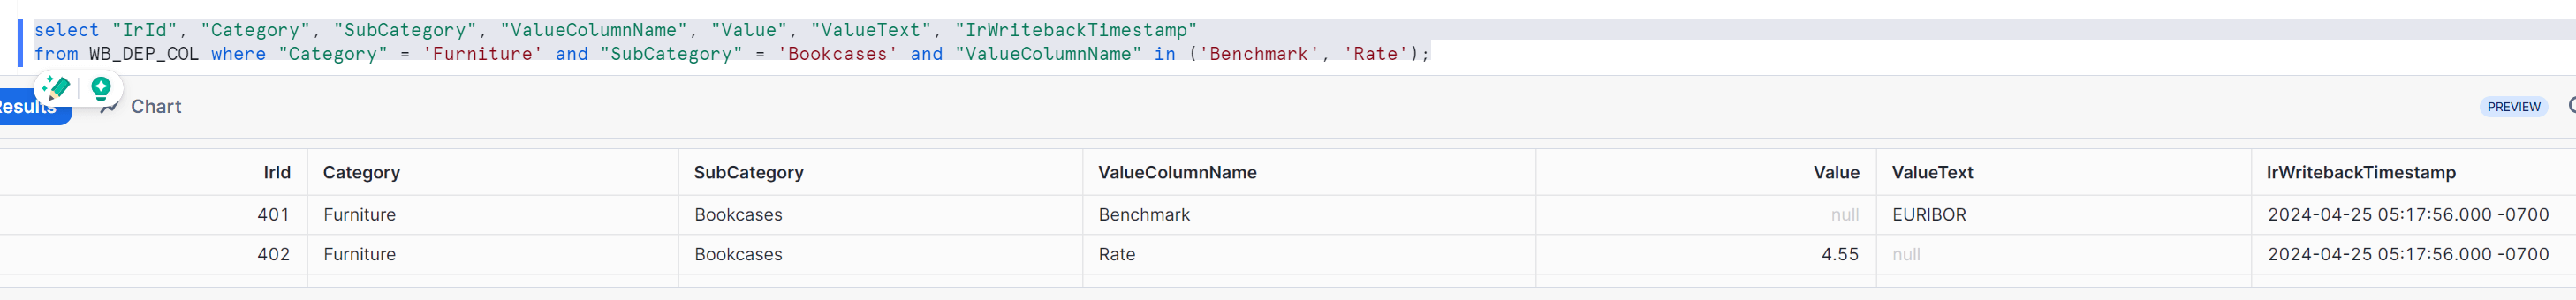
In this business case, we’ve derived the Rate based on the Benchmark, a data input text column.
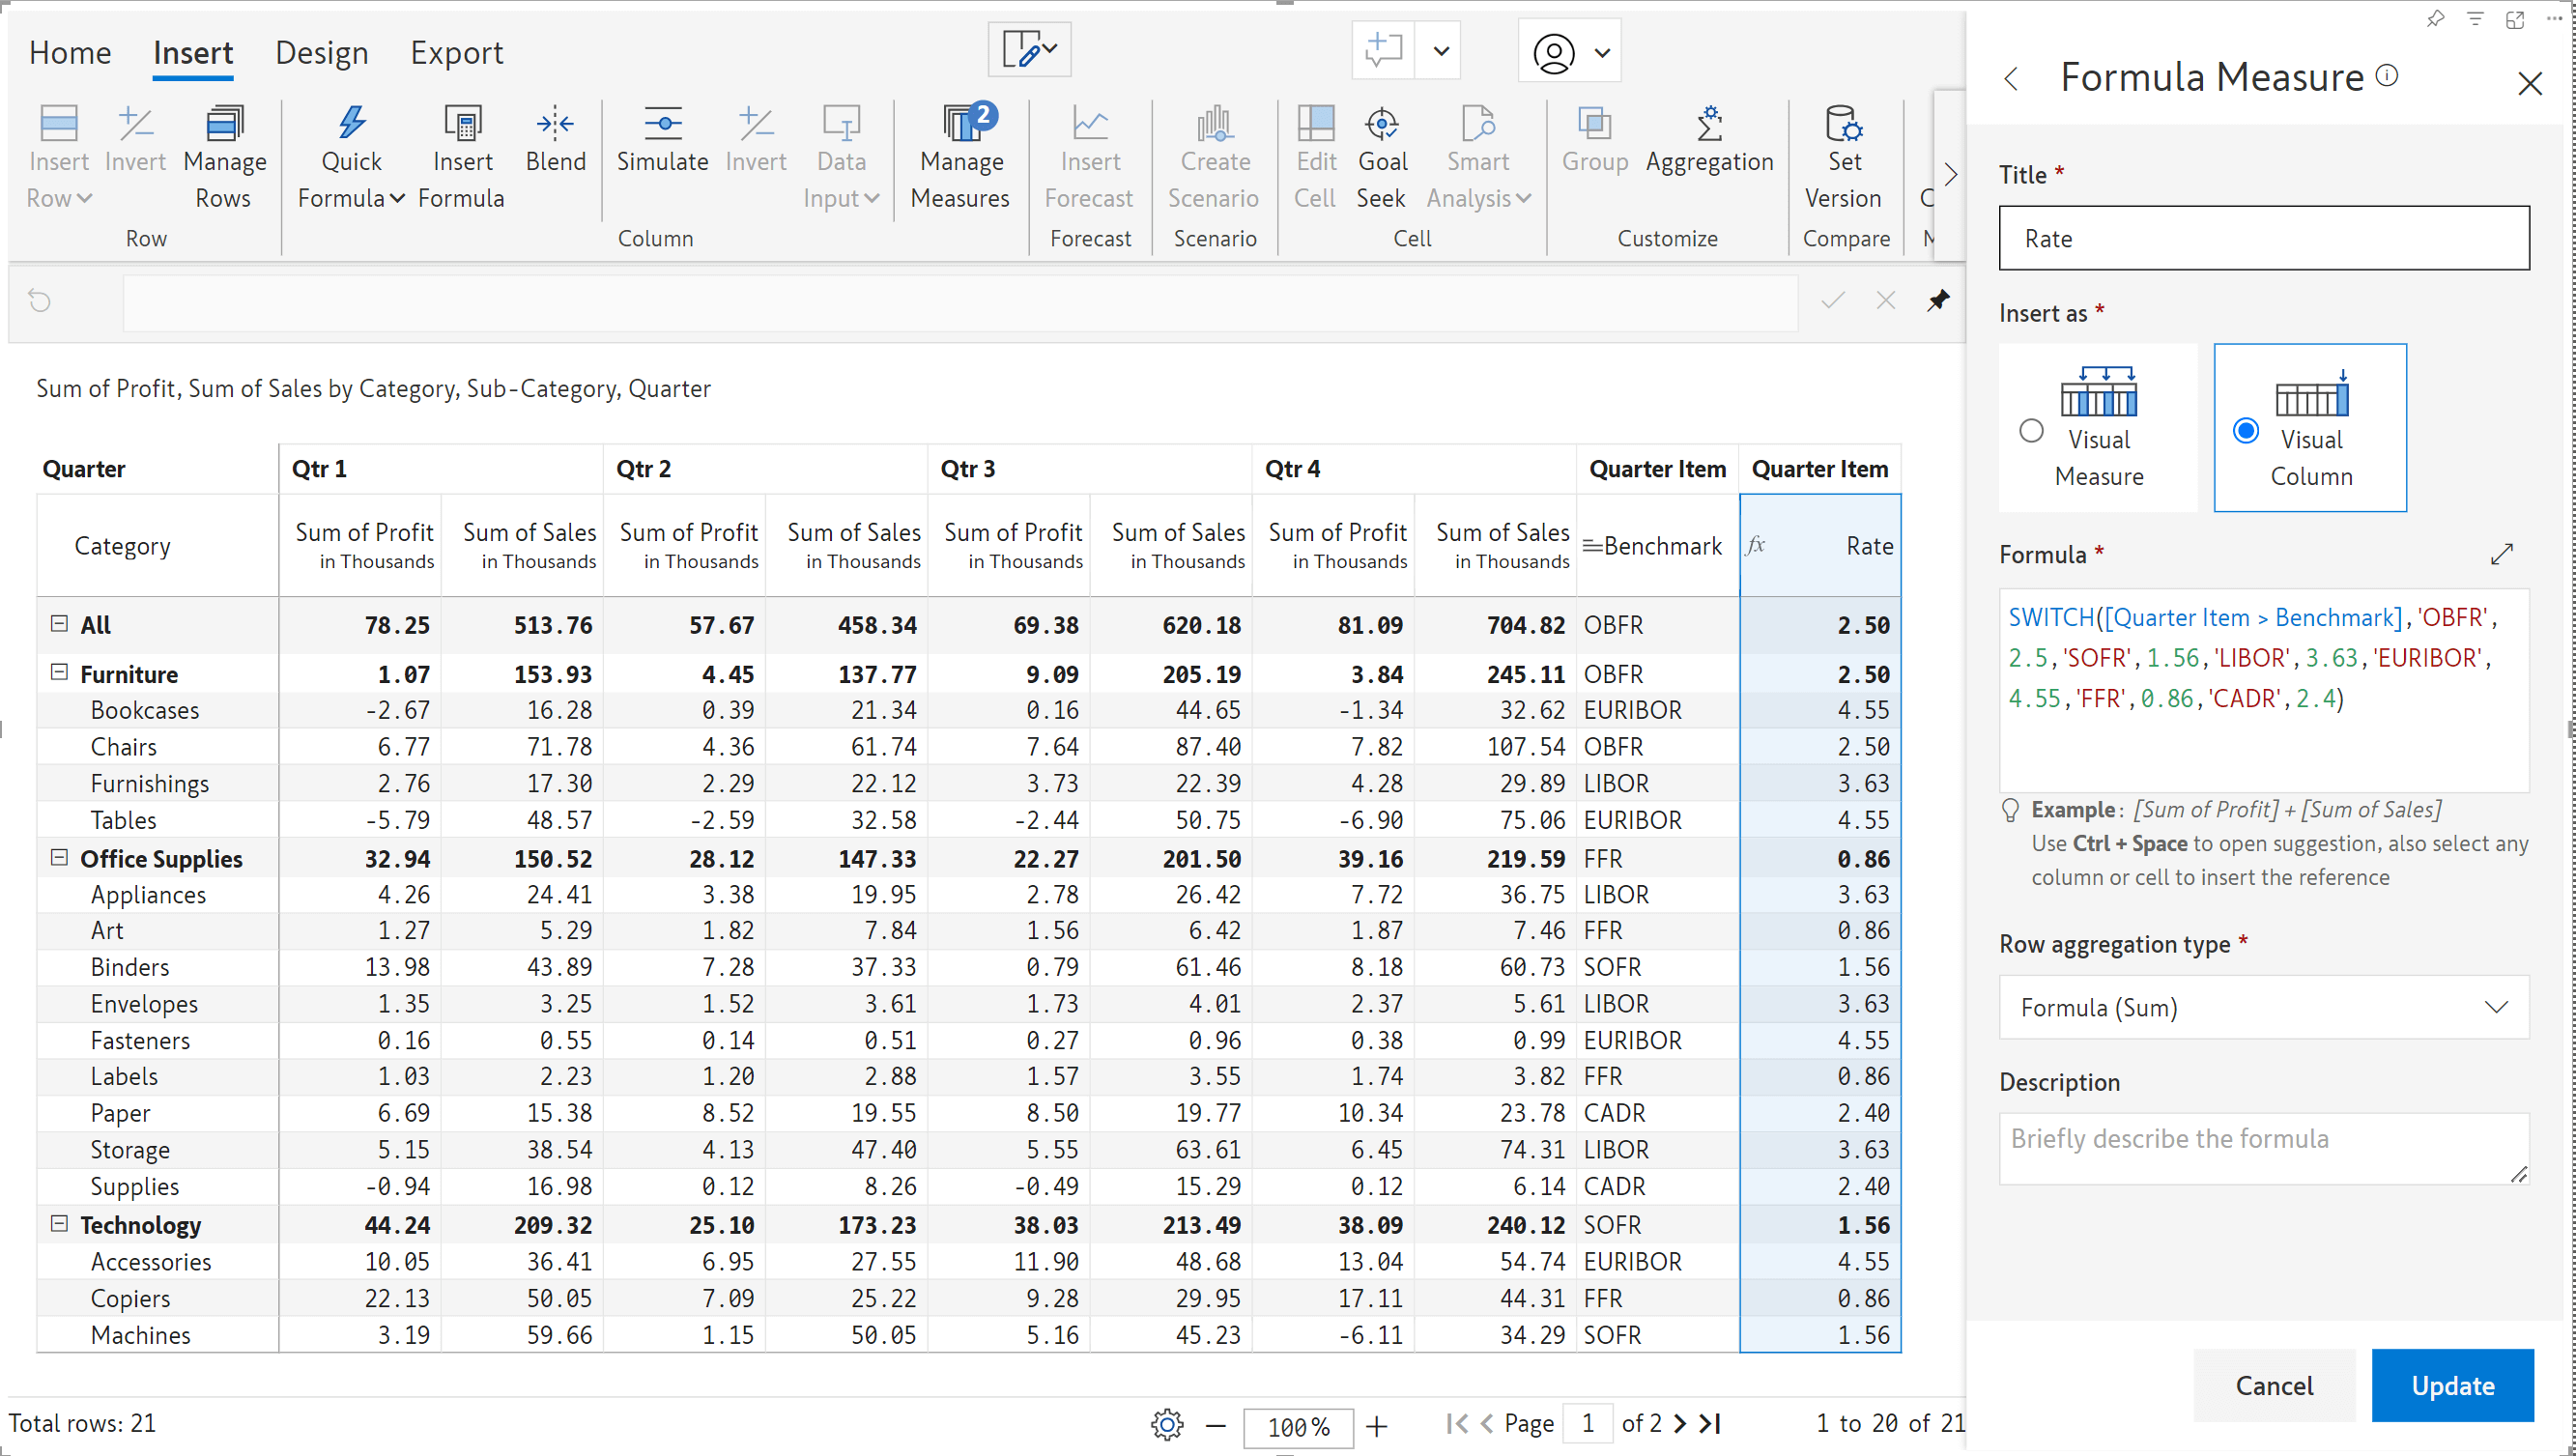
The benchmark for the Furniture row was updated from LIBOR’ to ‘EURIBOR’ and captured during auto-writeback. Notice how the change in rate was also automatically written back.
Initial value of LIBOR with the corresponding rate written back to the destination:
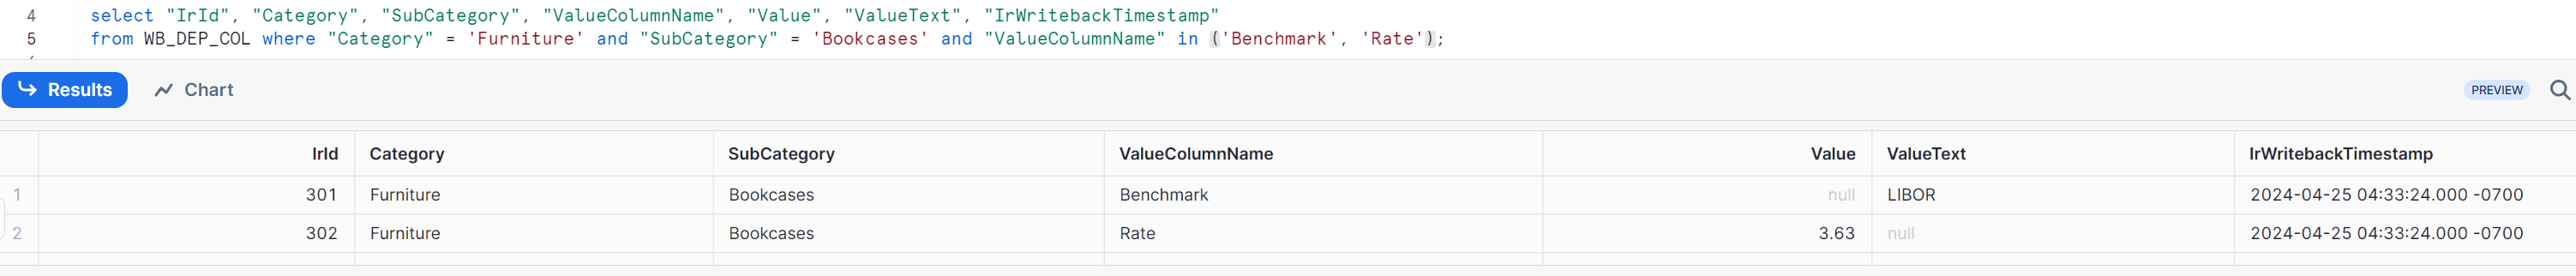
Updated benchmark value of EURIBOR with the dependent rate auto-written back to the destination:
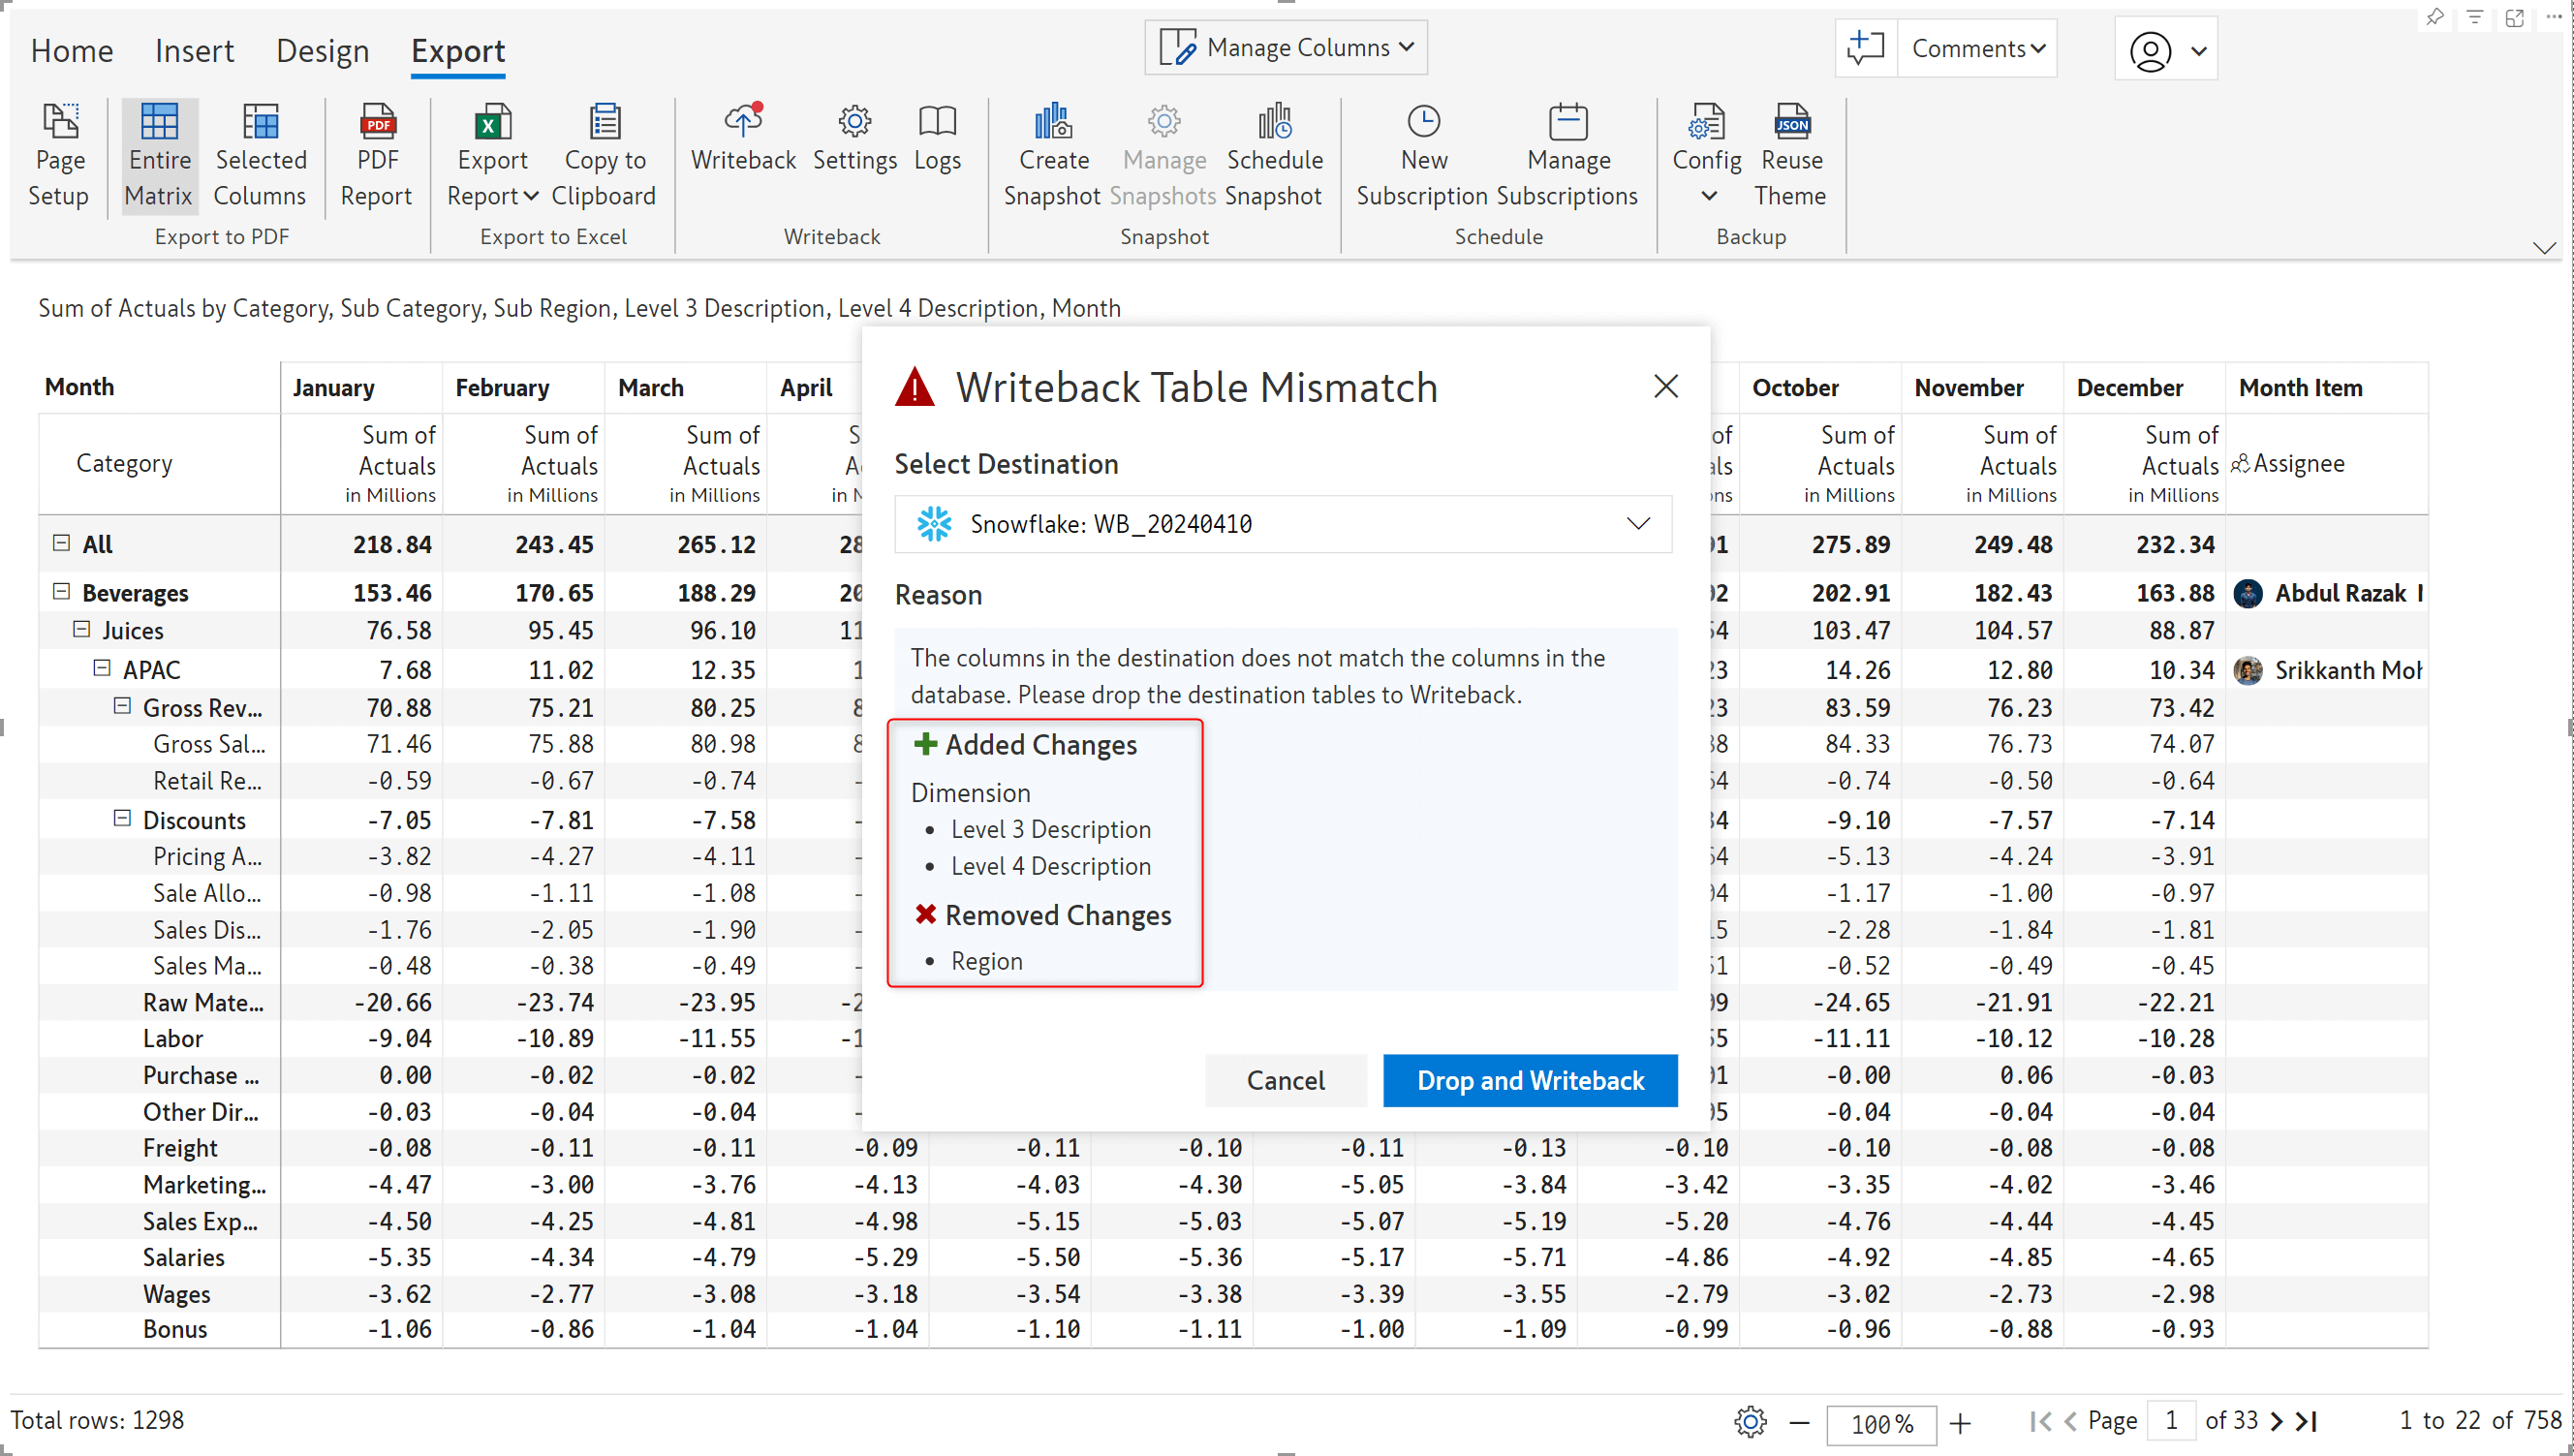
After performing an initial writeback, you may need to add or remove visual parameters as you build your report. Subsequent writebacks will capture any table structure changes required in the destination due to adding or removing visual parameters. The writeback table mismatch notification will now display the details of the fields that were added or removed.
The Inforiver visual is inherently context-aware, i.e., receptive to changes in external filters and slicers. With the latest release, even manual data entry fields like textboxes, dropdowns, or numeric input will be responsive to slicer selections. Notice how the data inputs change according to the filter selections in the gif below.
Note: When working with context awareness, you need to select a category(ies) in the external filters for writeback and data input to be enabled.
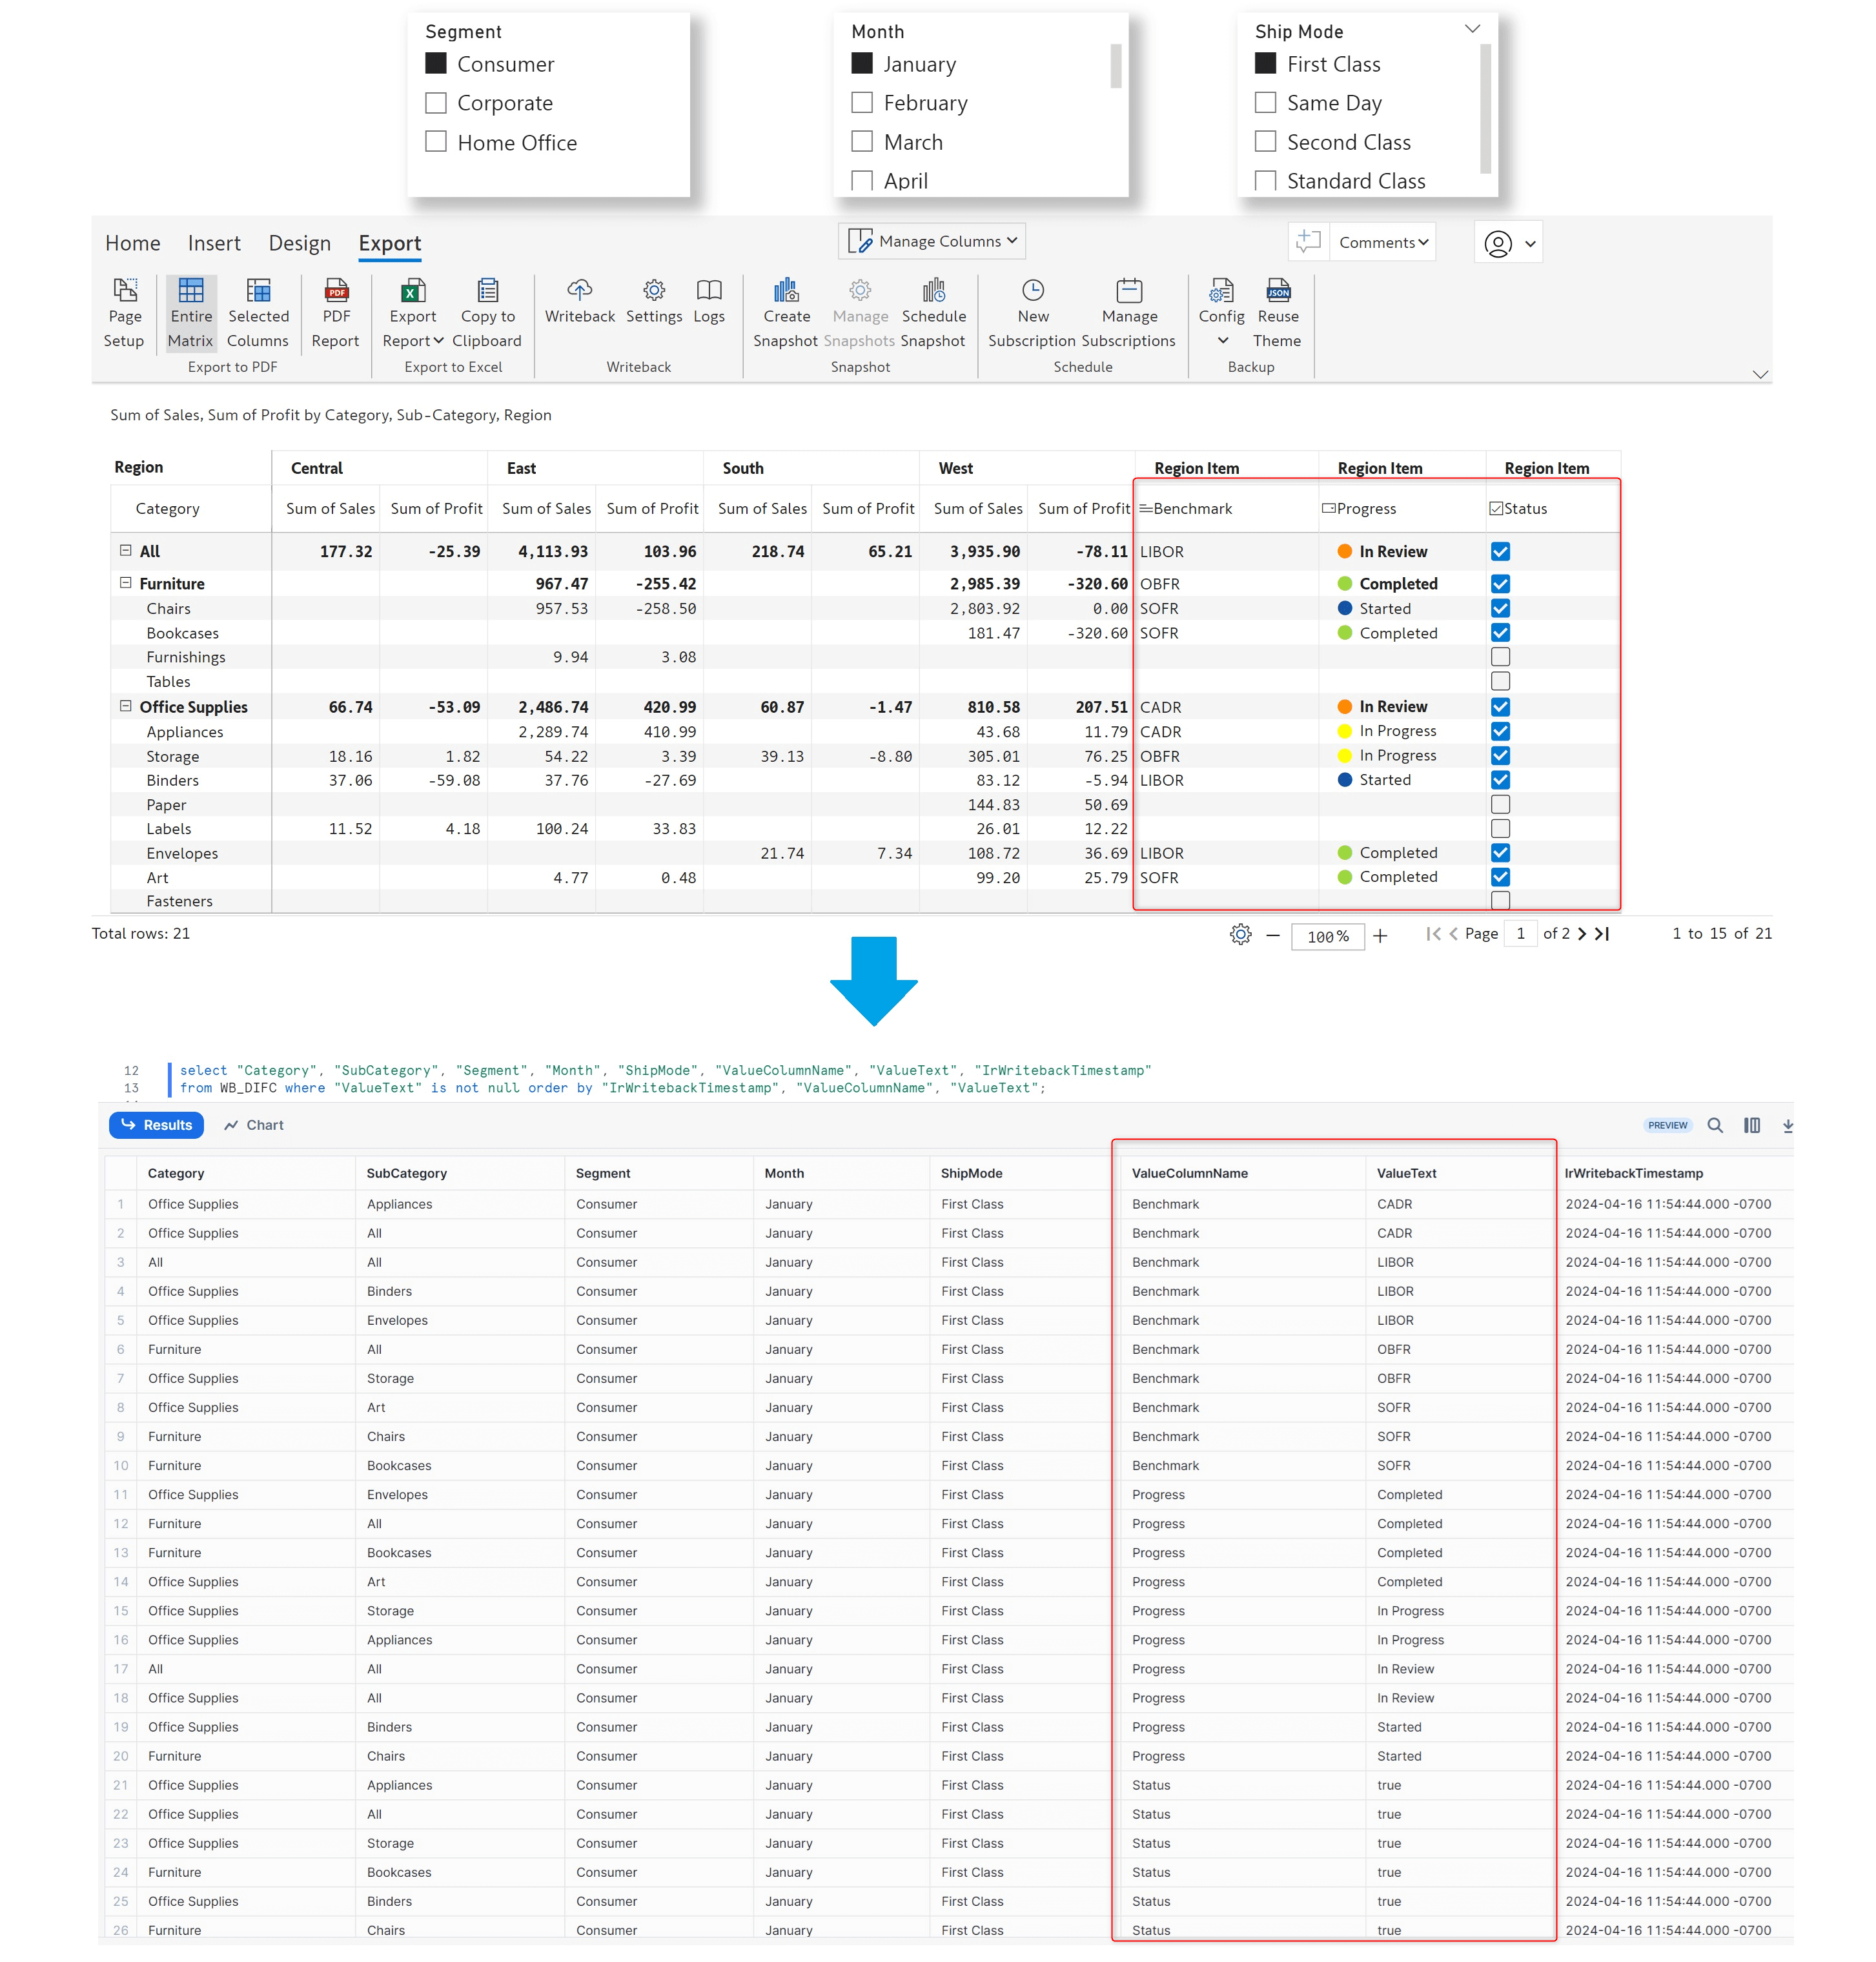
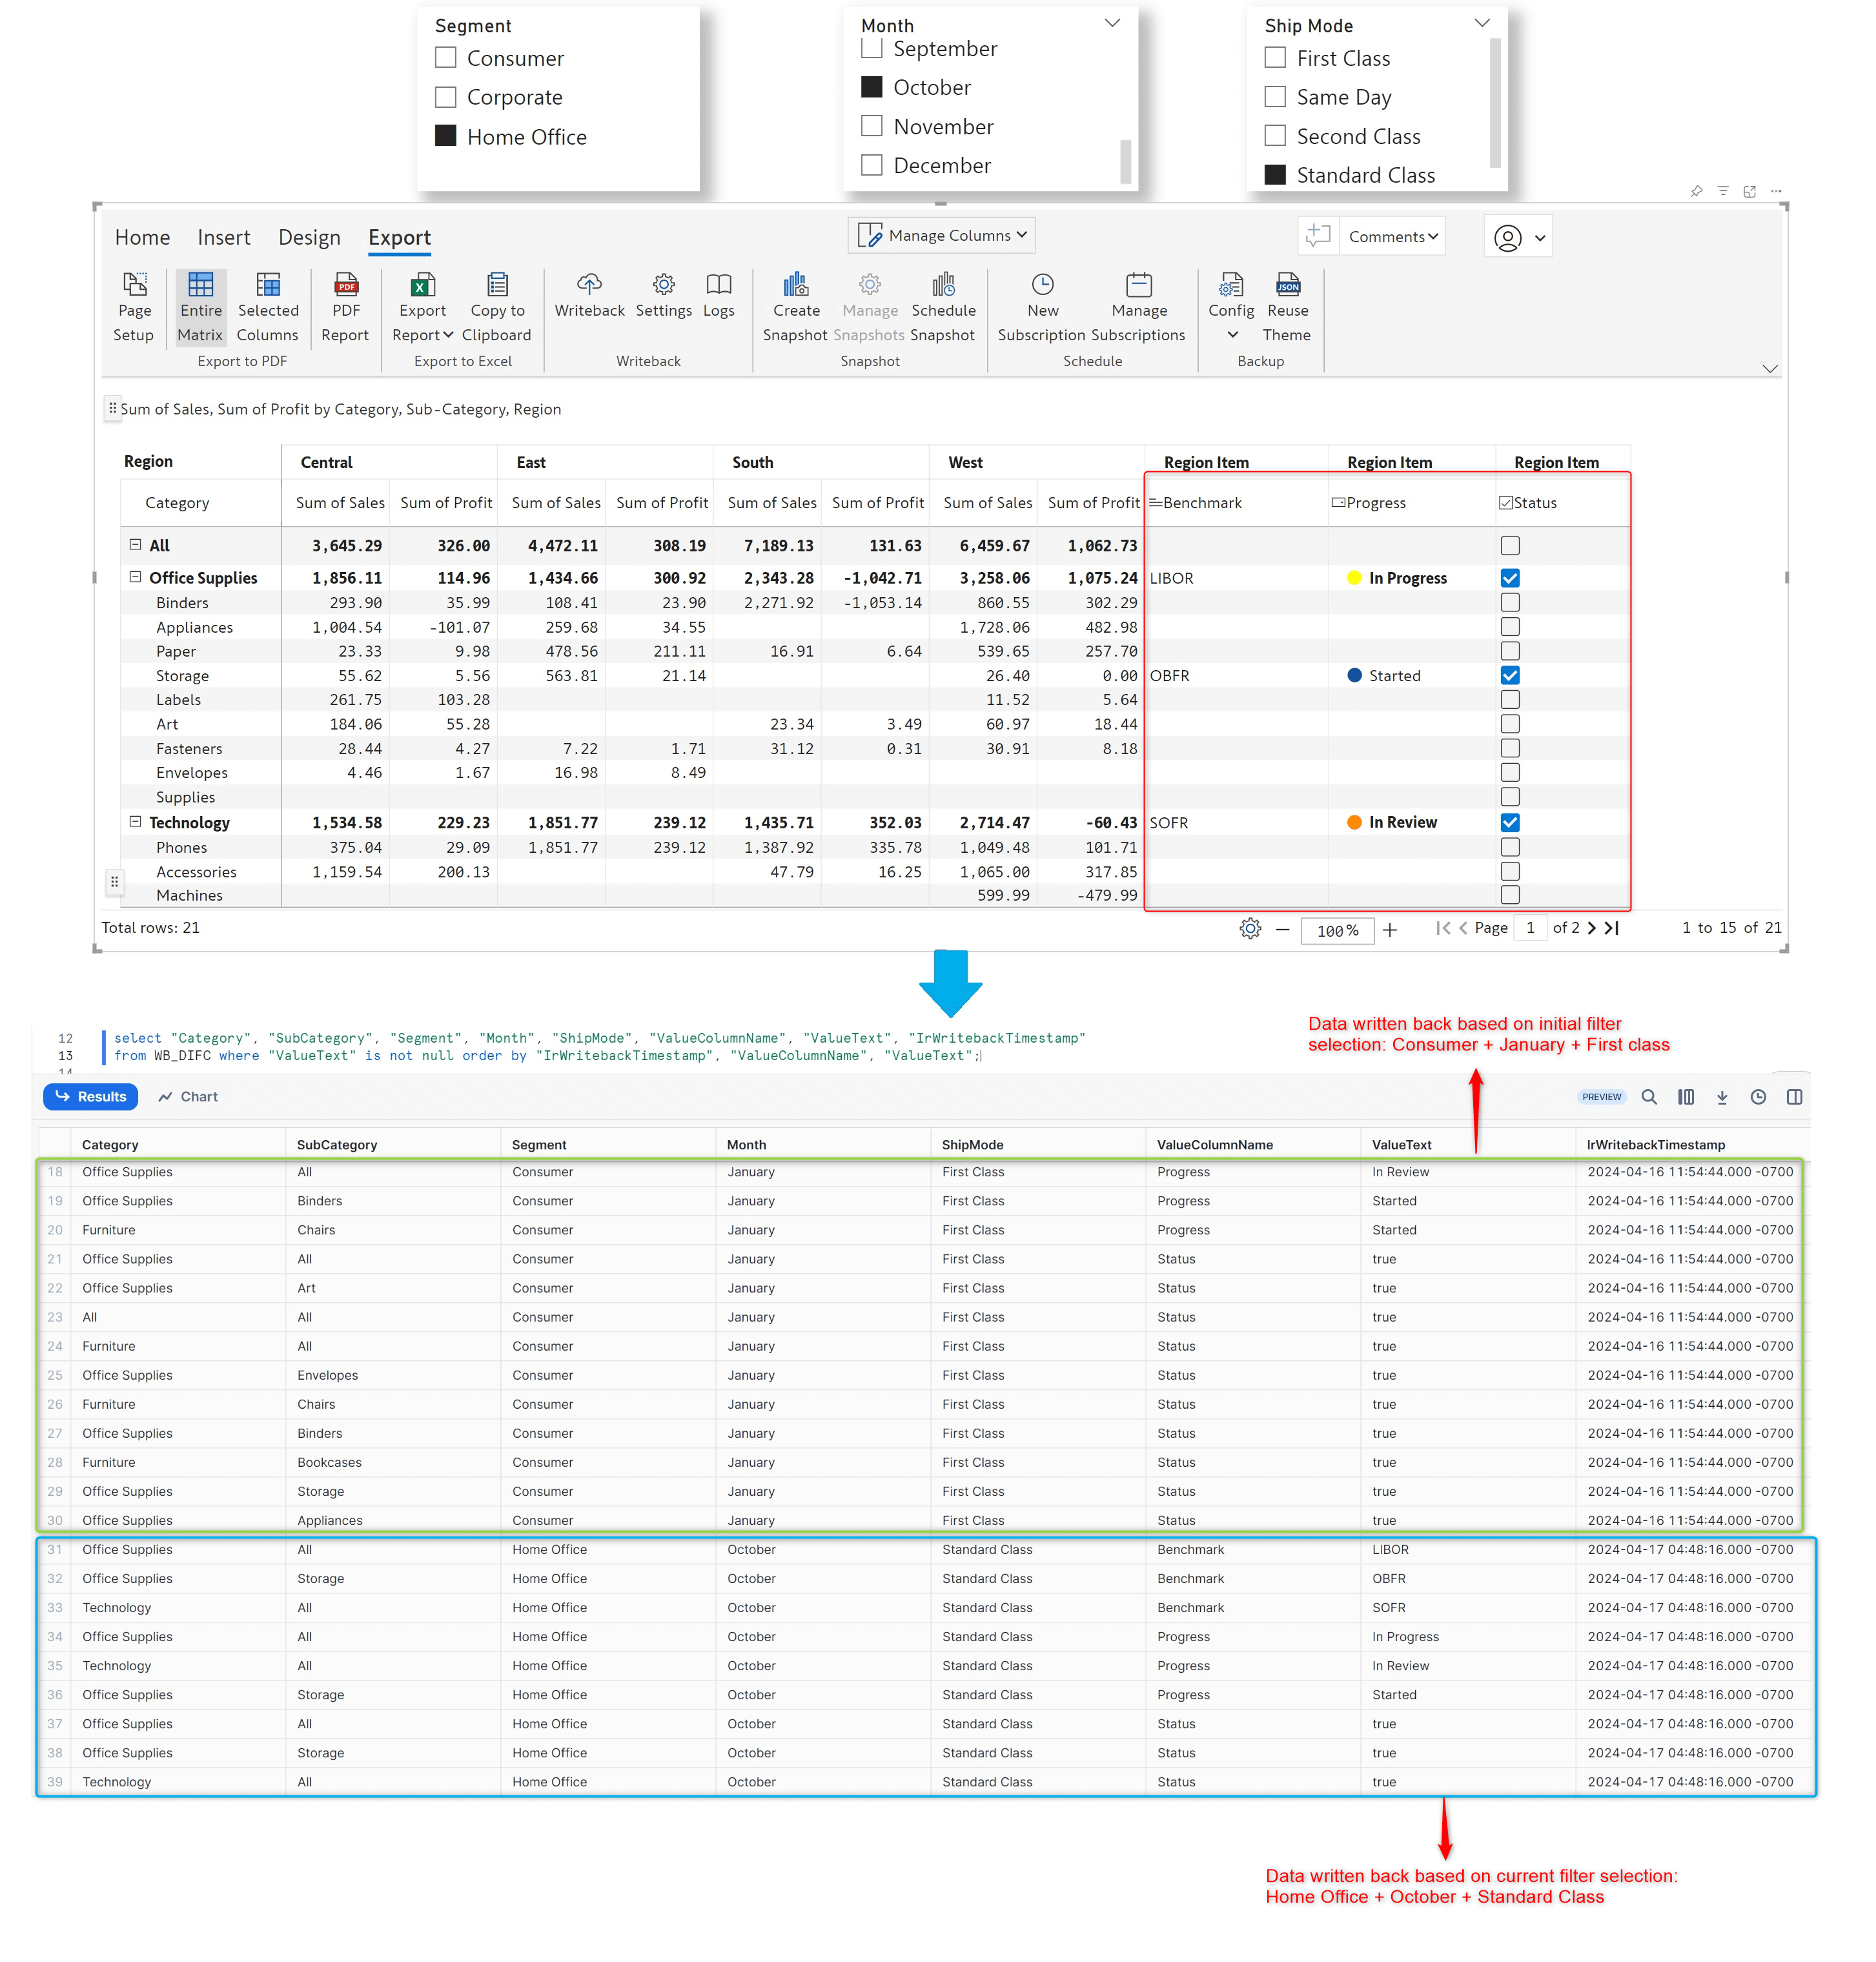
From the April release, data input writeback will also be responsive to external filters – you can use Power BI filters/slicers to select your writeback data. Only the data input cells corresponding to the filtered data will be captured during writeback. Notice how the data input for the Consumer + January + First Class selection has been written back to the Snowflake destination.
After changing the filter selection, the data input corresponding to the Home Office + October + Standard Class selection is written back. The data input fields for the changed filter selection are captured as separate rows in the destination.
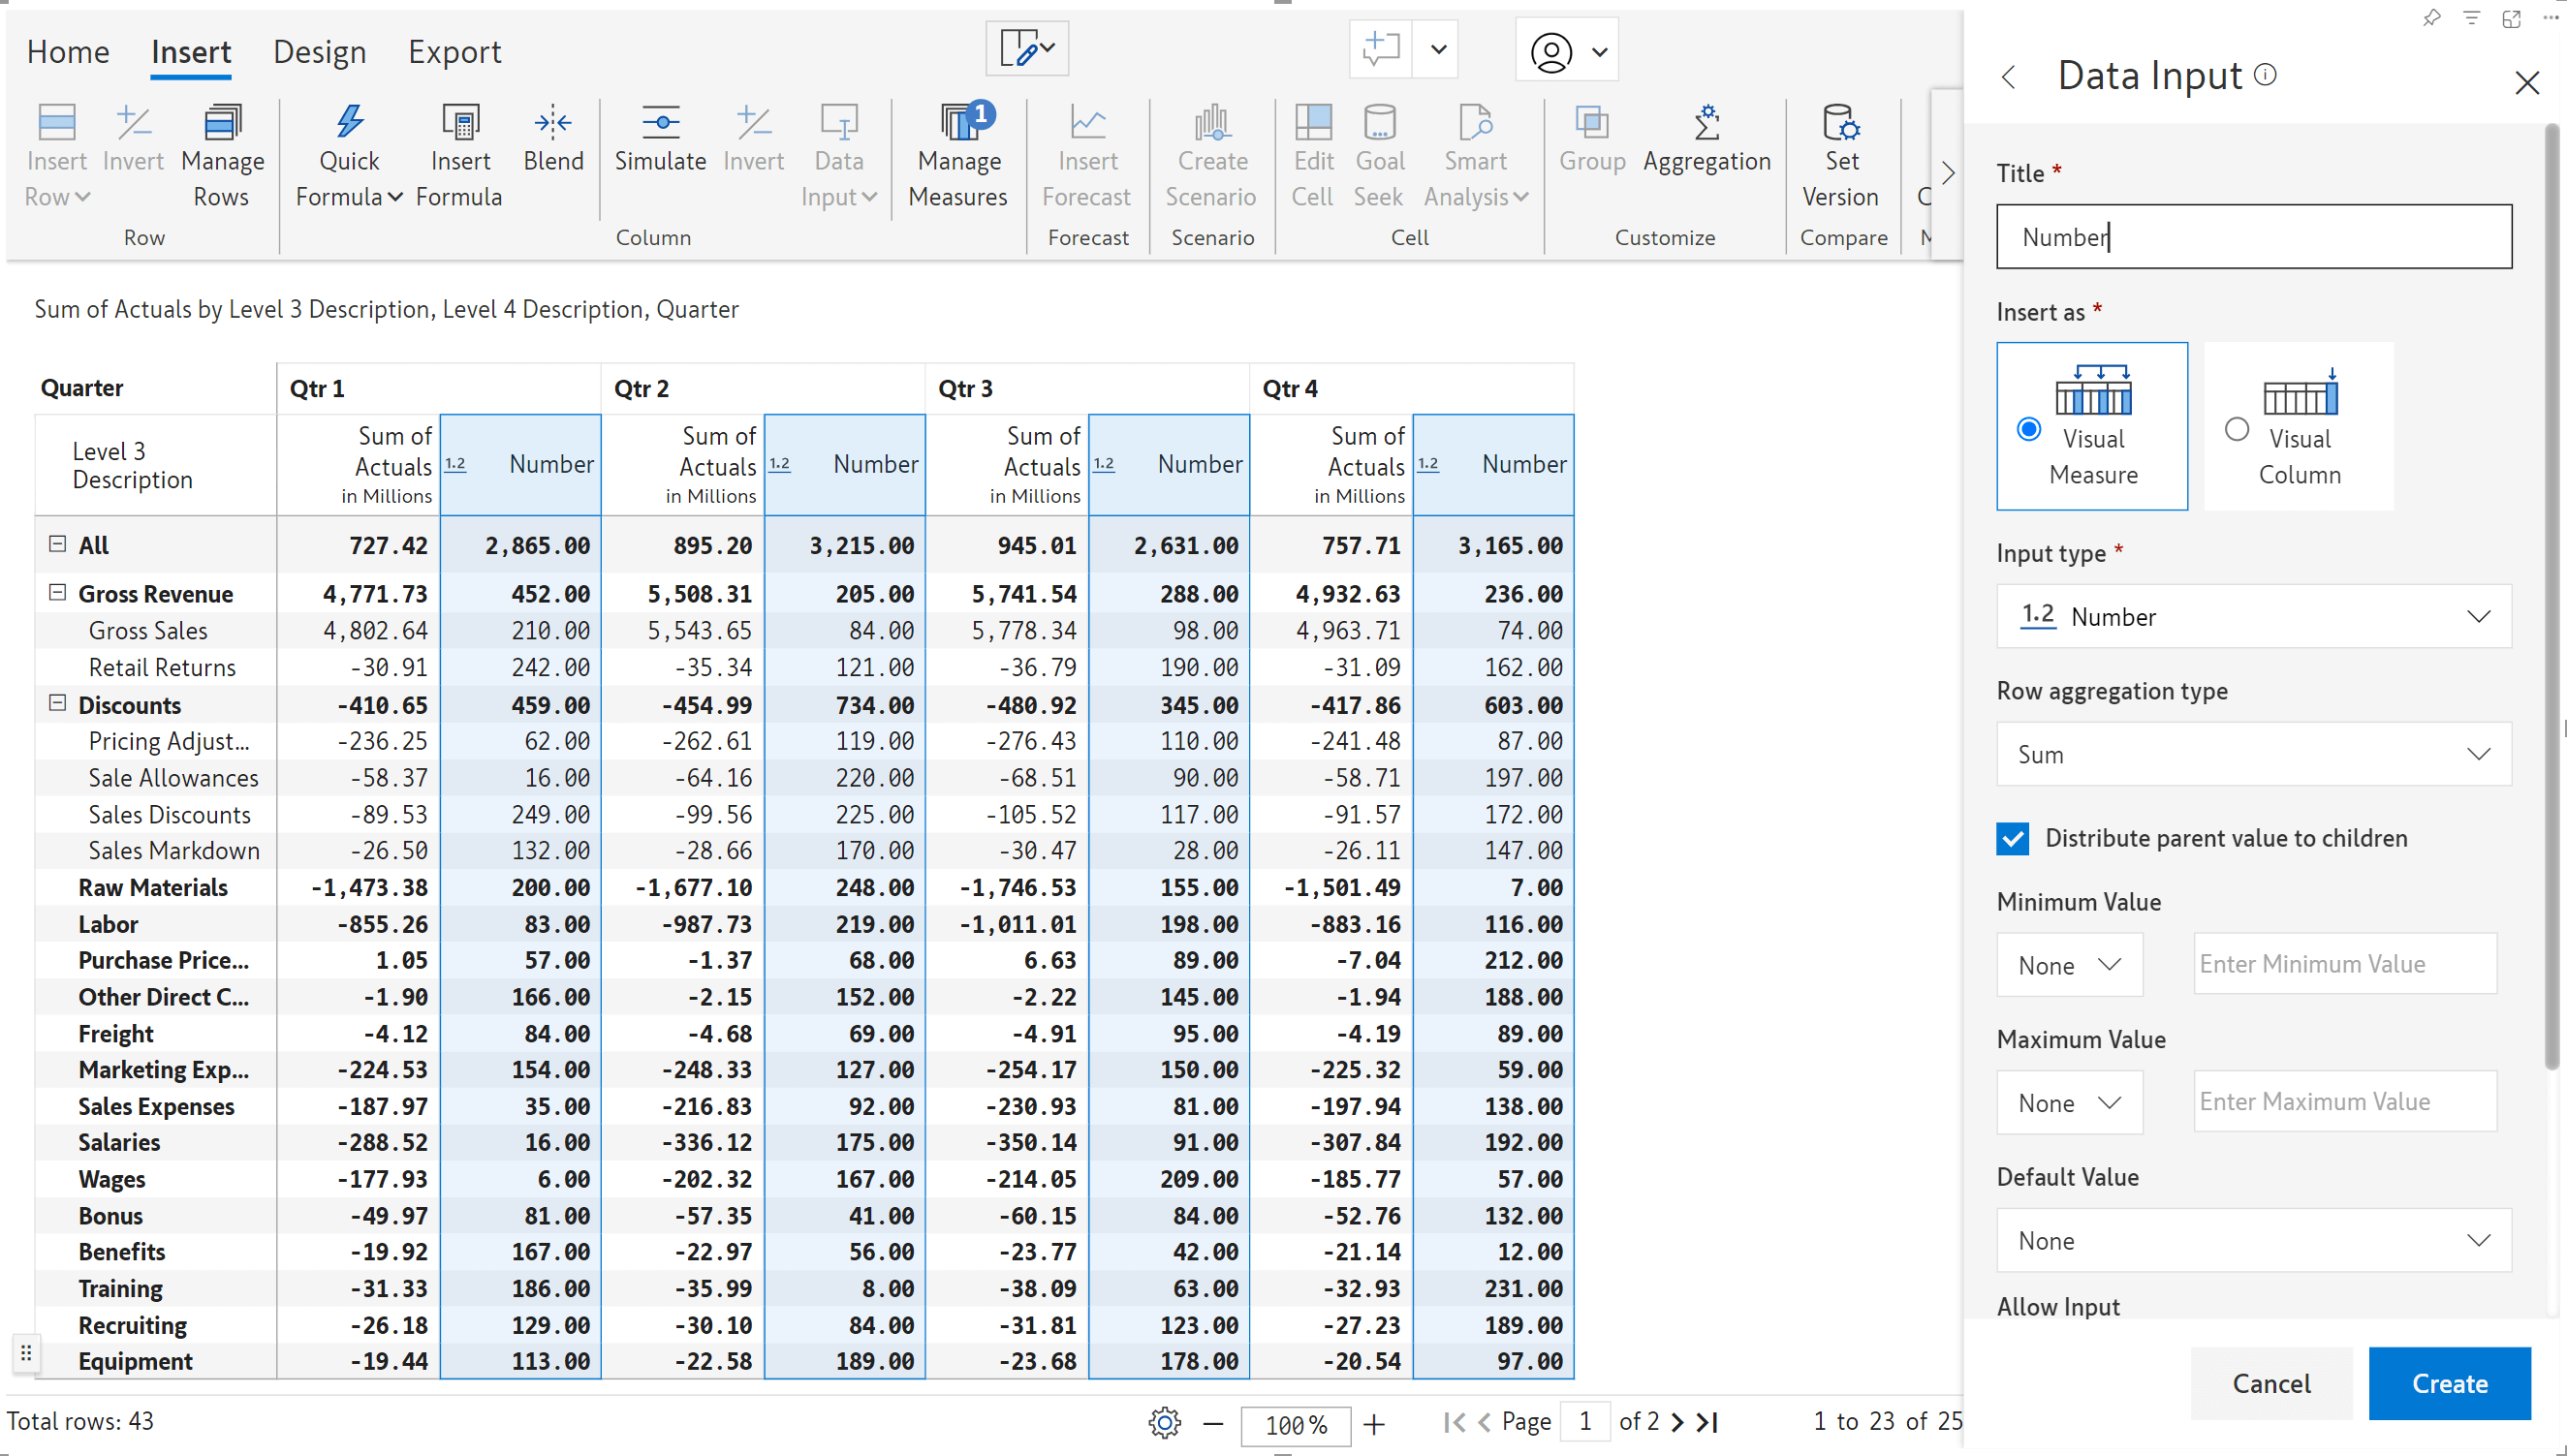
If Excel is your spreadsheet of choice, you can now enter your numeric data input values in an Excel file and upload it to Inforiver. Inforiver will generate a template Excel sheet that mimics the structure of your report. You can download the template file, input values, and upload it to Inforiver.
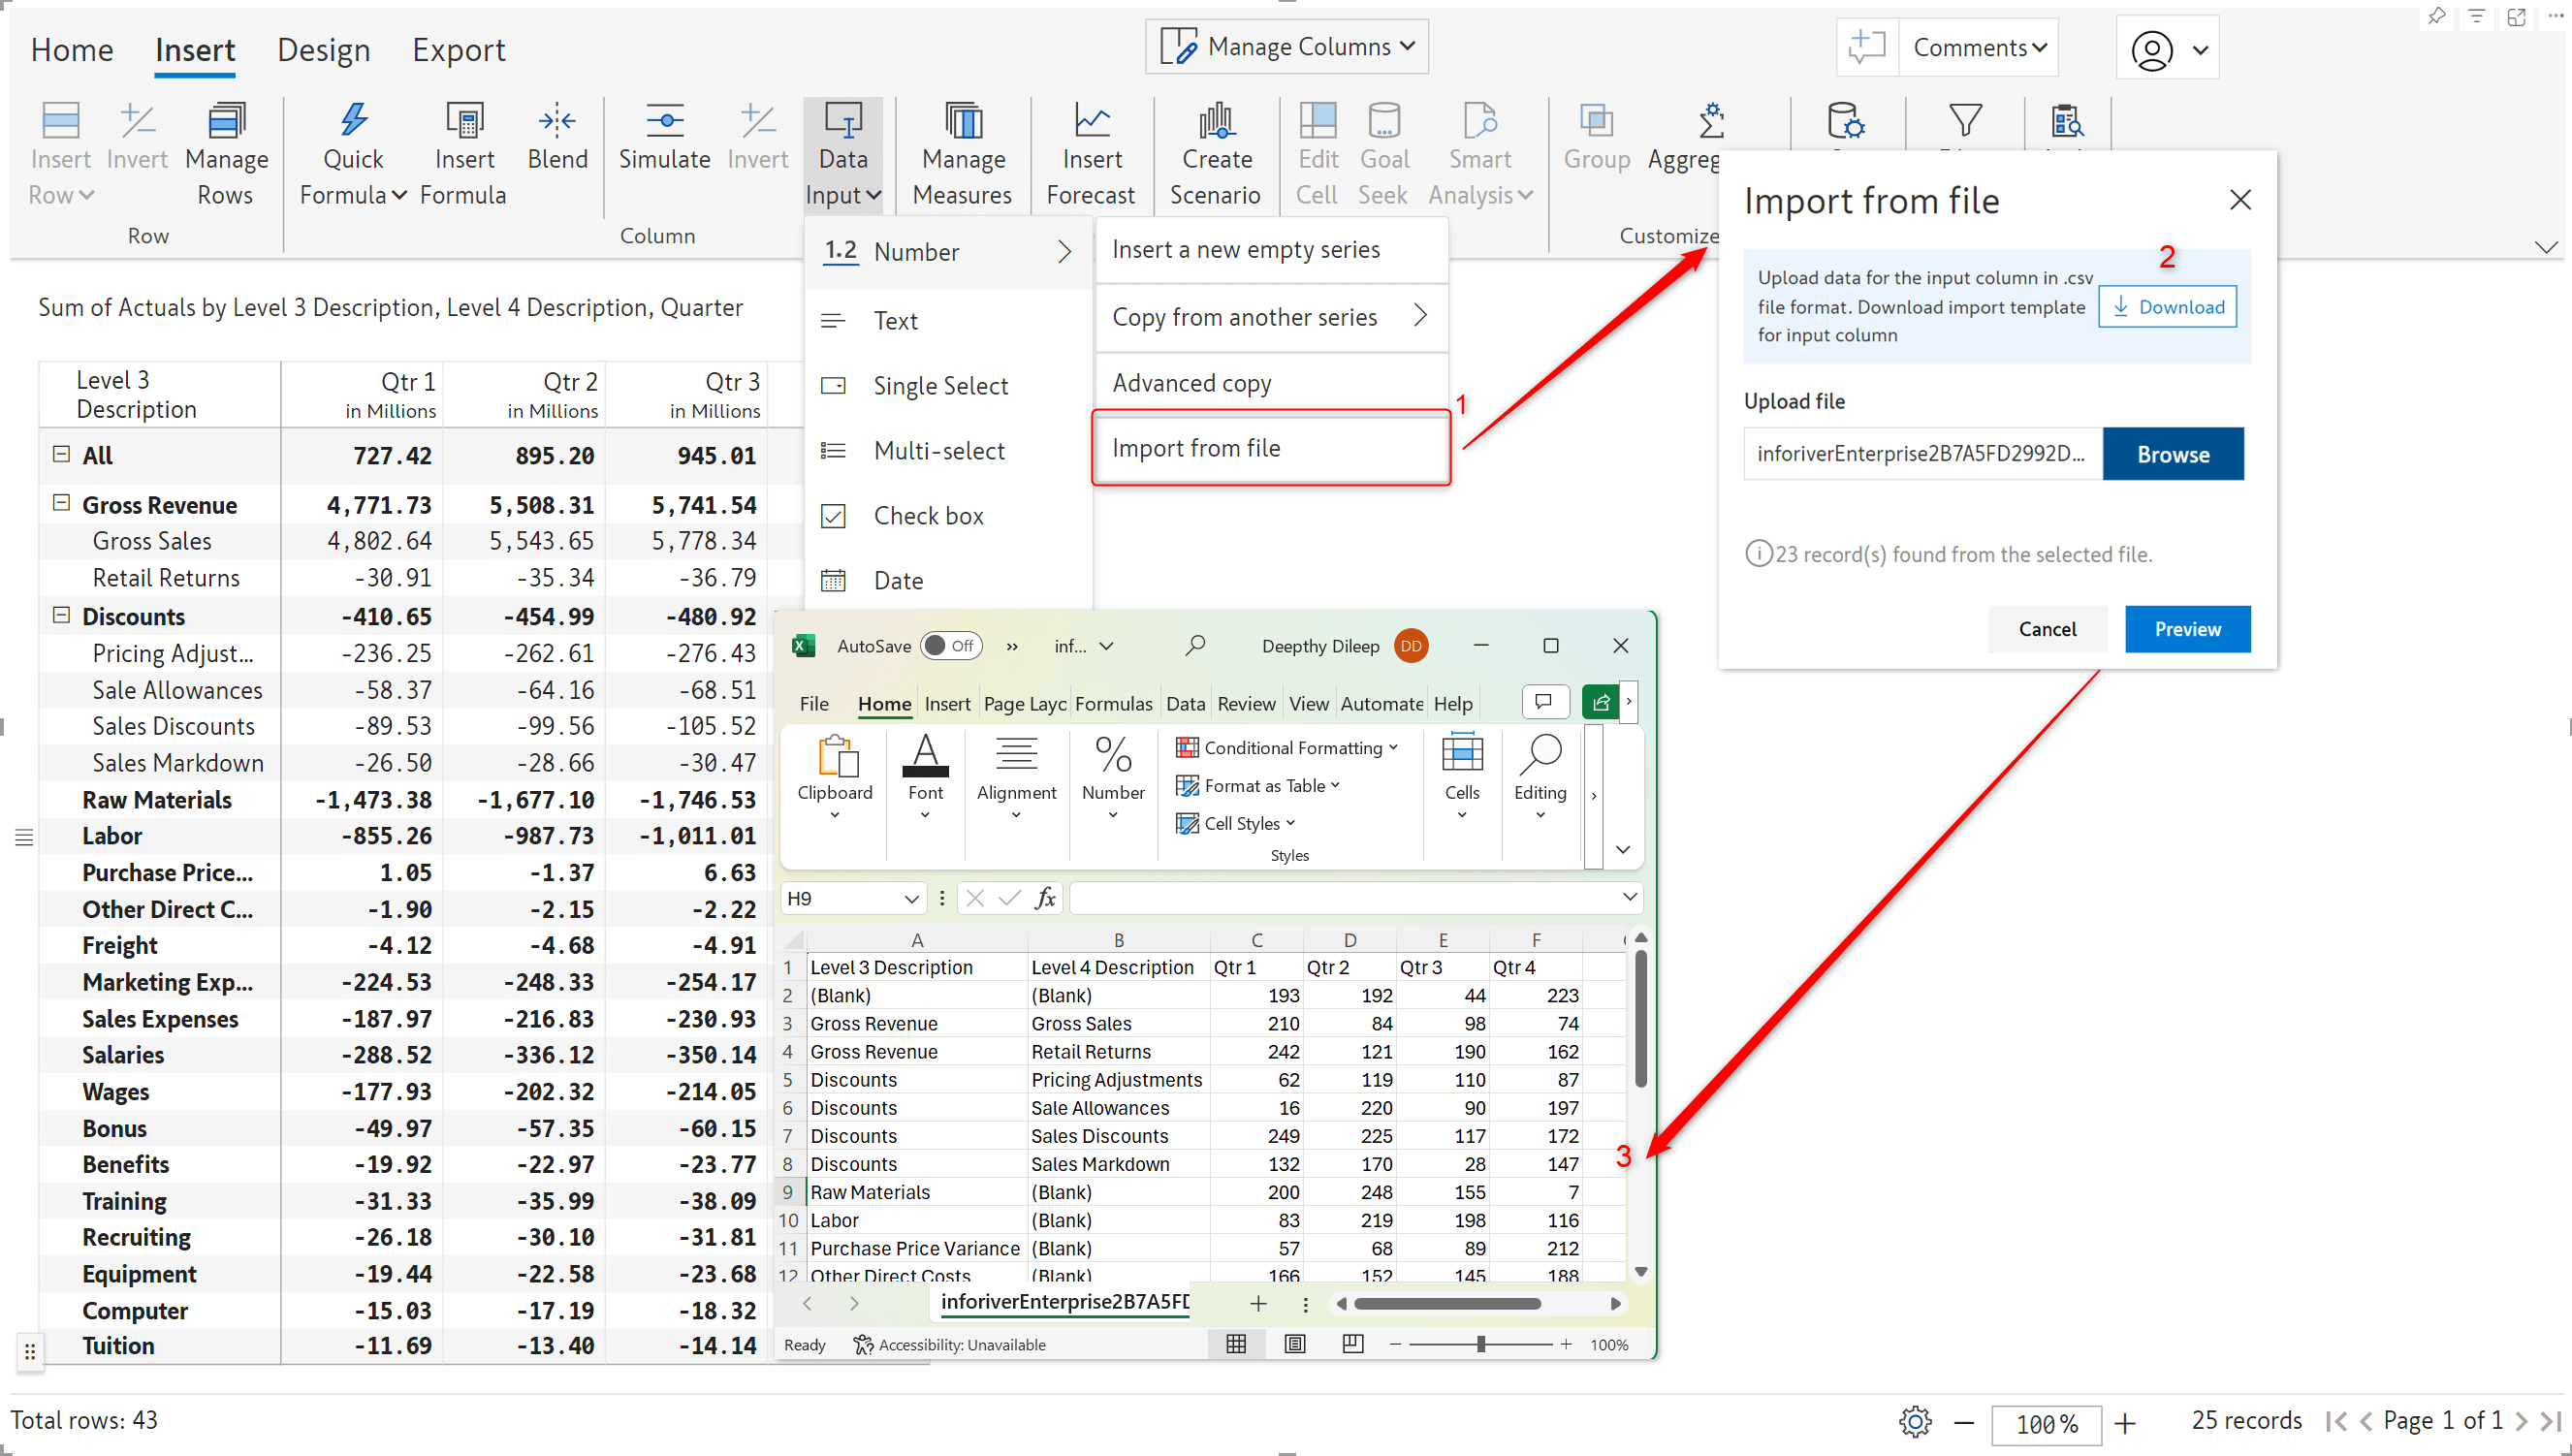
Click the preview button to integrate the values entered in the Excel sheet into your report.
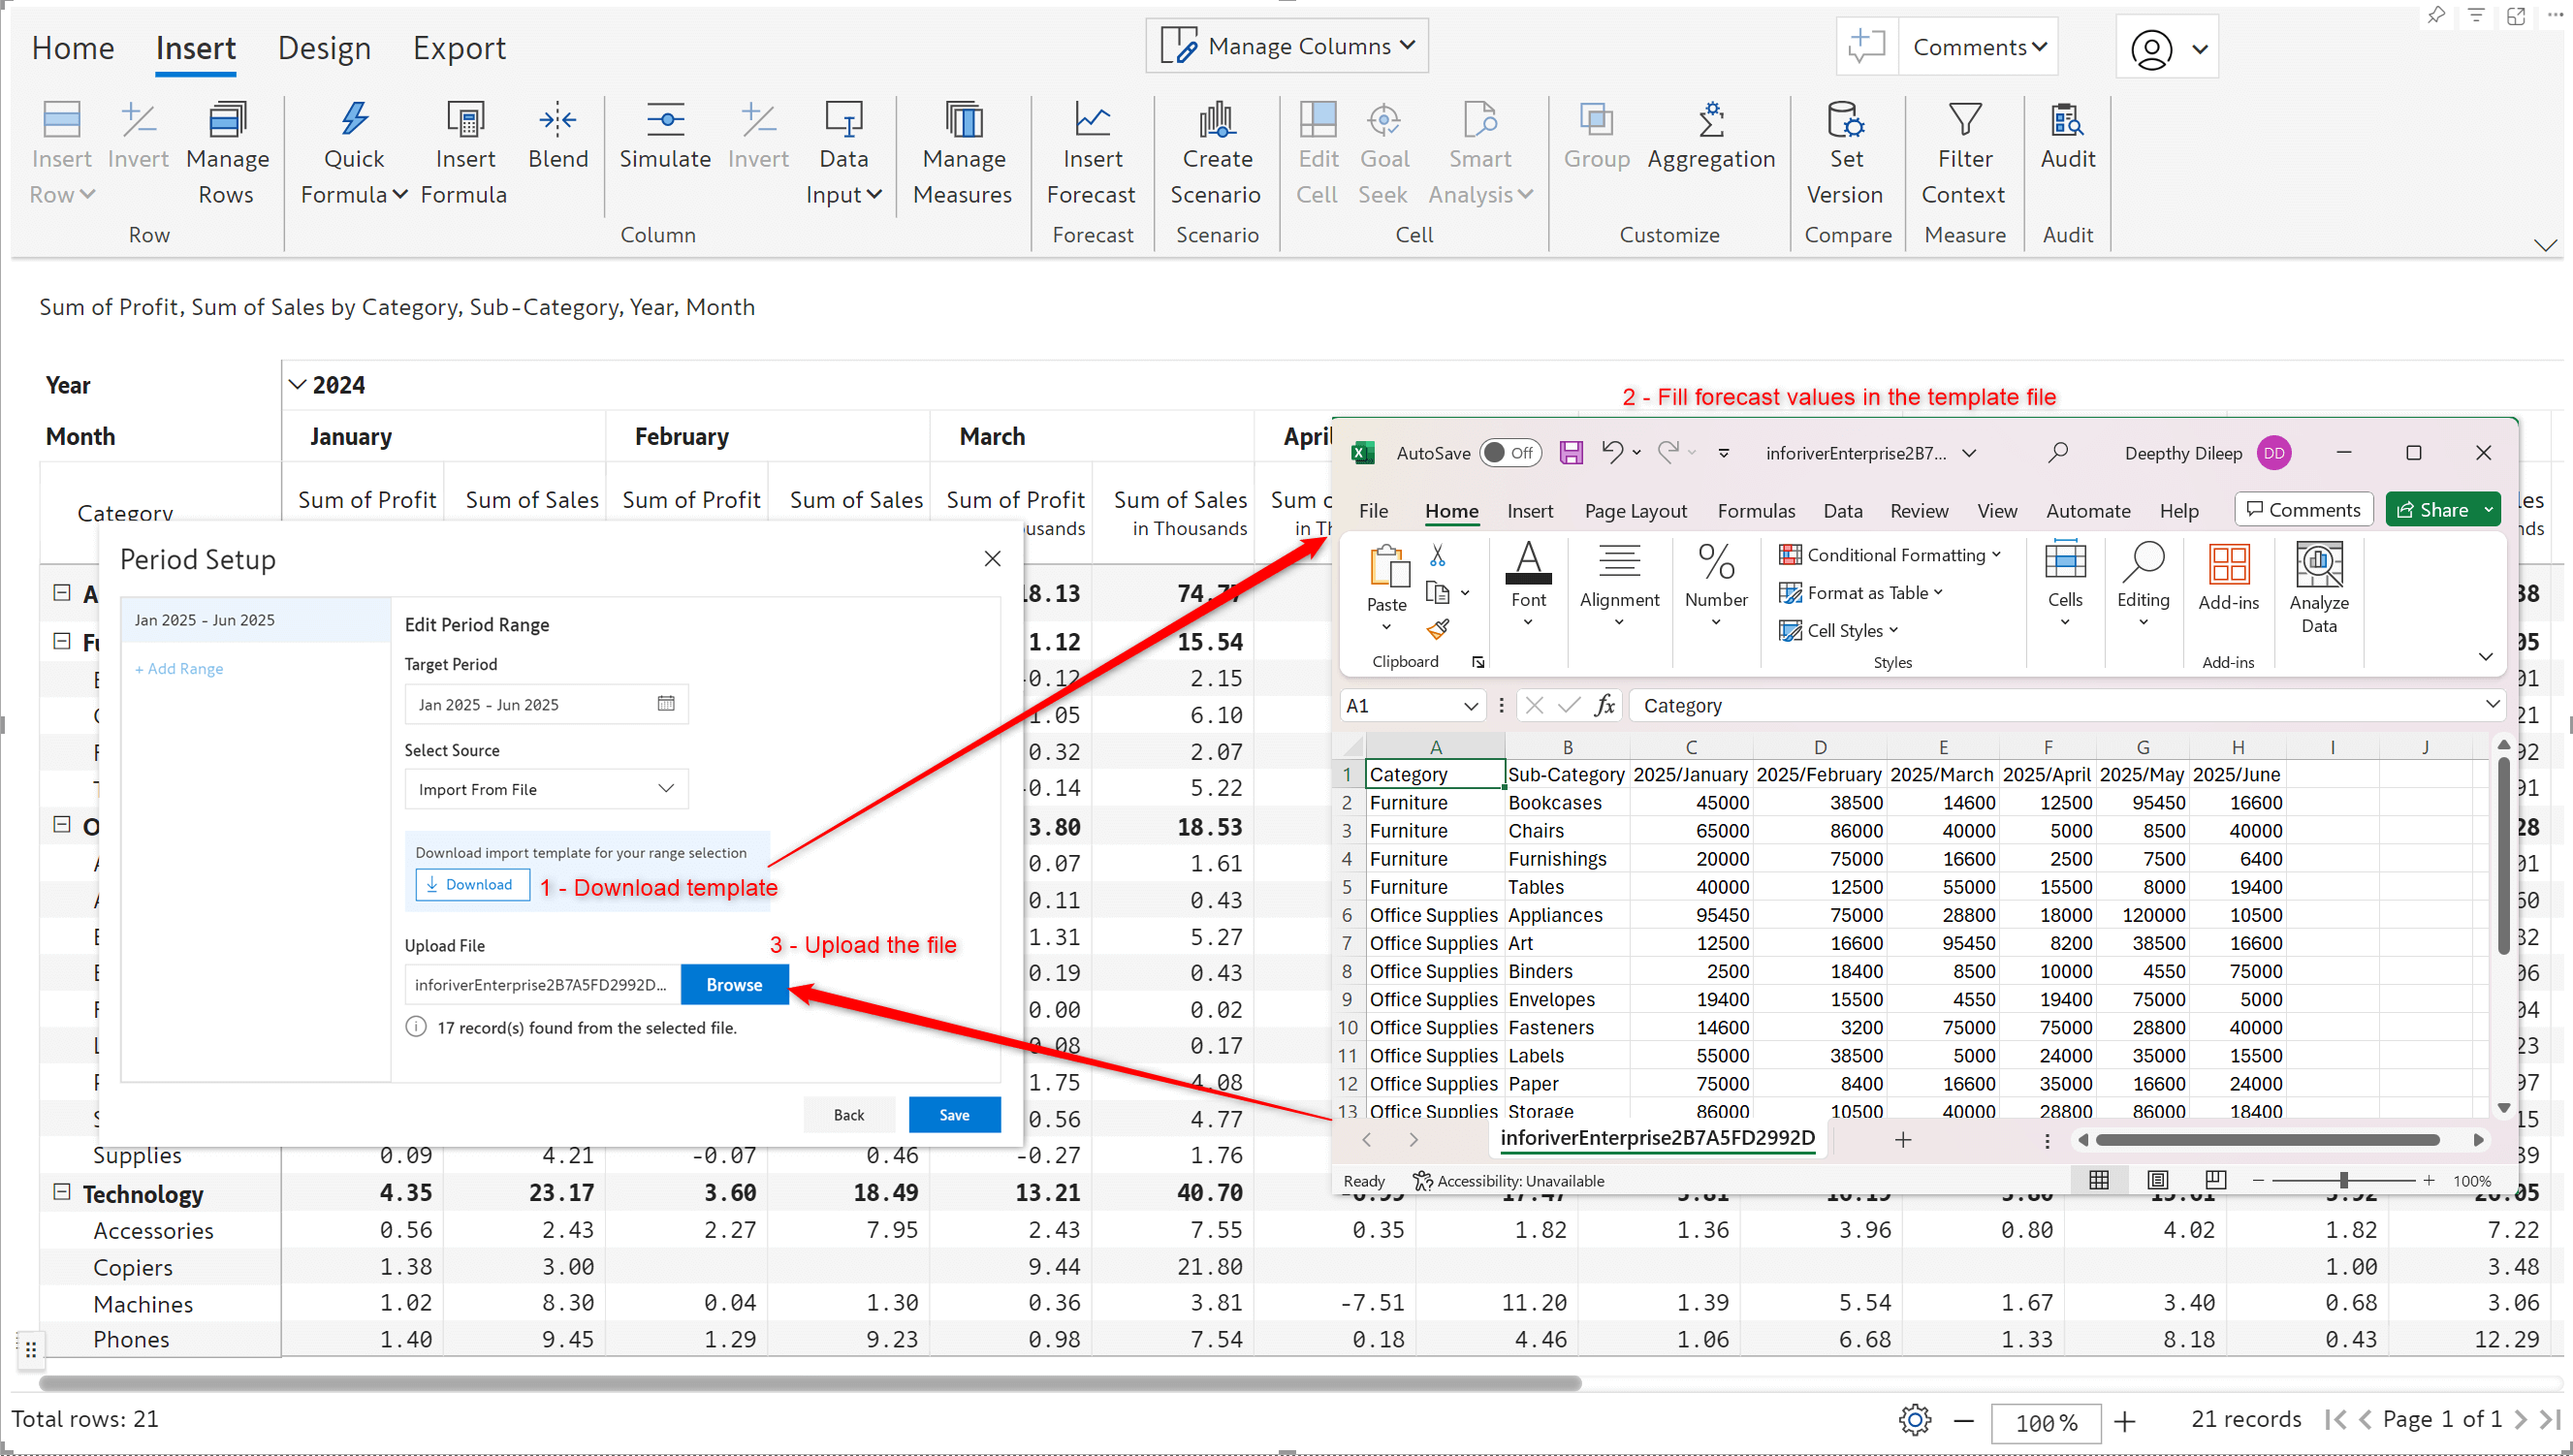
Similar to uploading files for data input, Inforiver’s powerful forecasting feature now allows you to upload Excel sheets containing predicted values. All you need to do is fill in the forecast values in the template file and upload it.
You may want to limit the number of users who can edit forecasts, i.e., you may not want all users to close forecasts, reforecast, or distribute deficits. To regulate access to forecasts, we have introduced access control specifically for forecasts. You can restrict forecast updates by setting read or read + write access.
Navigate to the Forecast tab > Manage > Settings > Data Input Access to define access control.
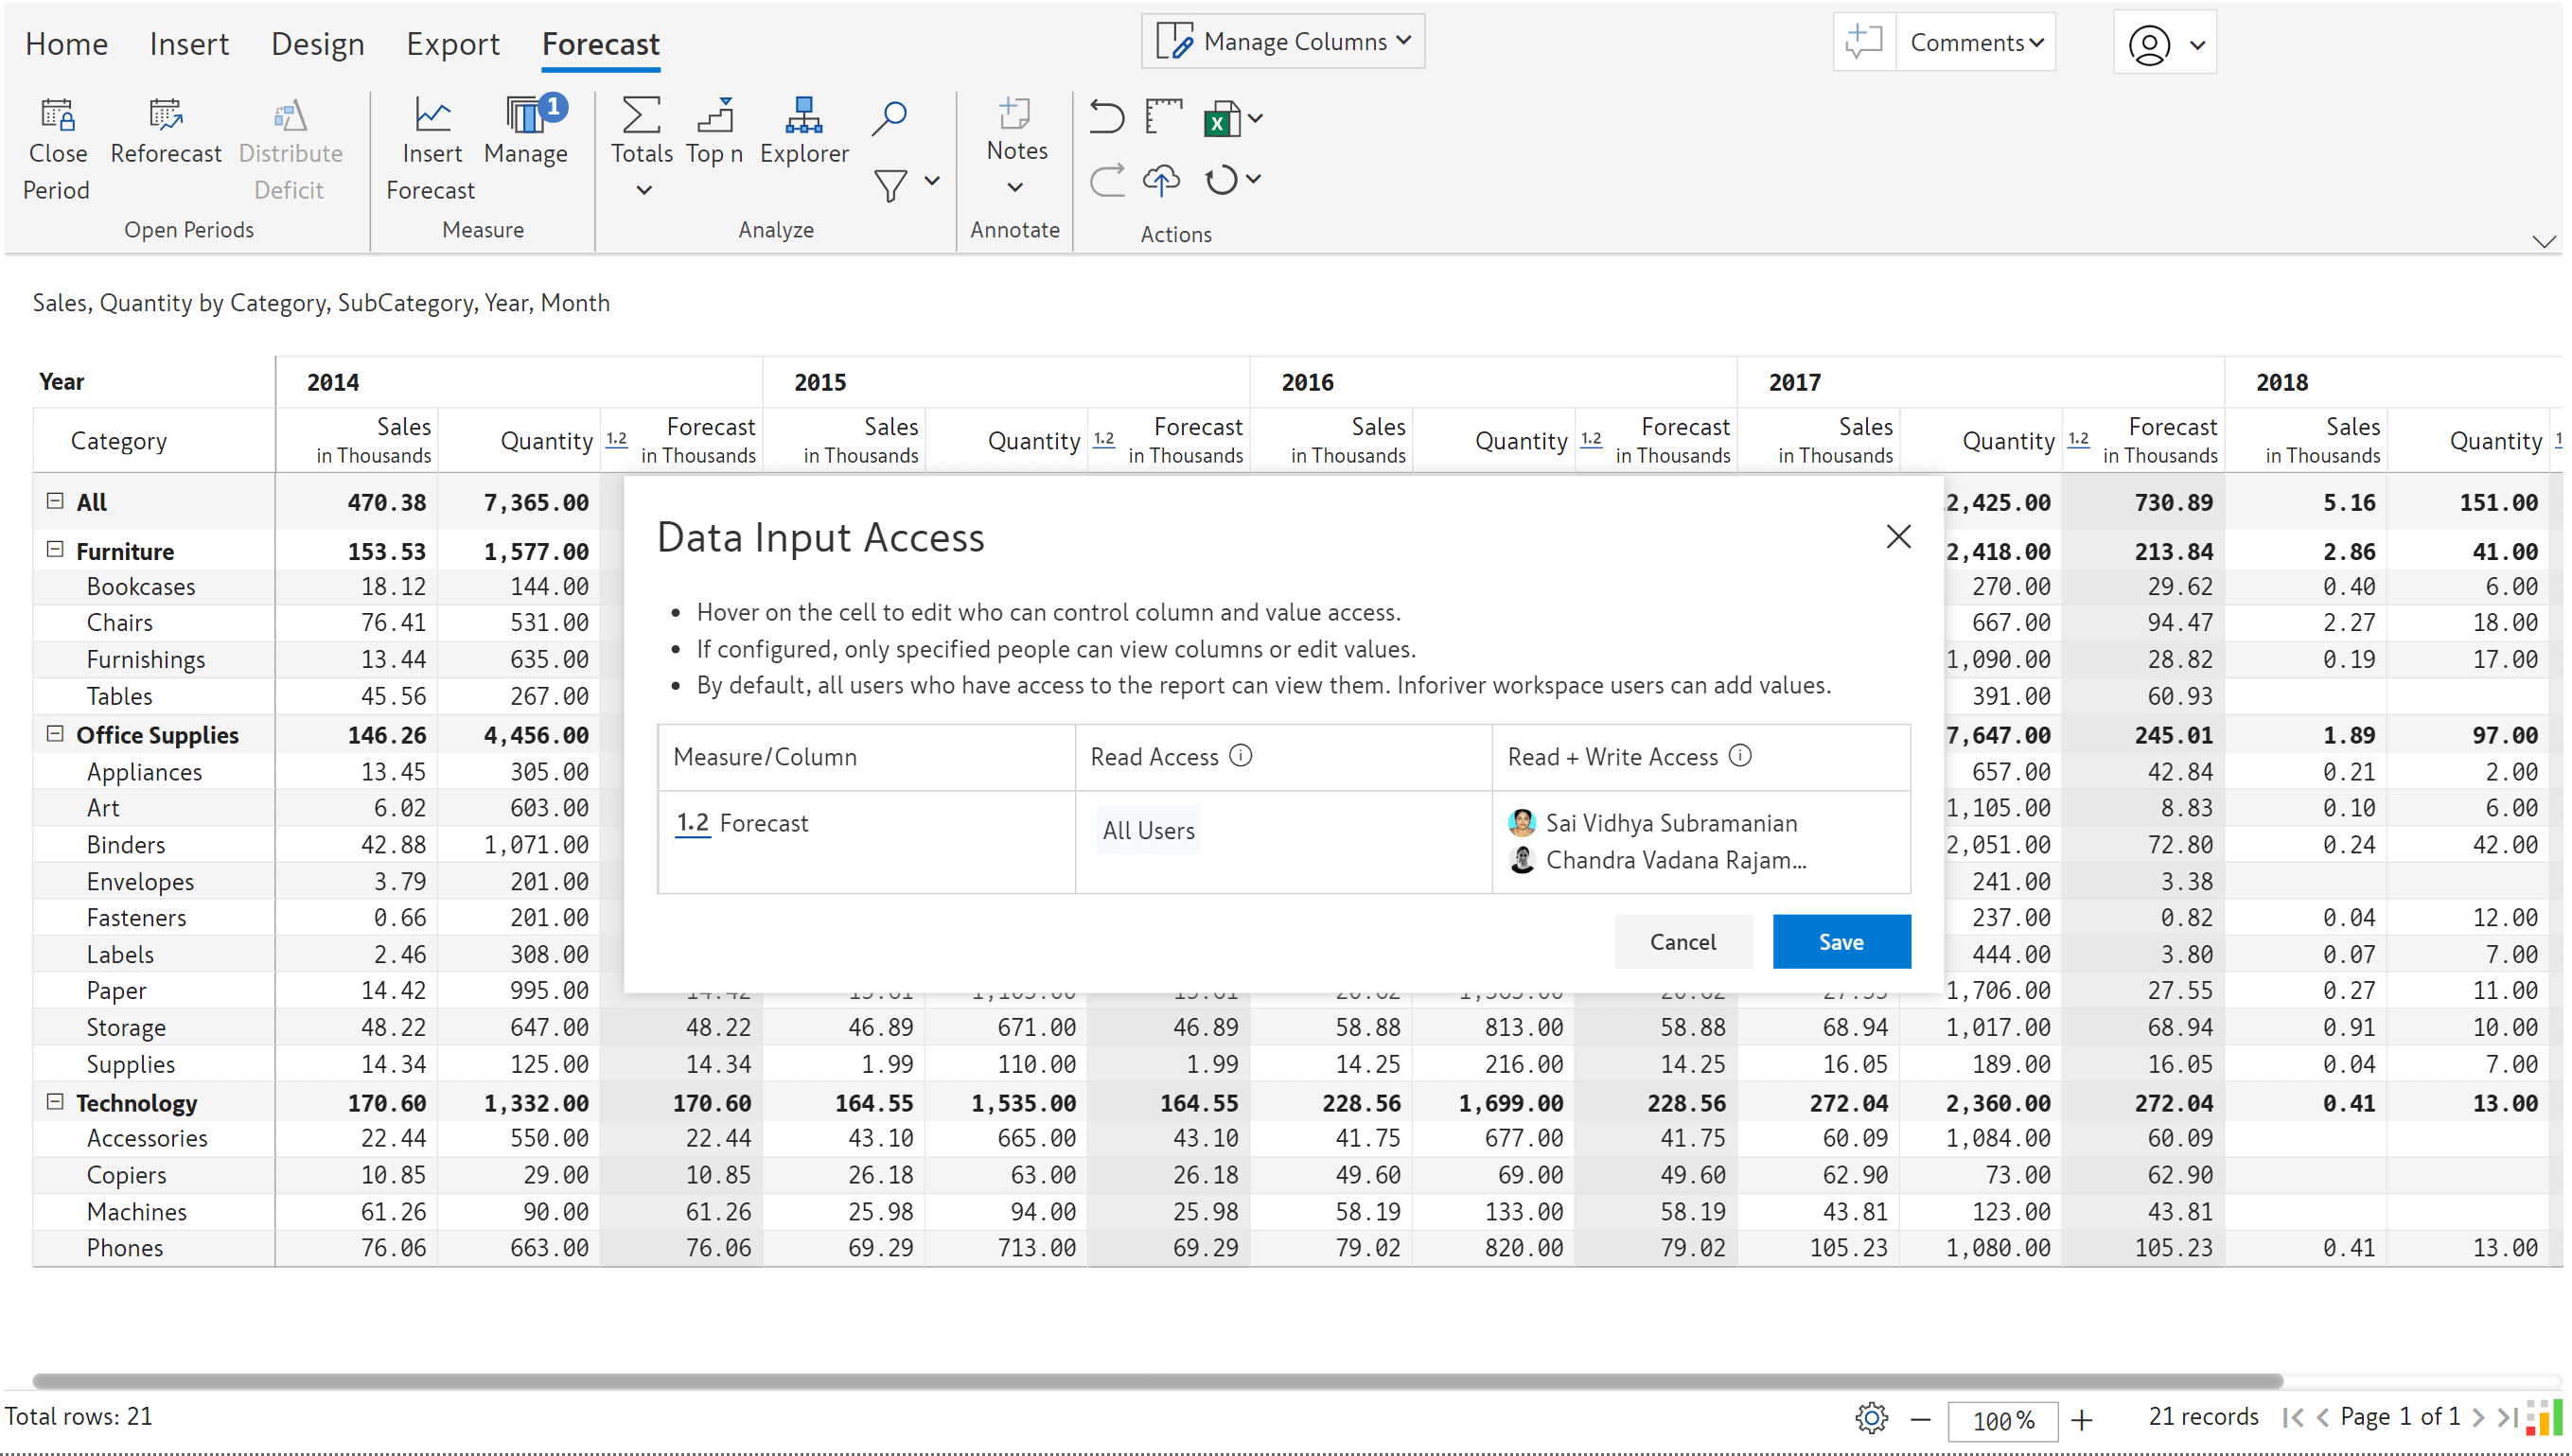
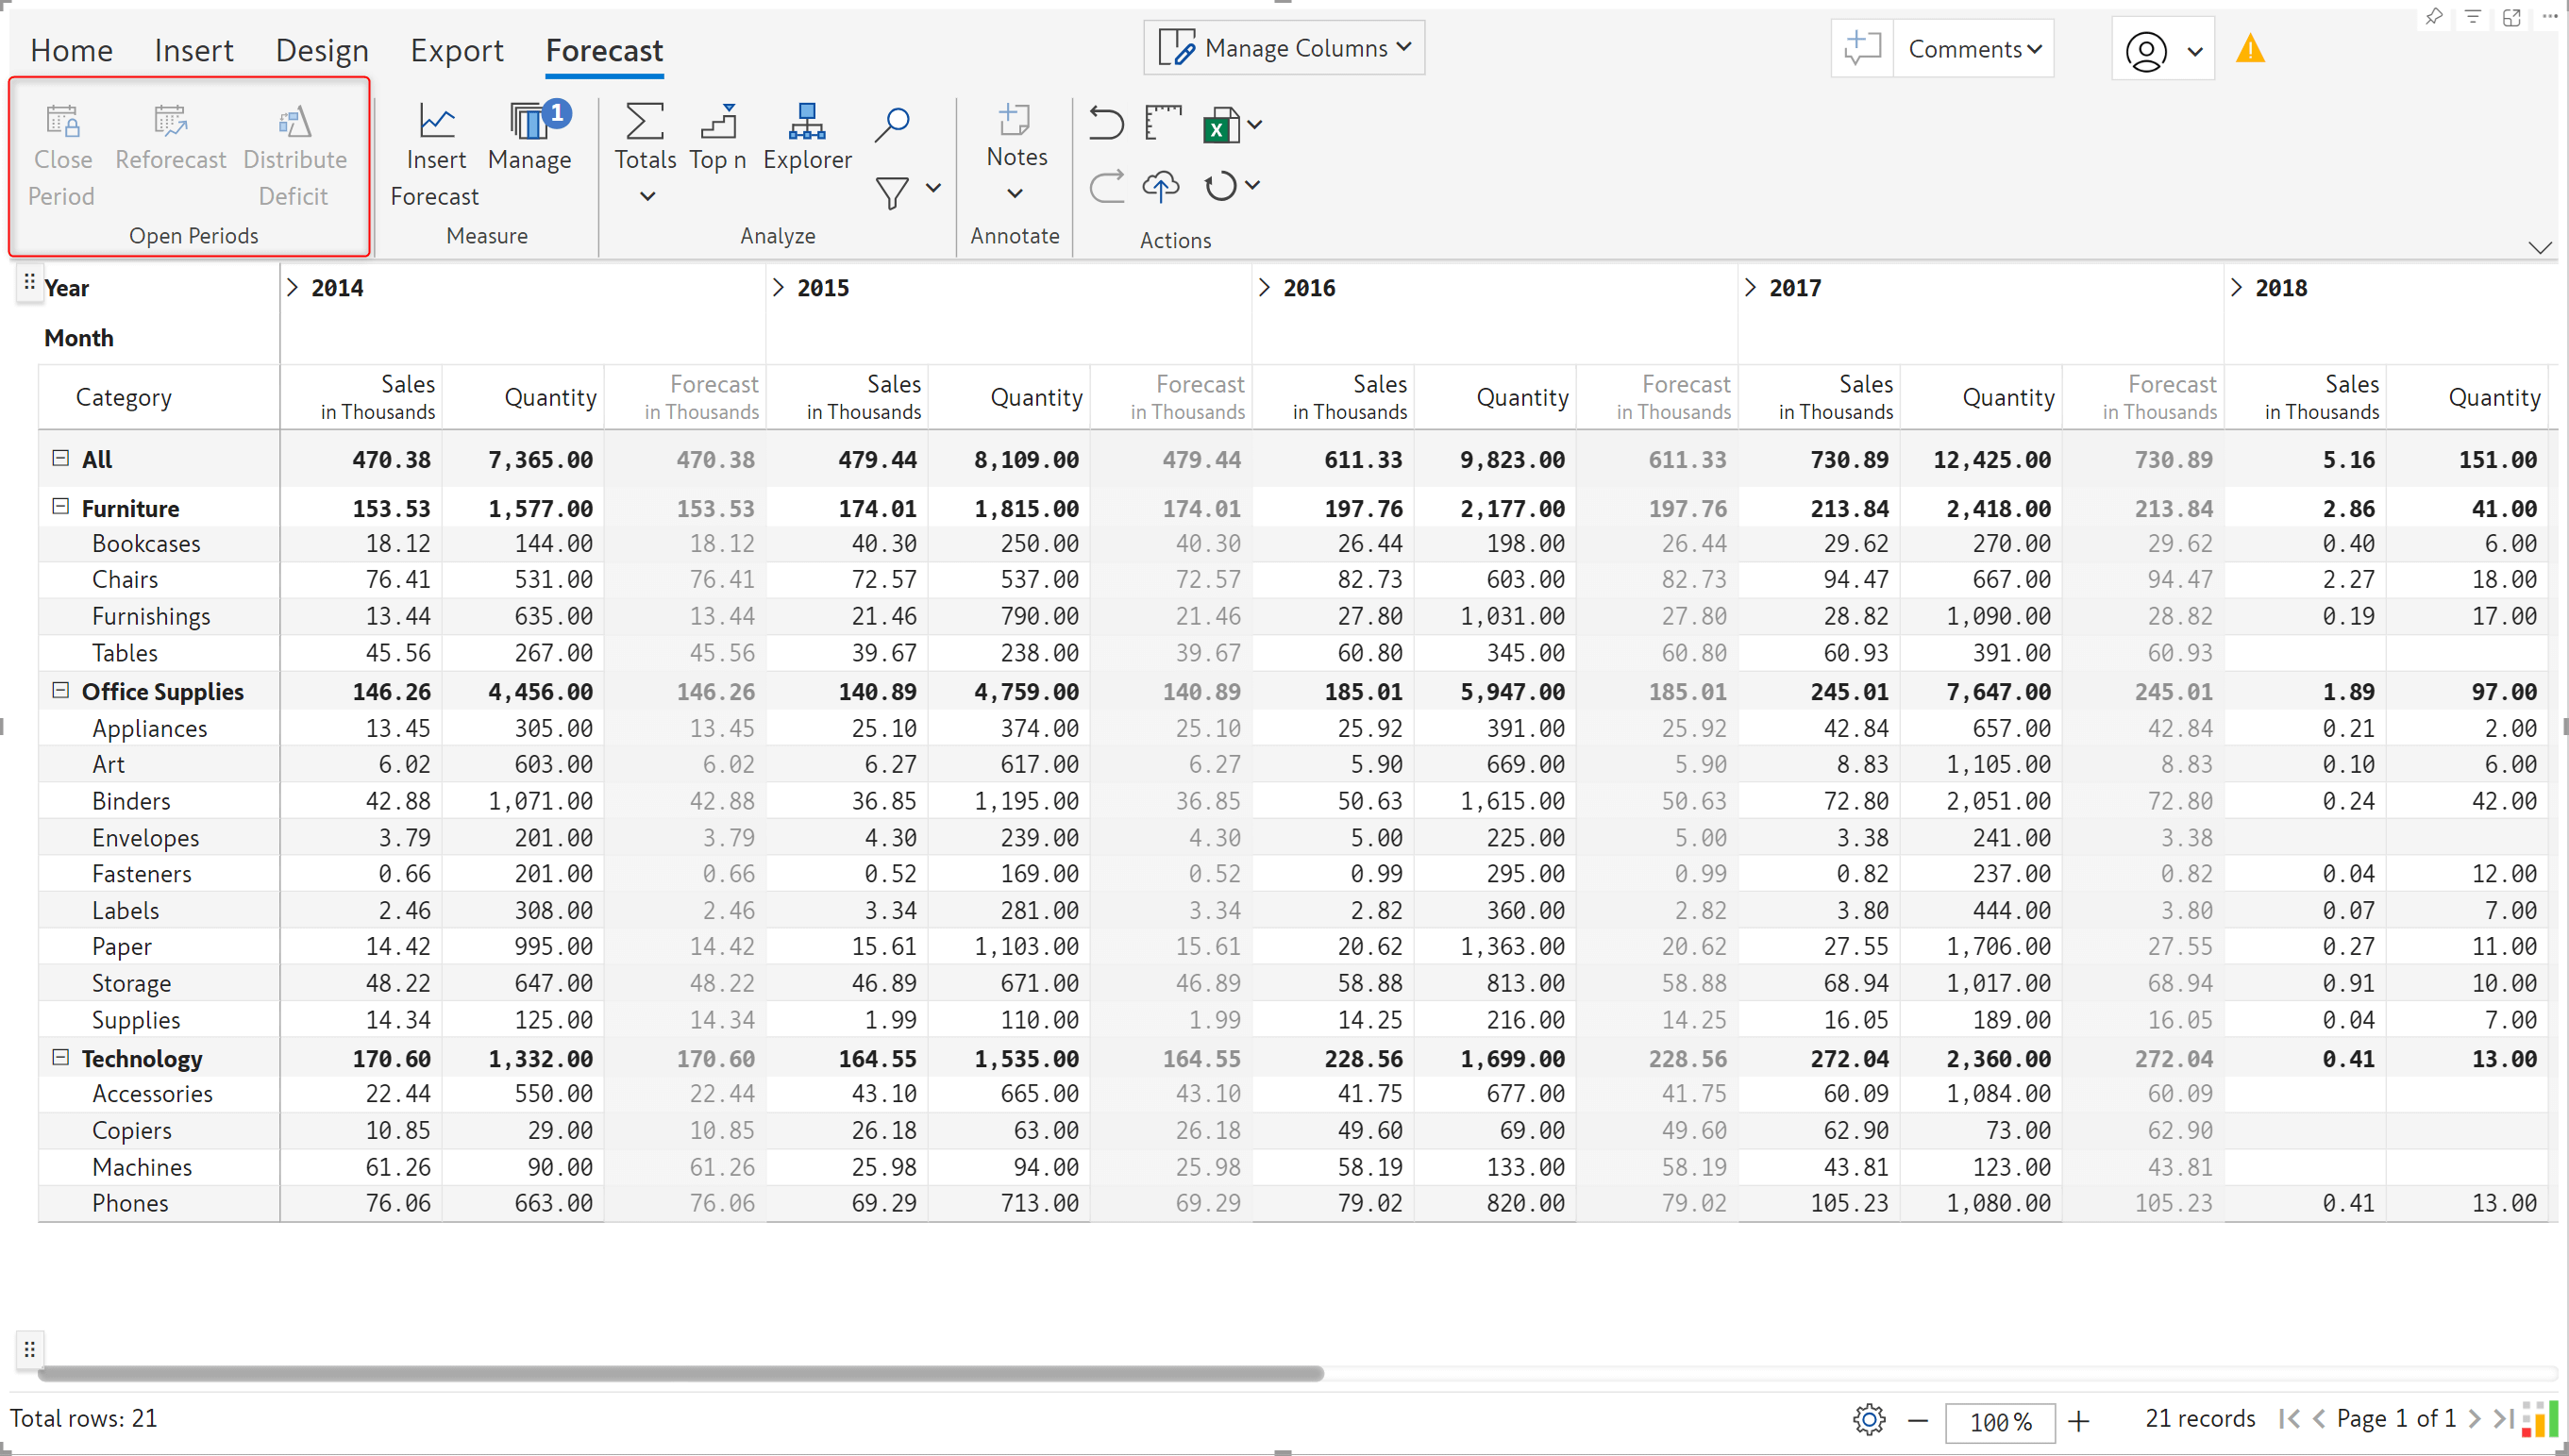
The Close Period, Reforecast, and Distribute Deficit functionalities will be disabled for users with read-only access to forecasts.
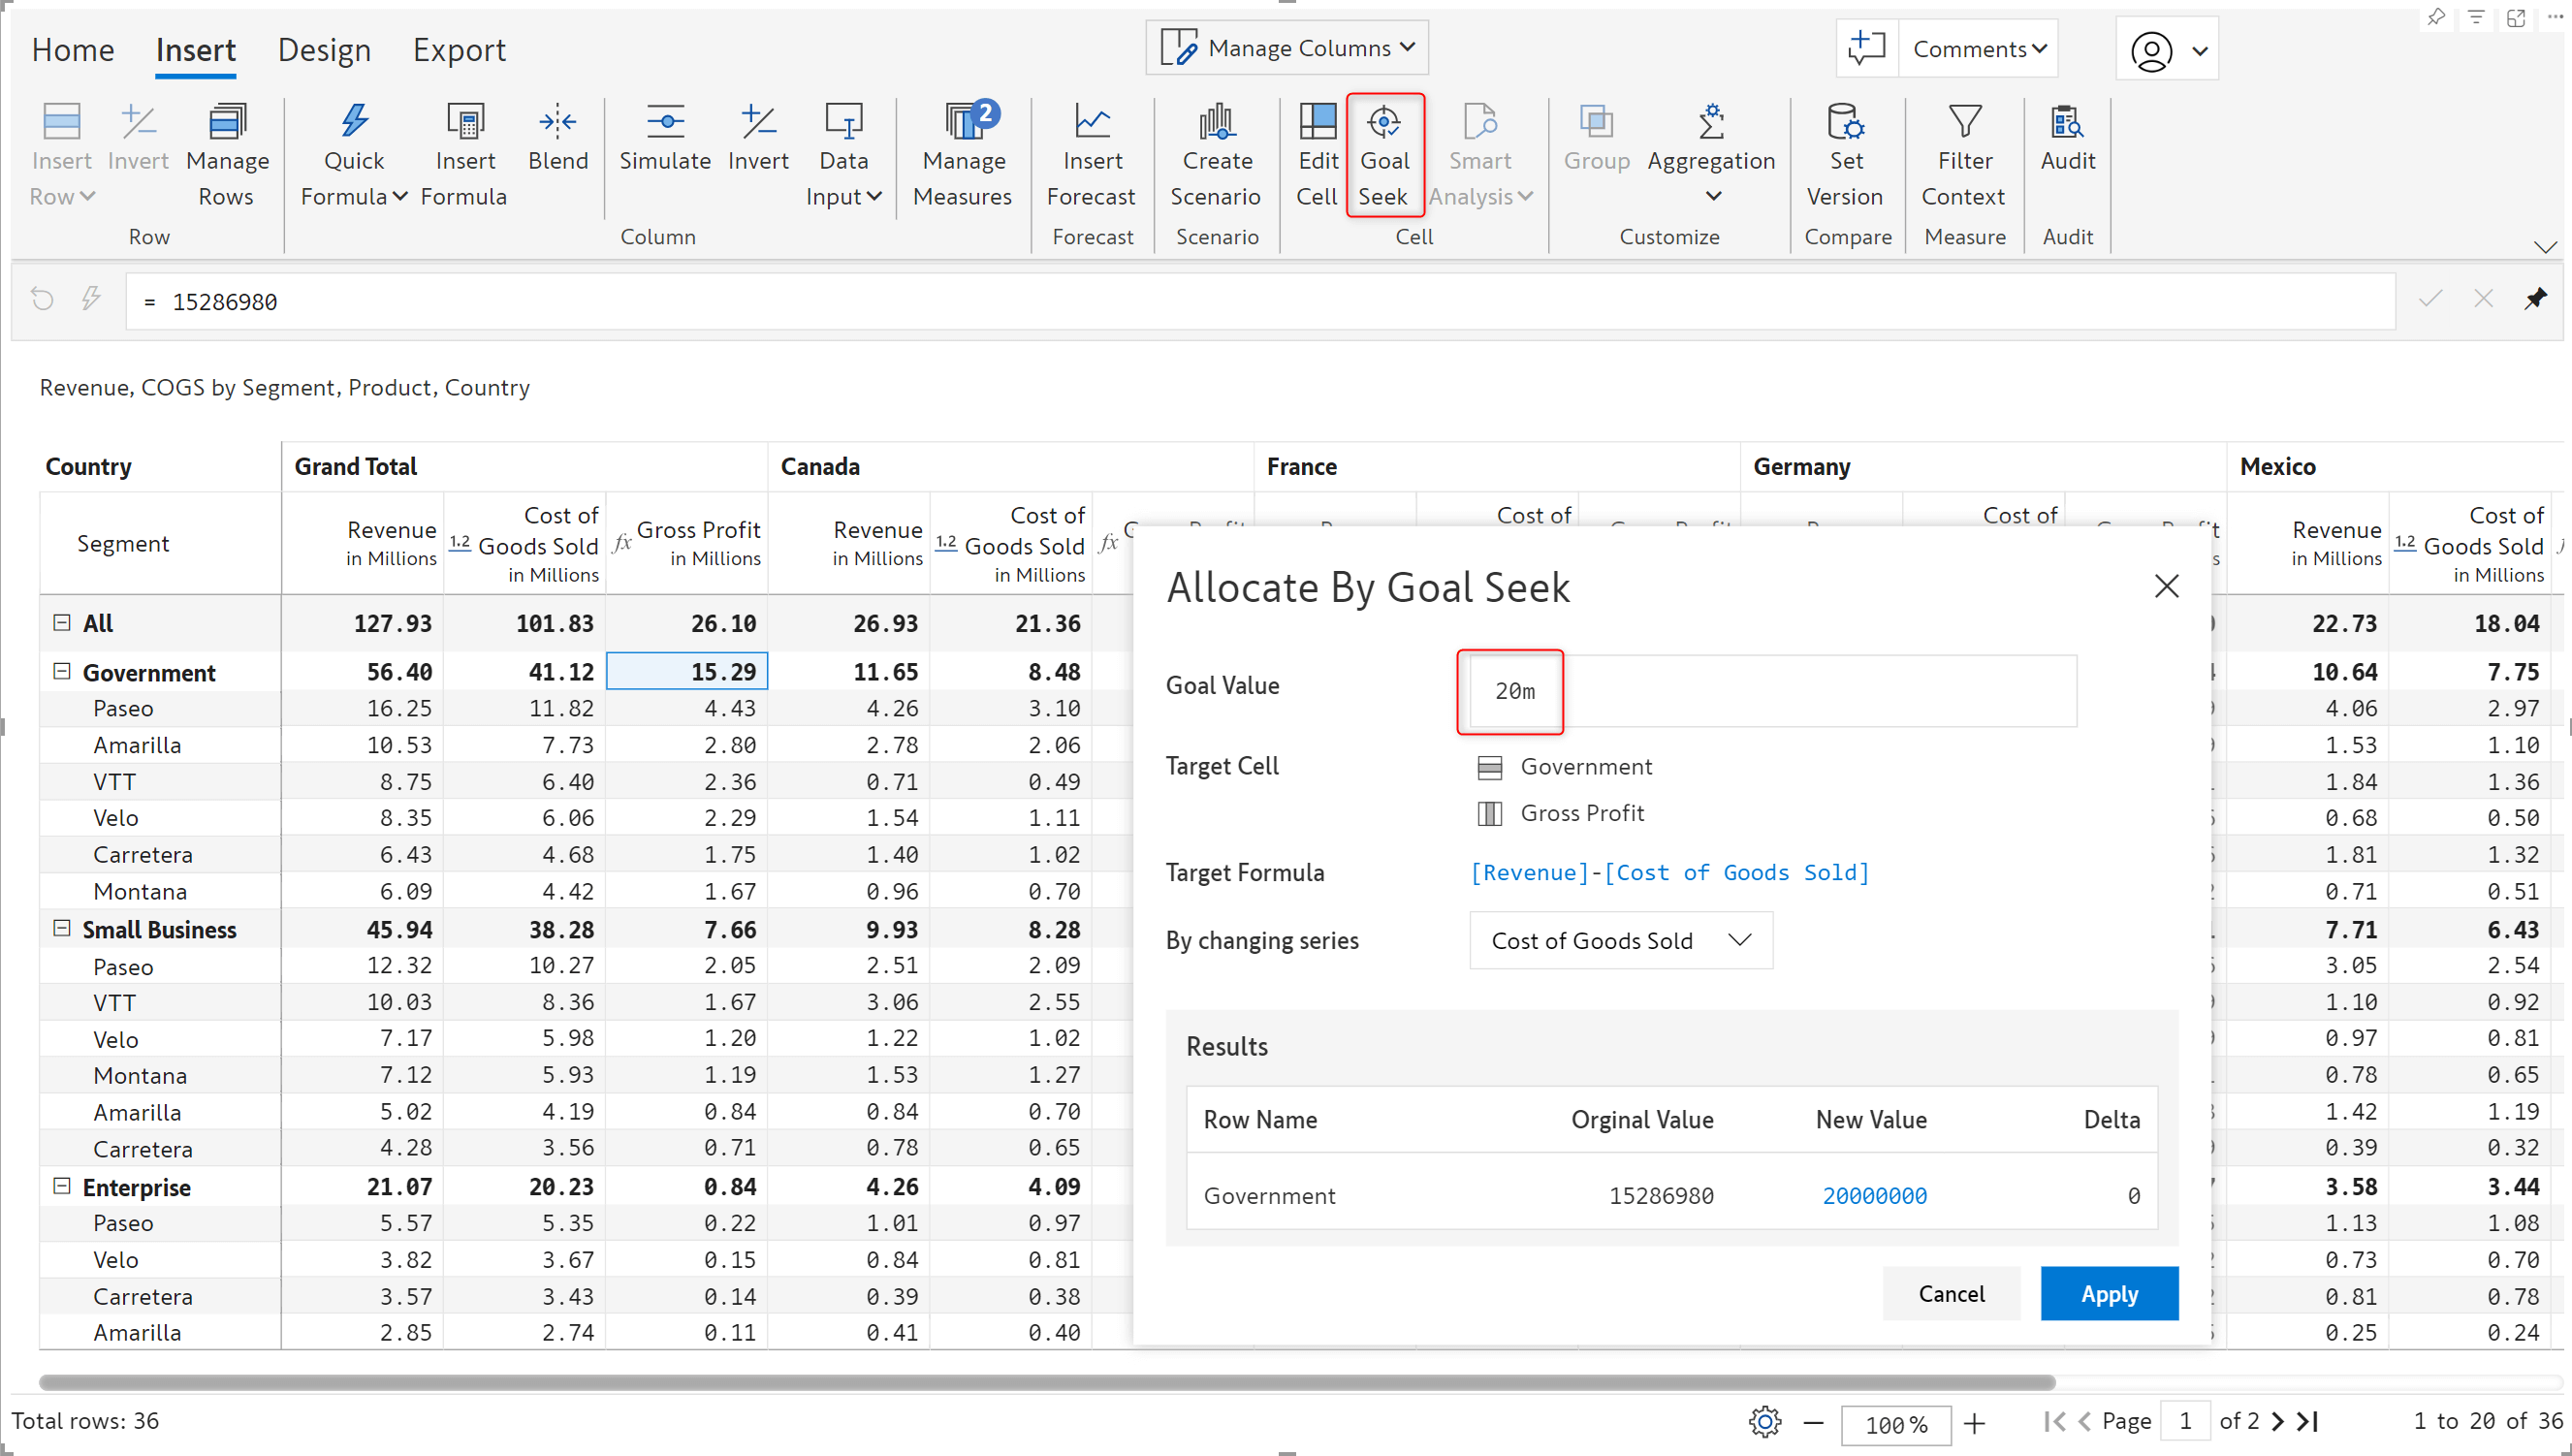
Formulas are often used in reports to calculate metrics like profit or growth rate. Increase your productivity with the new Goal Seek feature that enables you to set targets in calculated cells. Inforiver can dynamically compute and adjust data input values so that the target is achieved. When you use goal seek for grand totals or subtotals, Inforiver will adjust all the child cells as well, saving you repeated computations.
In the demonstration, we have calculated Gross Profit using the formula Revenue – COGS.
To set an overall target of 20m Gross Profit for the Government segment, we can configure the Goal Seek options as shown below:
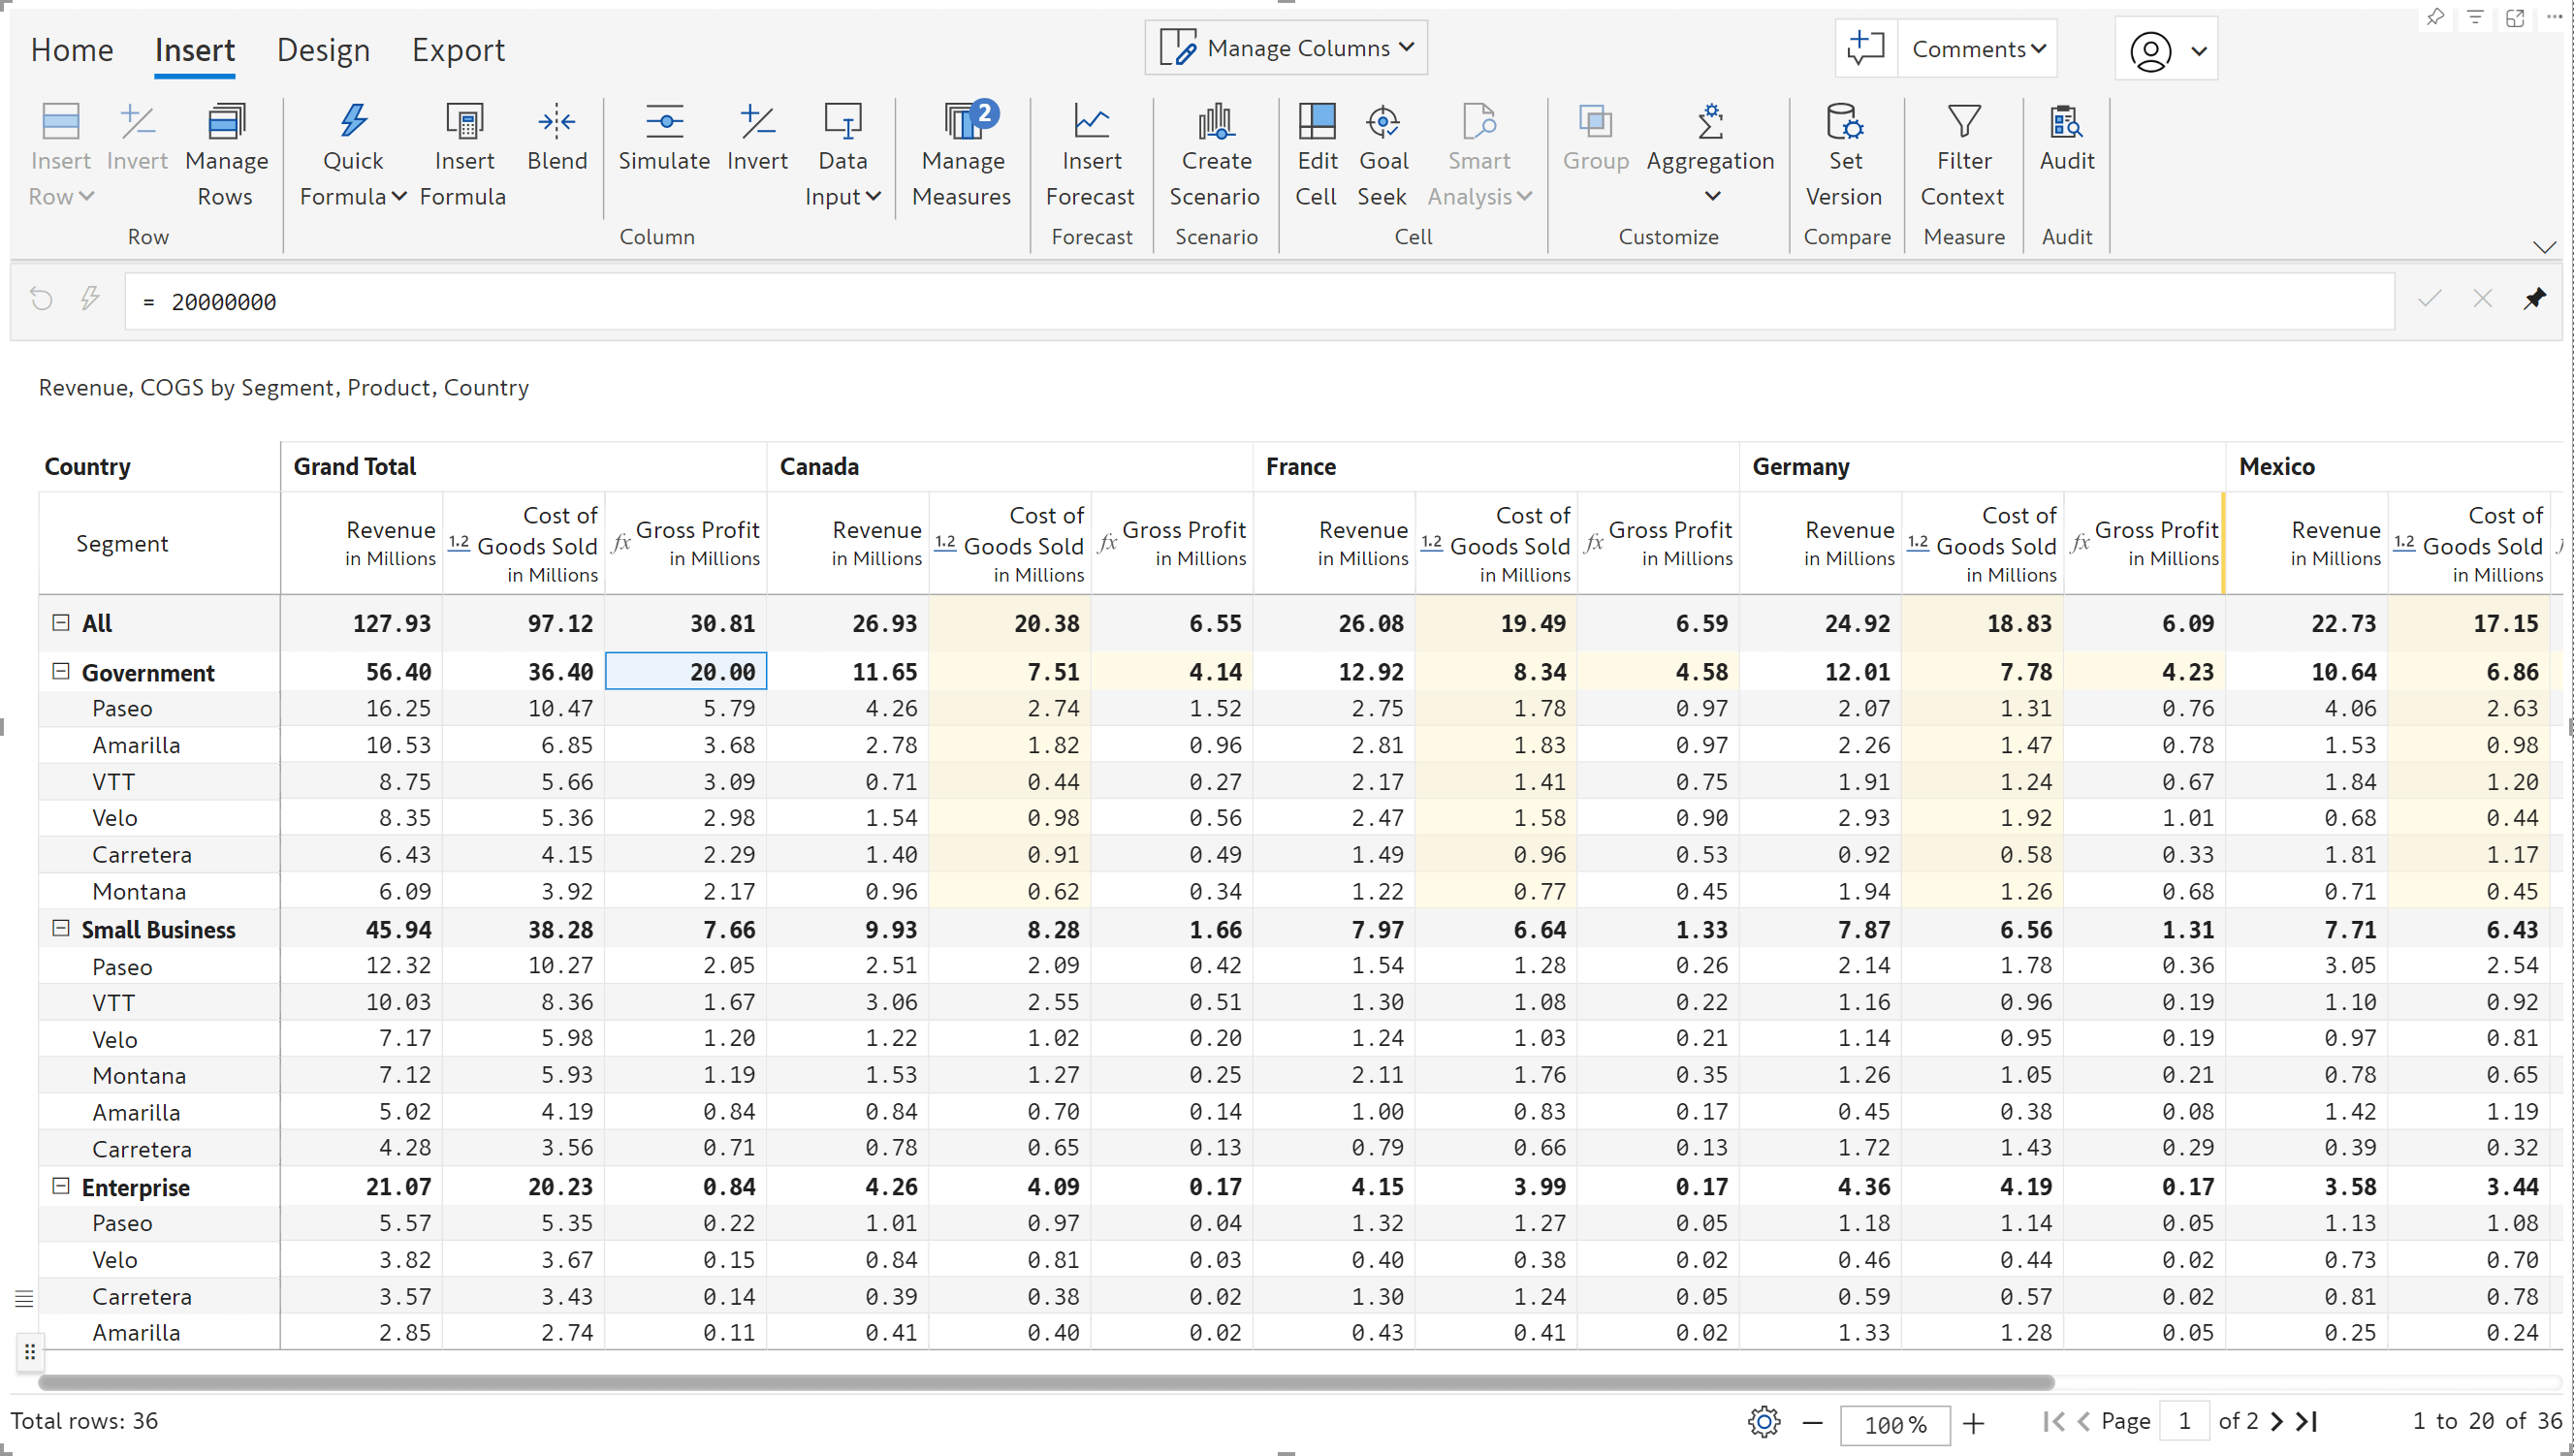
Notice how Inforiver automatically updates all the COGS cells that contribute to the Gross Profit for the Government segment. The cells that are updated to align with the target value are highlighted. You can set goals for individual measure cells too – not just at the grand total level.
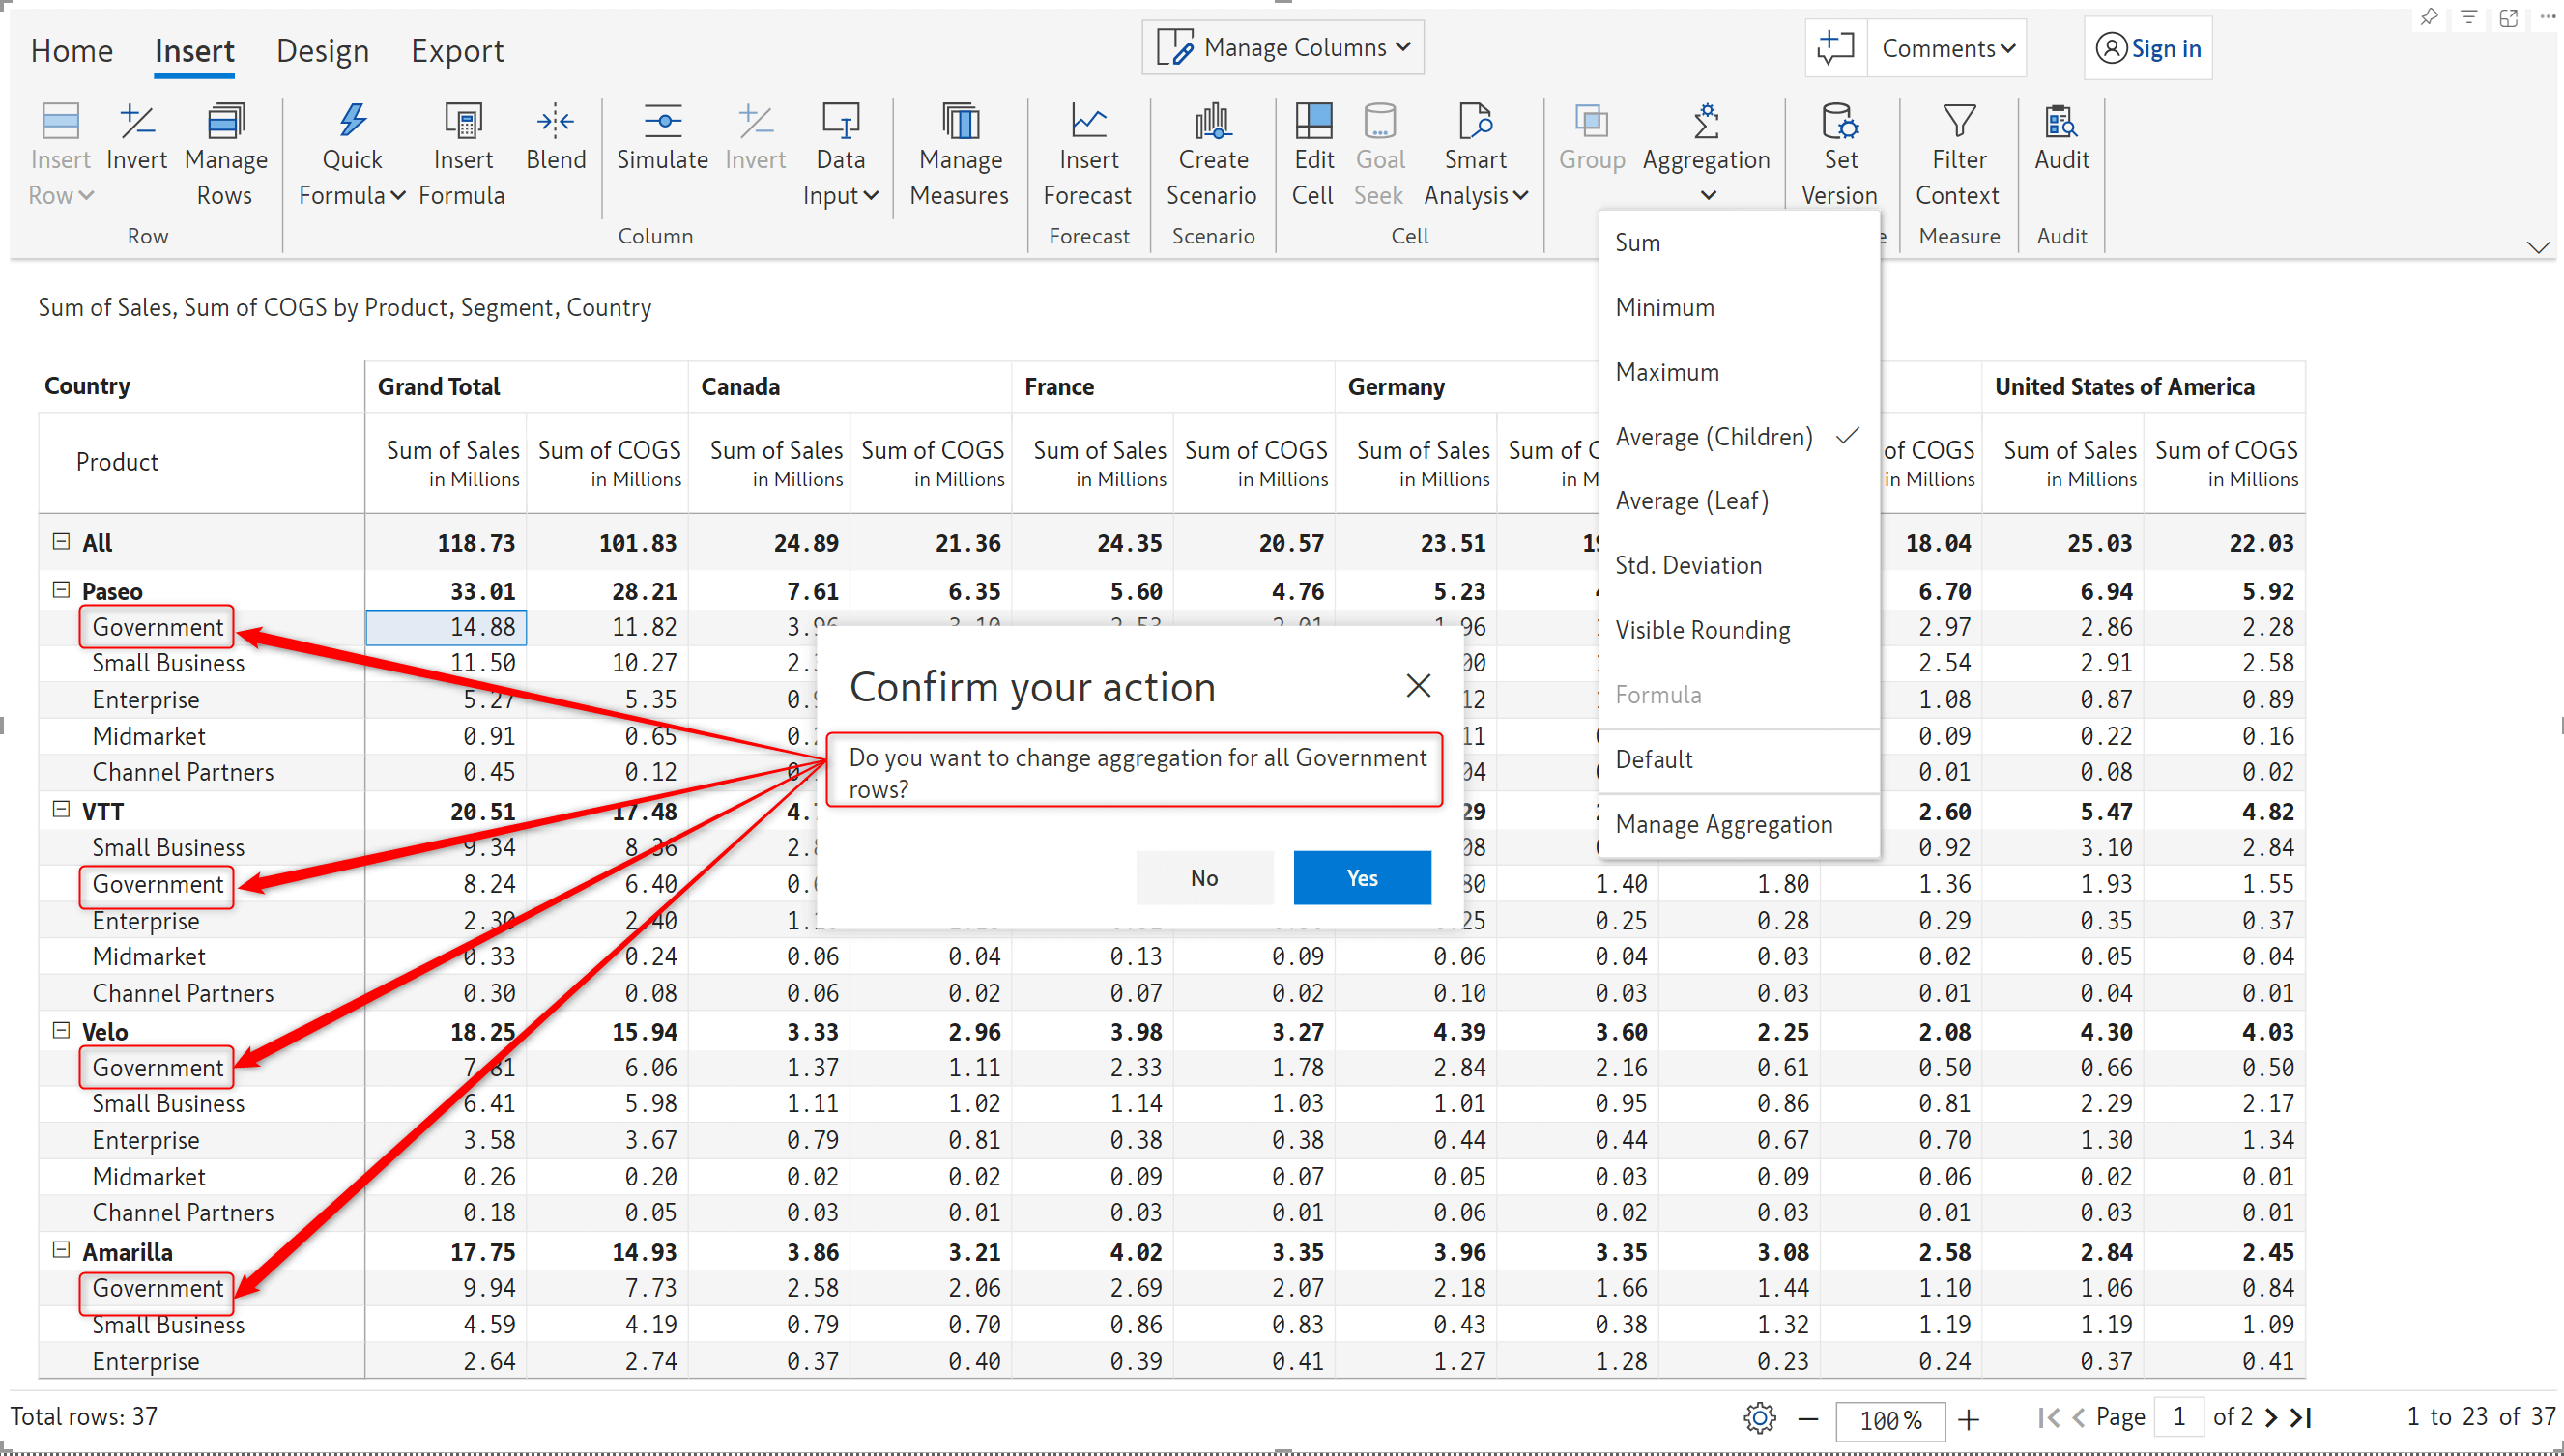
A highly anticipated feature: Inforiver now supports custom column aggregation. You can set the aggregation method for any cell in the grand total or subtotal columns. The best part is that it can be used with row aggregation. Column aggregation applies only to subtotal and grand total columns – just like row aggregation applies to subtotal/grand total rows.
To apply column aggregation, click on the cell in the grand total/subtotal column and select the aggregation type from the dropdown menu.
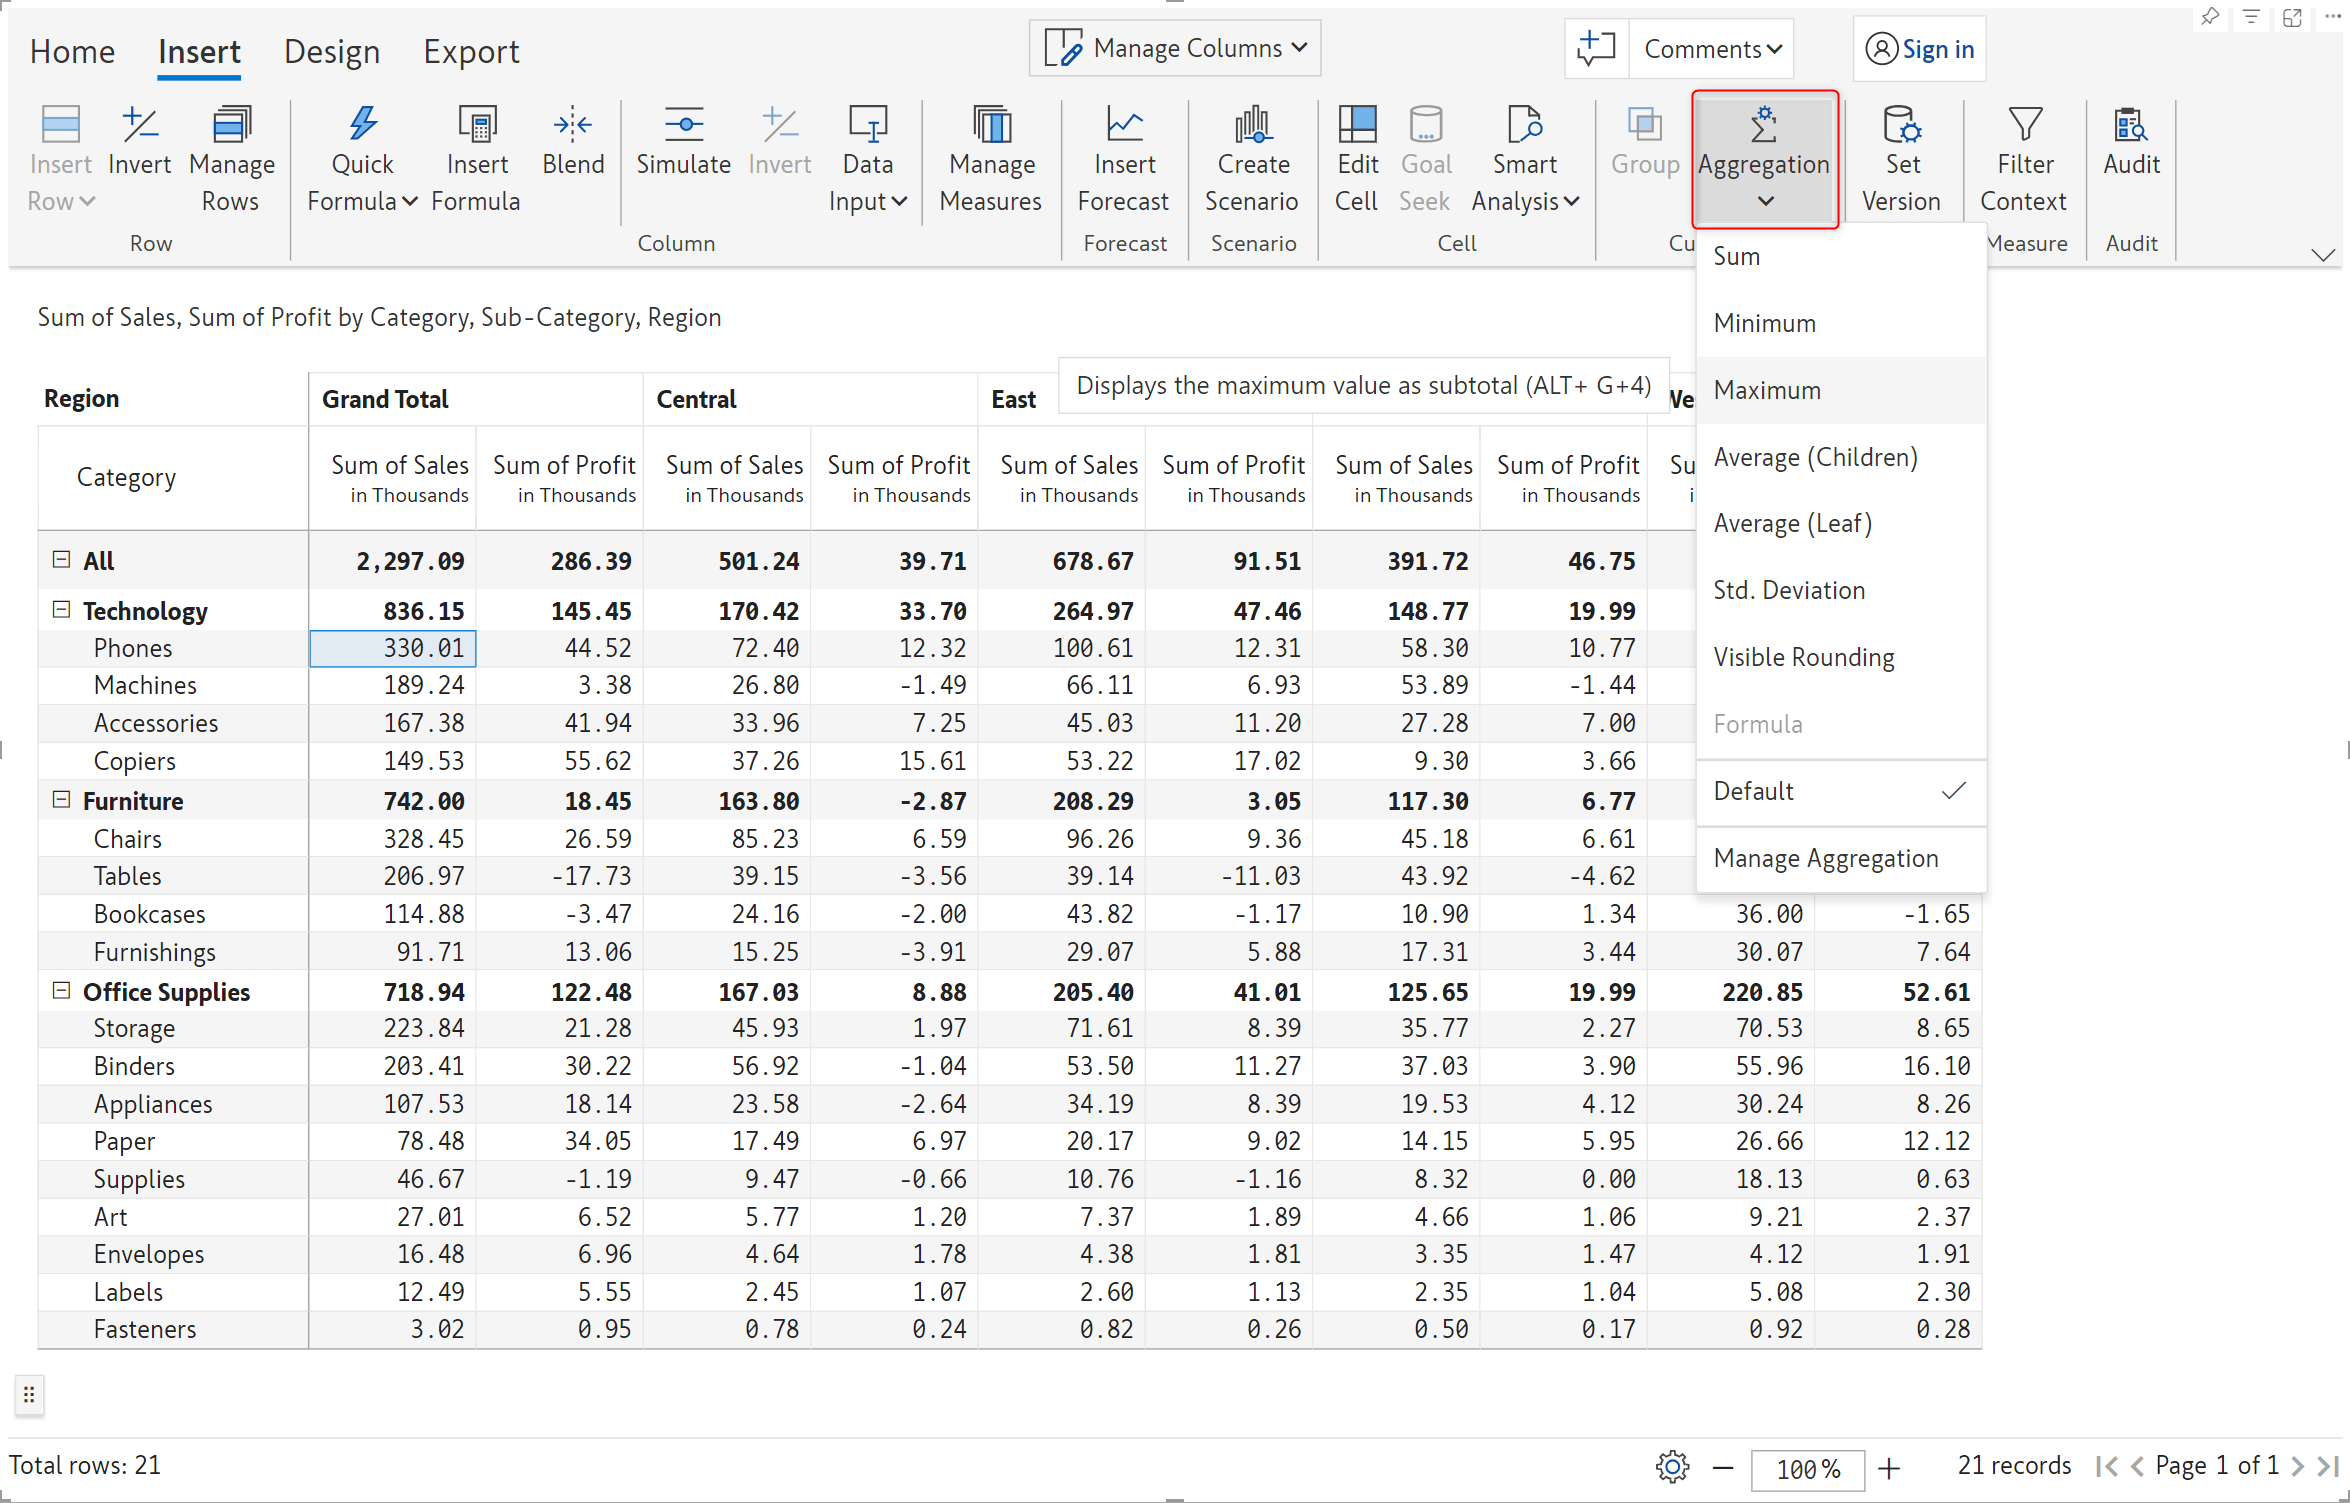
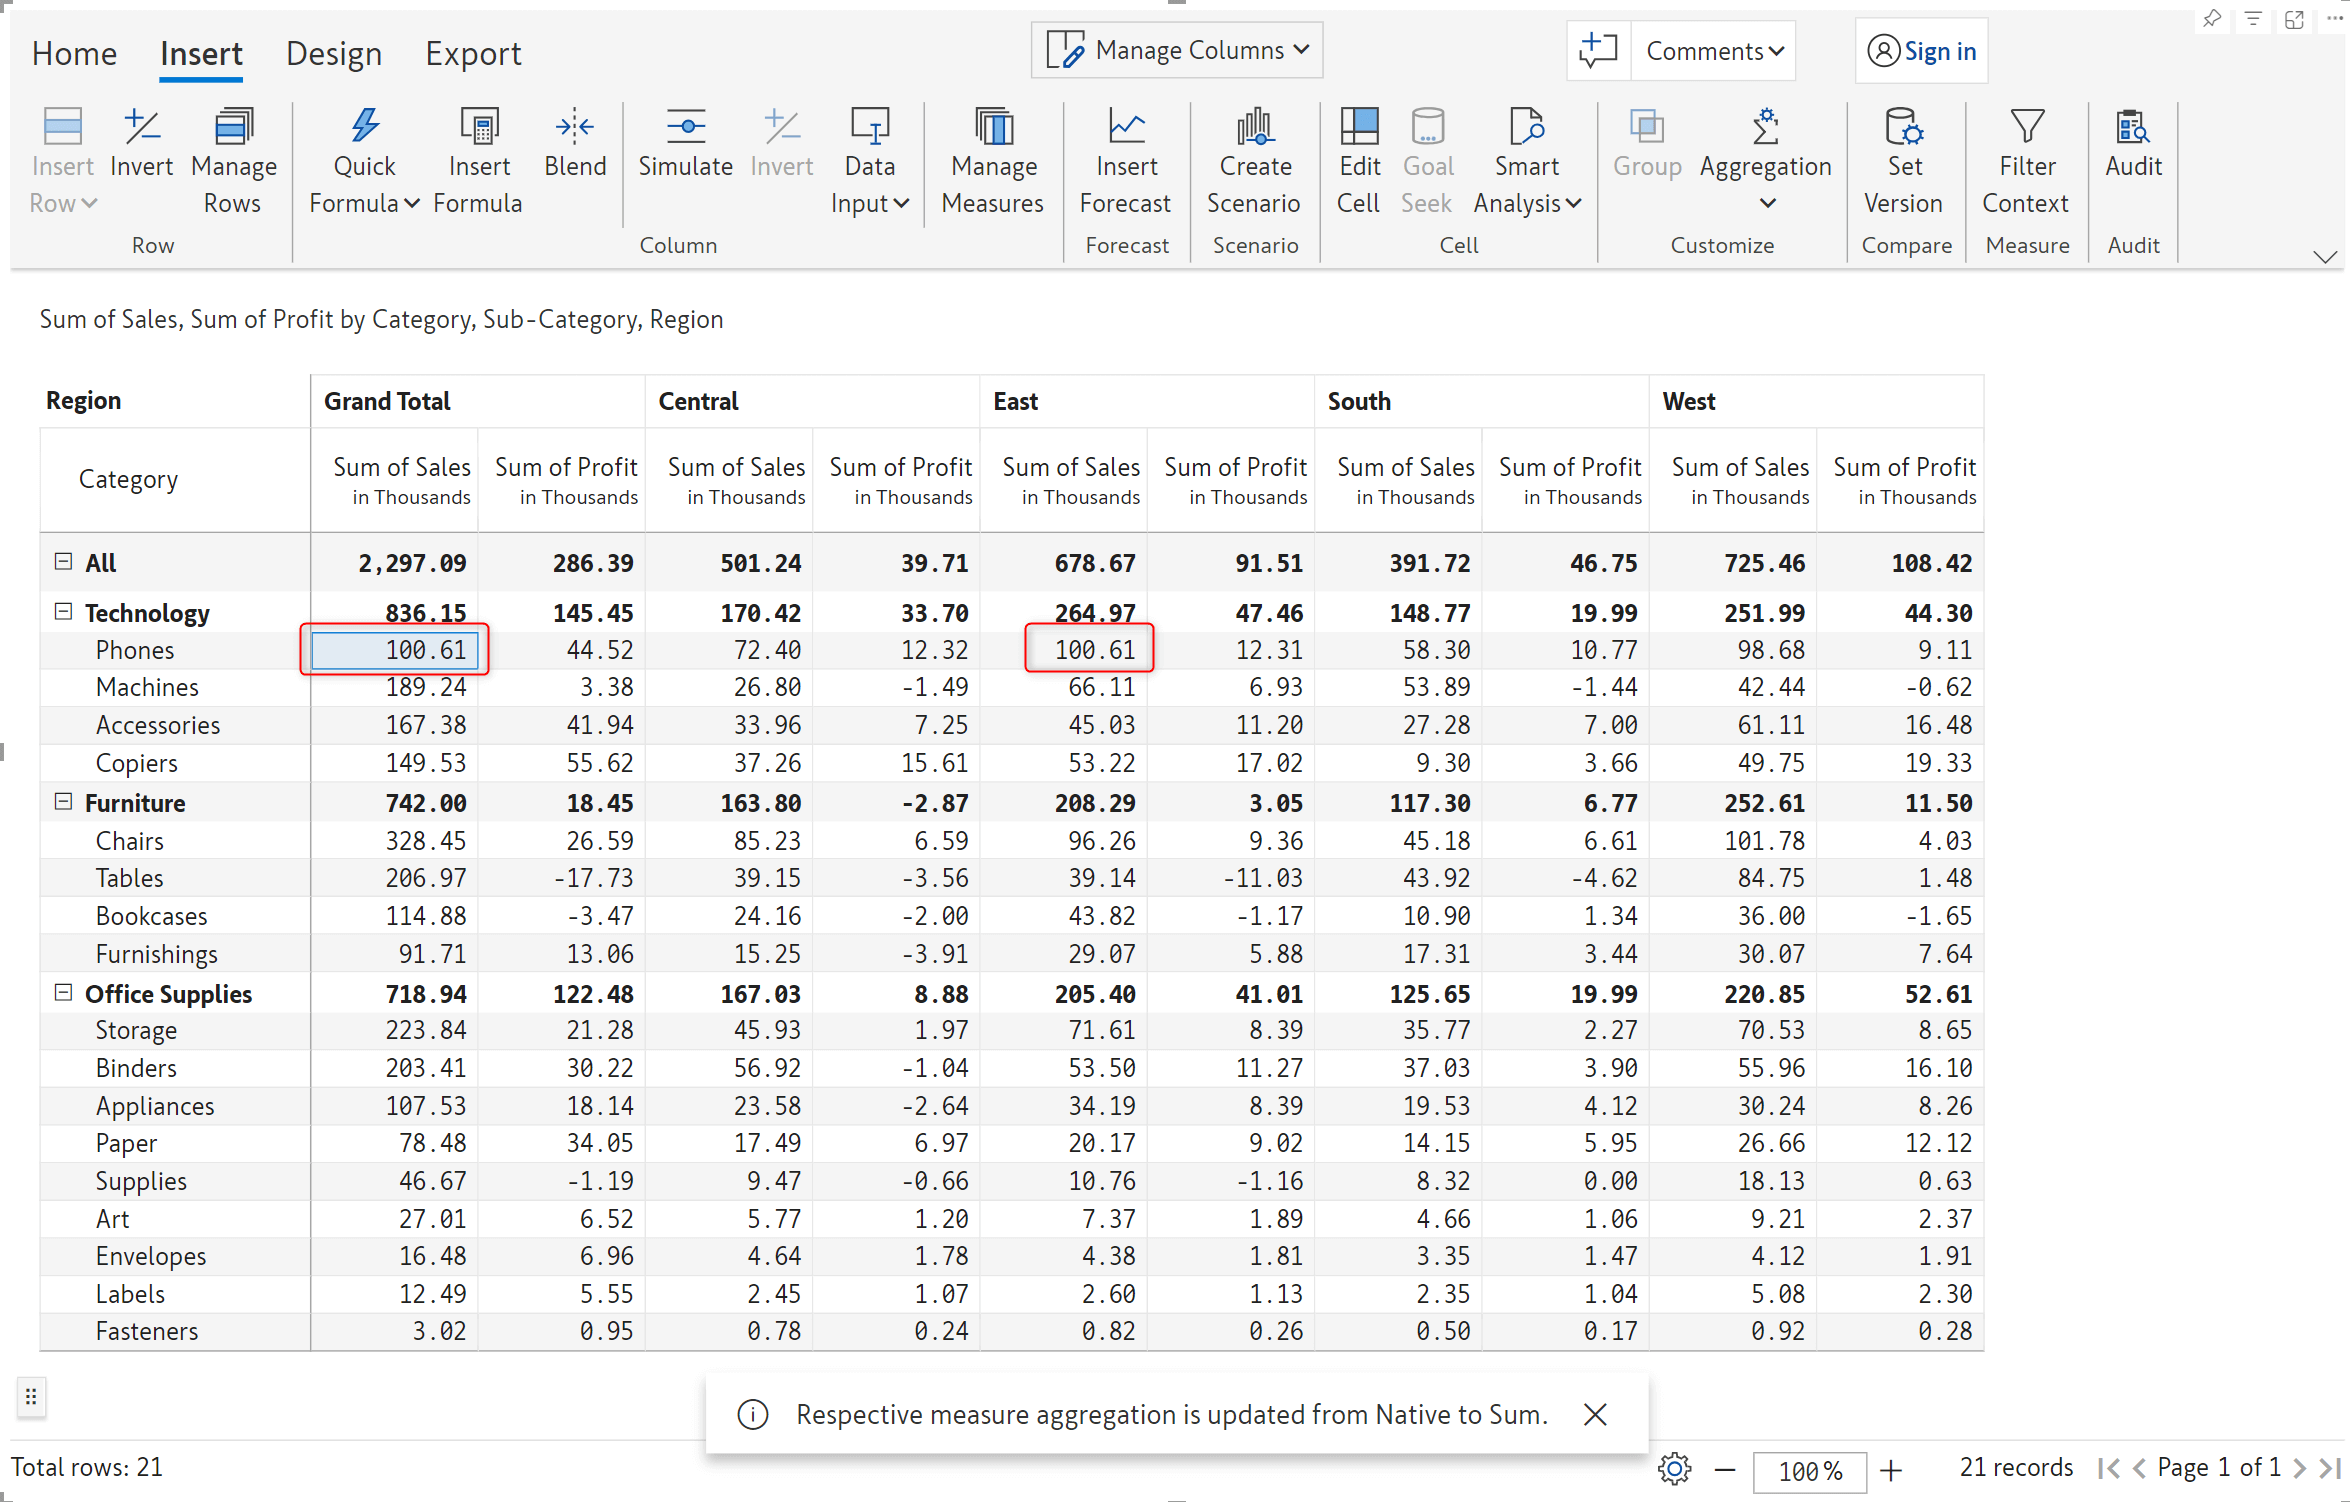
We’ve set a custom aggregation of Maximum for the Phones grand total sales.
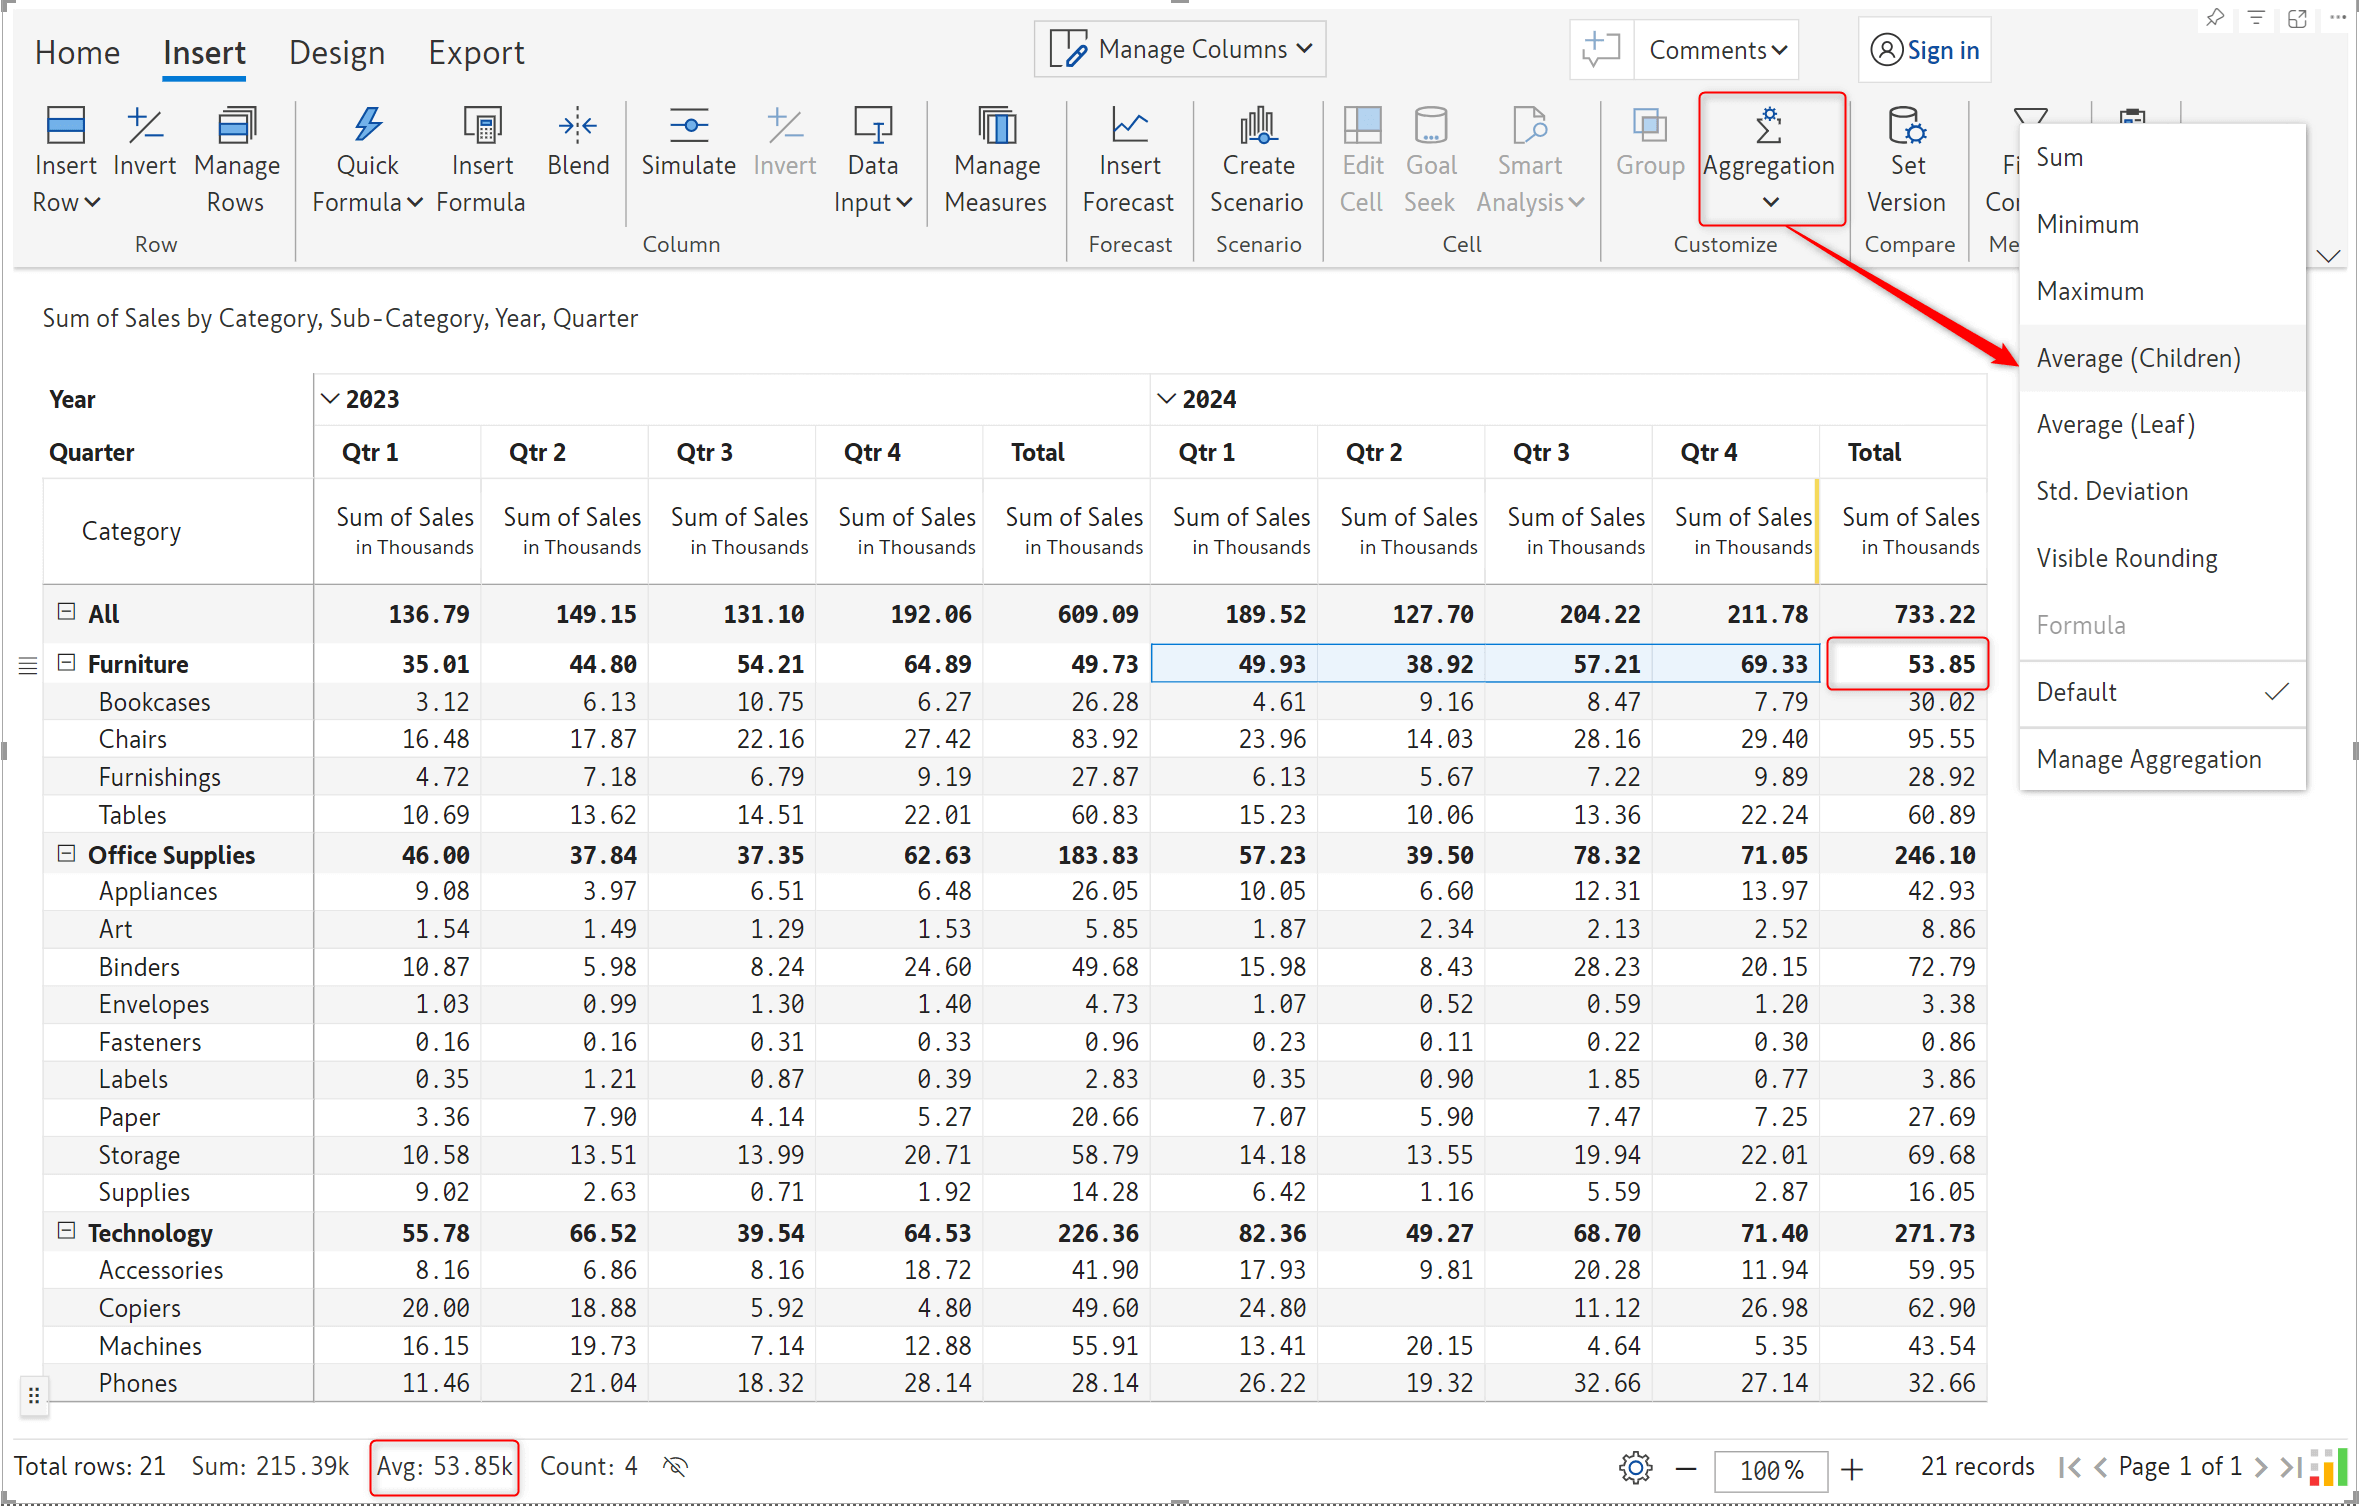
In this example, we’ve used Average as the aggregation method for Furniture subtotals for 2024.
We’ve also enhanced the aggregation interface to display categories on which custom row or column aggregation has been applied, enabling you to track all your aggregations in a single window. In this example, notice how we have applied column aggregation (Maximum) on the Furniture grand total and row aggregation (Sum).
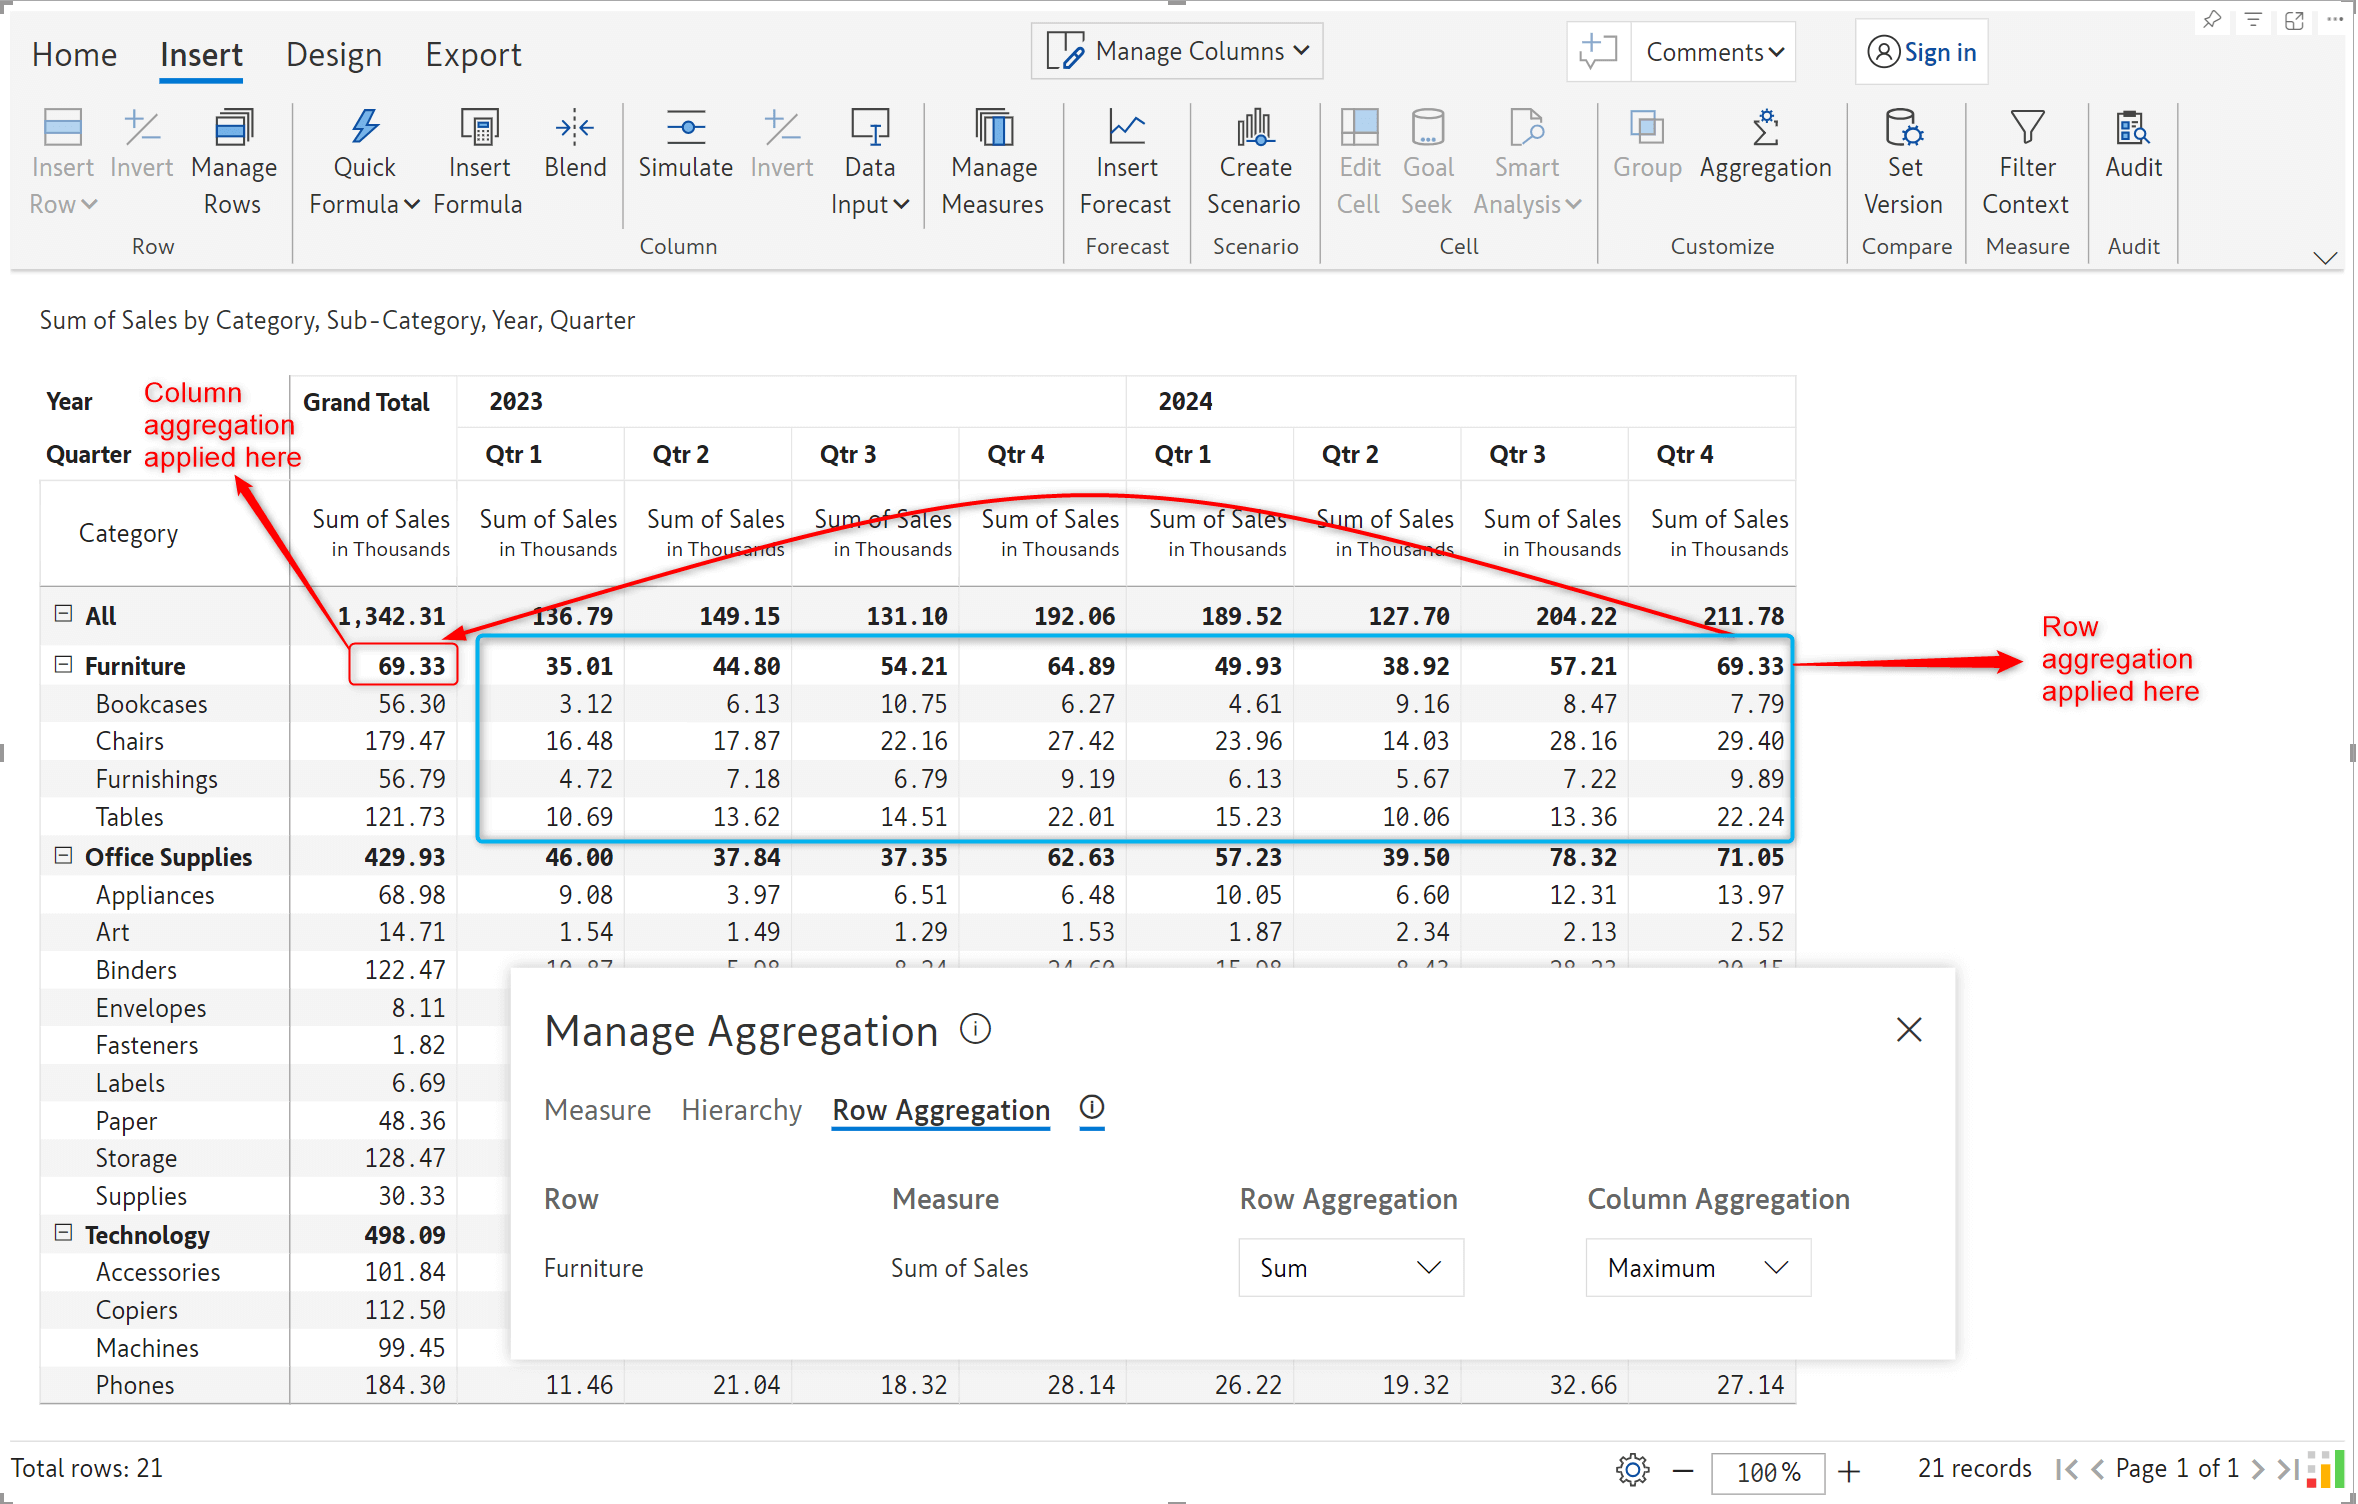
Please note that leaf nodes in the column grand total/subtotals can only have column aggregation.
When you have the same category repeated across all levels of the hierarchy, Inforiver will detect repeating categories and allow you to apply the same aggregation method to all the levels in a single click.
Weighted averages are used in reports to provide a more representative summary of data, taking into account the varying importance of the data points involved. With the latest version, Inforiver can calculate row totals based on weighted average – you can specify the measure to use as weightage.
To demonstrate this feature, we’ve used the Quantity as the weight to create a new Weighted average measure. Note that the weighted average is a row aggregation method, so only the total and subtotal rows will reflect the calculation.
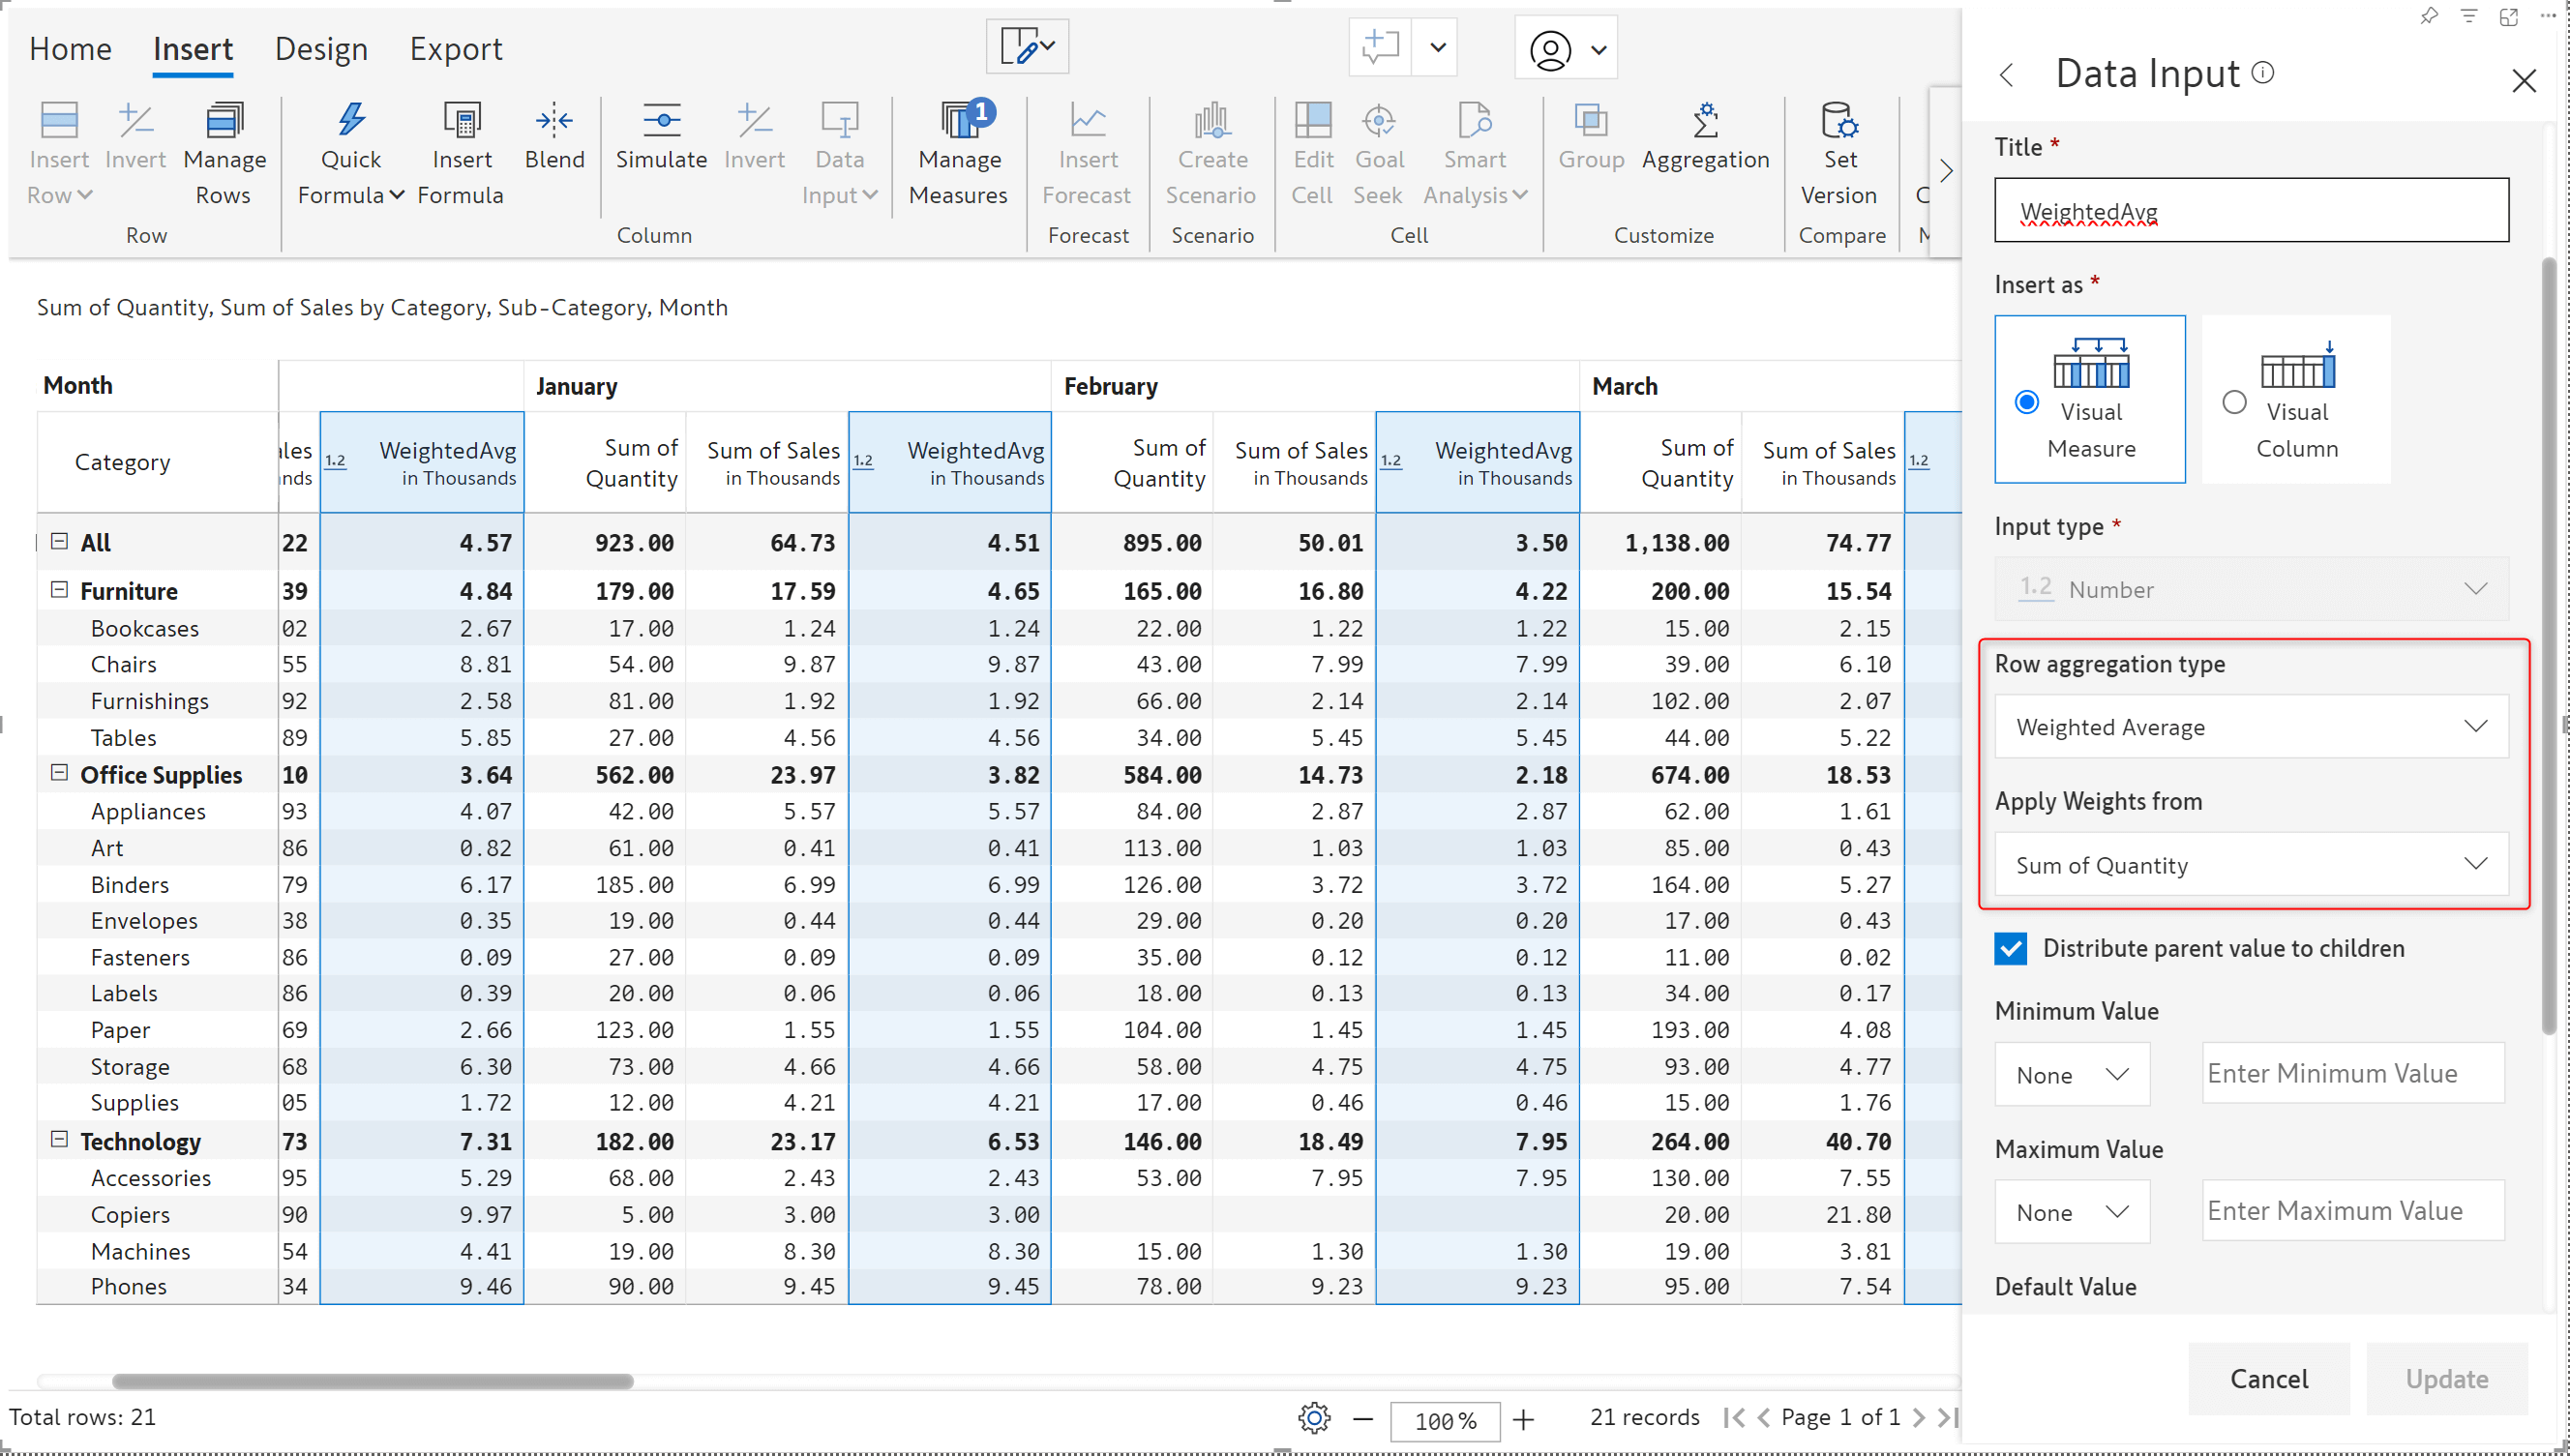
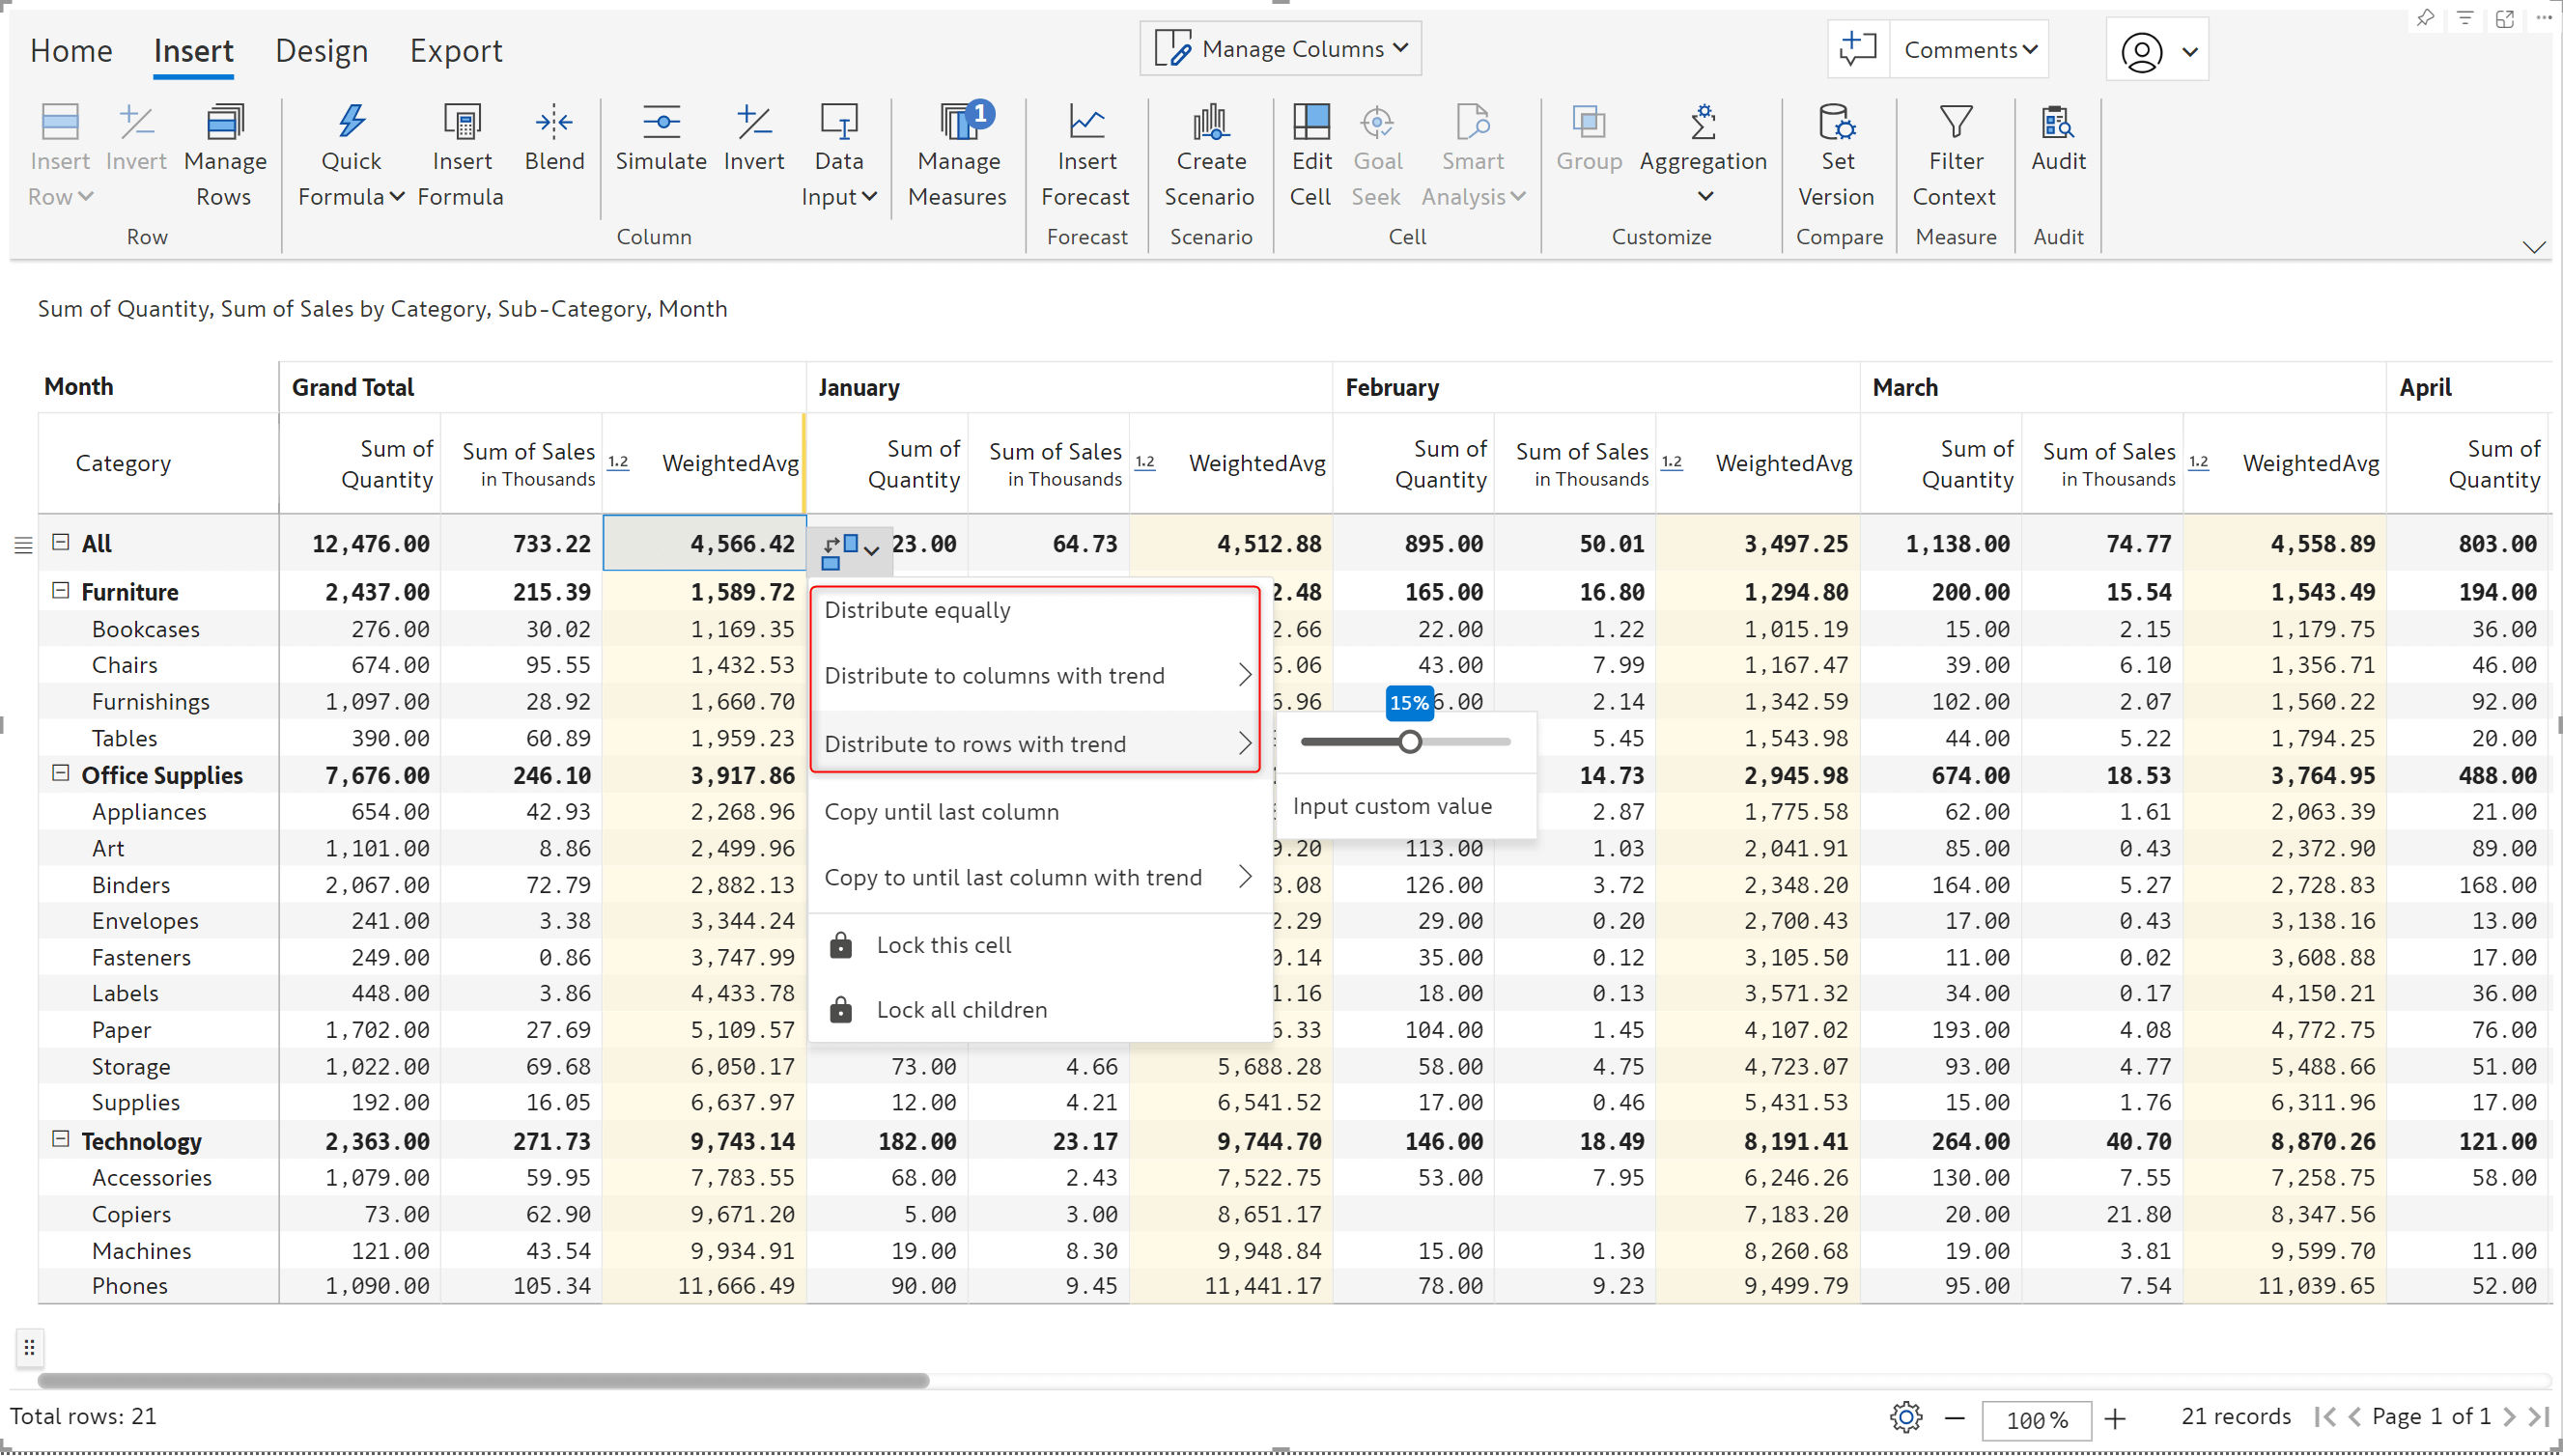
You also have the option to distribute the weighted average values to child rows. In earlier versions, distribution was enabled only when the row aggregation type was set to sum.
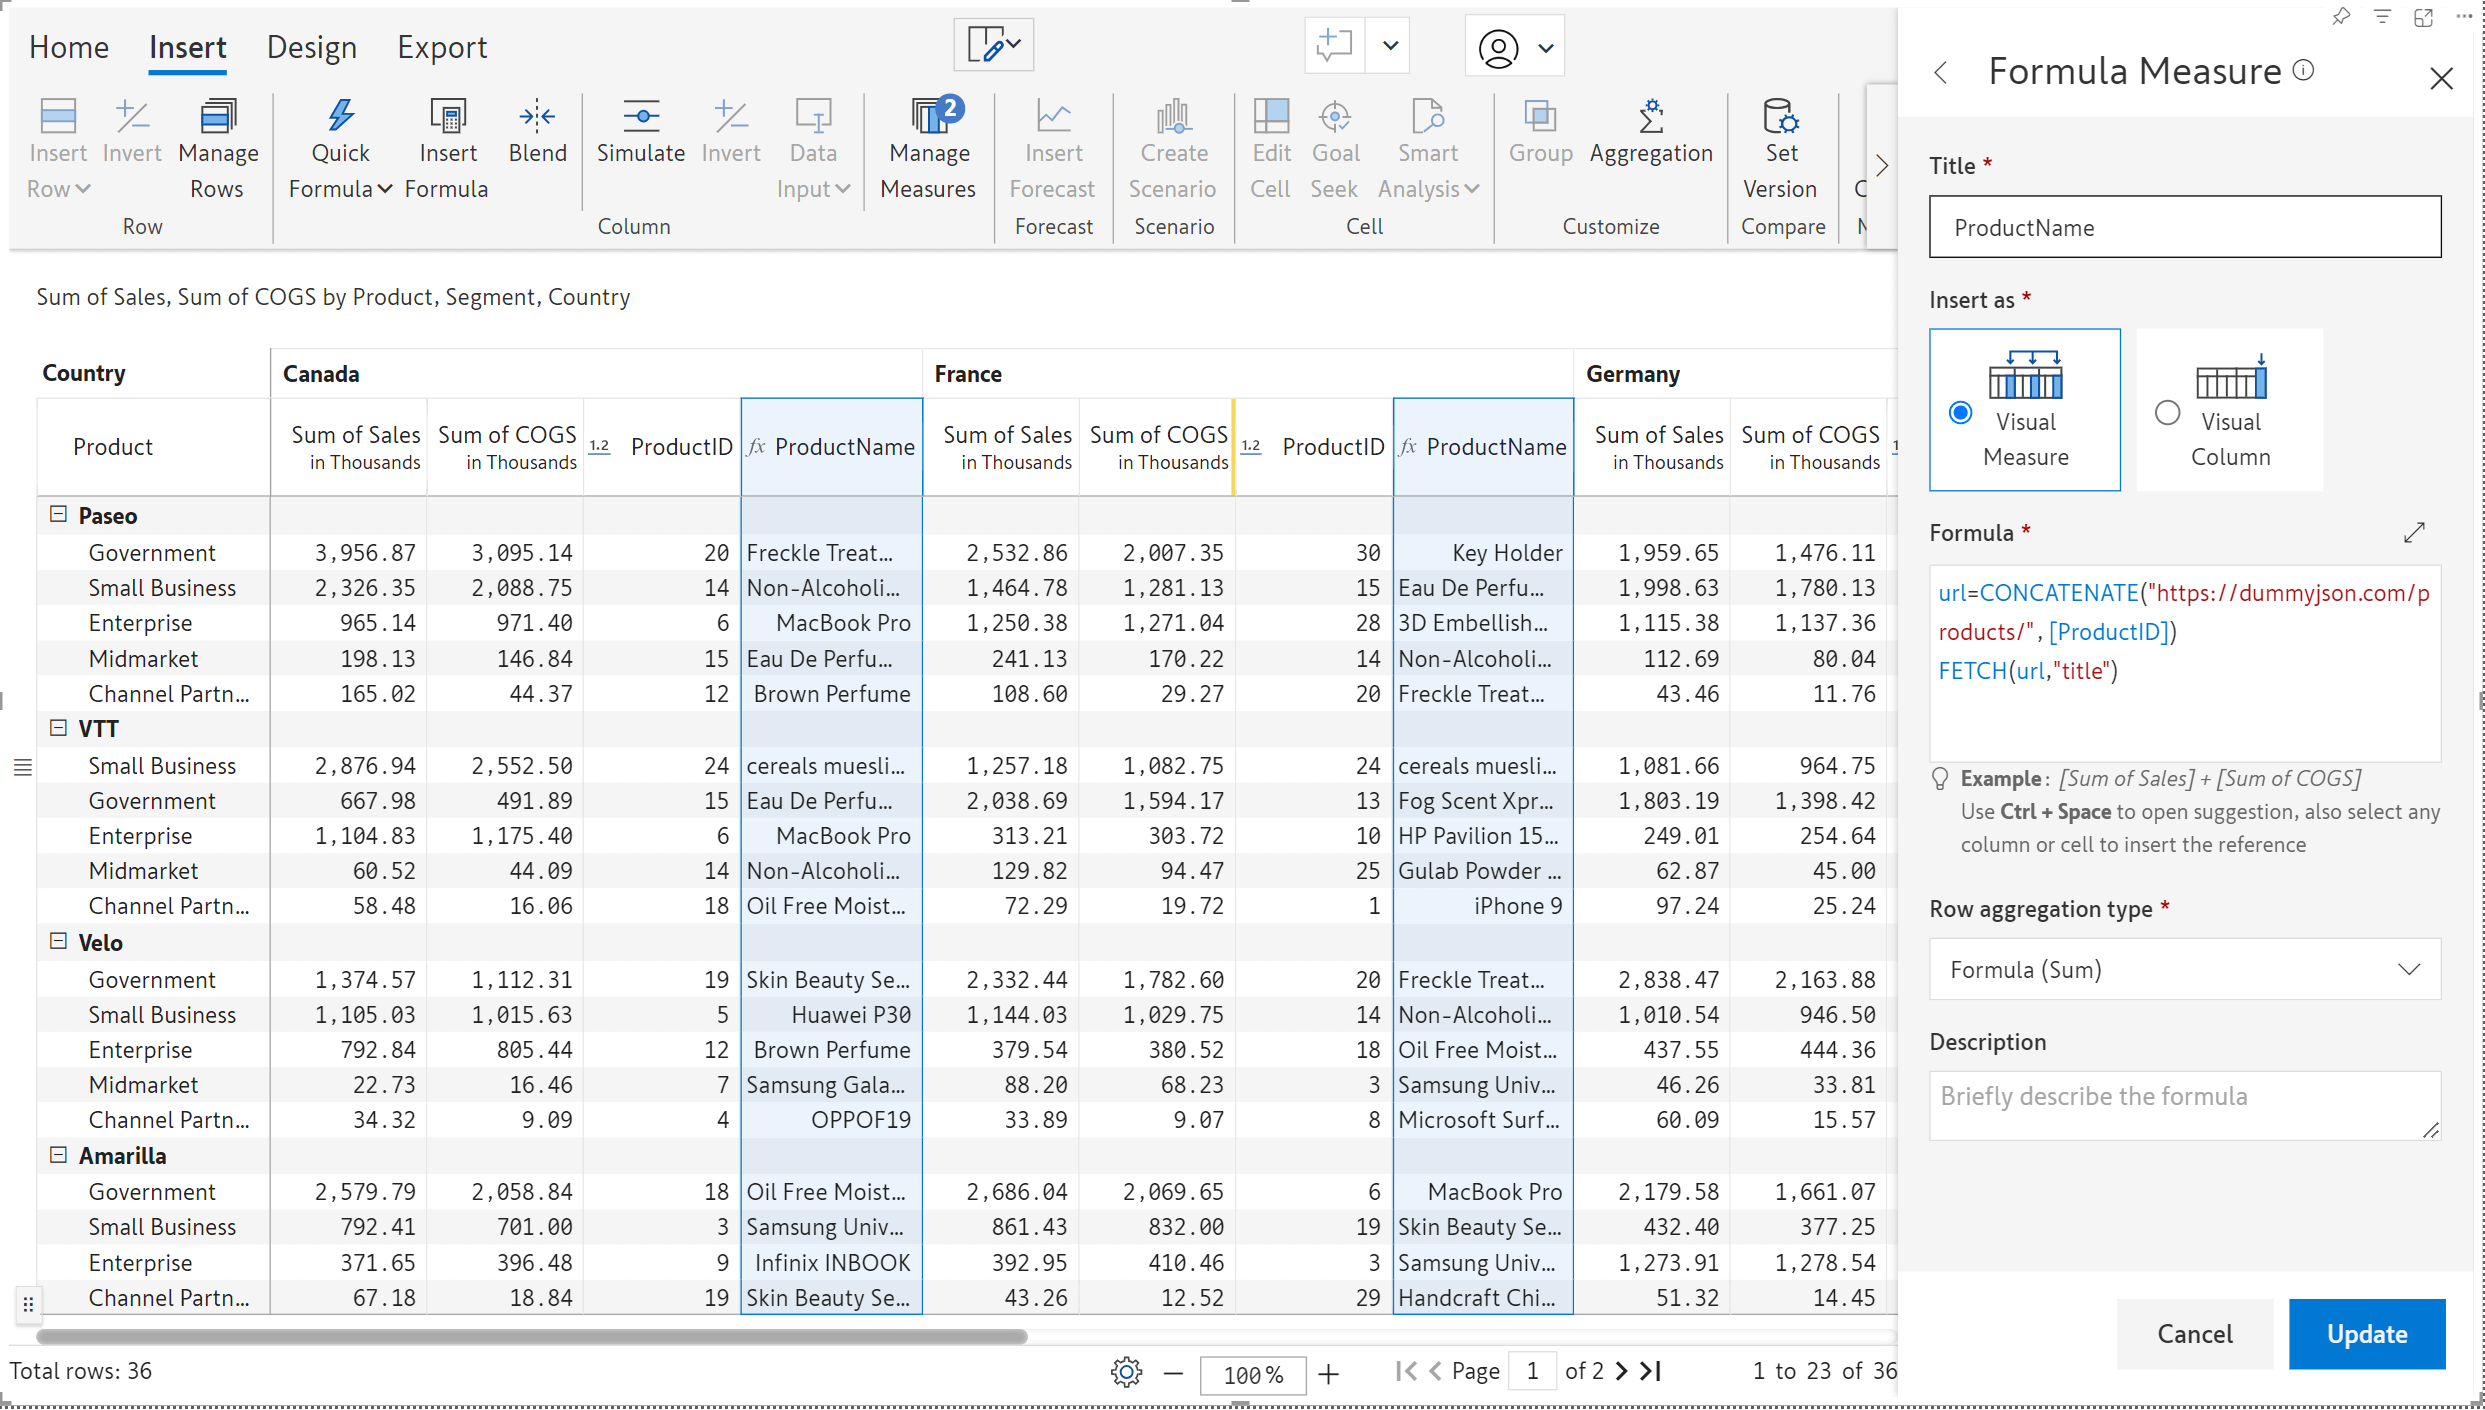
The new Fetch function enables you to retrieve data from a URL in real-time. You can even pass parameters to extract specific data. For example, you can pass the product Id from your reports and dynamically retrieve the associated details from a server (API call). In this use case, we are retrieving the product title by passing the product ID to a webservice.
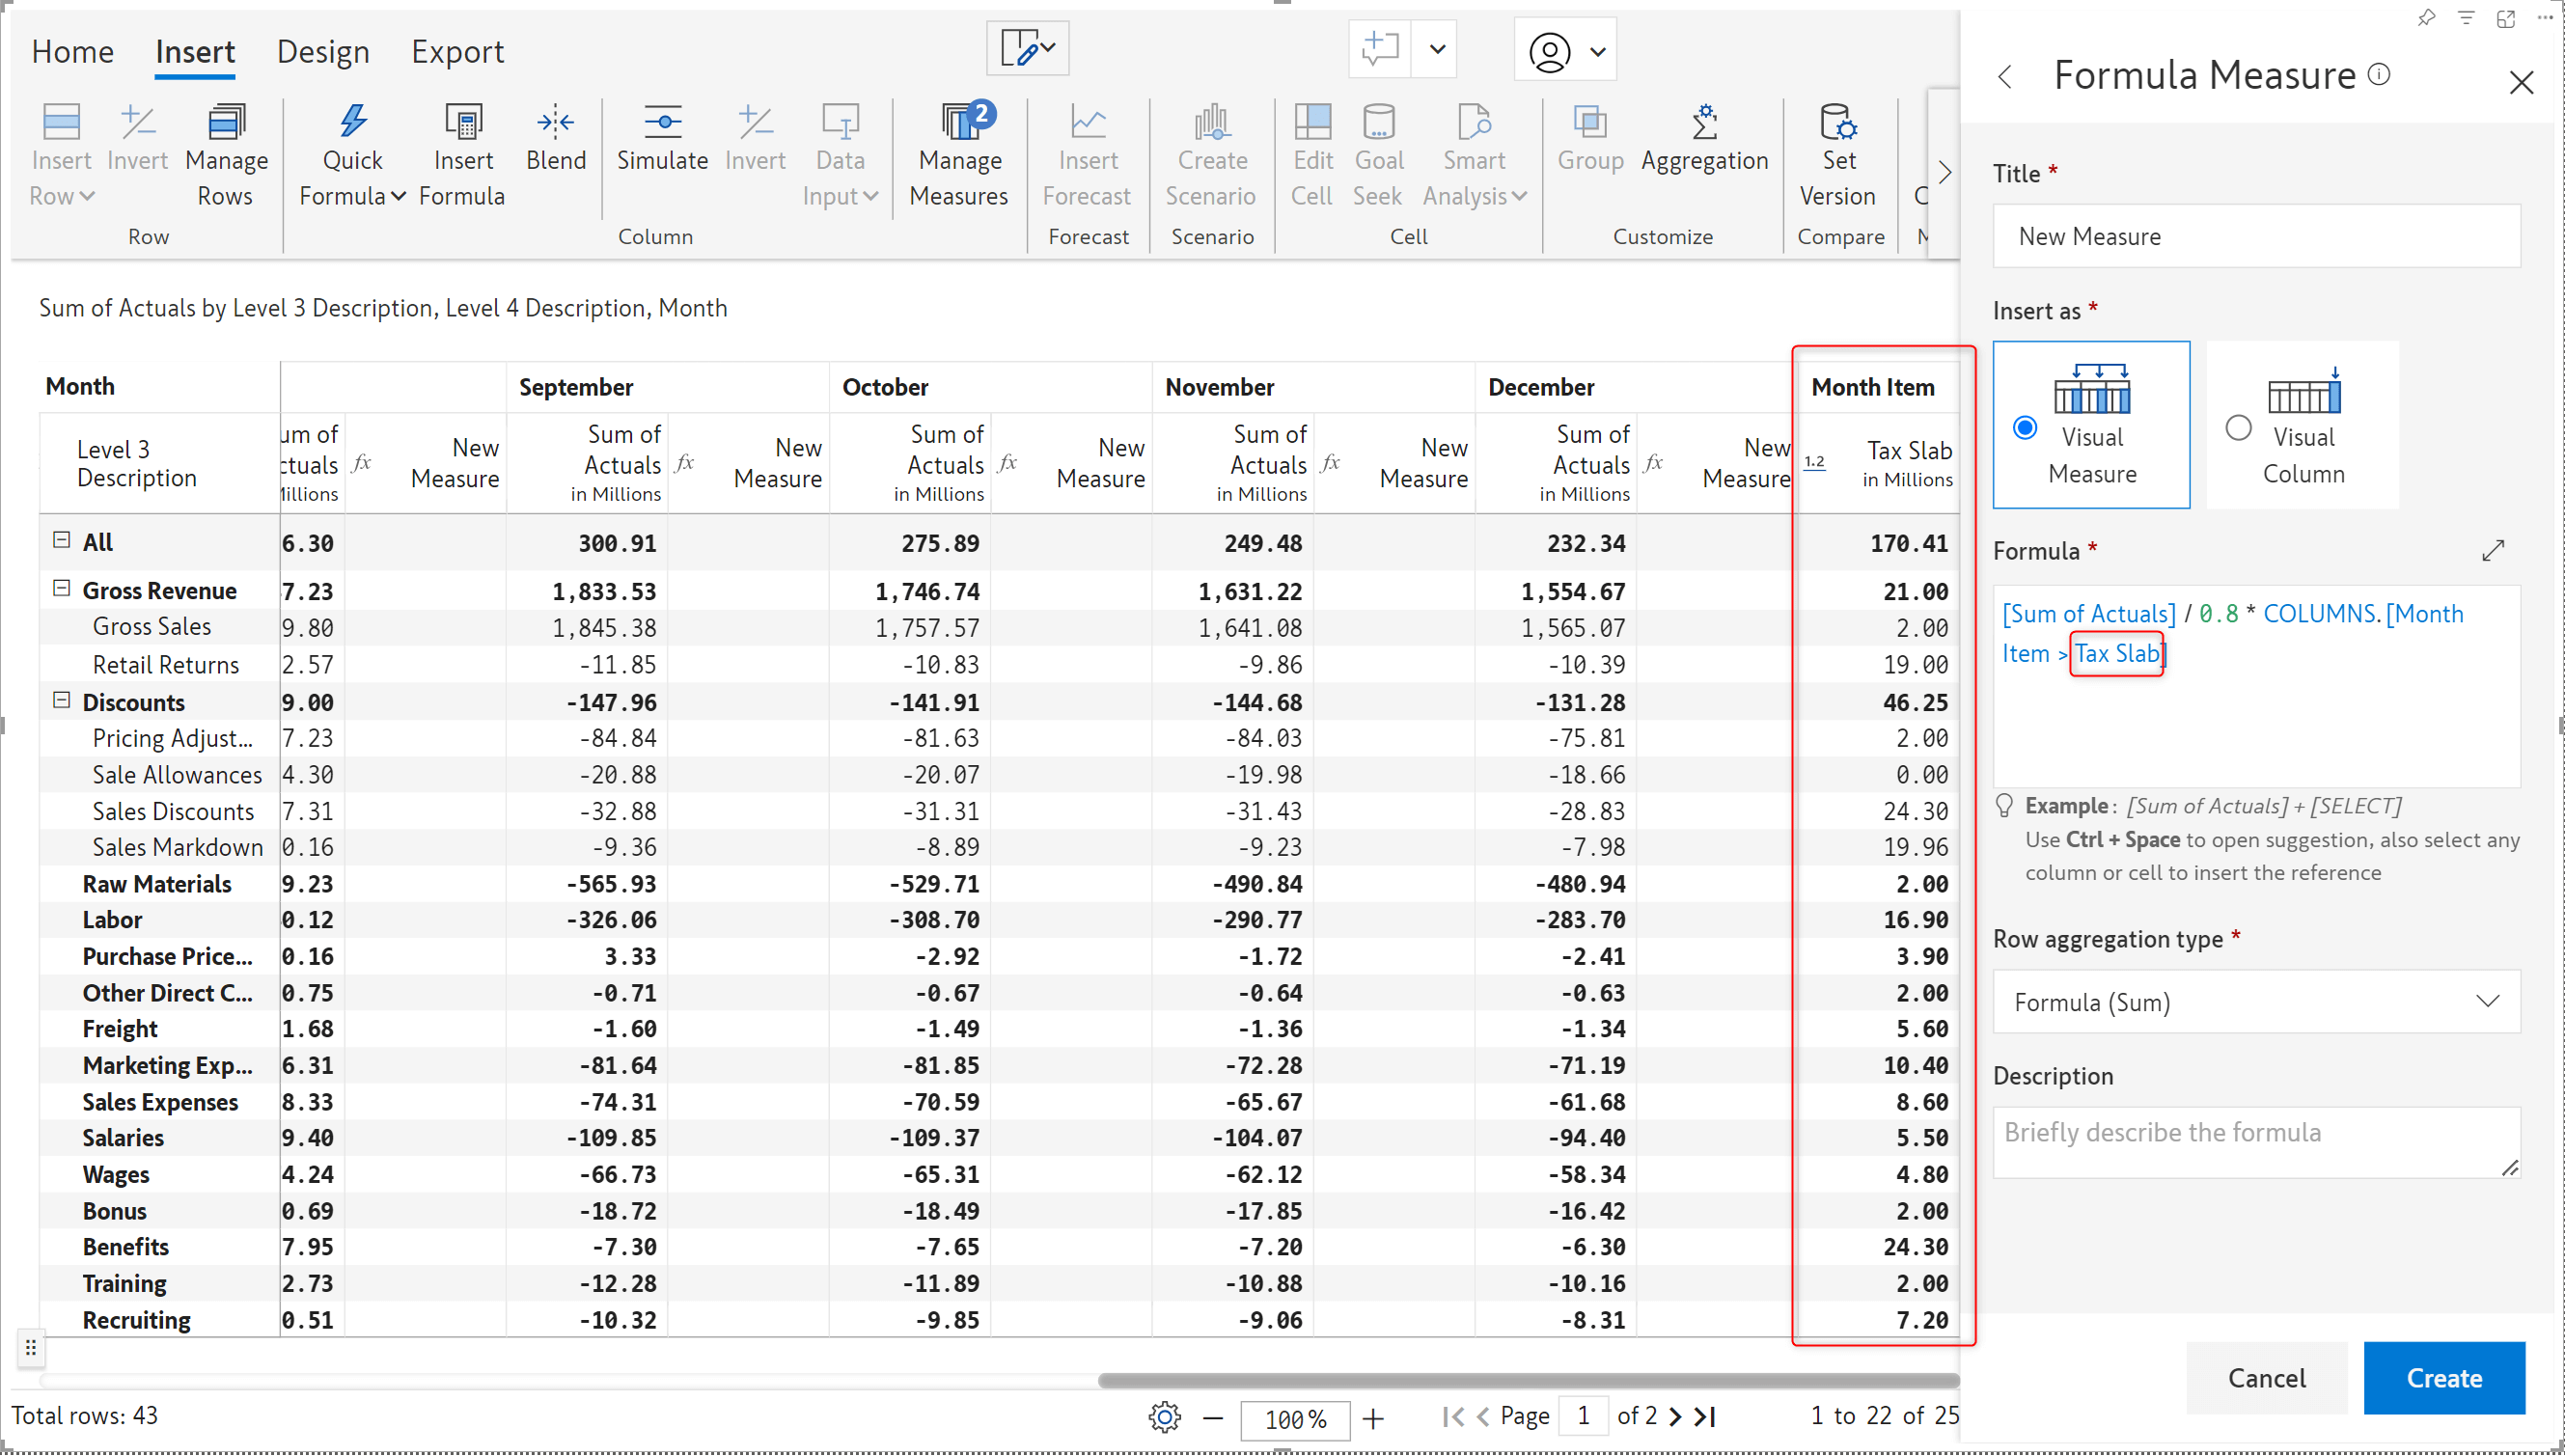
Data input fields like interest rates, tax slabs, or FX rates may be common to all the column dimensions and can be created as visual columns. Often, the need arises to perform calculations based on such visual columns. With the latest release, you can easily reference data input visual columns in visual measures using the COLUMN prefix.
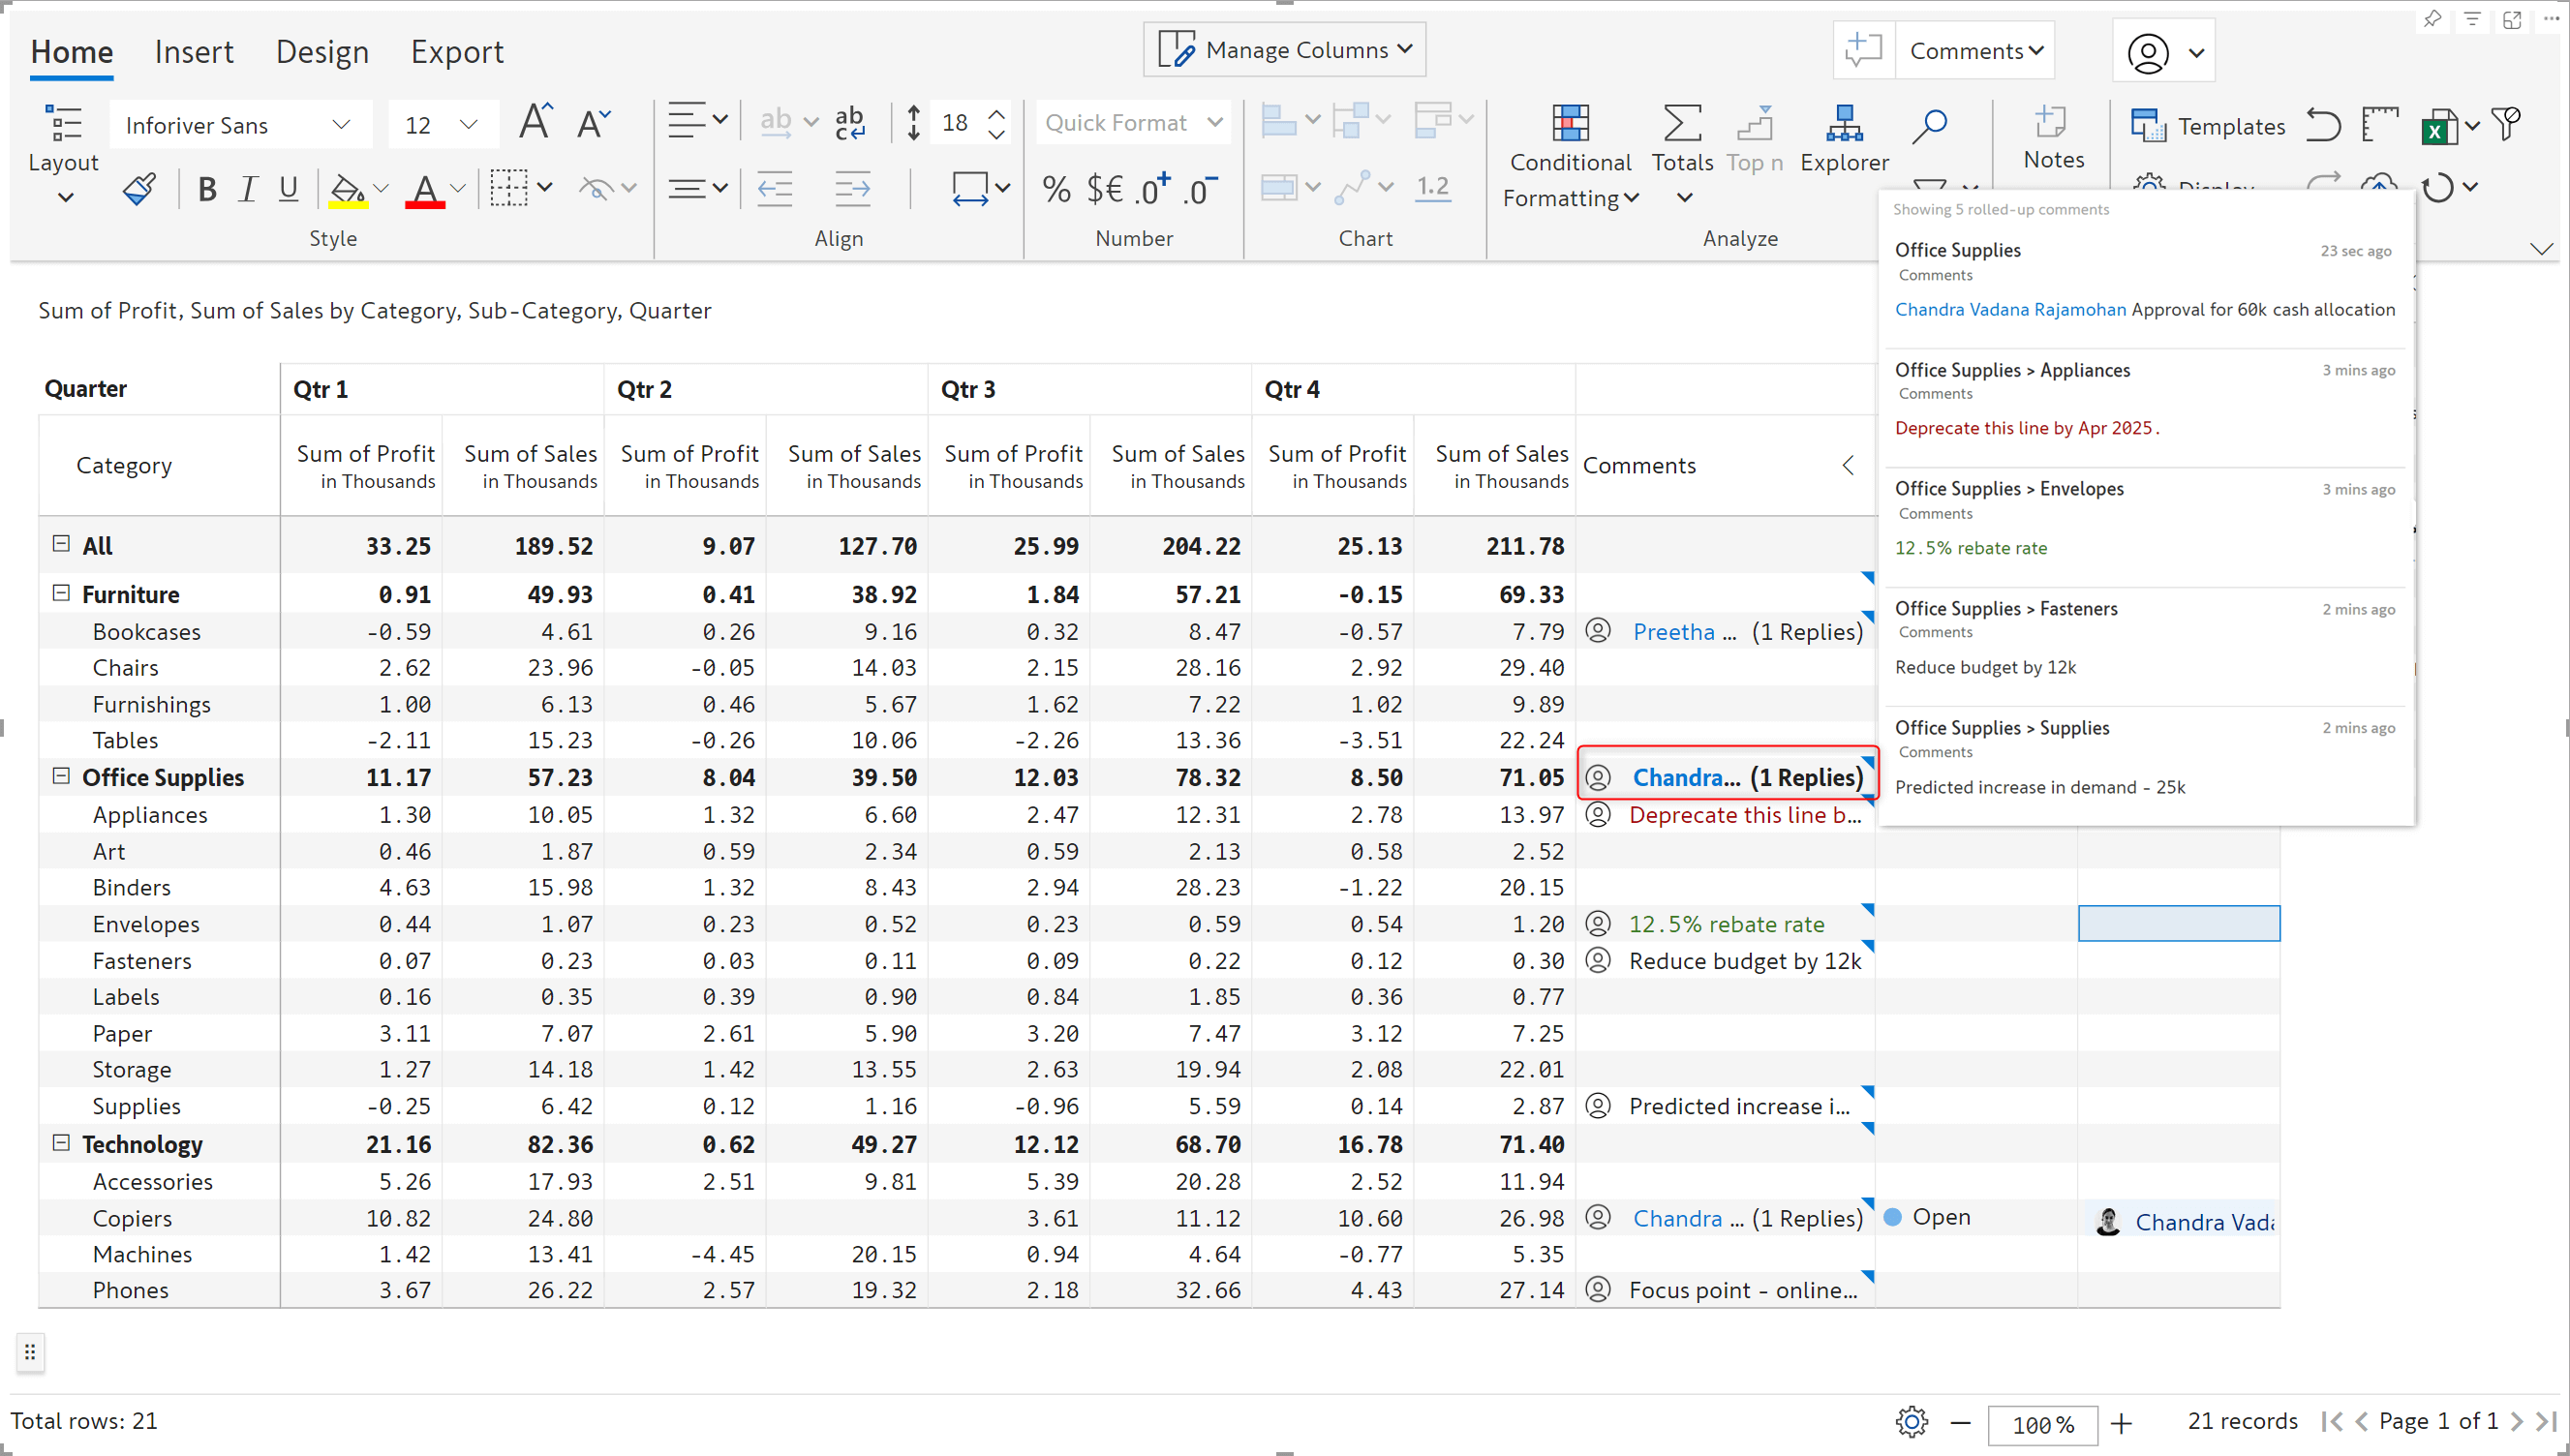
Inforiver’s annotation capability enables you to capture perspective and background data in your reports with comments. You can add row-level comments by enabling the comments column. With the latest release, Inforiver can roll up row-level comments for hierarchical data. When you hover over the parent cell, all the row-level comments will be displayed in a consolidated window.
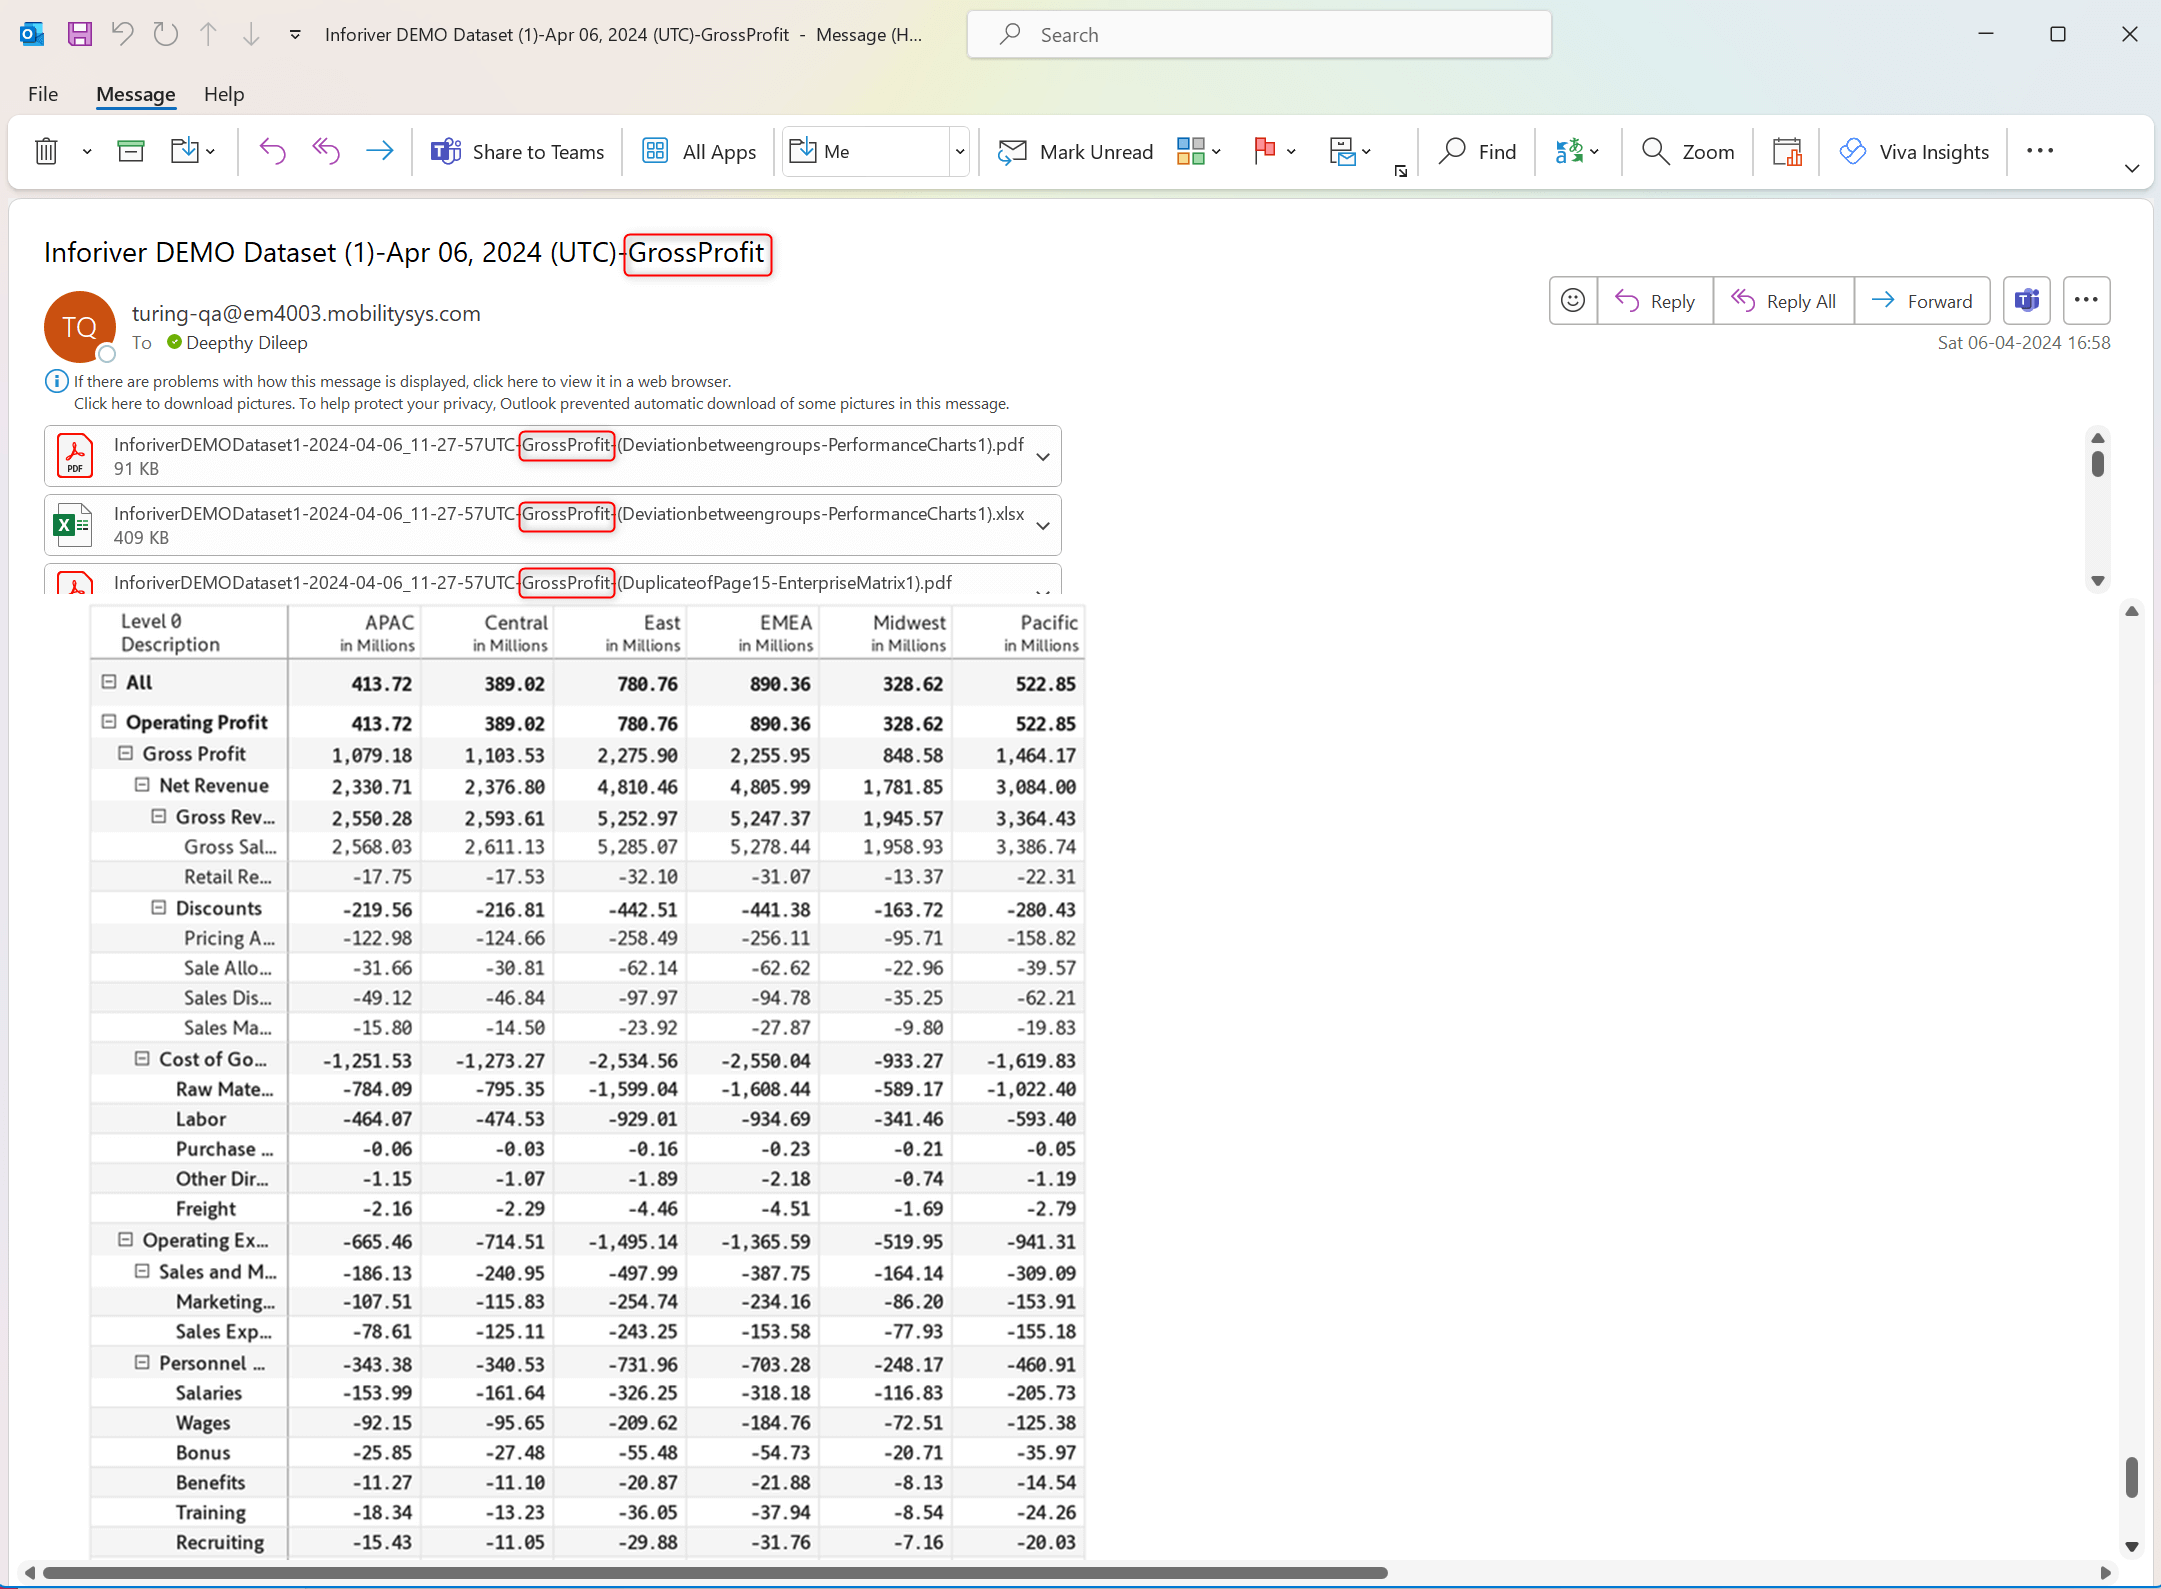
For email-based subscriptions, bookmarks created in your reports can be used in the subject, body, and email attachment.
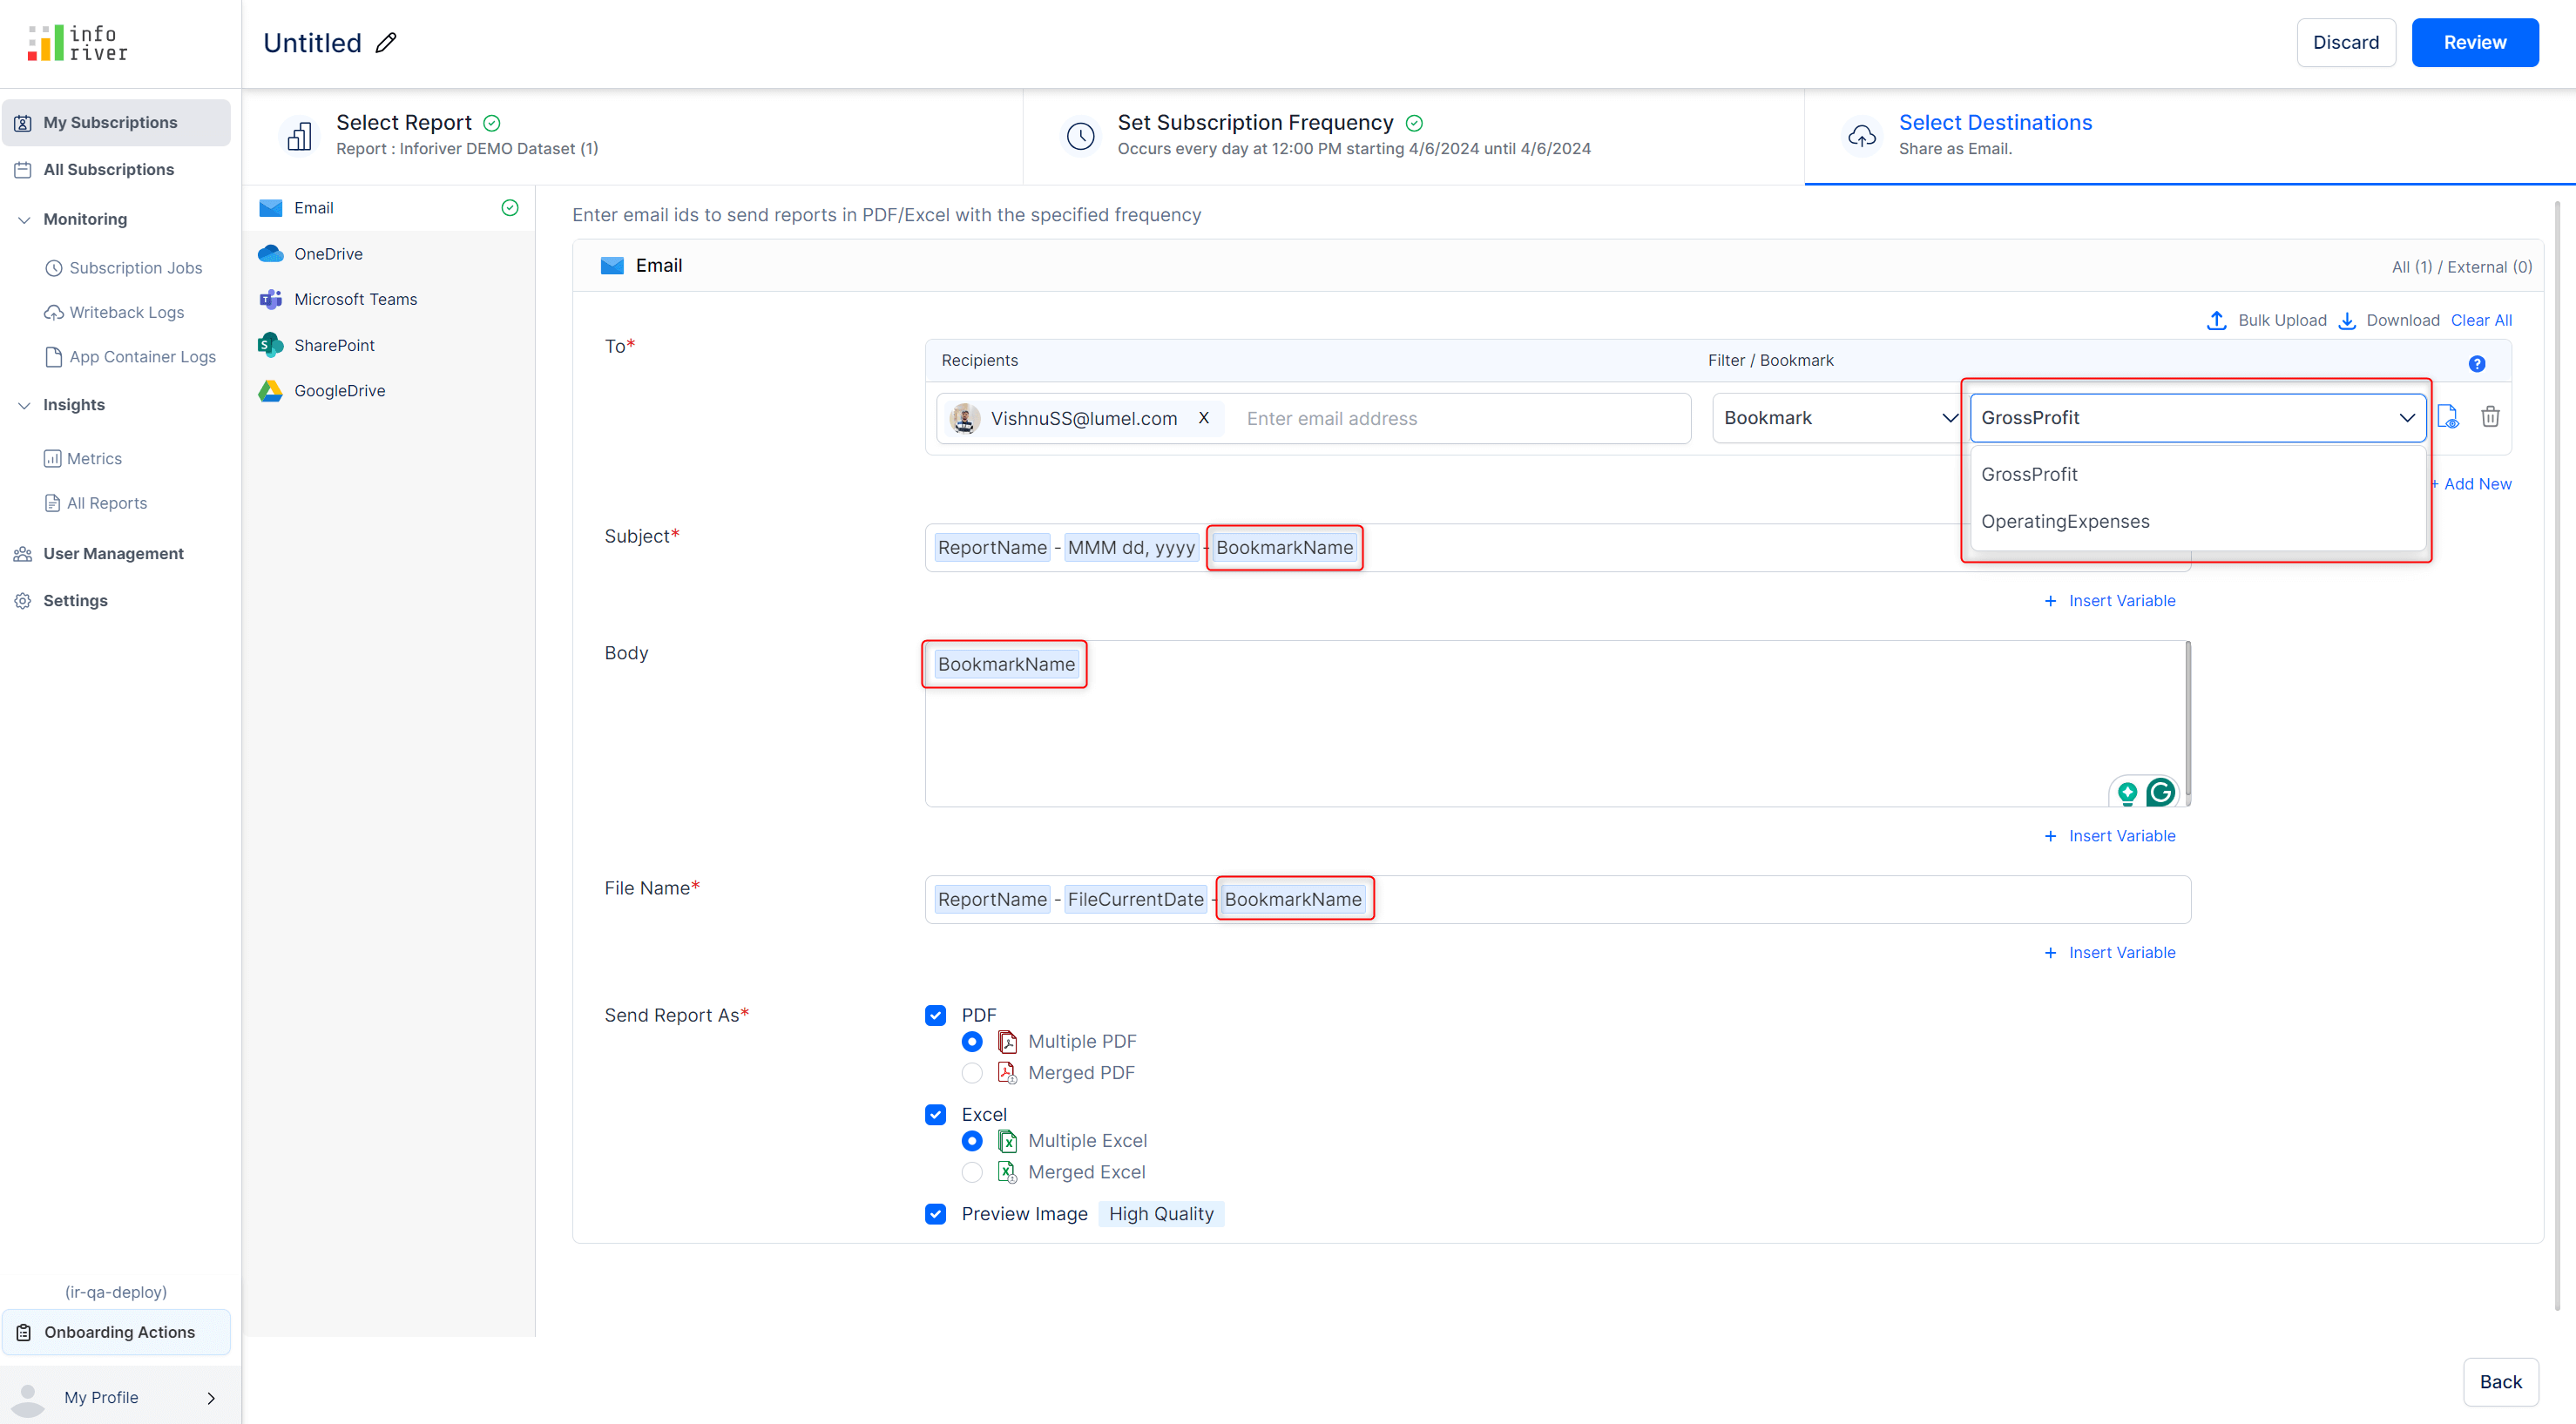
The bookmark name has been used in the subject, body, and attachment of the email.
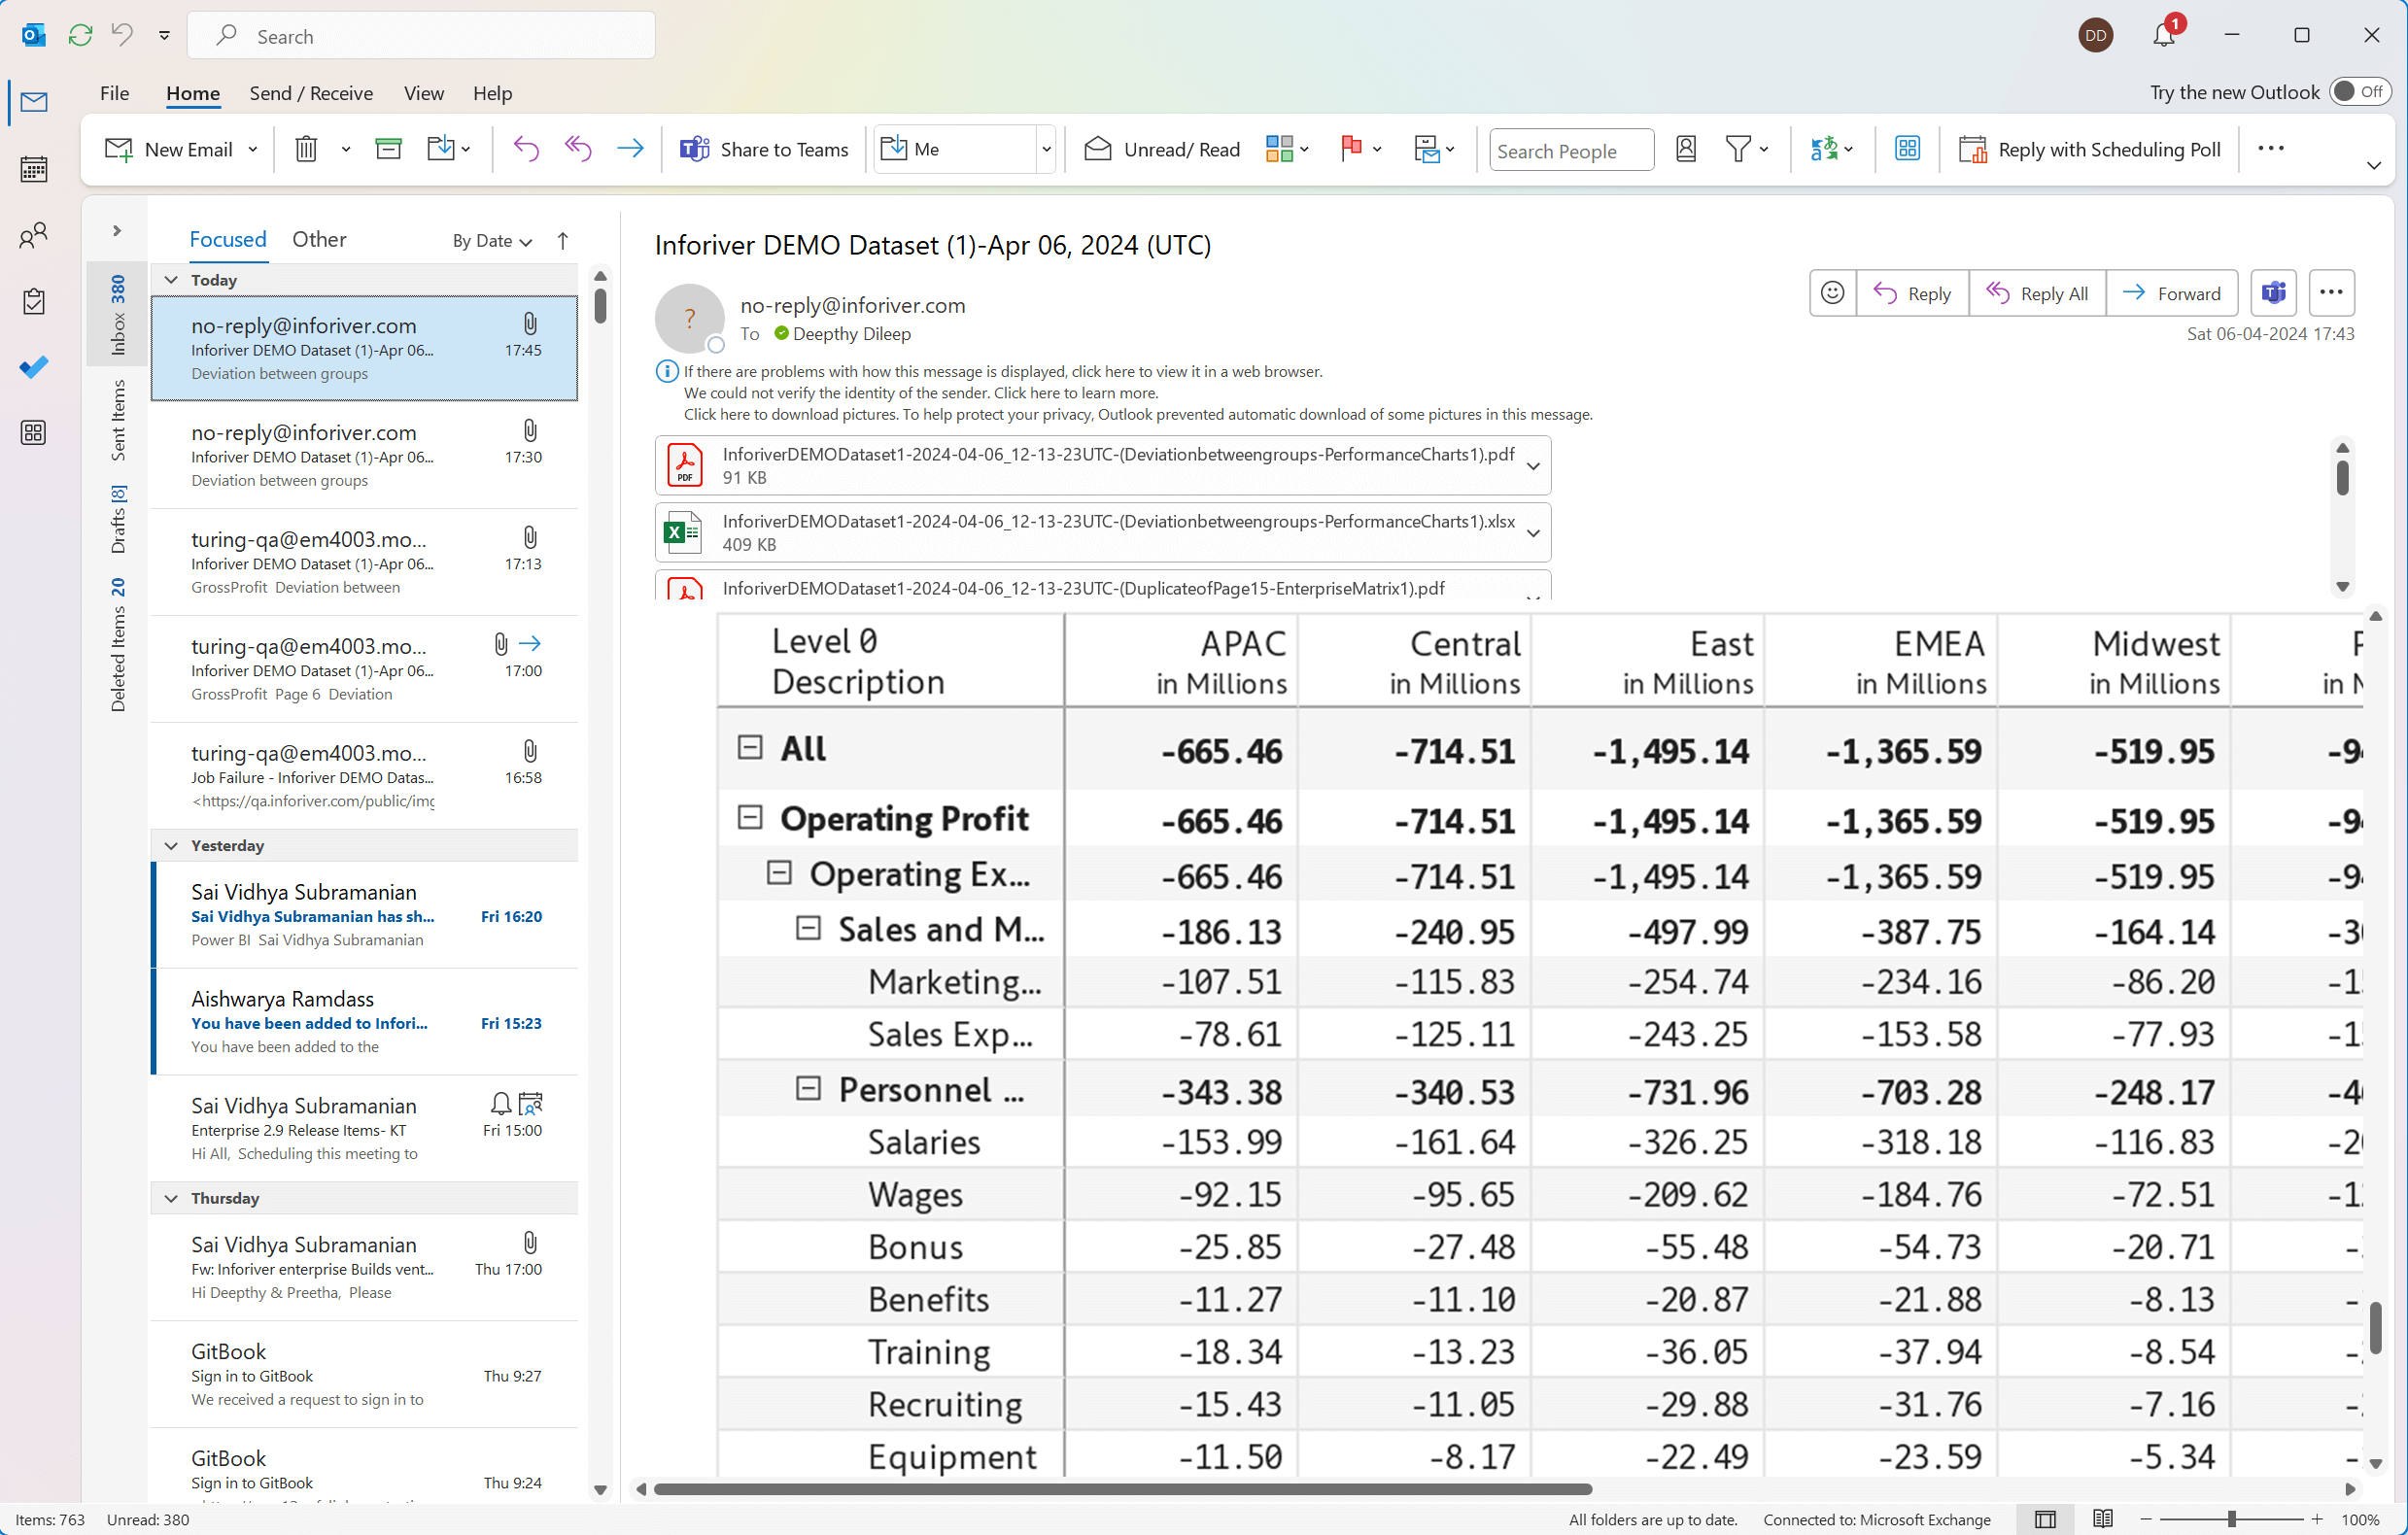
Email-based subscriptions display a preview of the attached report in the email body. Report previews in previous versions were large images rendered irrespective of the number of rows in the report. In the latest release, the preview image has been scaled based on the number of rows, enabling users to view the entire preview without excessive scrolling.
Report preview in the current release:
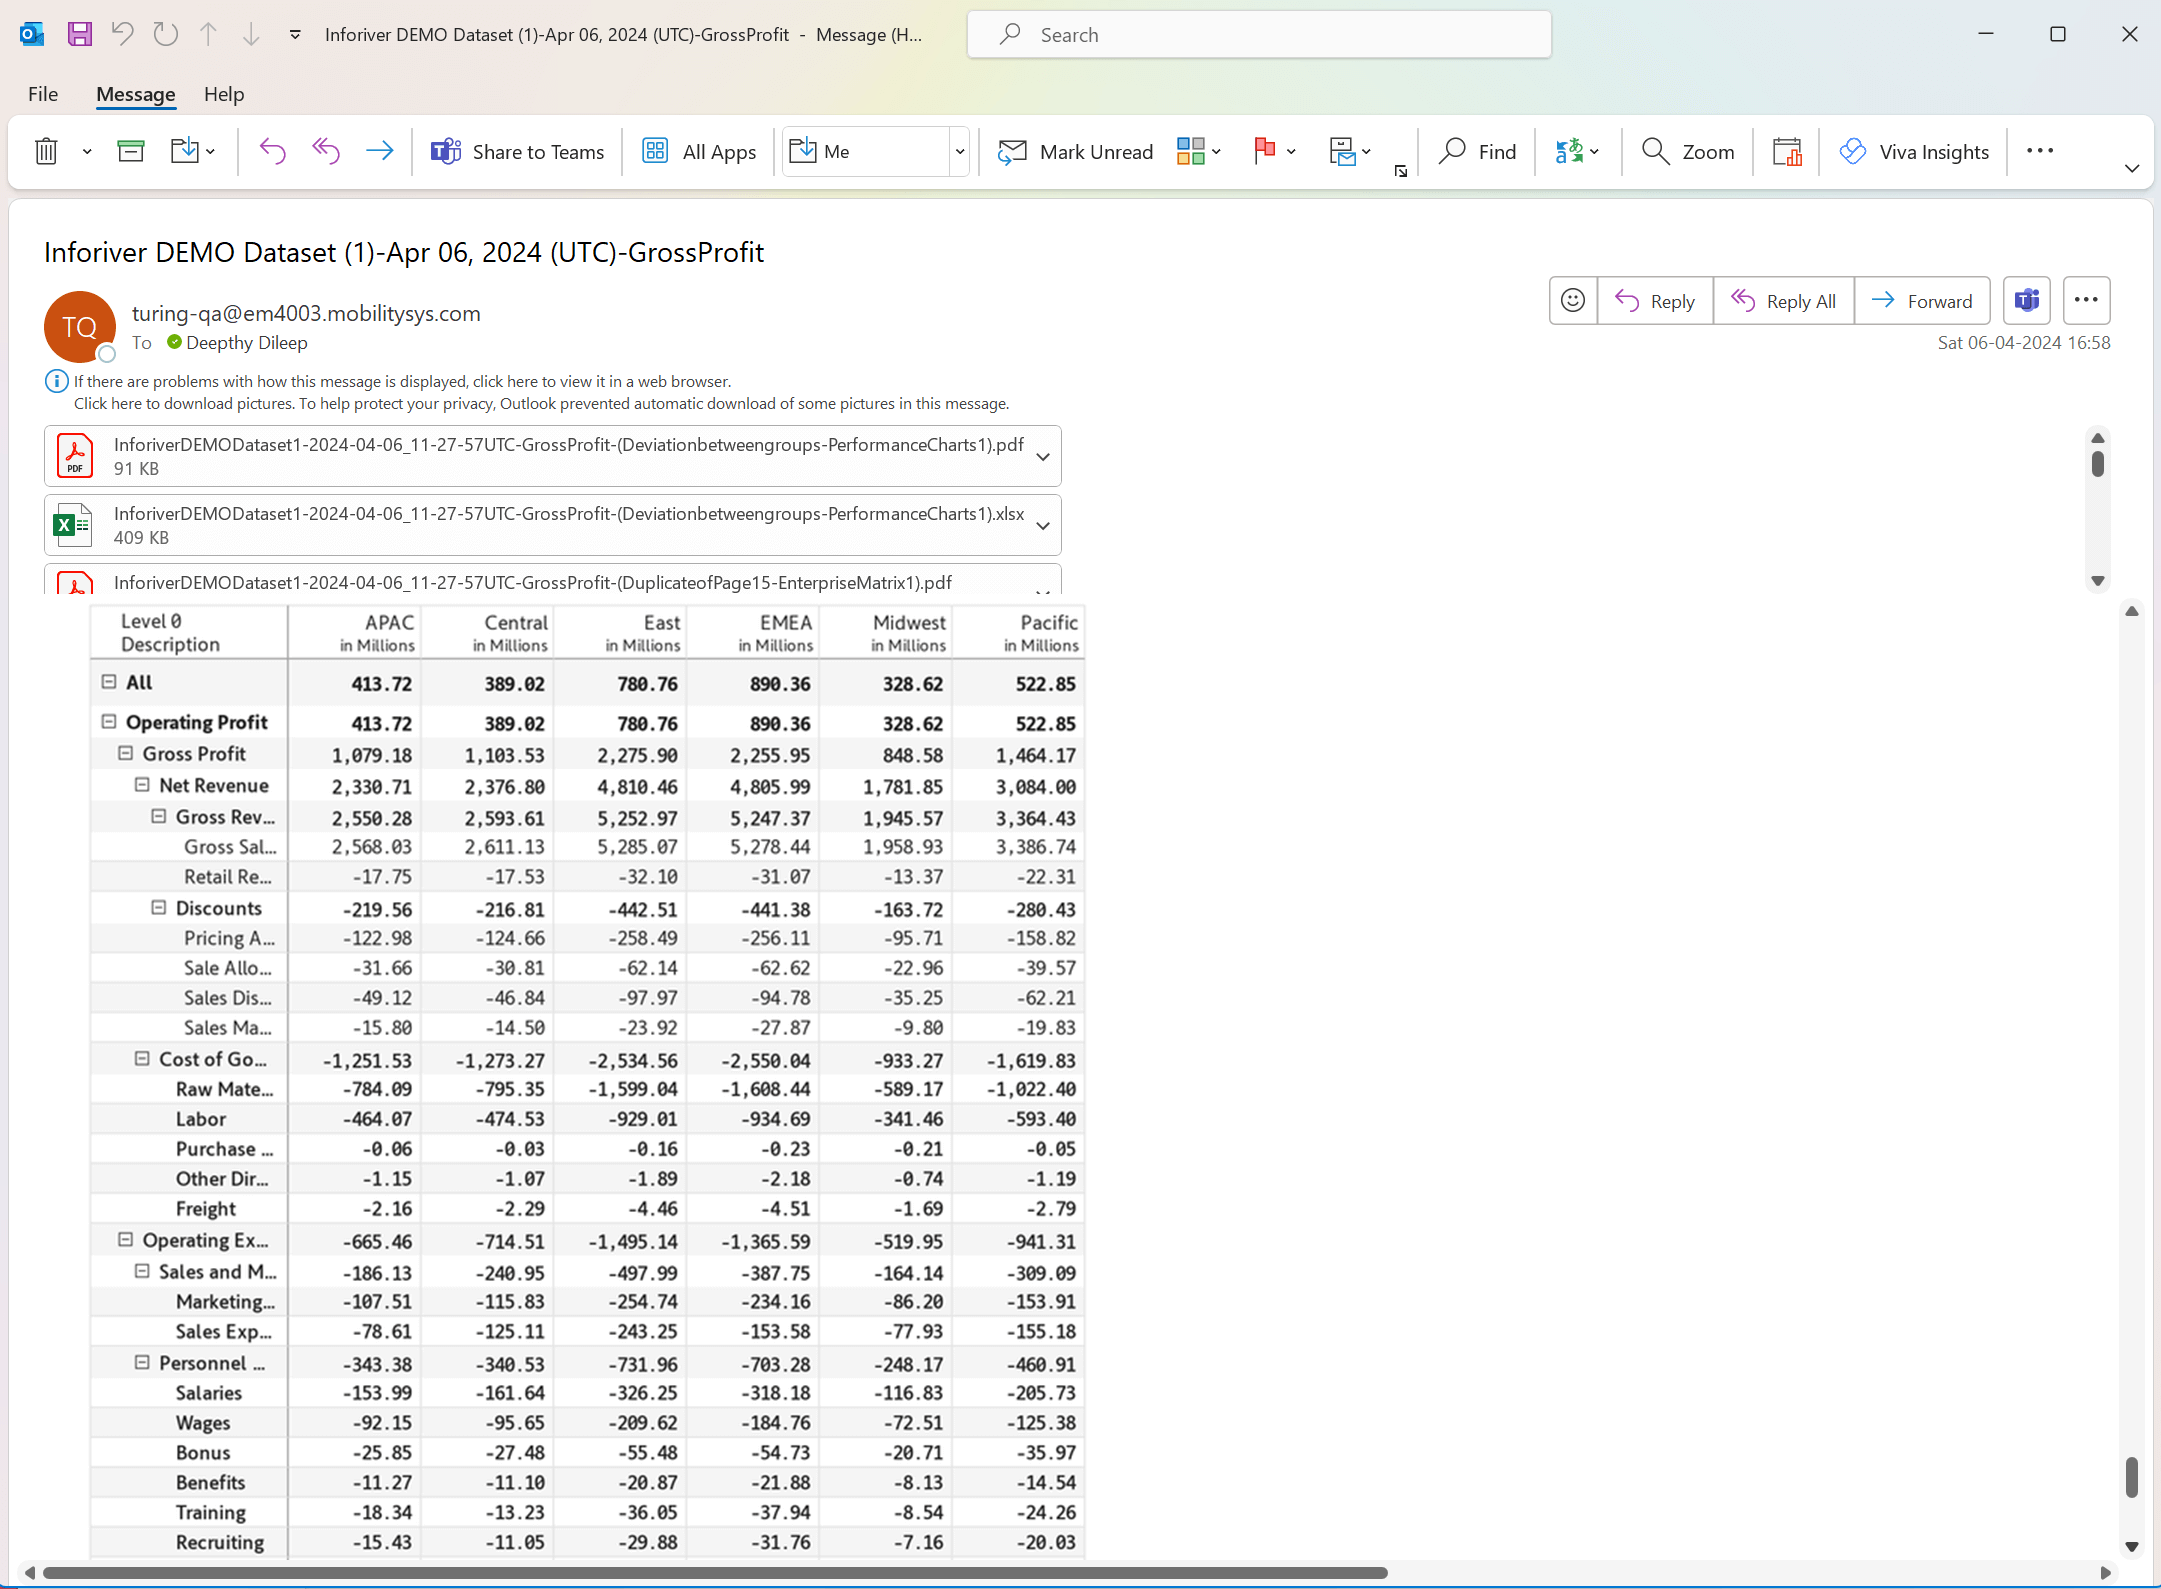
Report preview in older versions:
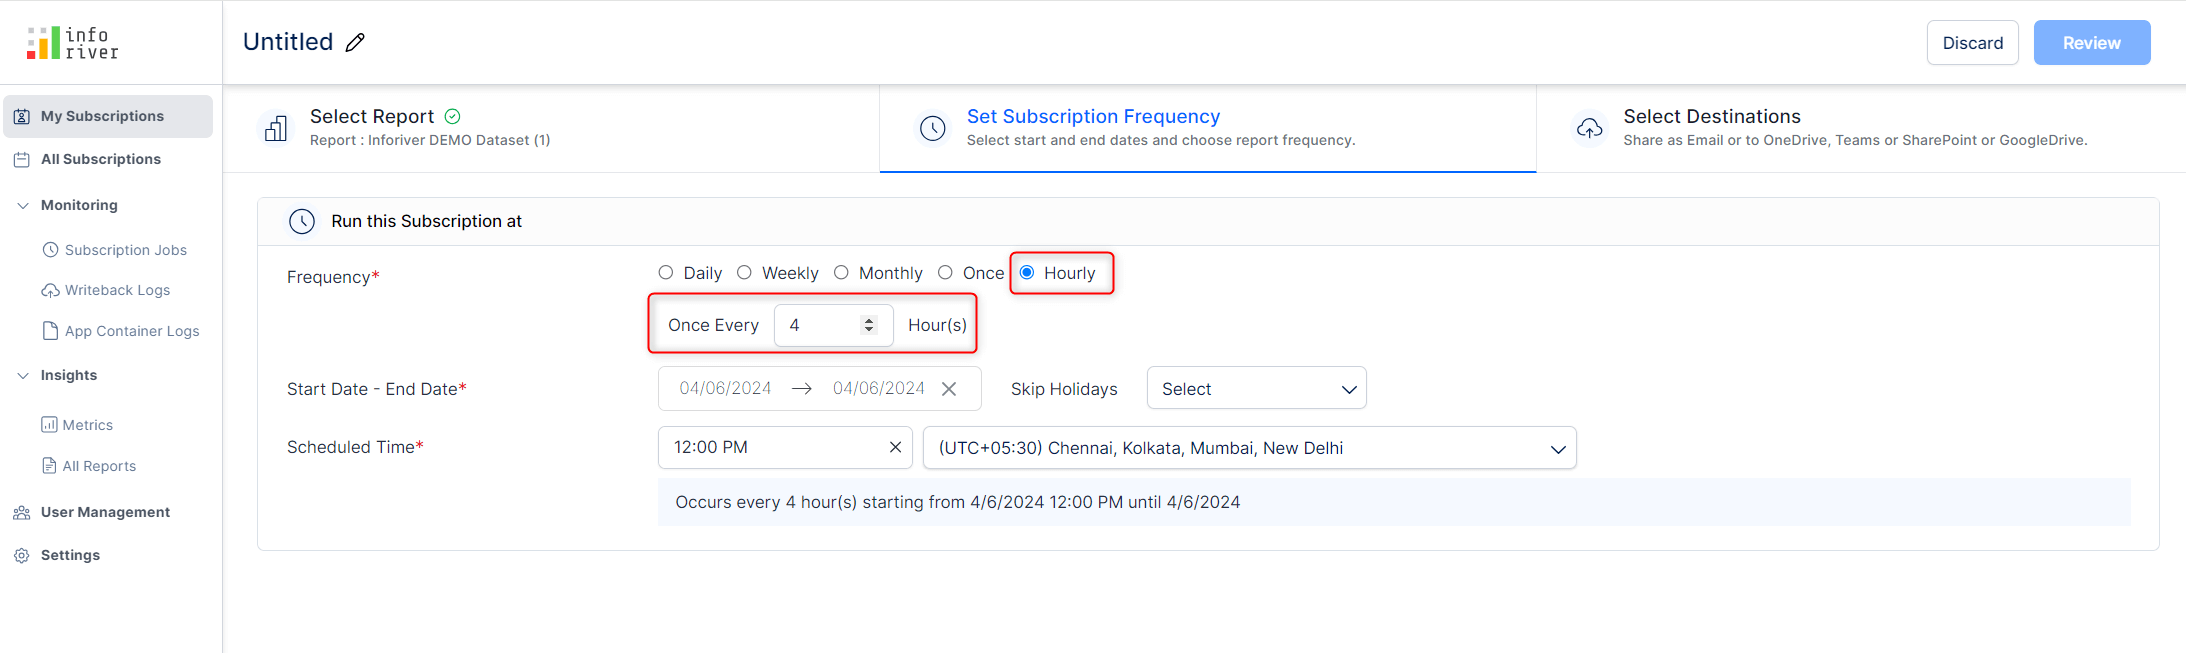
On-prem users can get reports delivered multiple times daily, enabling them to get near-real-time data updates. With the ‘Hourly’ frequency, users can schedule report subscriptions by the hour – the interval between subscription runs can be set in the textbox.
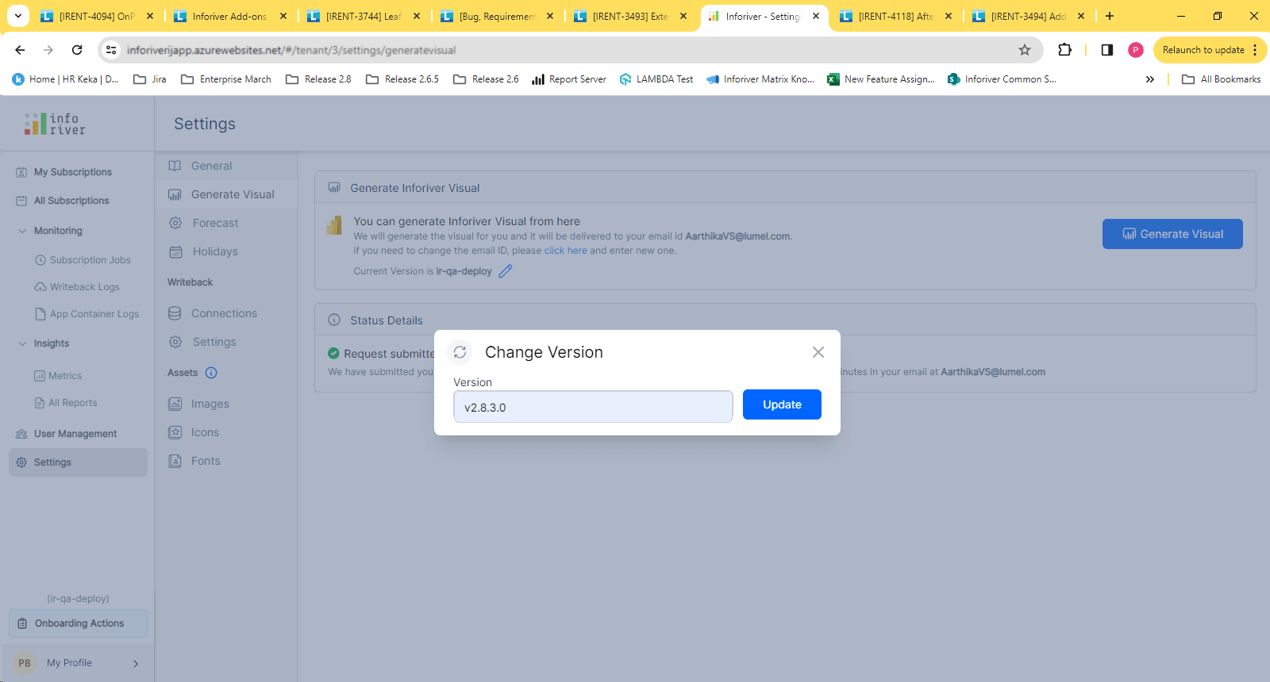
On-prem users can generate builds on demand. For instance, to work on an older version of Inforiver, they can input the build version and generate the visual instantly. Users need to be mindful of keying in the complete version number (with all the zeroes). Inforiver will throw an error if the exact version number is not provided.
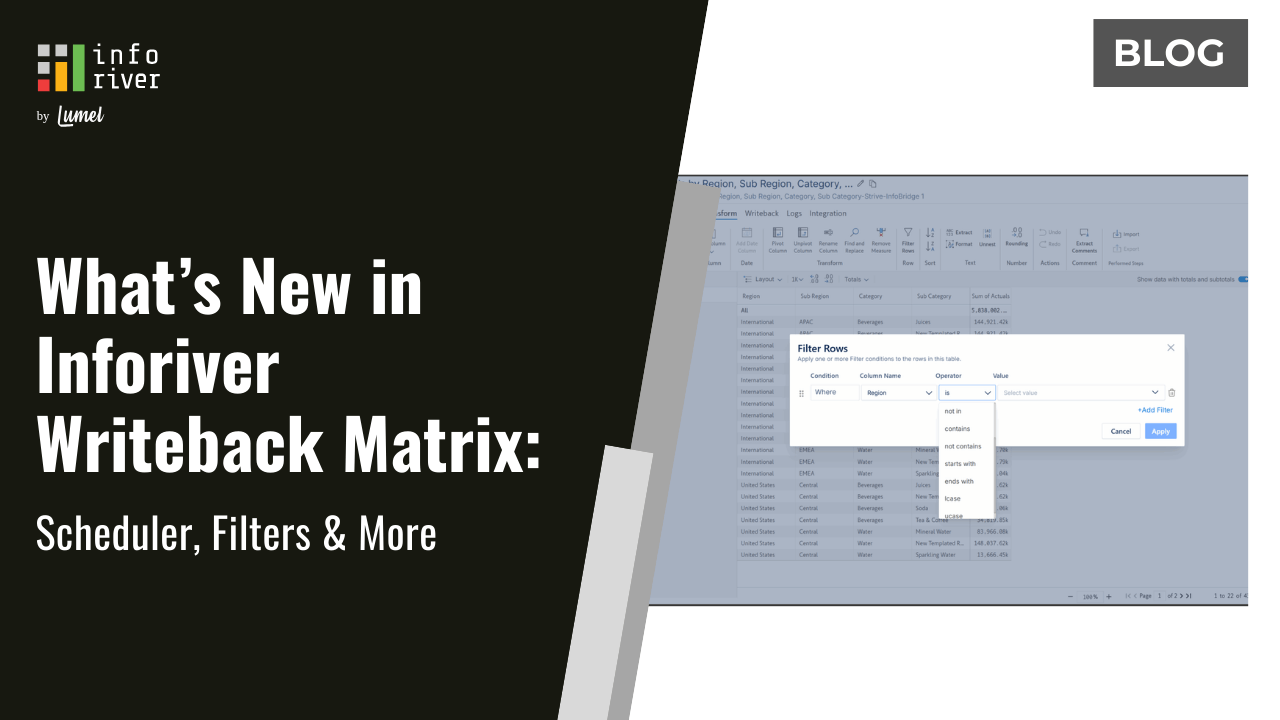
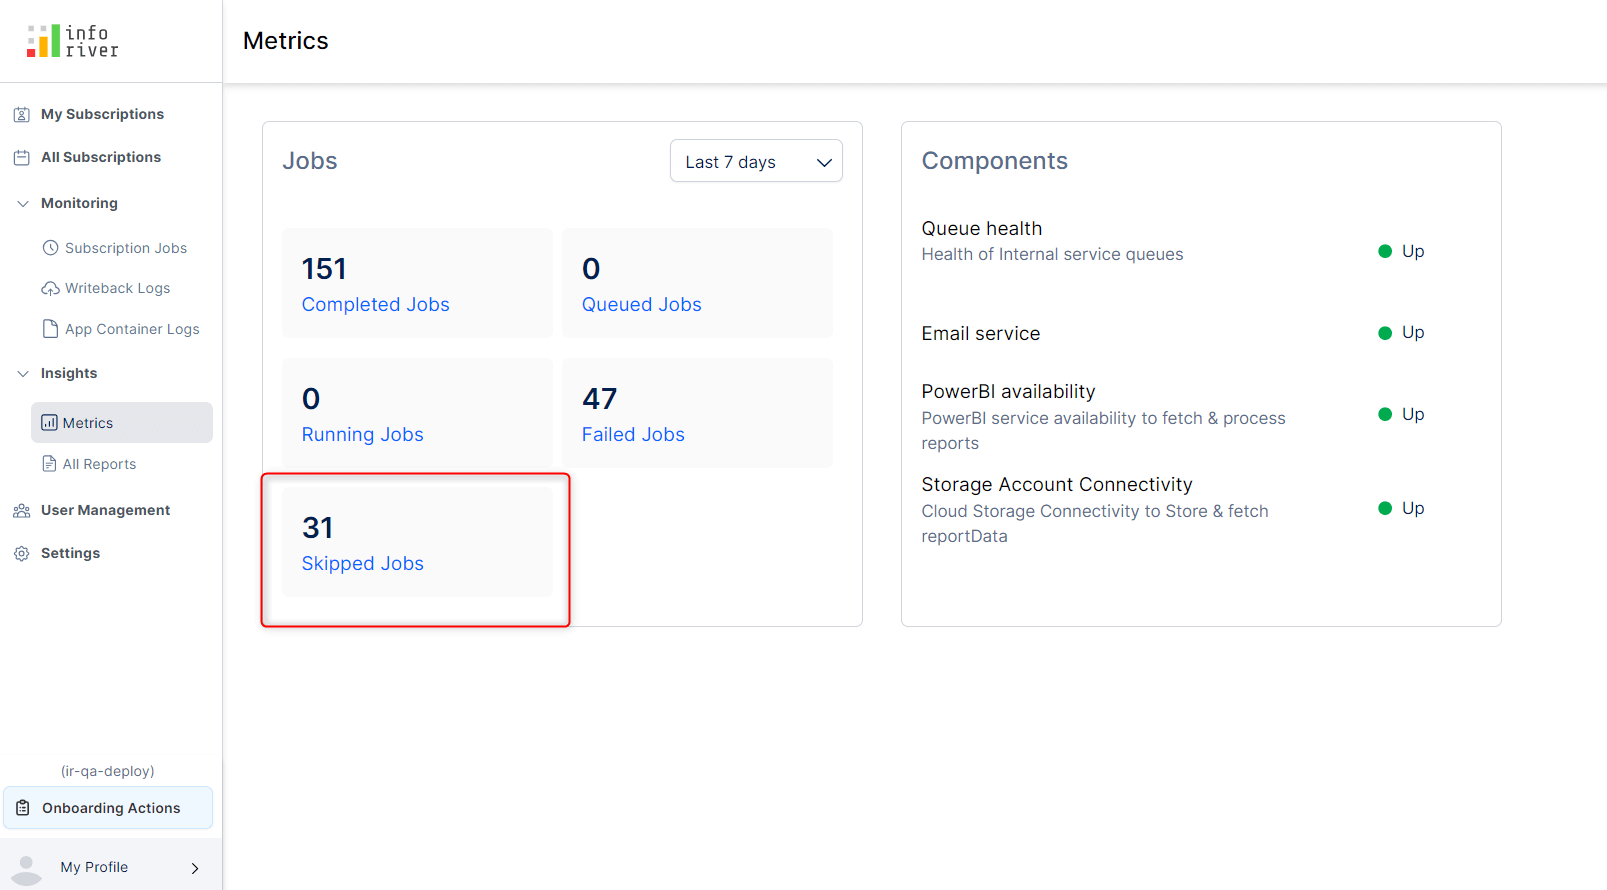
The Inforiver scheduler allows you to skip subscription jobs based on a specific holiday calendar. The metrics section displays the statistics for skipped jobs as well, enabling you to monitor subscription runs for holidays as well. Earlier versions did not capture metrics for skipped jobs. Learn more about configuring custom holiday calendars and skipping subscription runs on holidays.
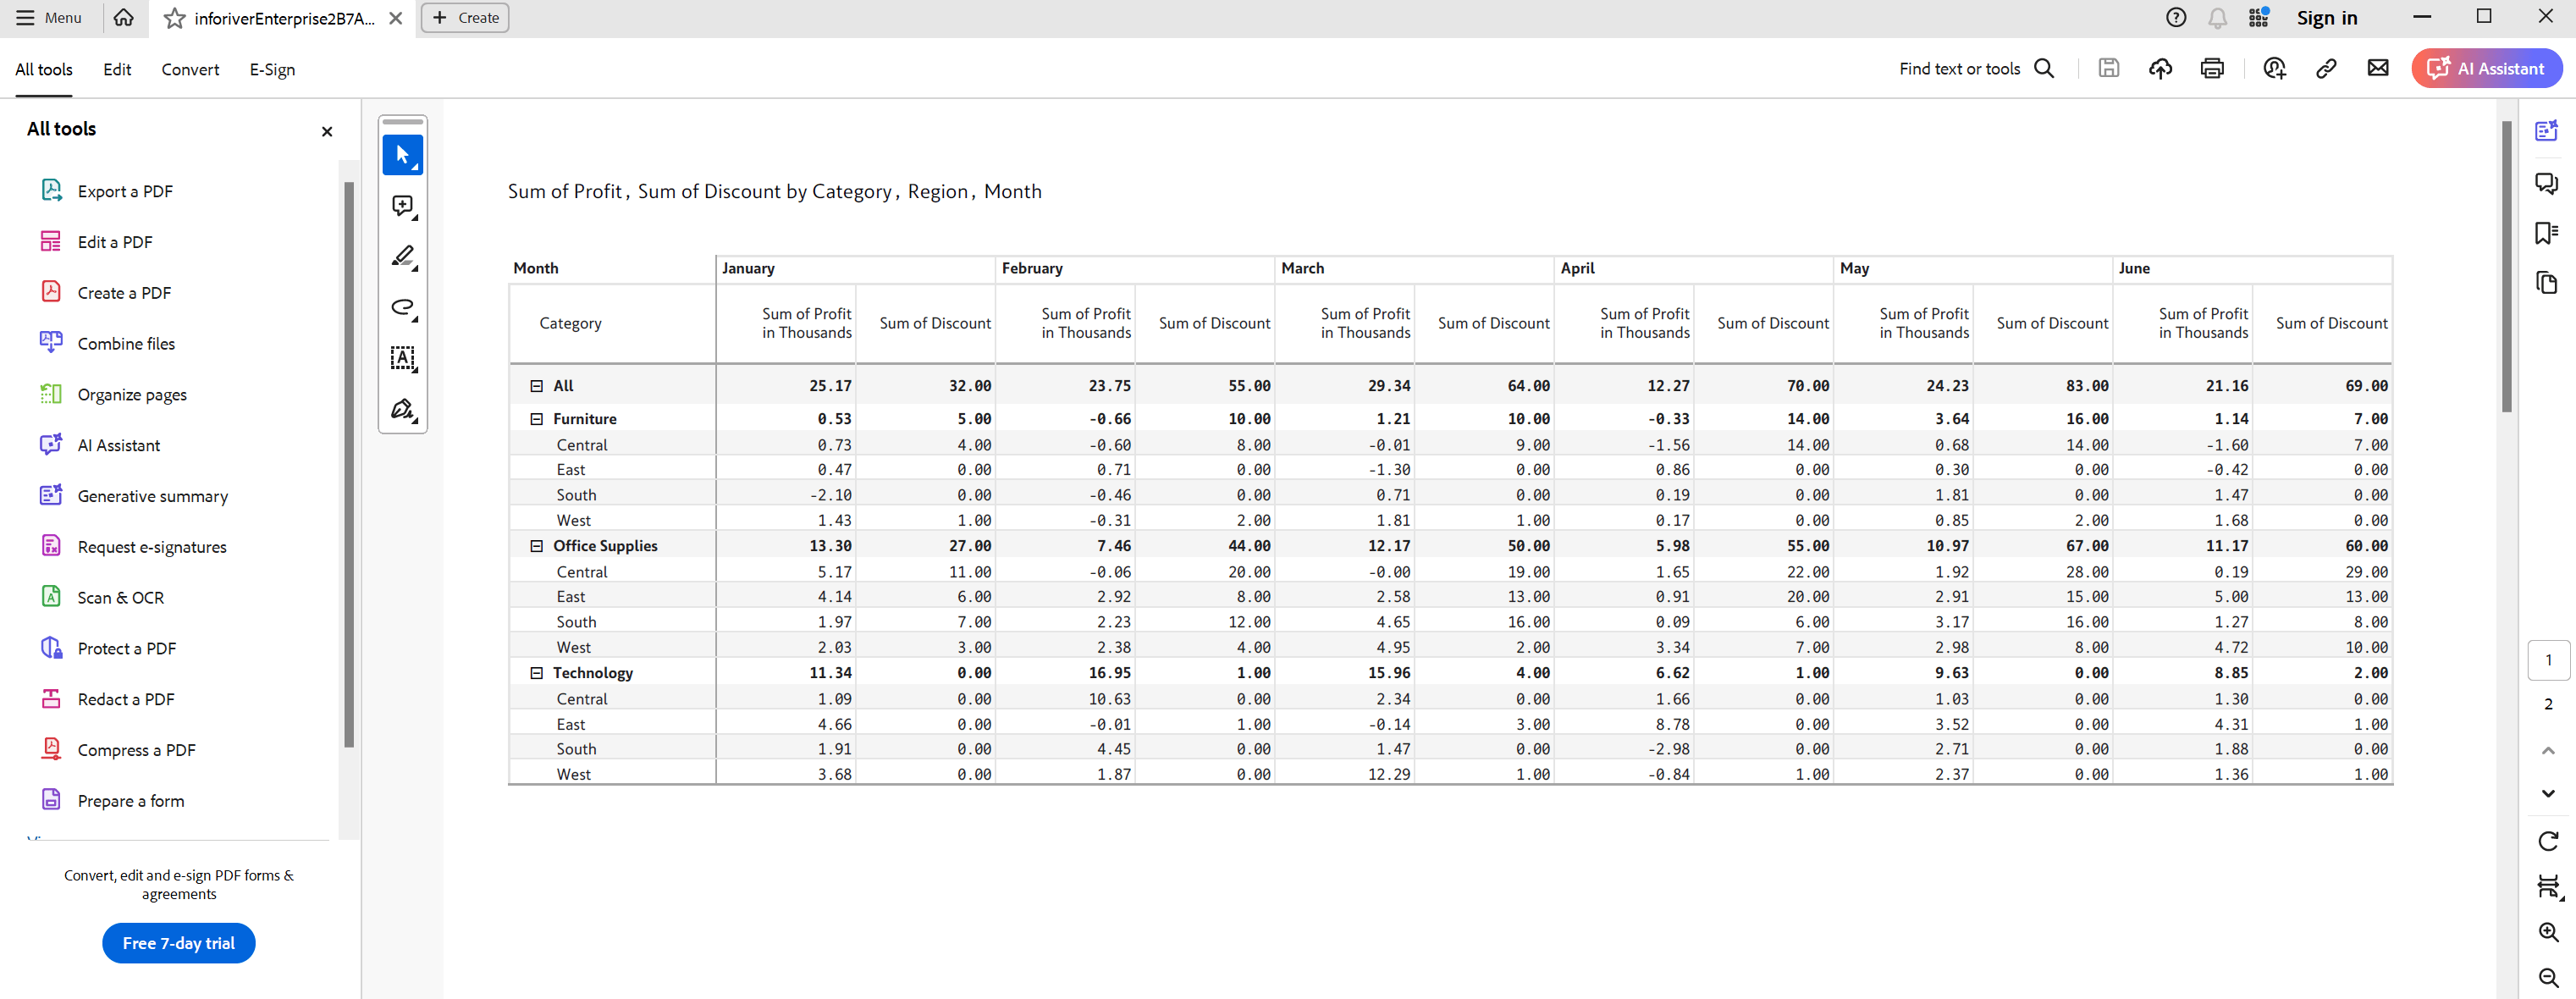
In addition to the A1-5 and Legal page sizes, you can now set a wider tabloid page size of 11” x 17” for report exports.
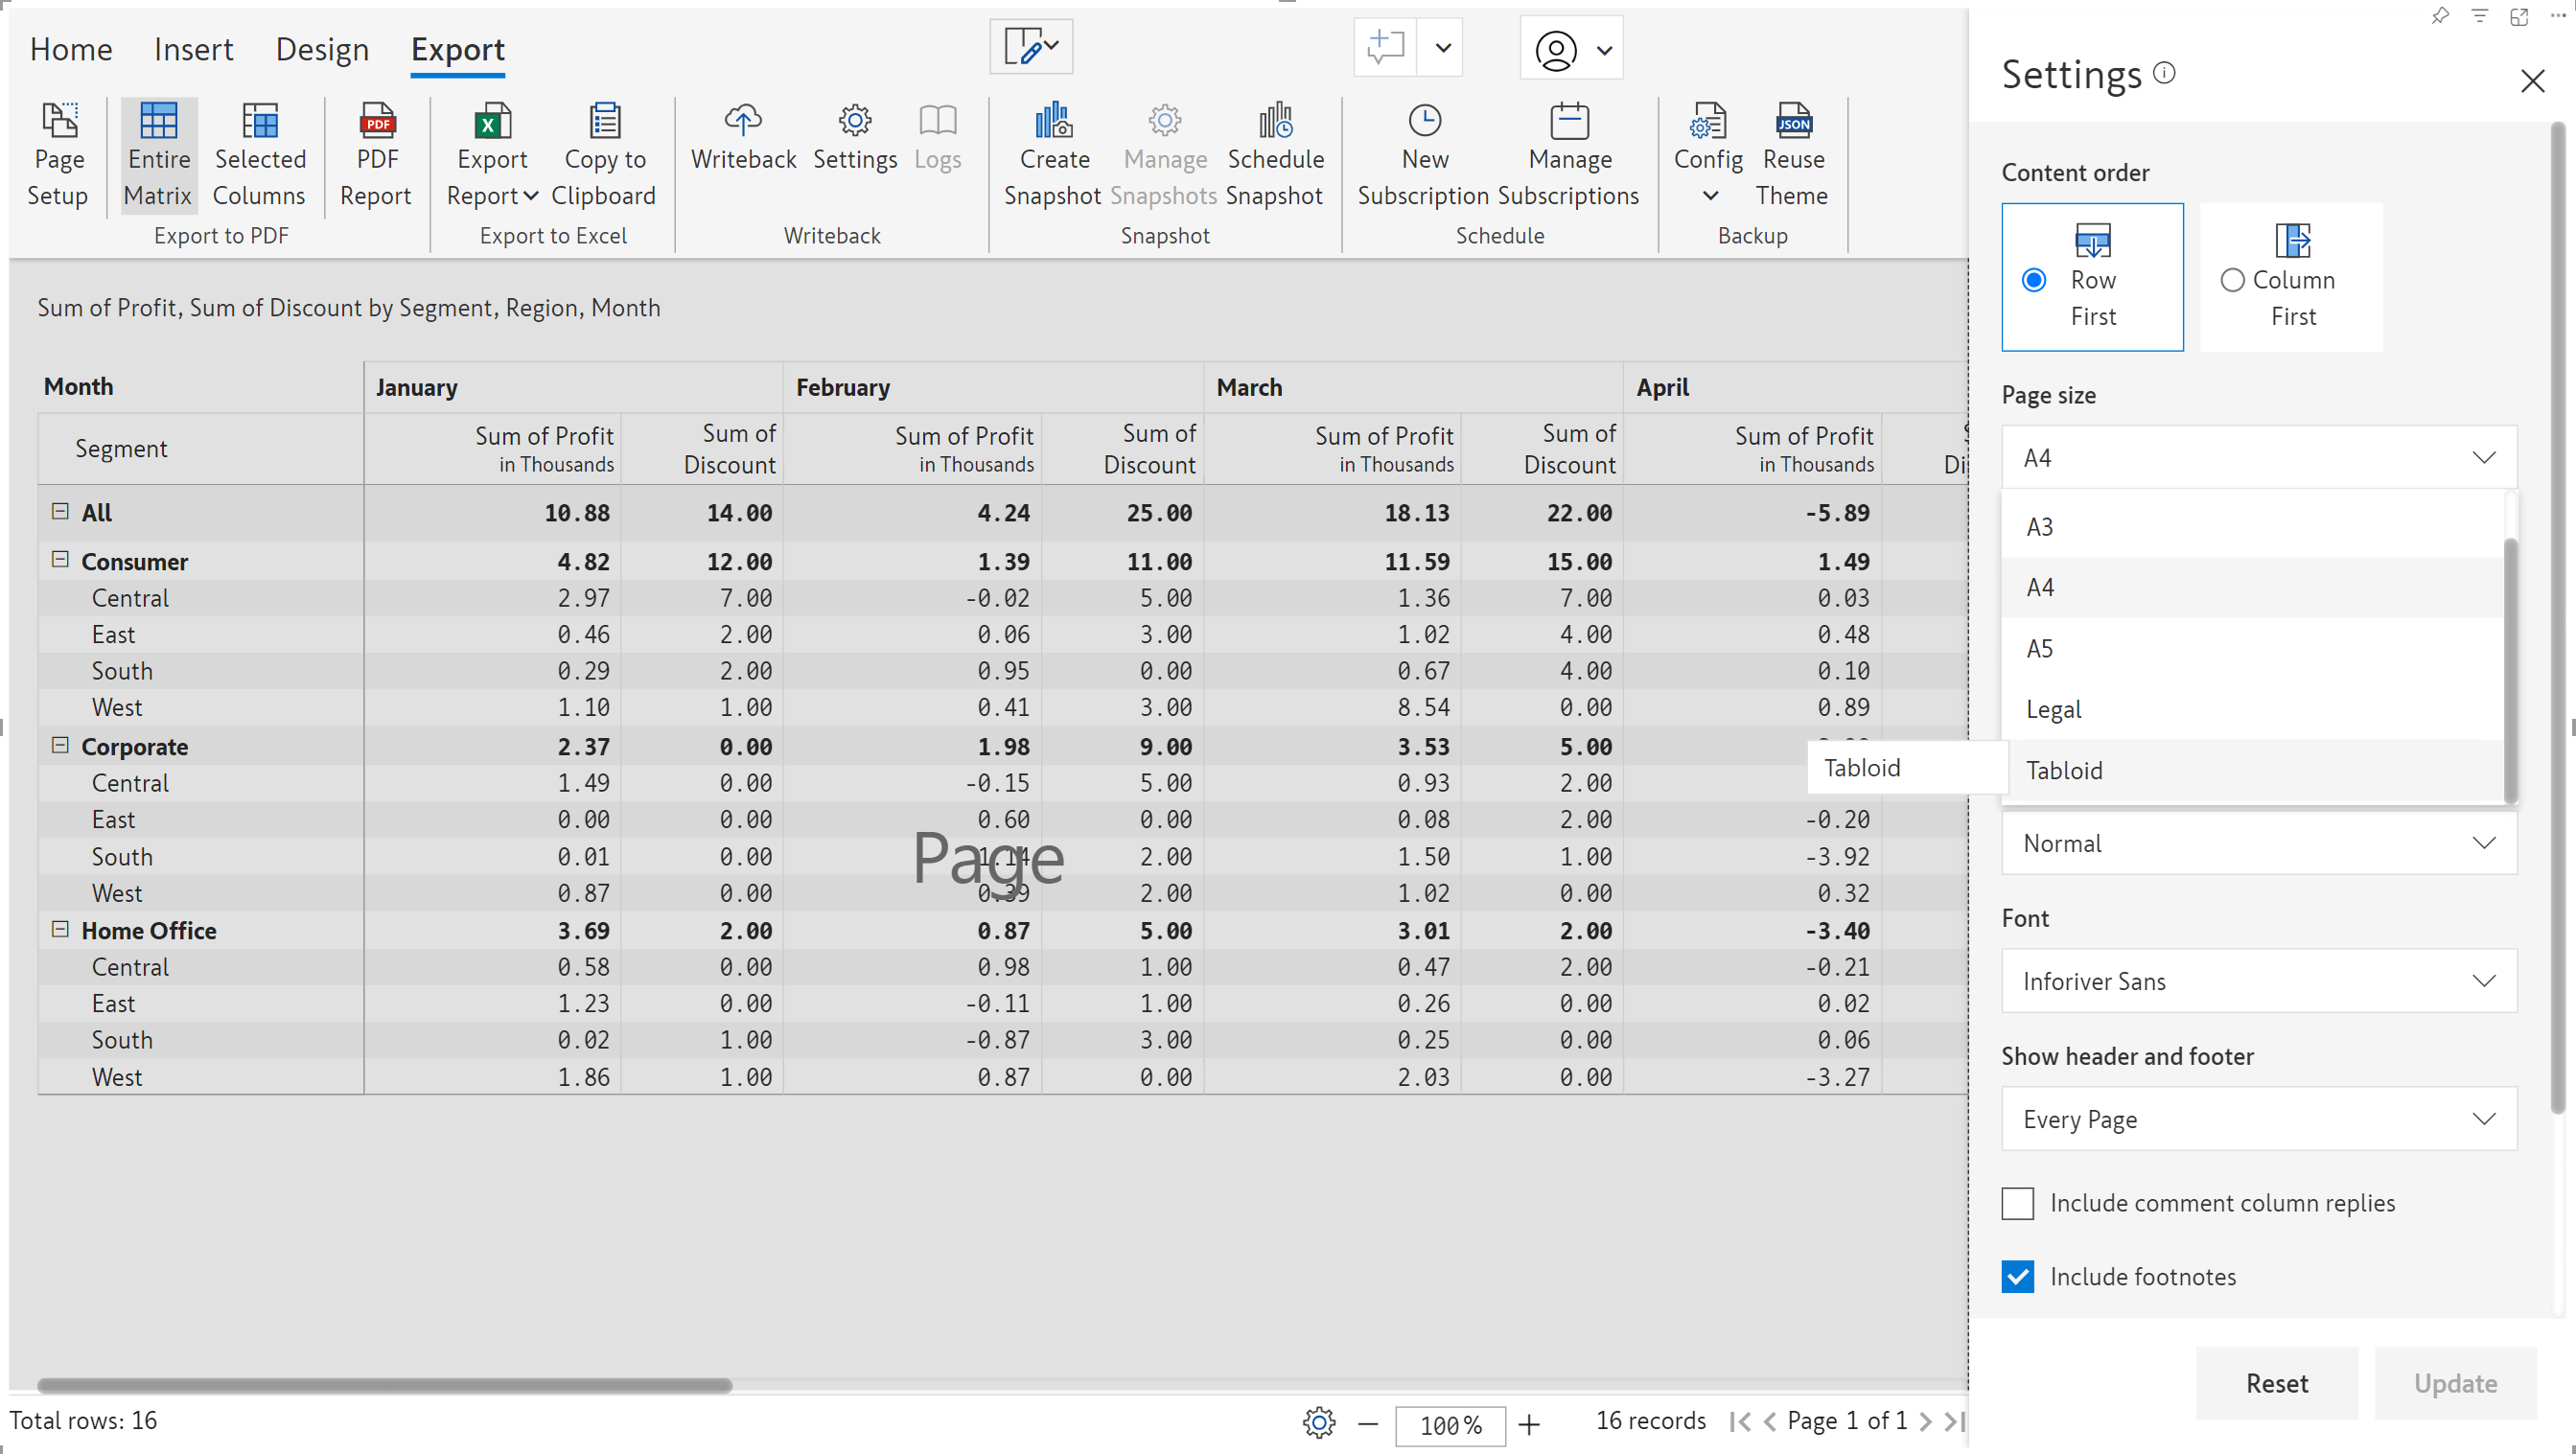
Sample tabloid export:
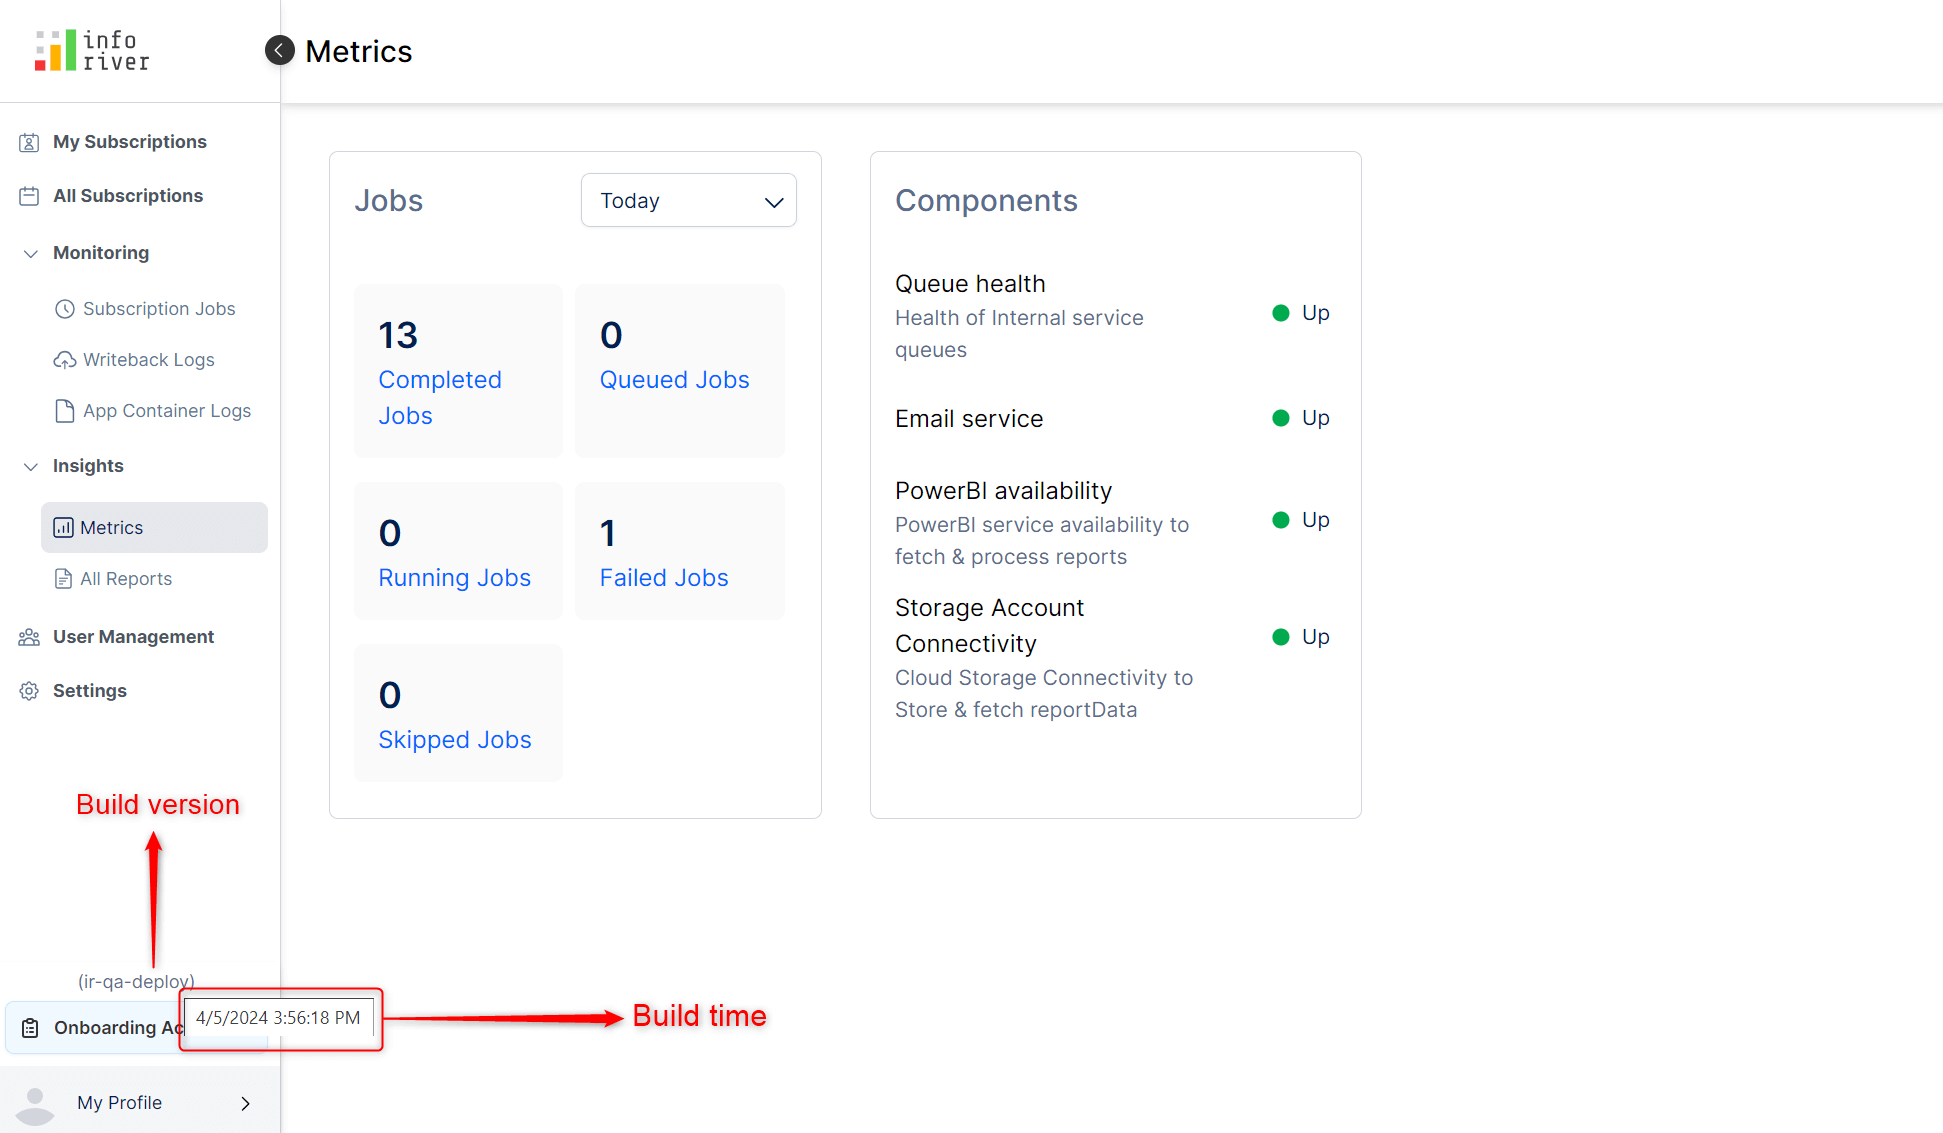
You can view the build time right from the admin console. Hover over the build version to see the build date and time.
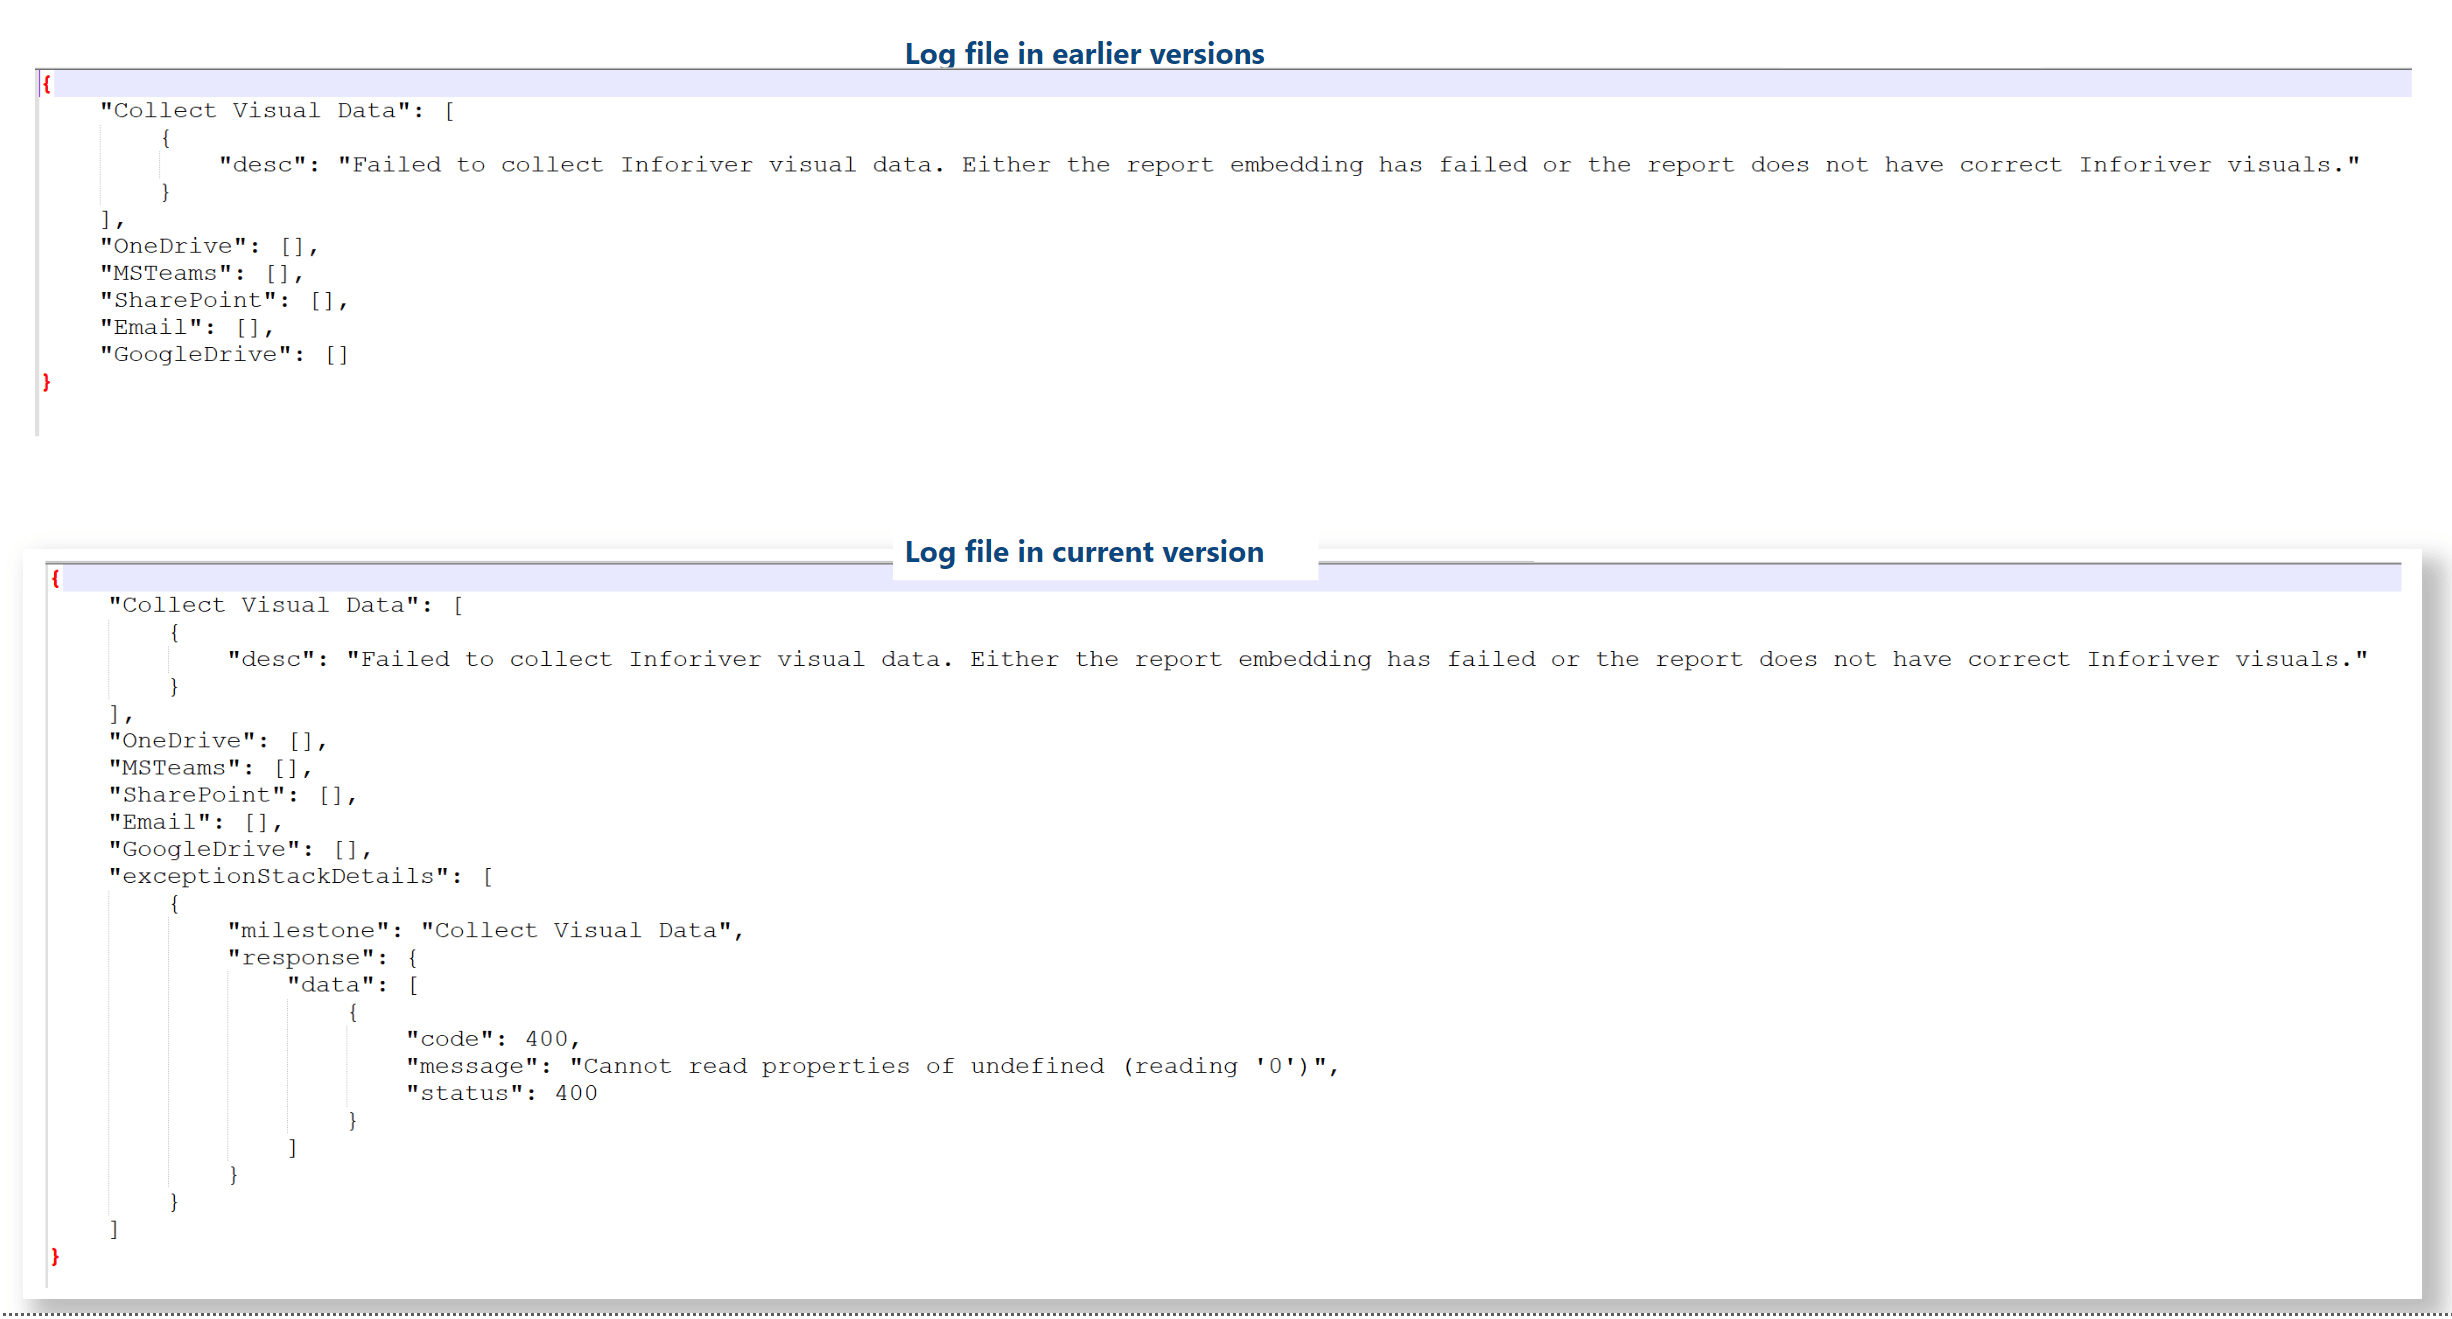
The subscription job logs now capture the exact failure reason, which makes debugging faster and more straightforward. The exceptionStackDetails section in the log files will be available from the latest release.
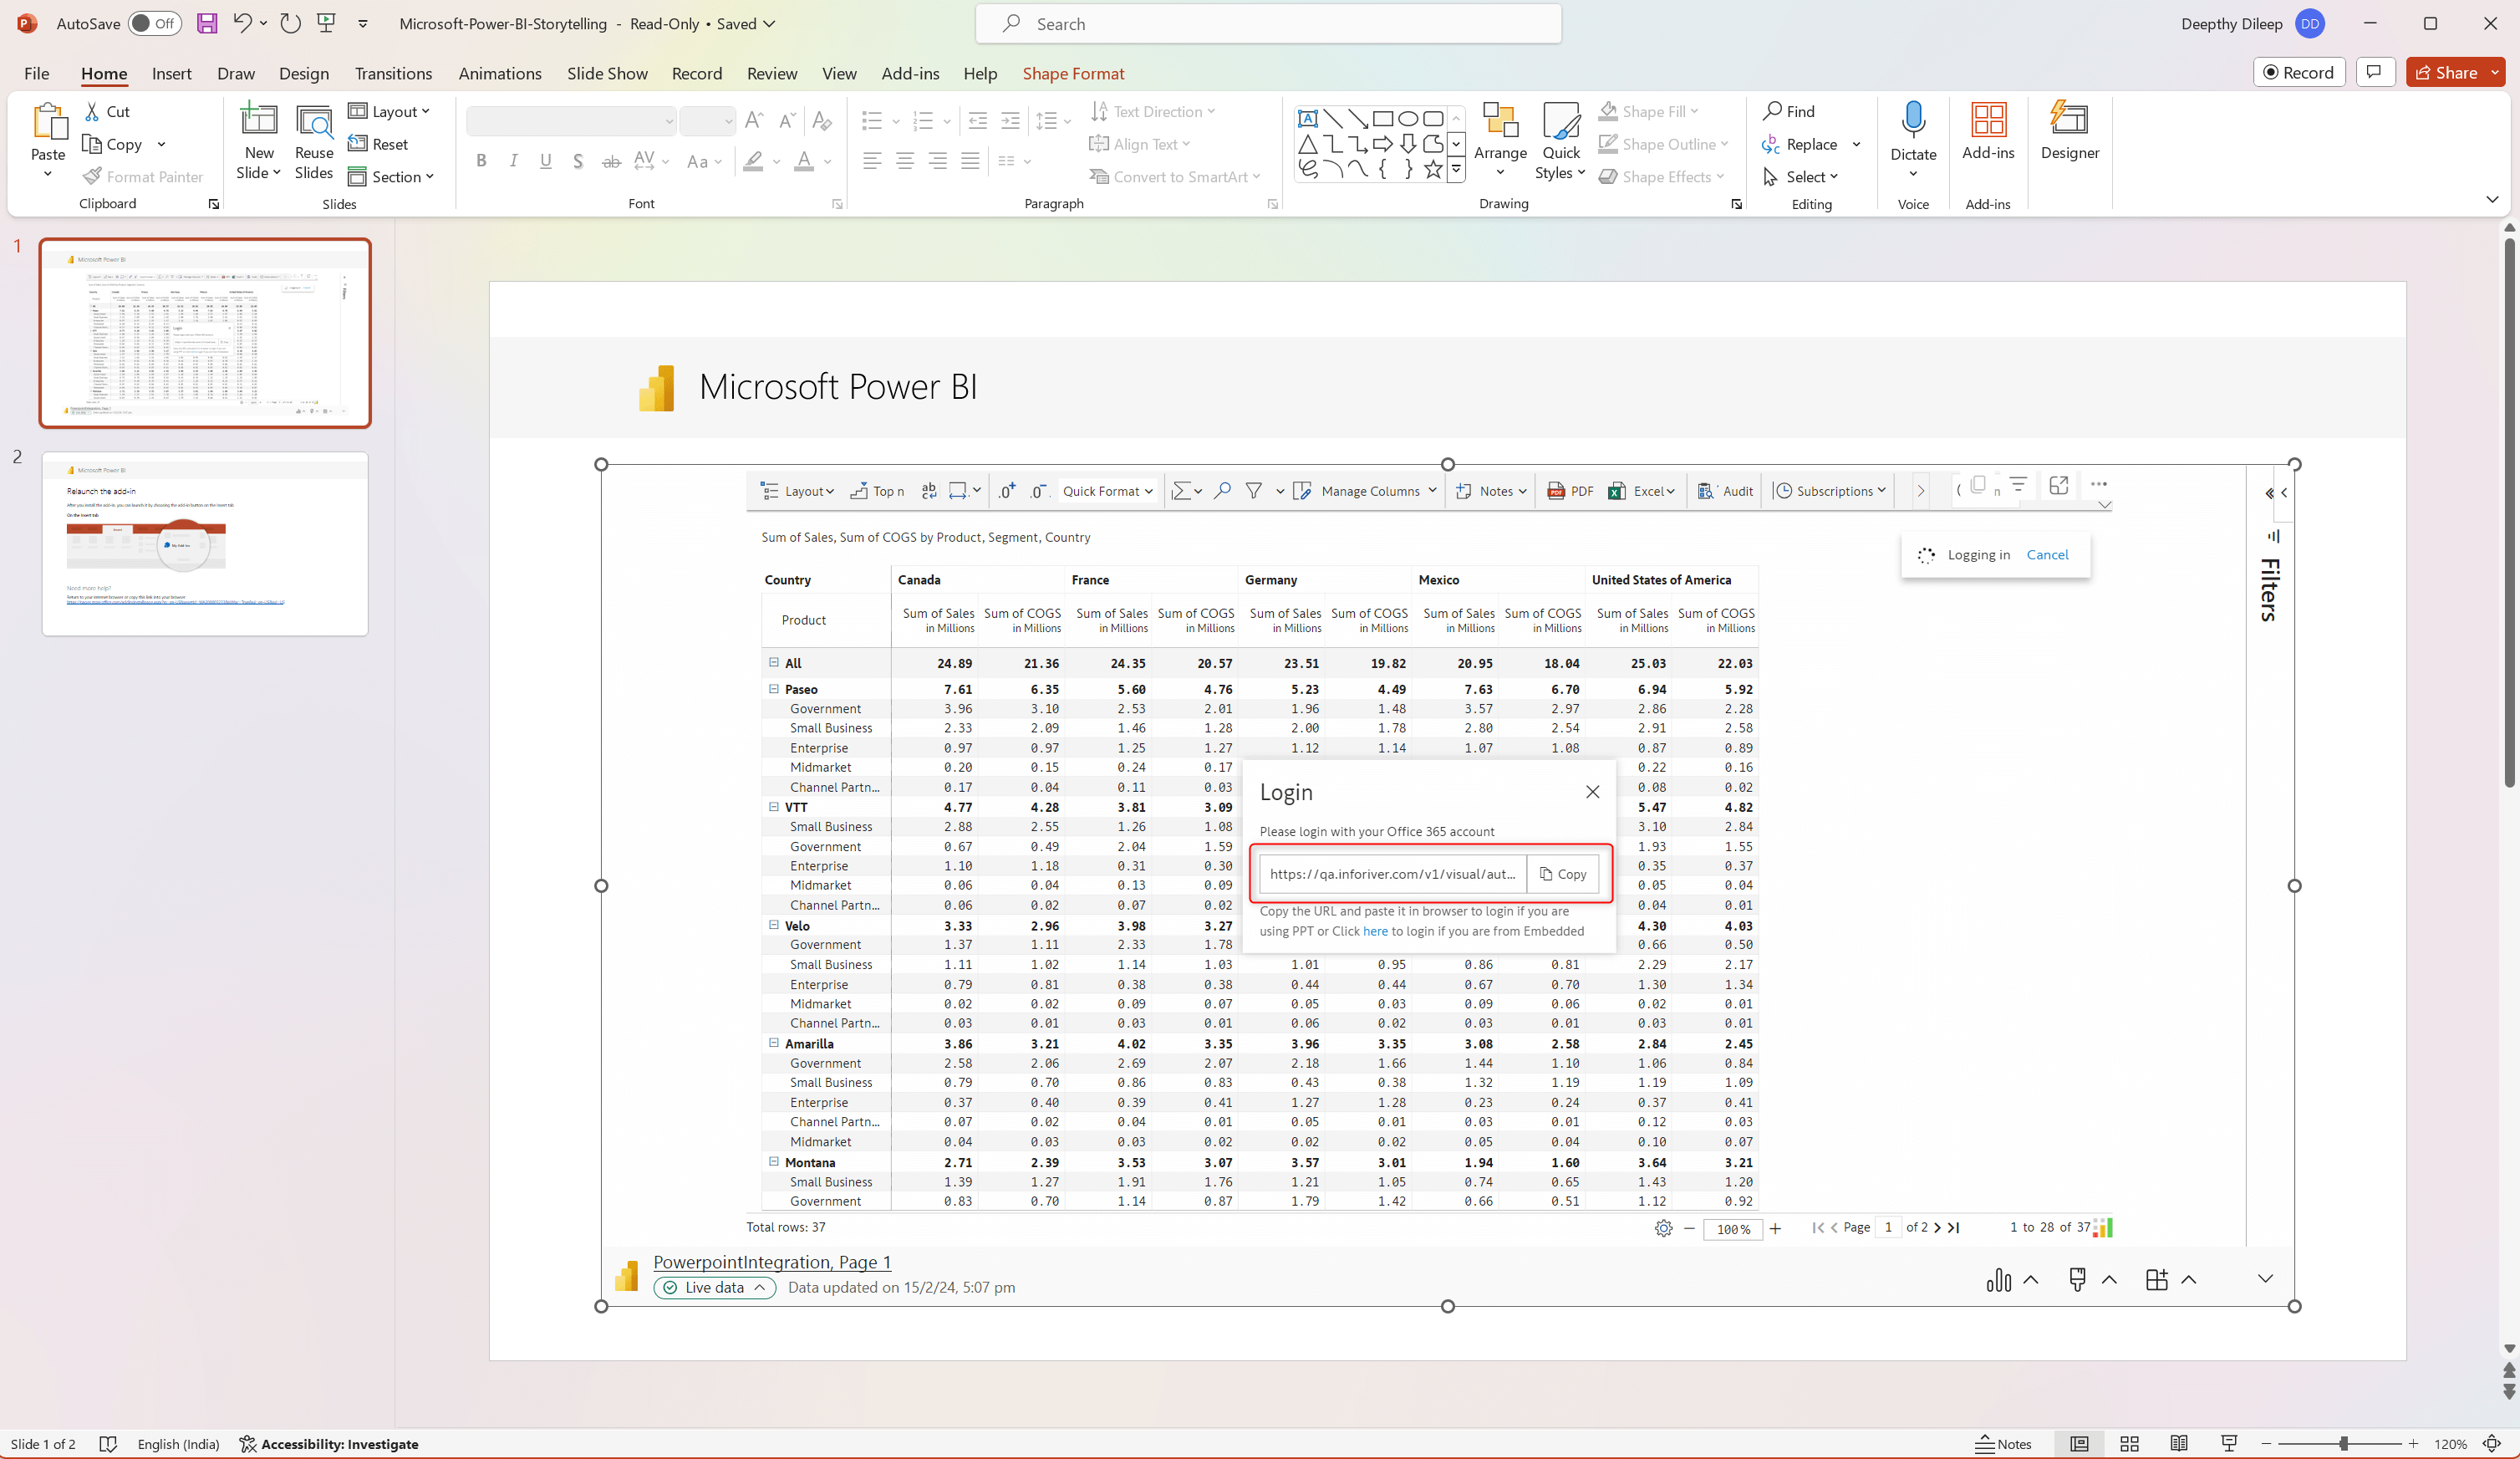
You can integrate Power BI reports into PowerPoint presentations. Live data from the Inforiver visual can also be embedded in your PPTs. An additional step is required to use Inforiver from within PowerPoint. You need to click the Sign in button > copy the link from the pop-up window and sign in from a new browser tab.
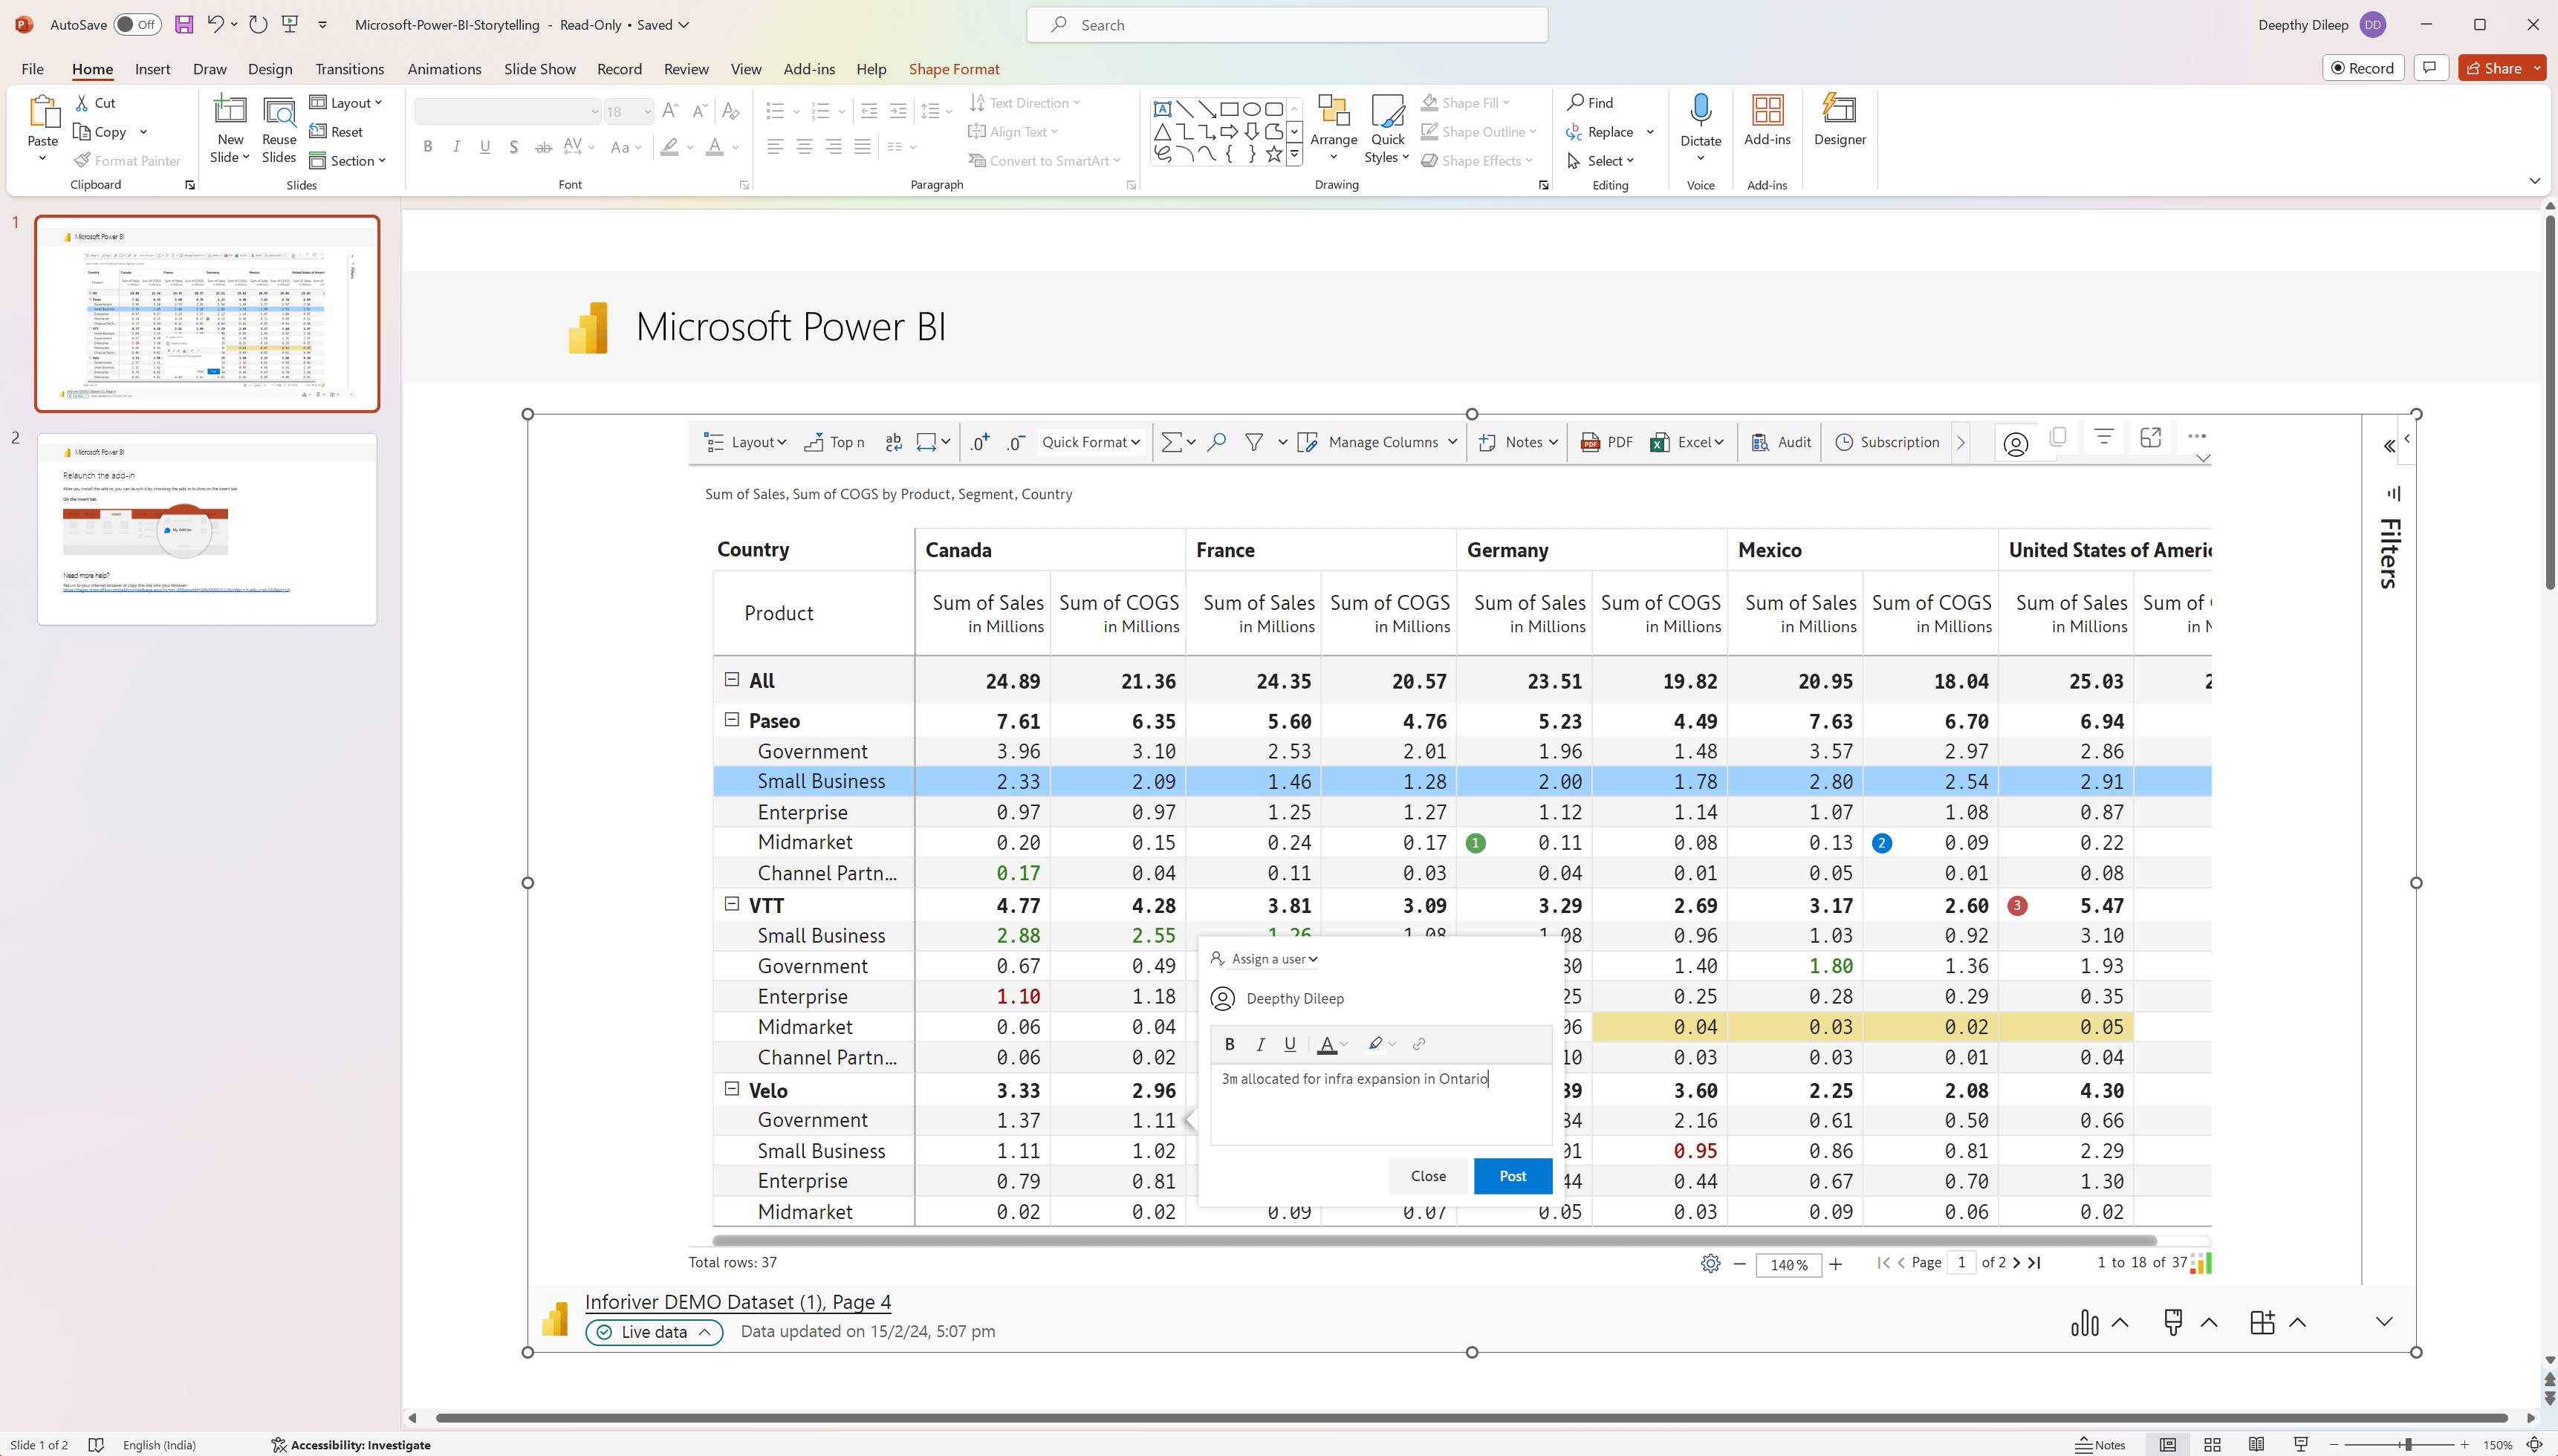
You can apply formatting and add notes/comments from within PowerPoint. However, changes made from PowerPoint will not be saved.
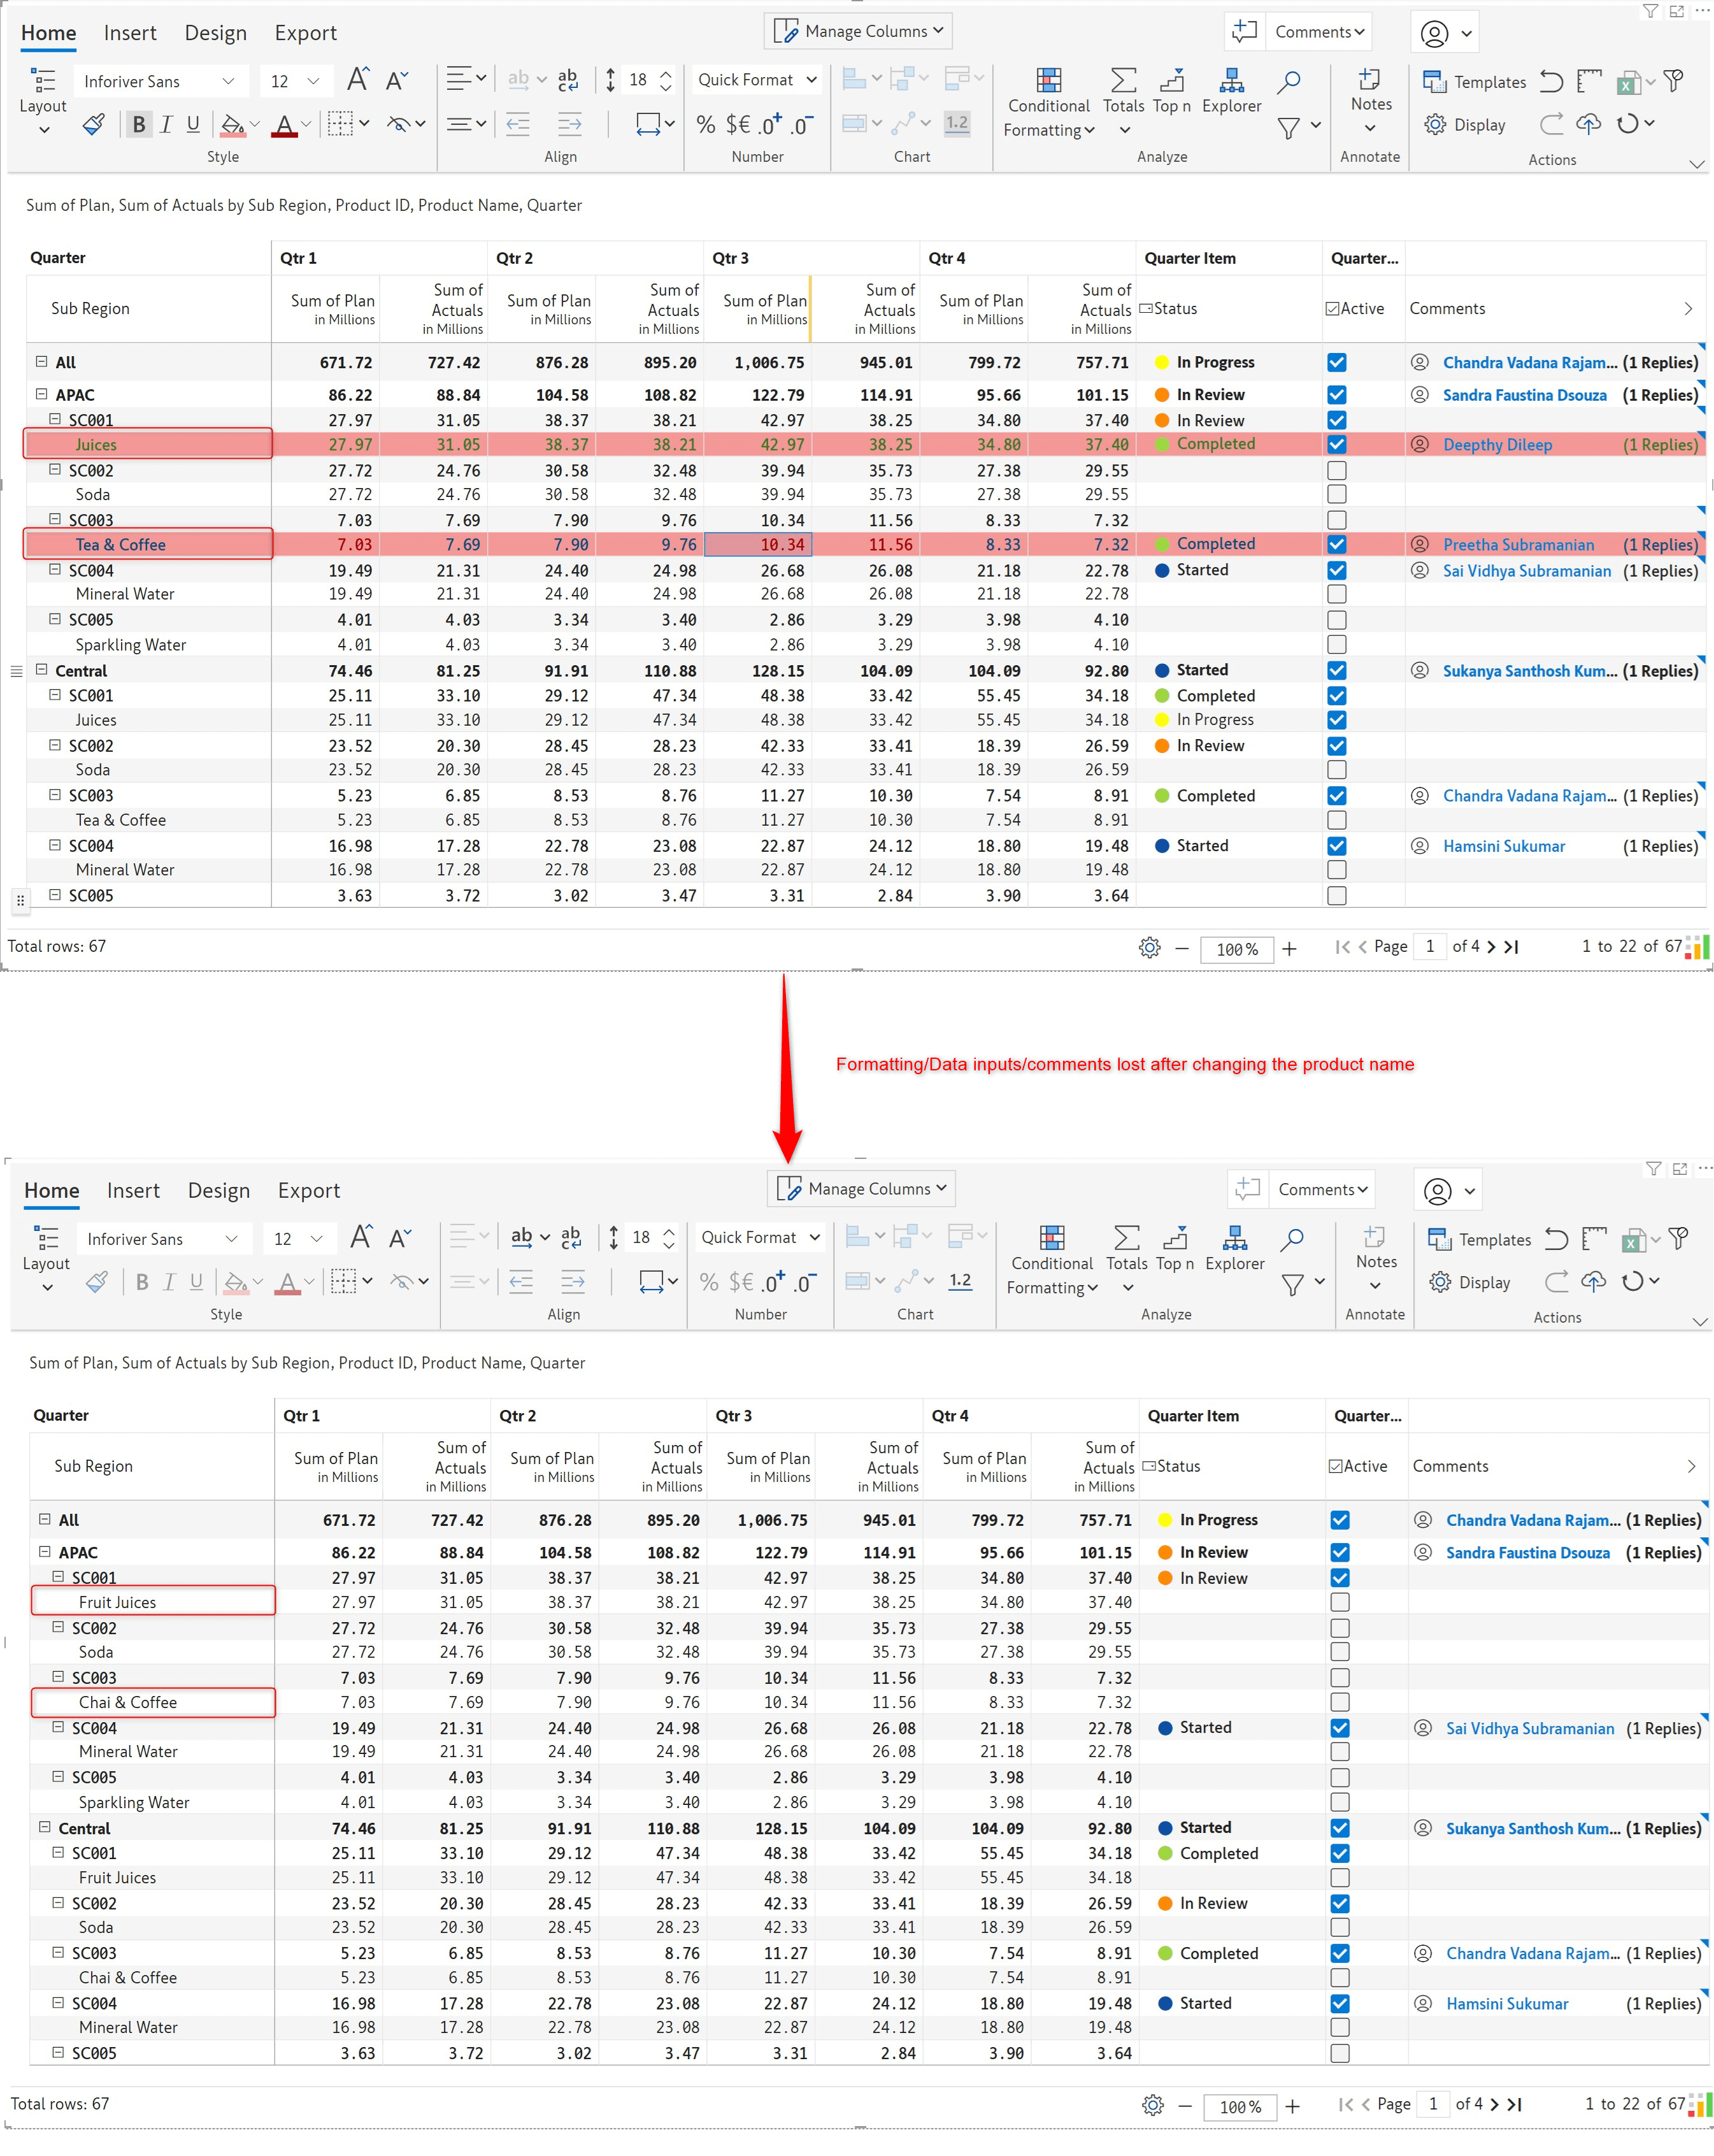
The latest release allows you to choose the dimensions that uniquely identify a row. For instance, consider that you are using the product name to identify a record. Visual elements like formatting, comments, notes, and data inputs will be tied to the Product Name. Product names may get updated in the dataset, which will lead to the loss of all the visual elements that were linked to it, i.e., you will no longer be able to see any formatting, comments, or data inputs. On the other hand, product IDs are likely to remain static and are generally not updated.
In earlier versions, Inforiver mapped the row dimensions internally. In the example below, we’ve applied formatting and comments and added data inputs to the Juices and Tea & Coffee rows. However, after updating the product names to Fruit Juices and Chai & Coffee, we lost all the visual elements linked to the product name.
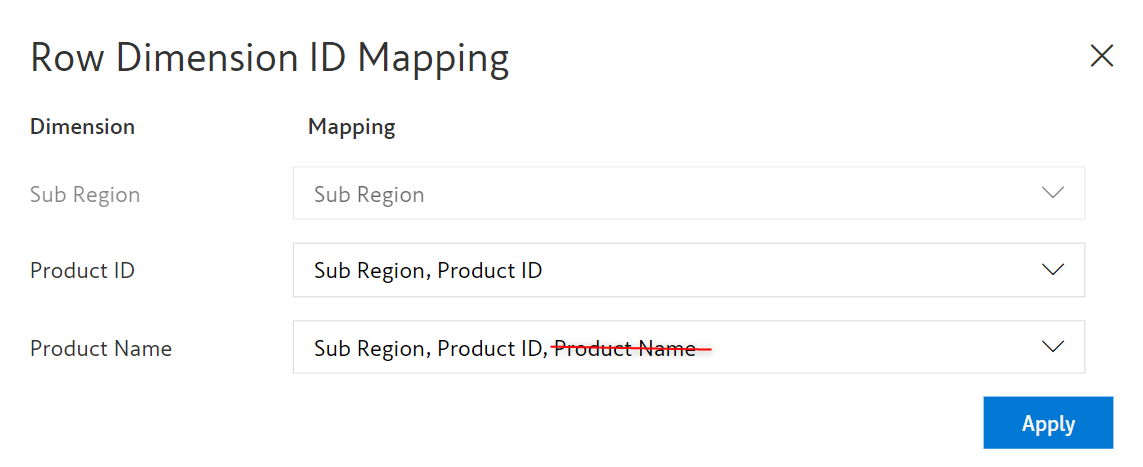
With the latest release, the row dimension mapping is configurable. Navigate to the Insert tab > Manage Measures > Settings > Row ID Mapping. We can use just the product ID instead of the product name to identify the product name rows.
We’ve applied formatting and comments and added data inputs for the Distilled Water and Water rows. Notice how all the visual elements, like formatting and data input, are intact even after the product names were updated to Mineral Water and Sparkling Water.
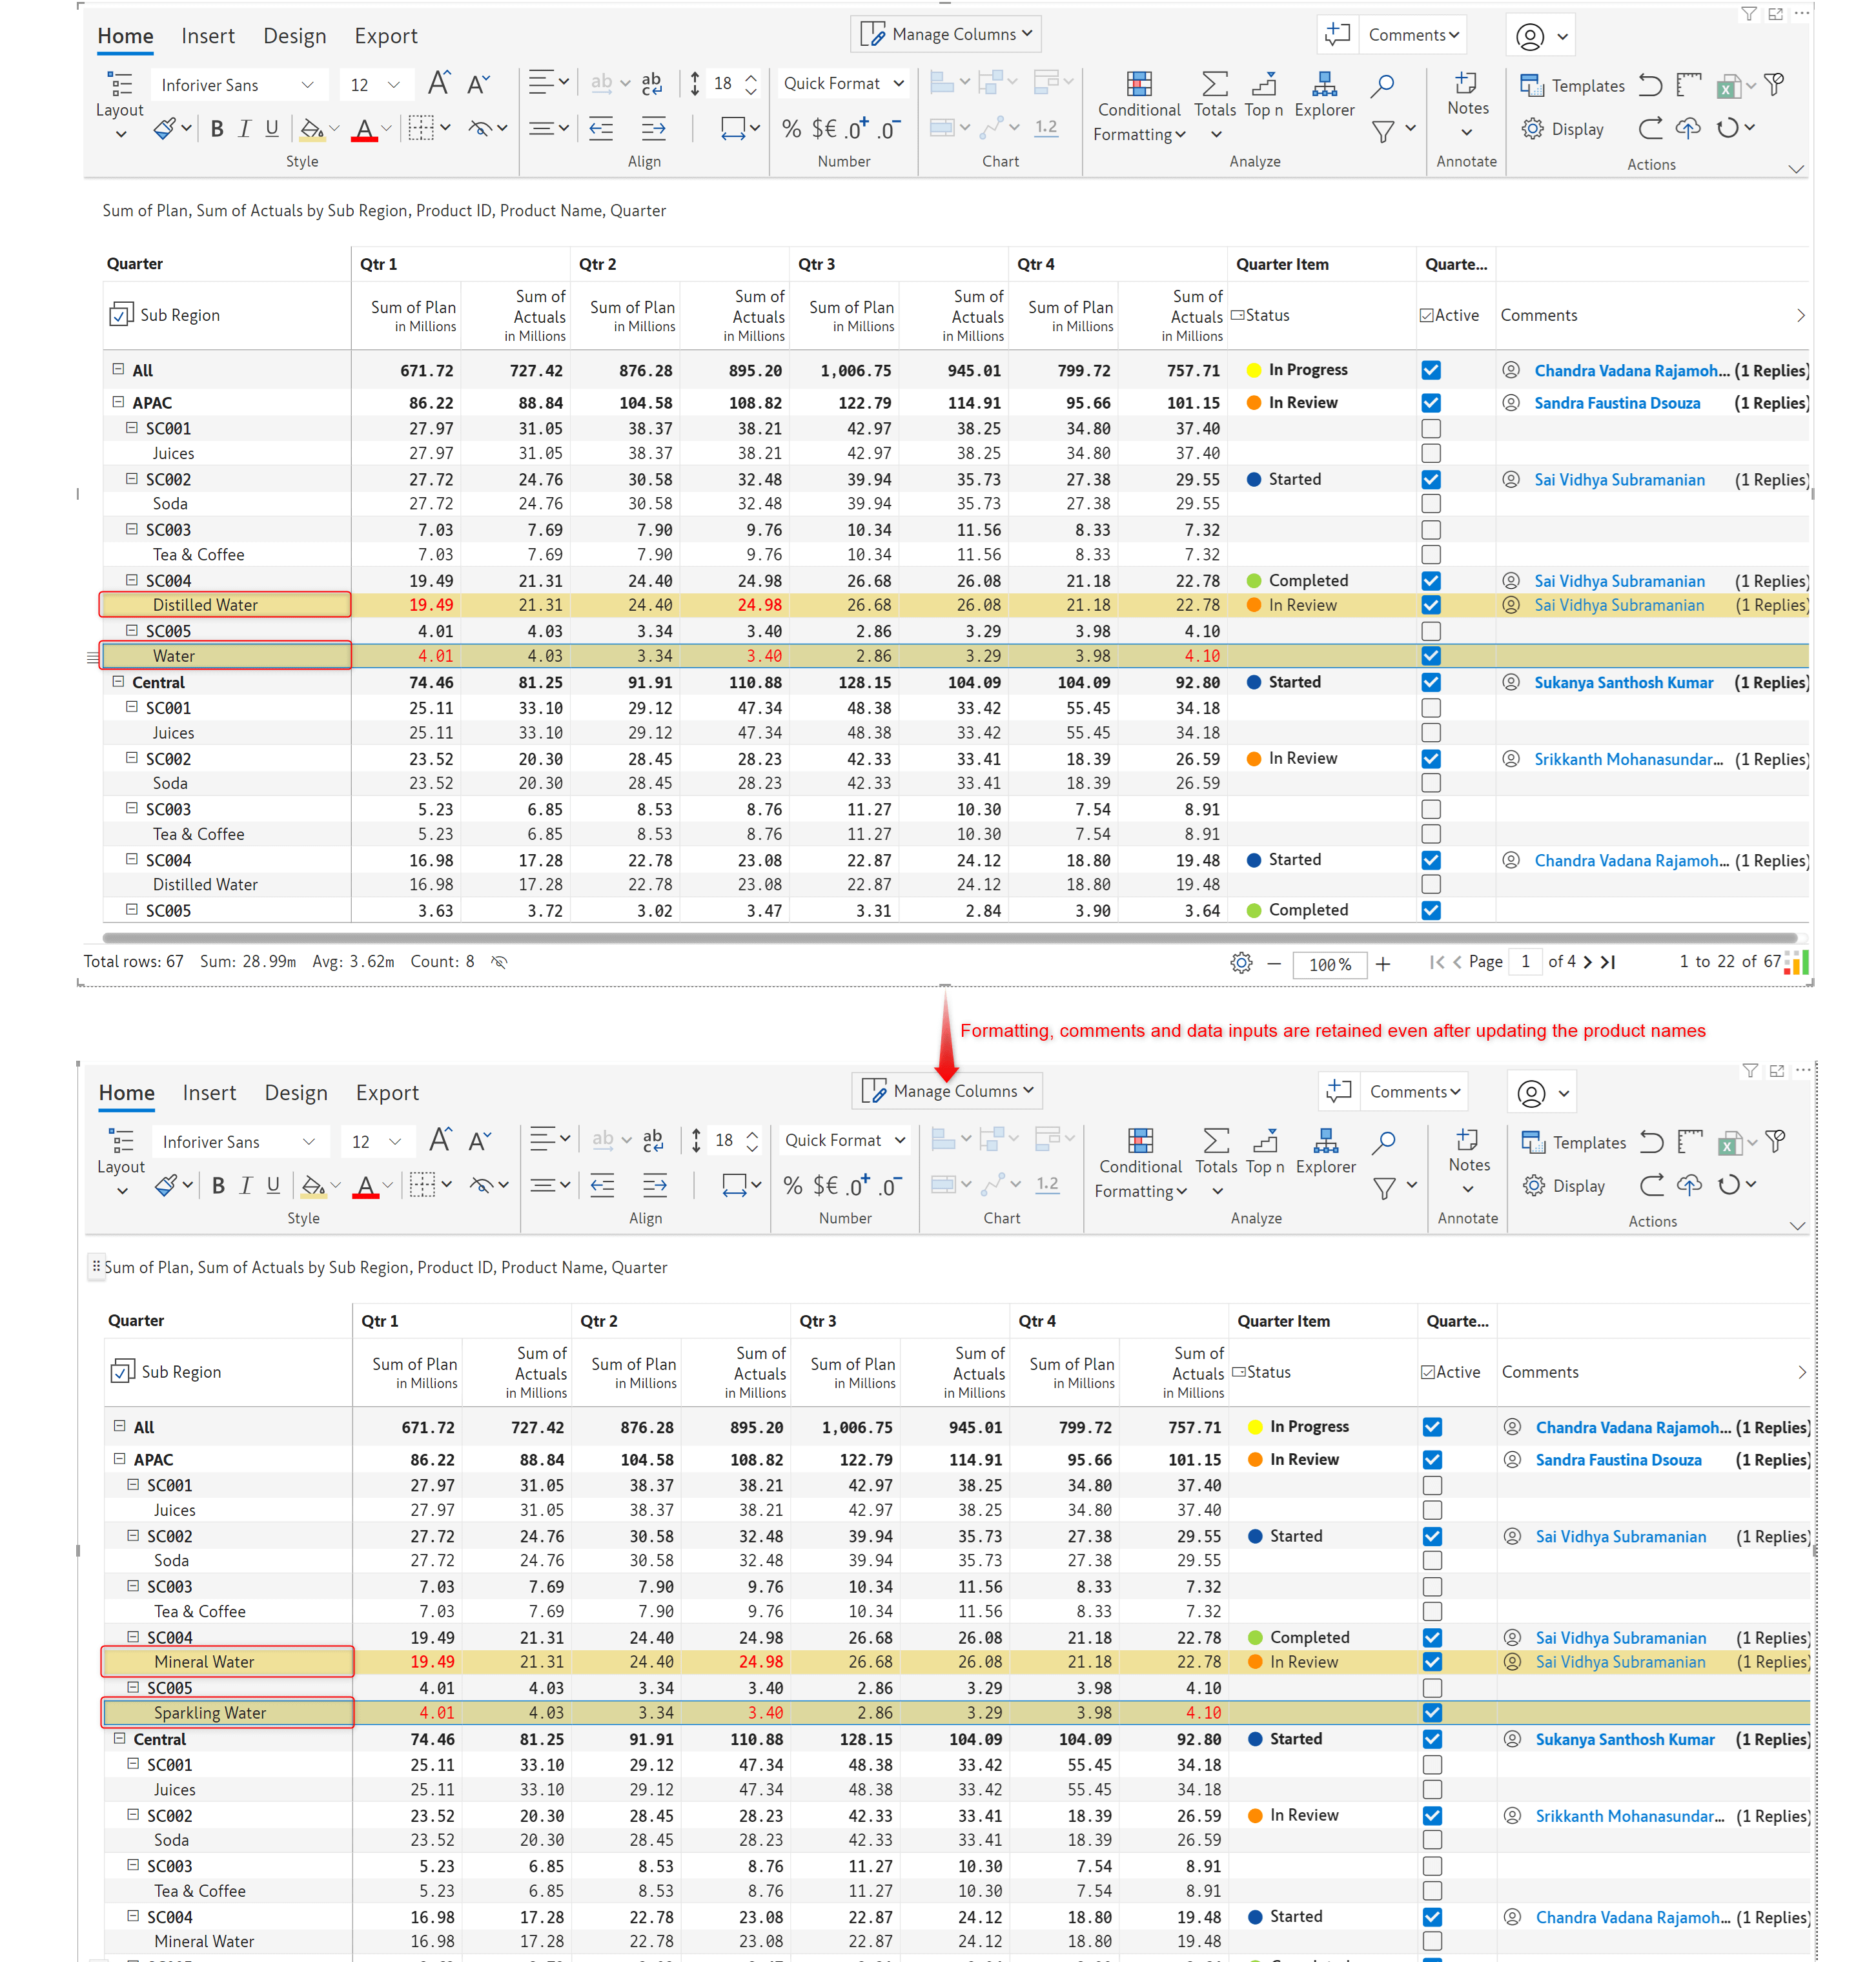
Note: You can hide the product ID from the Manage columns configuration. We have retained it in the report for demonstration purposes.
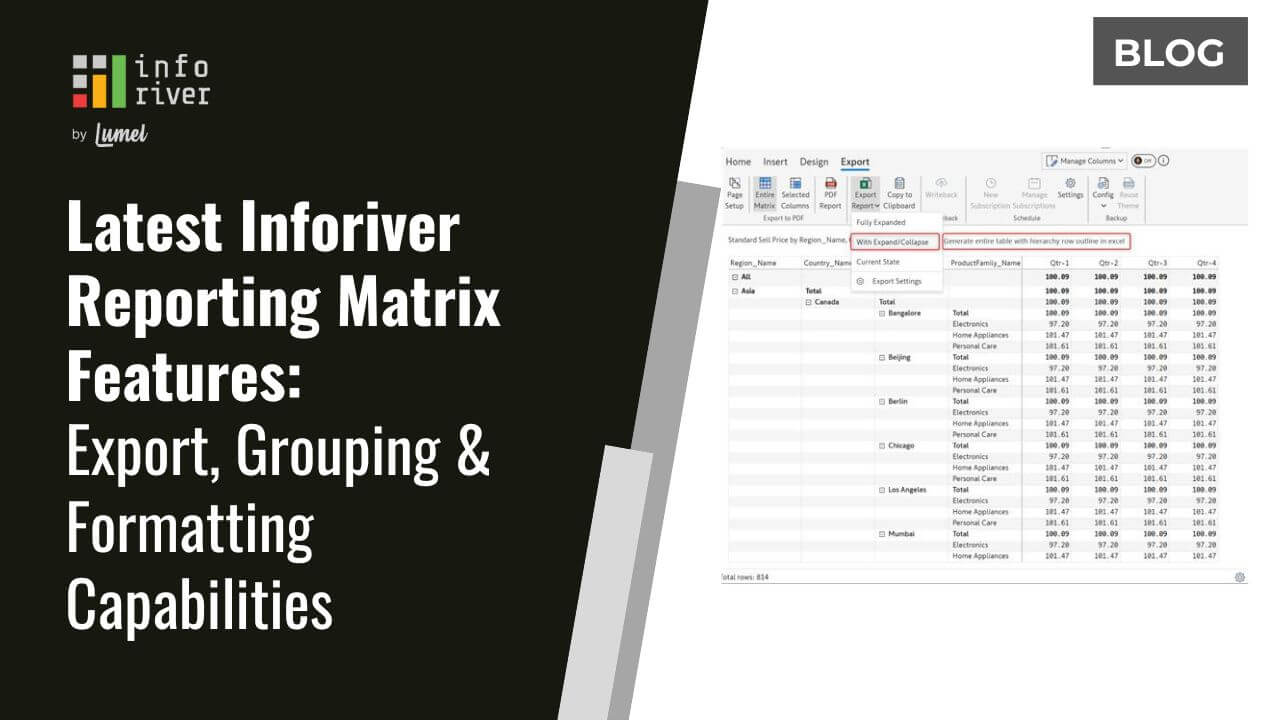
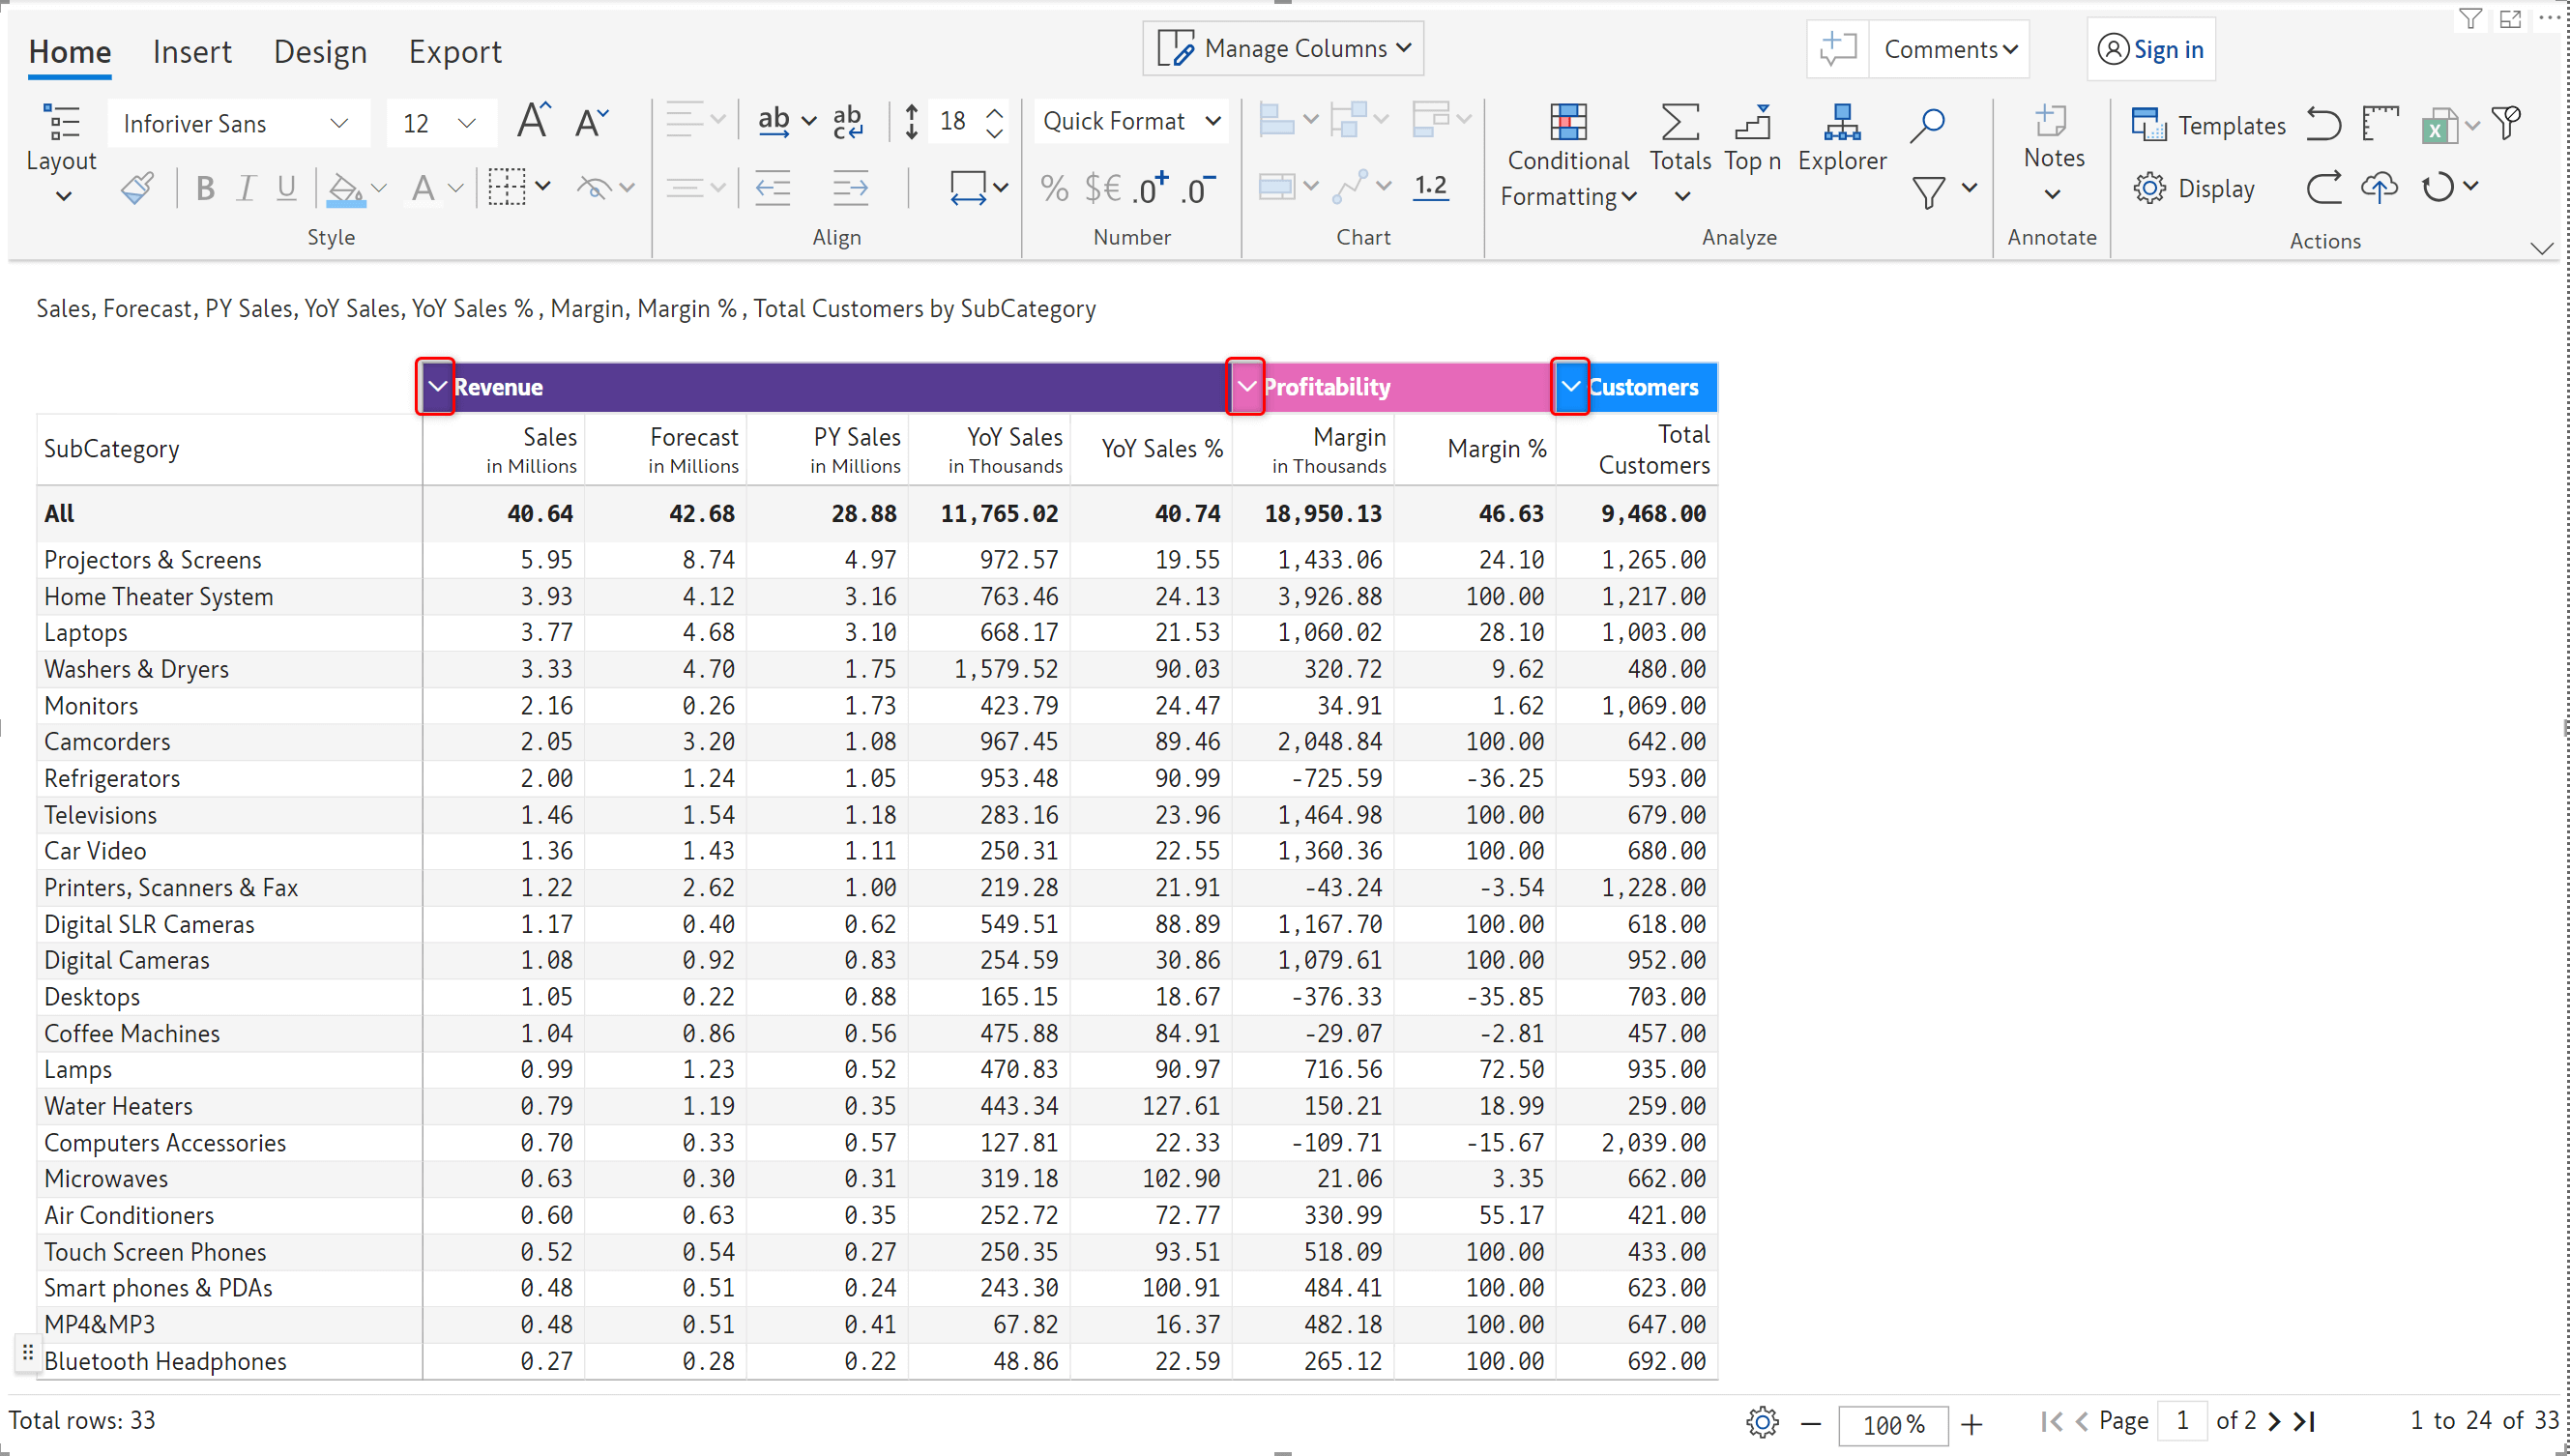
With Inforiver, you can create visual hierarchies by grouping columns. In the latest release, we’ve added an expand/collapse capability for column groups.
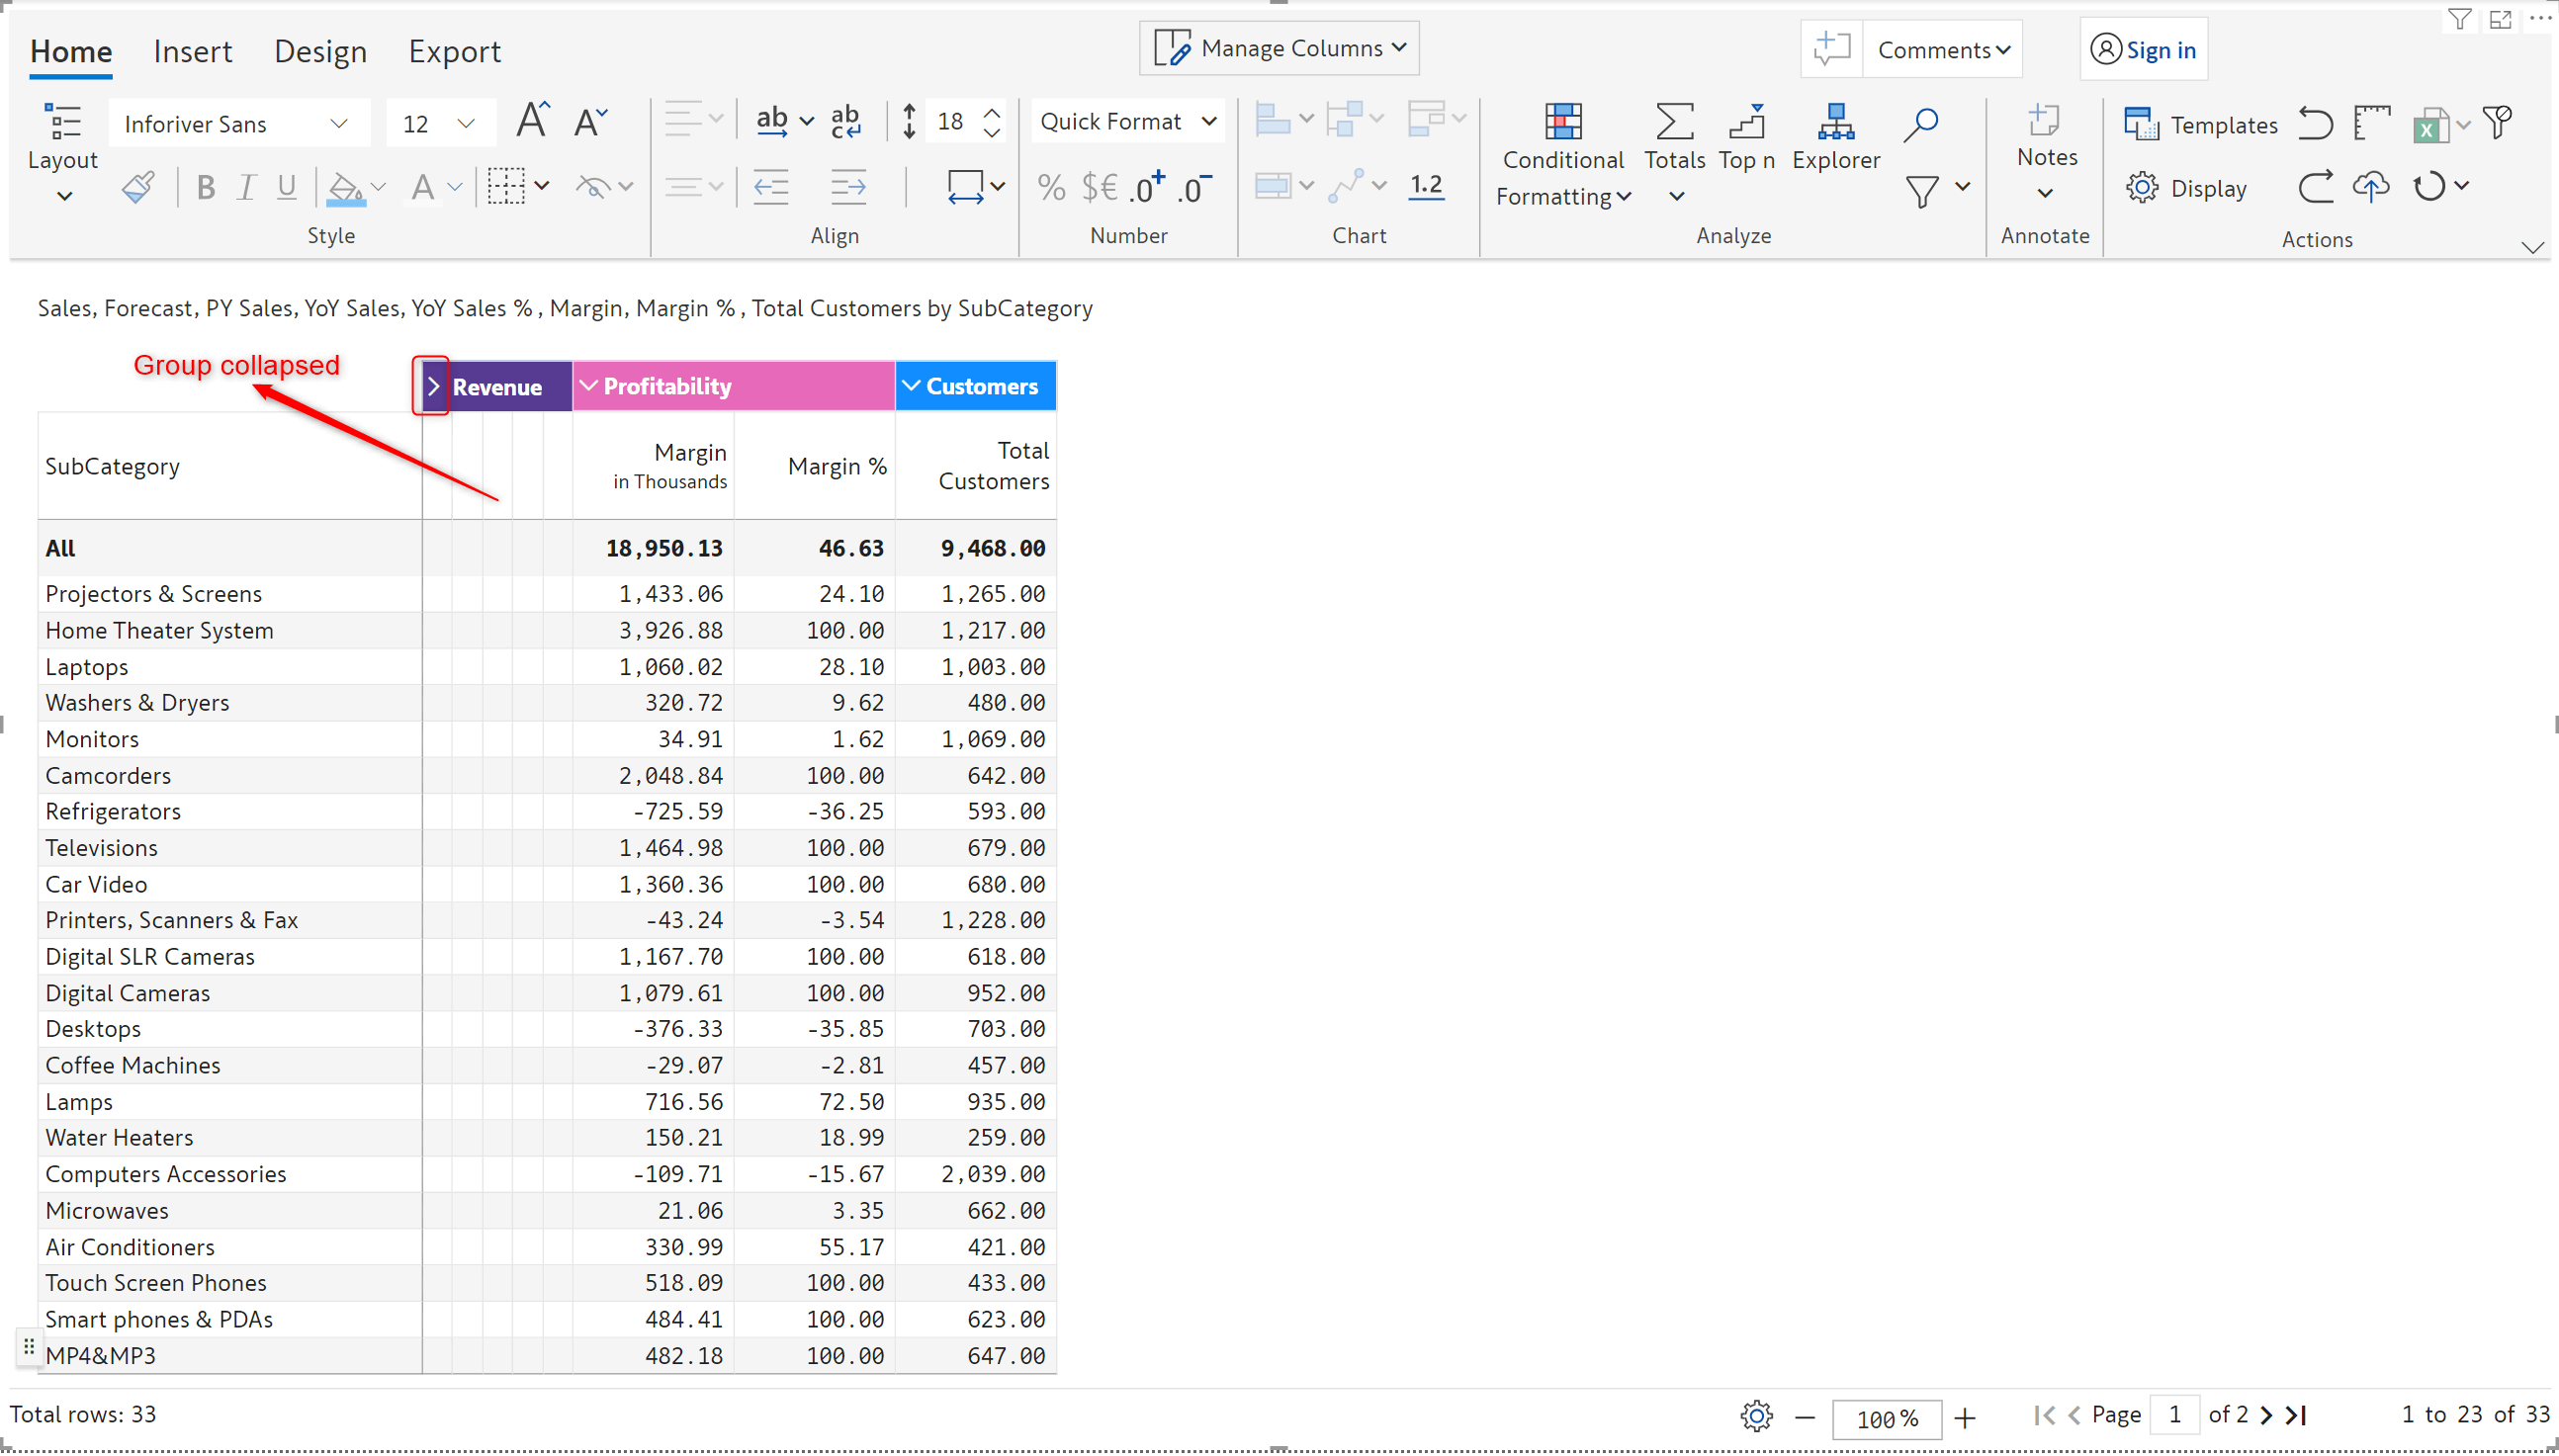
When a custom column group is collapsed, the values in the grouped measures will not be displayed.
With that we conclude the 2.9.5 Enterprise release updates.
The refinements that we continuously make to Inforiver were made possible with your support and feedback. We look forward to receiving your suggestions and have many more exciting innovations lined up! Visit the Inforiver Community to share your ideas, vote on other submissions, and inter

Inforiver helps enterprises consolidate planning, reporting & analytics on a single platform (Power BI). The no-code, self-service award-winning platform has been recognized as the industry’s best and is adopted by many Fortune 100 firms.
Inforiver is a product of Lumel, the #1 Power BI AppSource Partner. The firm serves over 3,000 customers worldwide through its portfolio of products offered under the brands Inforiver, EDITable, ValQ, and xViz.