Upcoming webinar on 'Inforiver Charts : The fastest way to deliver stories in Power BI', Aug 29th , Monday, 10.30 AM CST. Register Now
Upcoming webinar on 'Inforiver Charts : The fastest way to deliver stories in Power BI', Aug 29th , Monday, 10.30 AM CST. Register Now
Welcome to the Inforiver Premium 2.9 update!
The March release ships with innovations in row management, header customizations, new built-in functions, and enhancements to conditional formatting, to name a few. Discover the innovations driving our product as we continue delivering features most anticipated by the Inforiver community. Thank you for choosing Inforiver!
The release notes are organized by the toolbar section, from which each feature can be accessed. Feel free to jump into the section that interests you the most!
1.2 New icons to distinguish between hidden and skipped rows
1.3 Display outliers with lollipop charts
2.1 Action analysis for conditional formatting
2.2 Conditional formatting based on date conditions
2.3 Detect calculated rows in Inforiver filters
2.4 KPI explorer for measures added to Others parameter
3.1 Performance boost by disabling totals
3.2 Custom date formats for hierarchical dates
4.1 Replicate note for multiple cells
4.2 View all notes in the reading view
4.3 Individual indicator for each note
5.1 Hide blank column dimensions
6.1 Row-level security for visual rows
7.1 New time intelligence functions
7.2 Warning message while switching between visual column and measure
8.1 KPI presets will reflect explorer selections
8.2 New manual data selection options for charts
8.3 Sparkline with manual selection
8.4 New header preset with integrated charts
8.5 Replace or insert options for header containers
9.1 Cover page for report exports
10.2 Select category dimension
10.3 Insert sum/average of rows
Inforiver offers an unparalleled degree of customization for each element of your reports. If you do not wish to display the measure headers, all you need to do is select the header and click on the hide icon. You can re-enable the hidden headers by selecting the hidden section and clicking the show/hide button again.
With Inforiver, you have the flexibility to hide rows or skip rows (exclude from calculations and exports) in reports, without having to modify the dataset. Hidden rows and skipped rows now have unique icons that aid you in easily distinguishing between them.
Note: You can use the Alt + G shortcut key to select multiple rows and skip them.
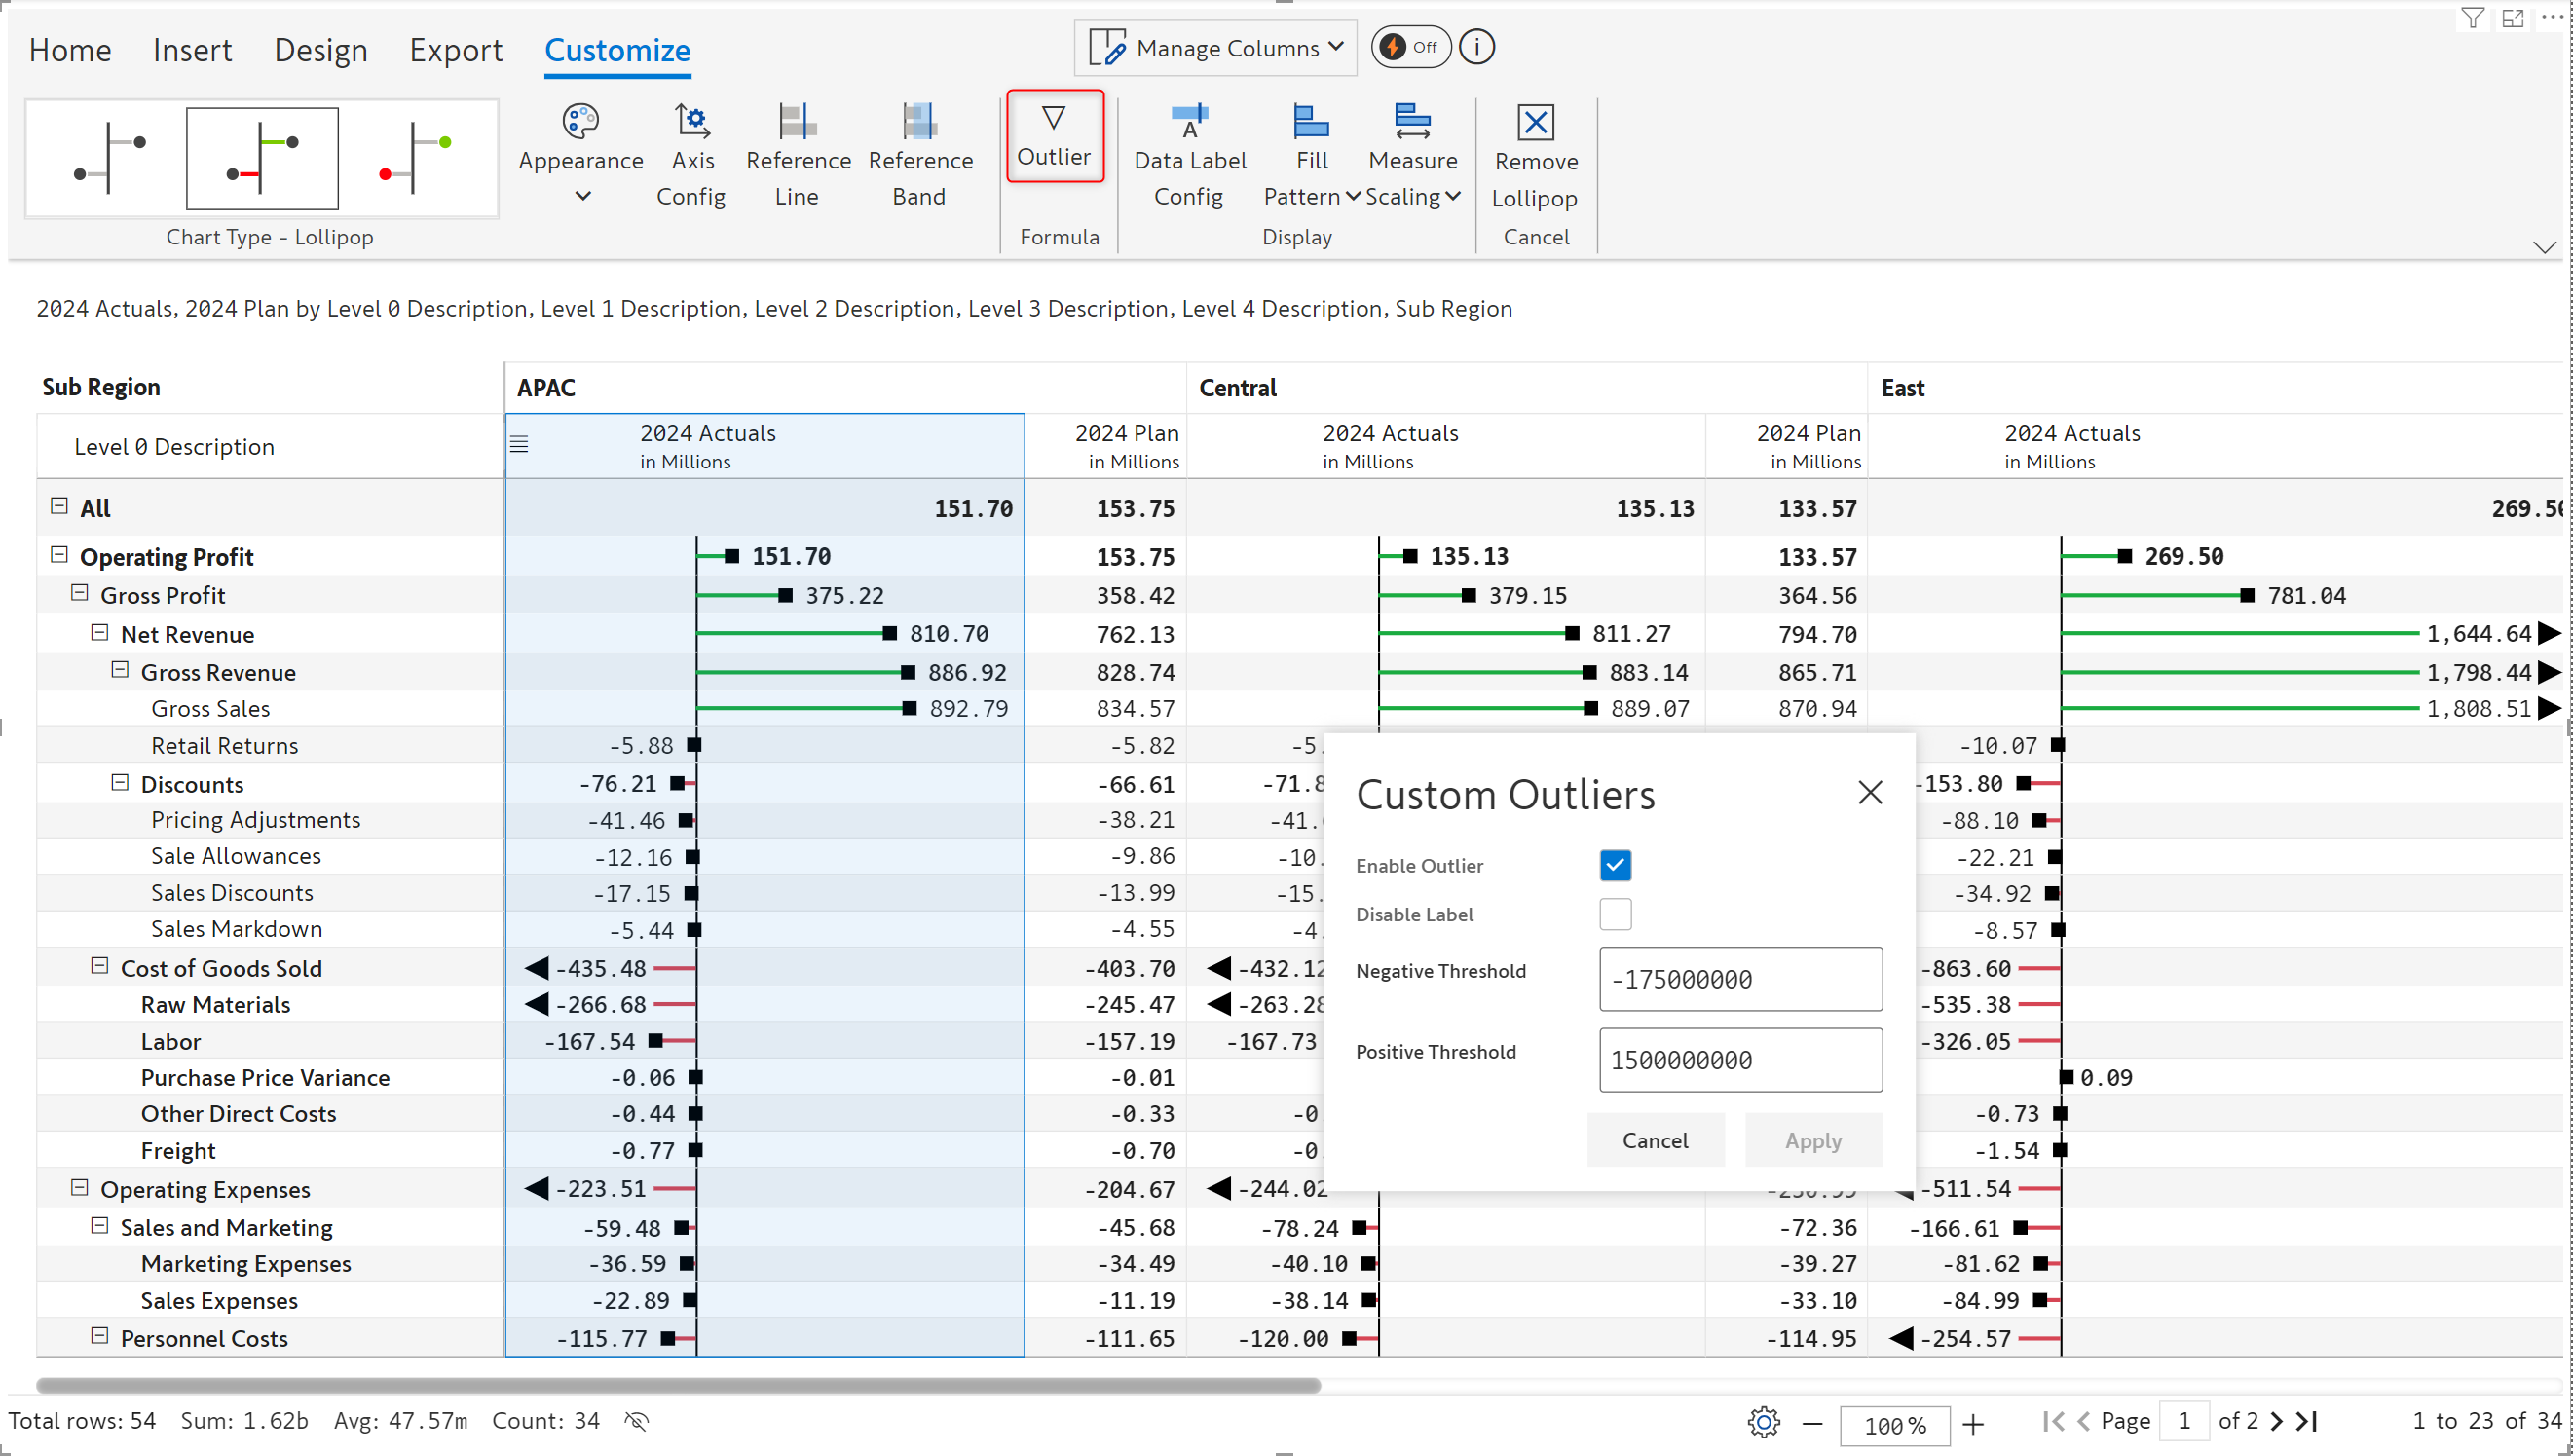
You can set a custom threshold and highlight the outliers in your data. The outlier option applies only to lollipop charts – outliers can be identified by the arrow symbol at the end of the lollipop.
Note: You can use notations like m or b for millions and billions while setting the outlier threshold.
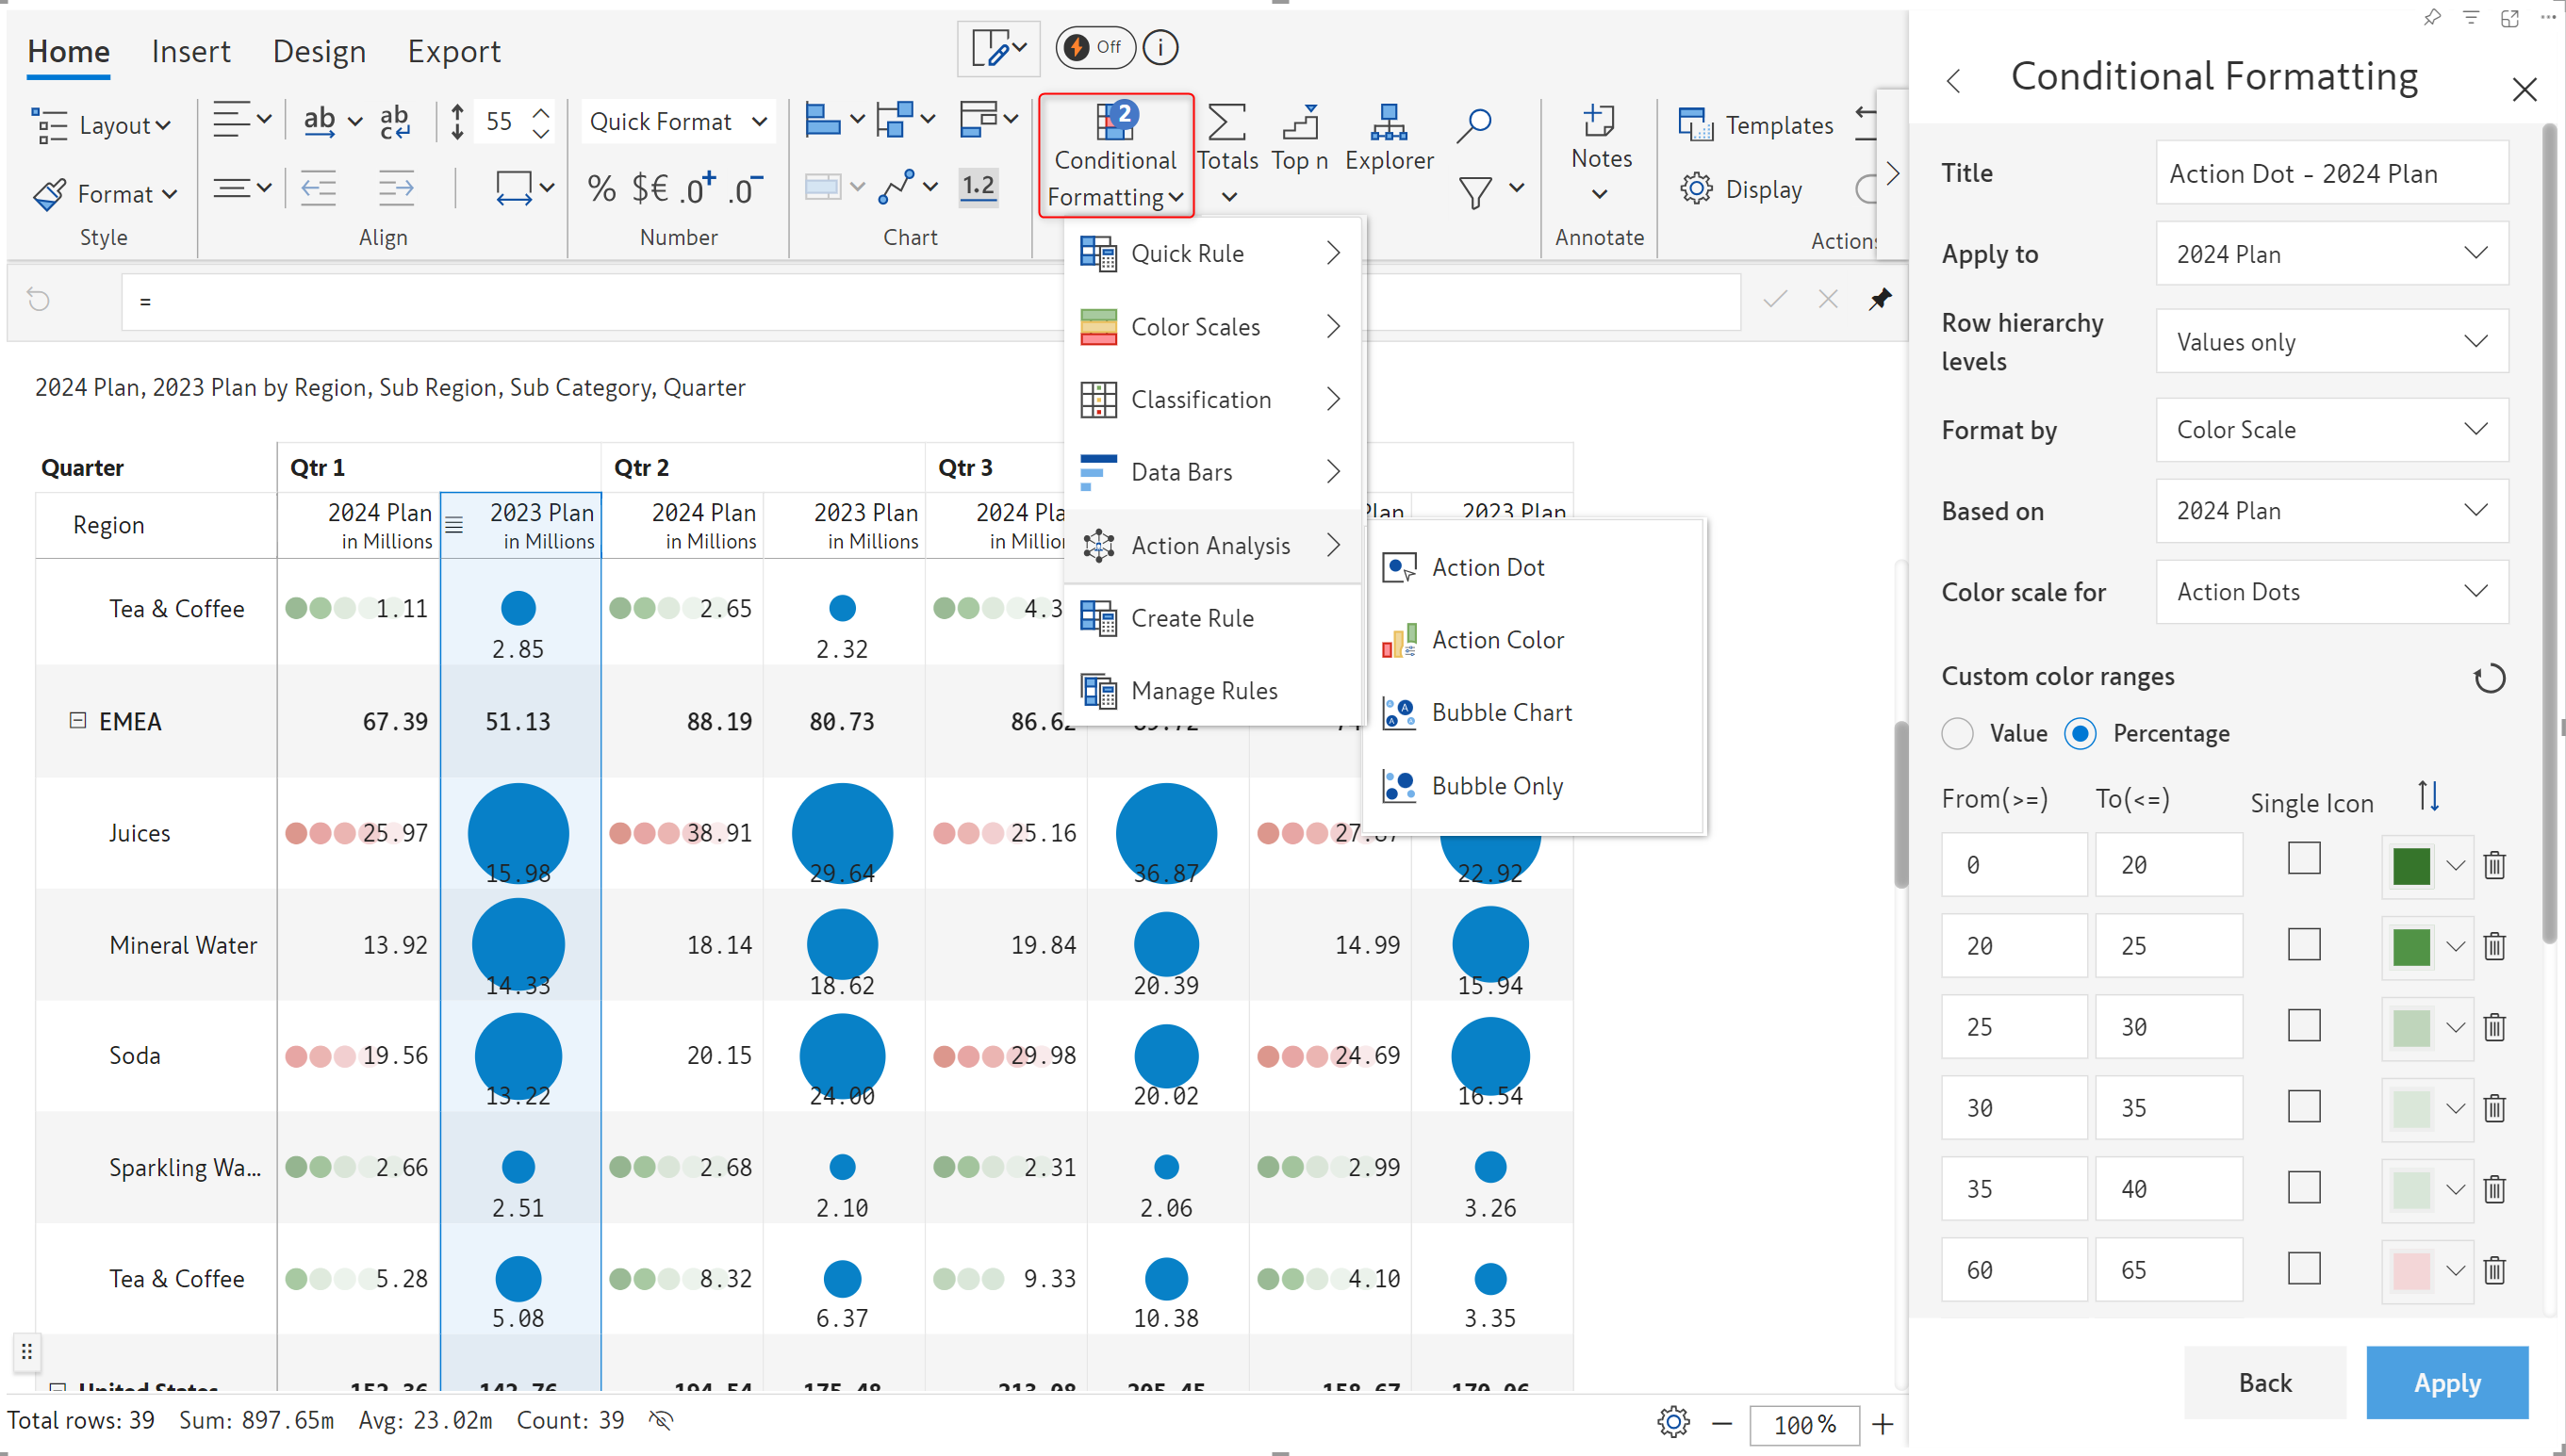
Inforiver’s conditional formatting allows you to automatically format cells or data based on specified conditions, making data more visually appealing and easier to interpret. We have added a new Action Analysis option in the latest release:
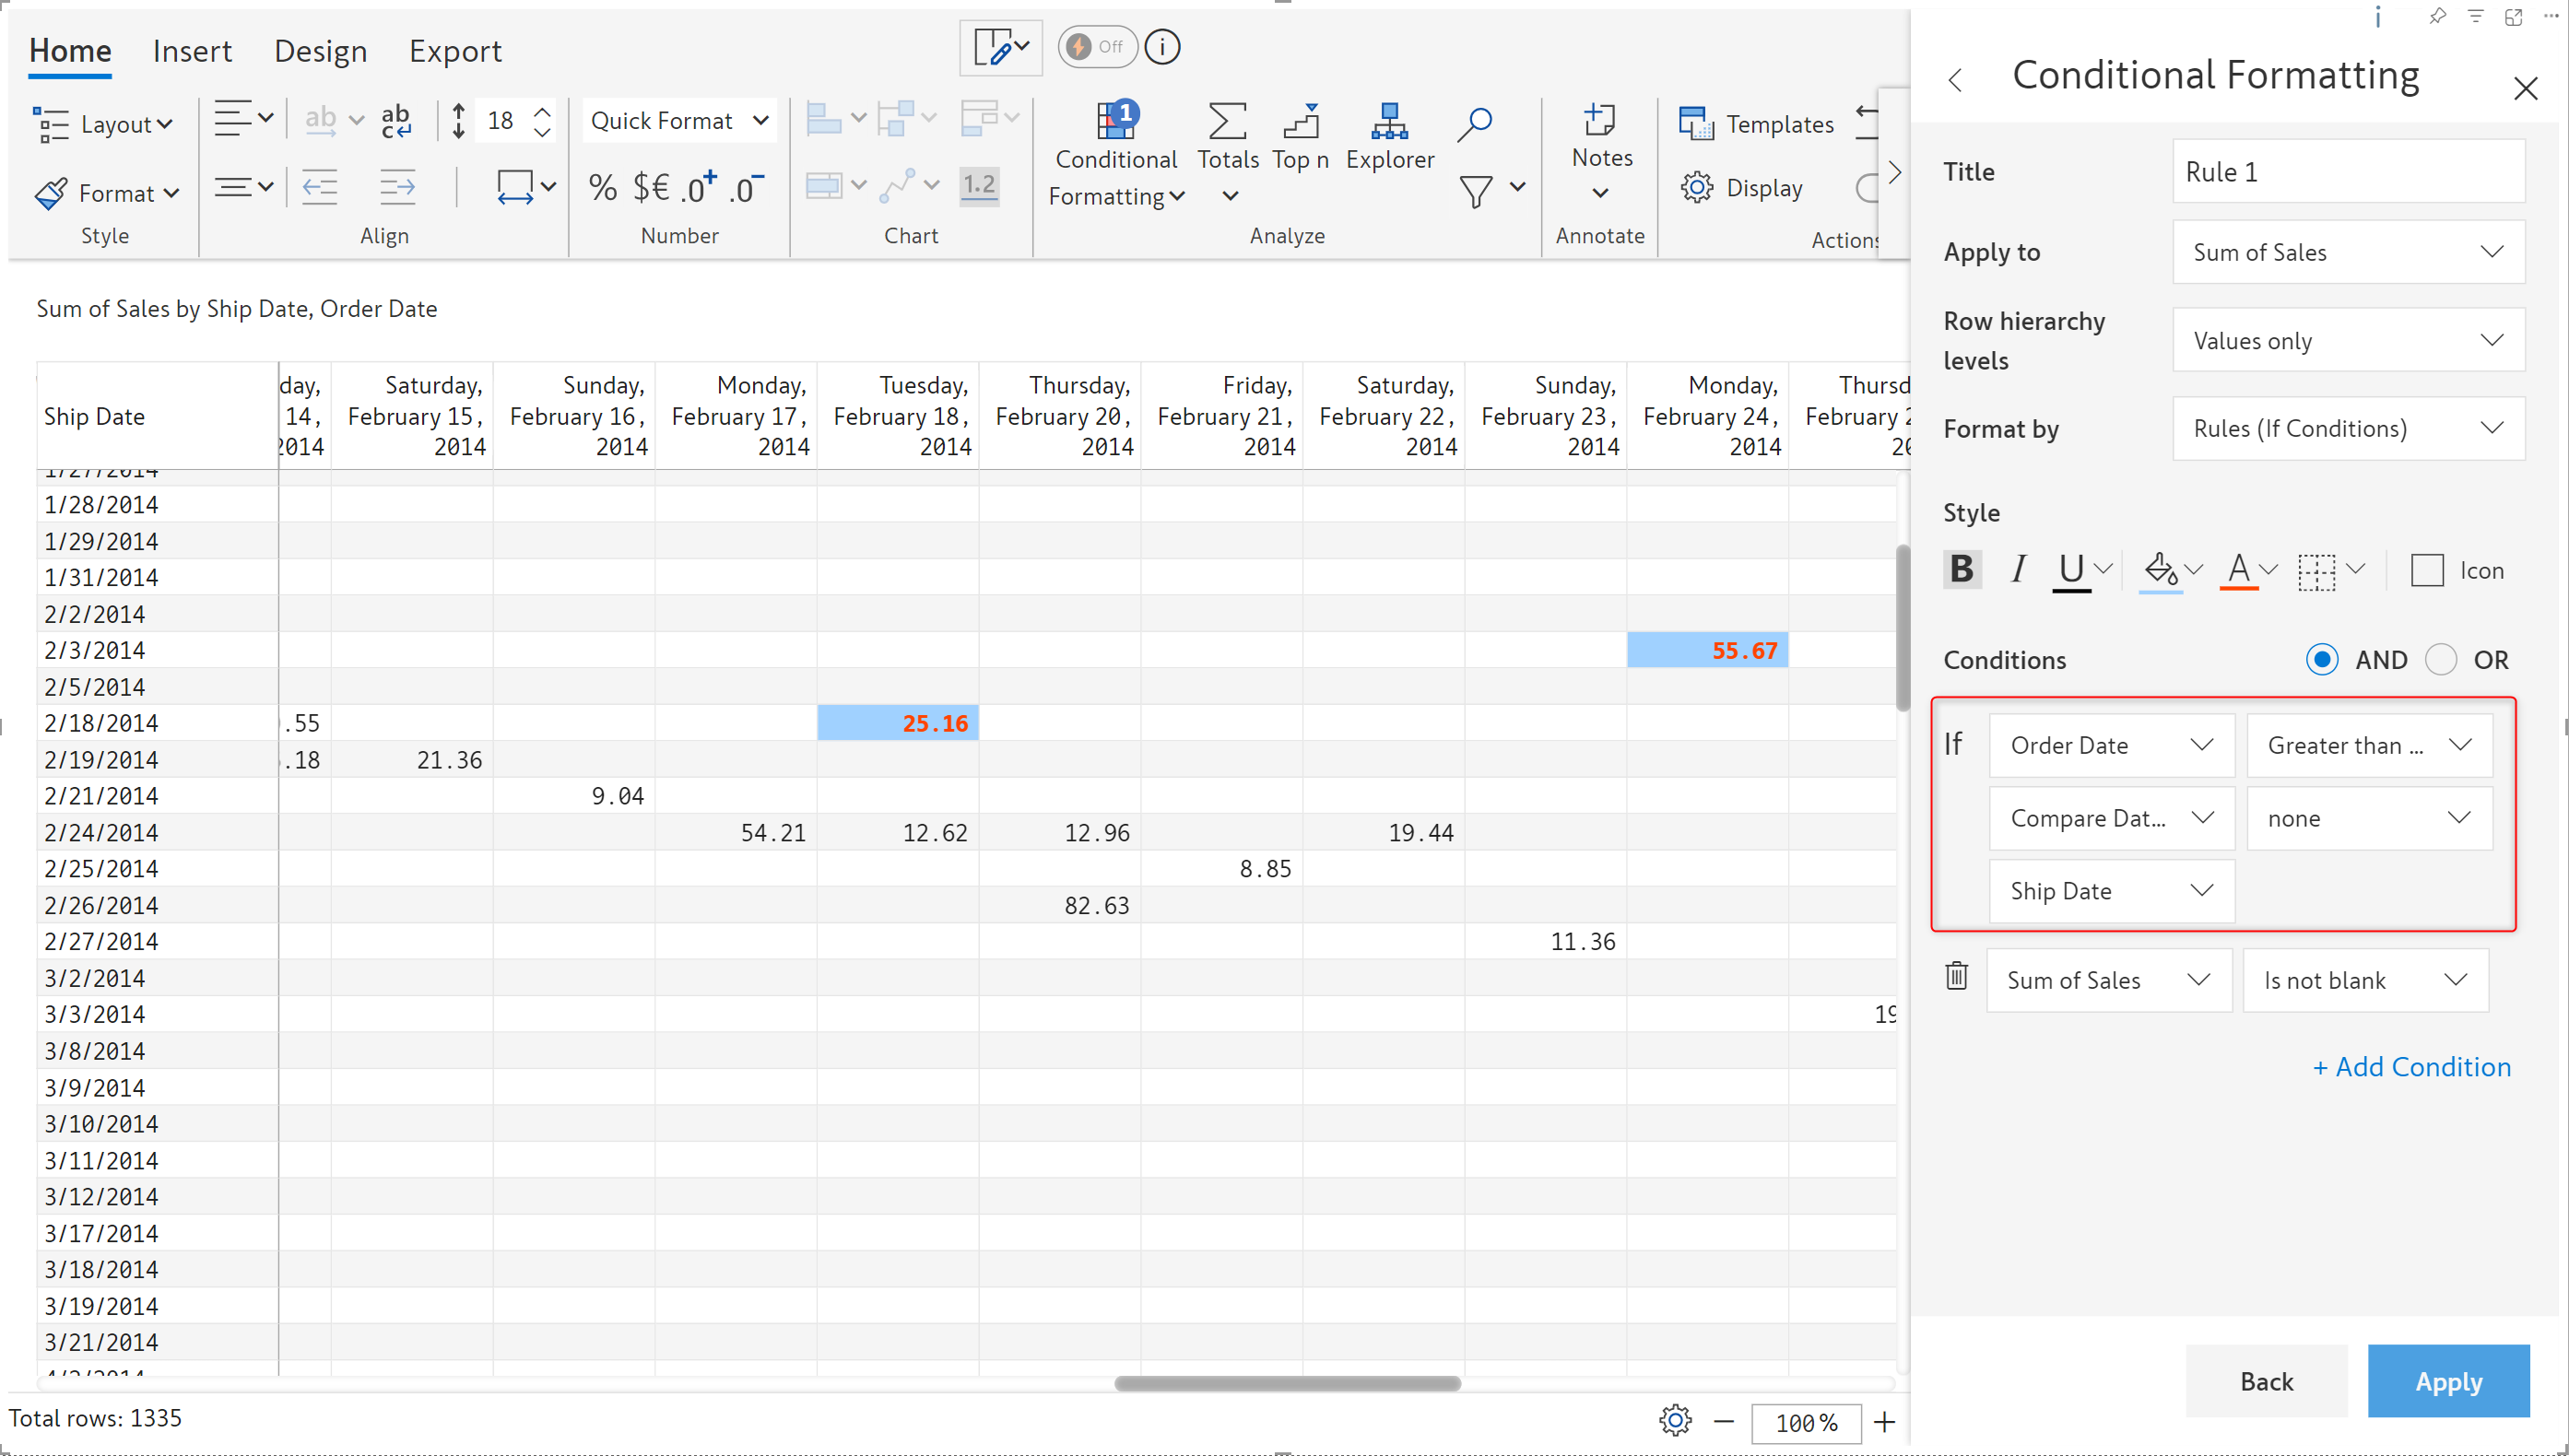
With Inforiver, you can compare date values in row and column dimensions and automatically highlight cells based on the comparison. This feature is particularly useful for adding insights to logistics reports. In the example below, we have used conditional formatting to highlight the cells with order dates greater than ship dates.
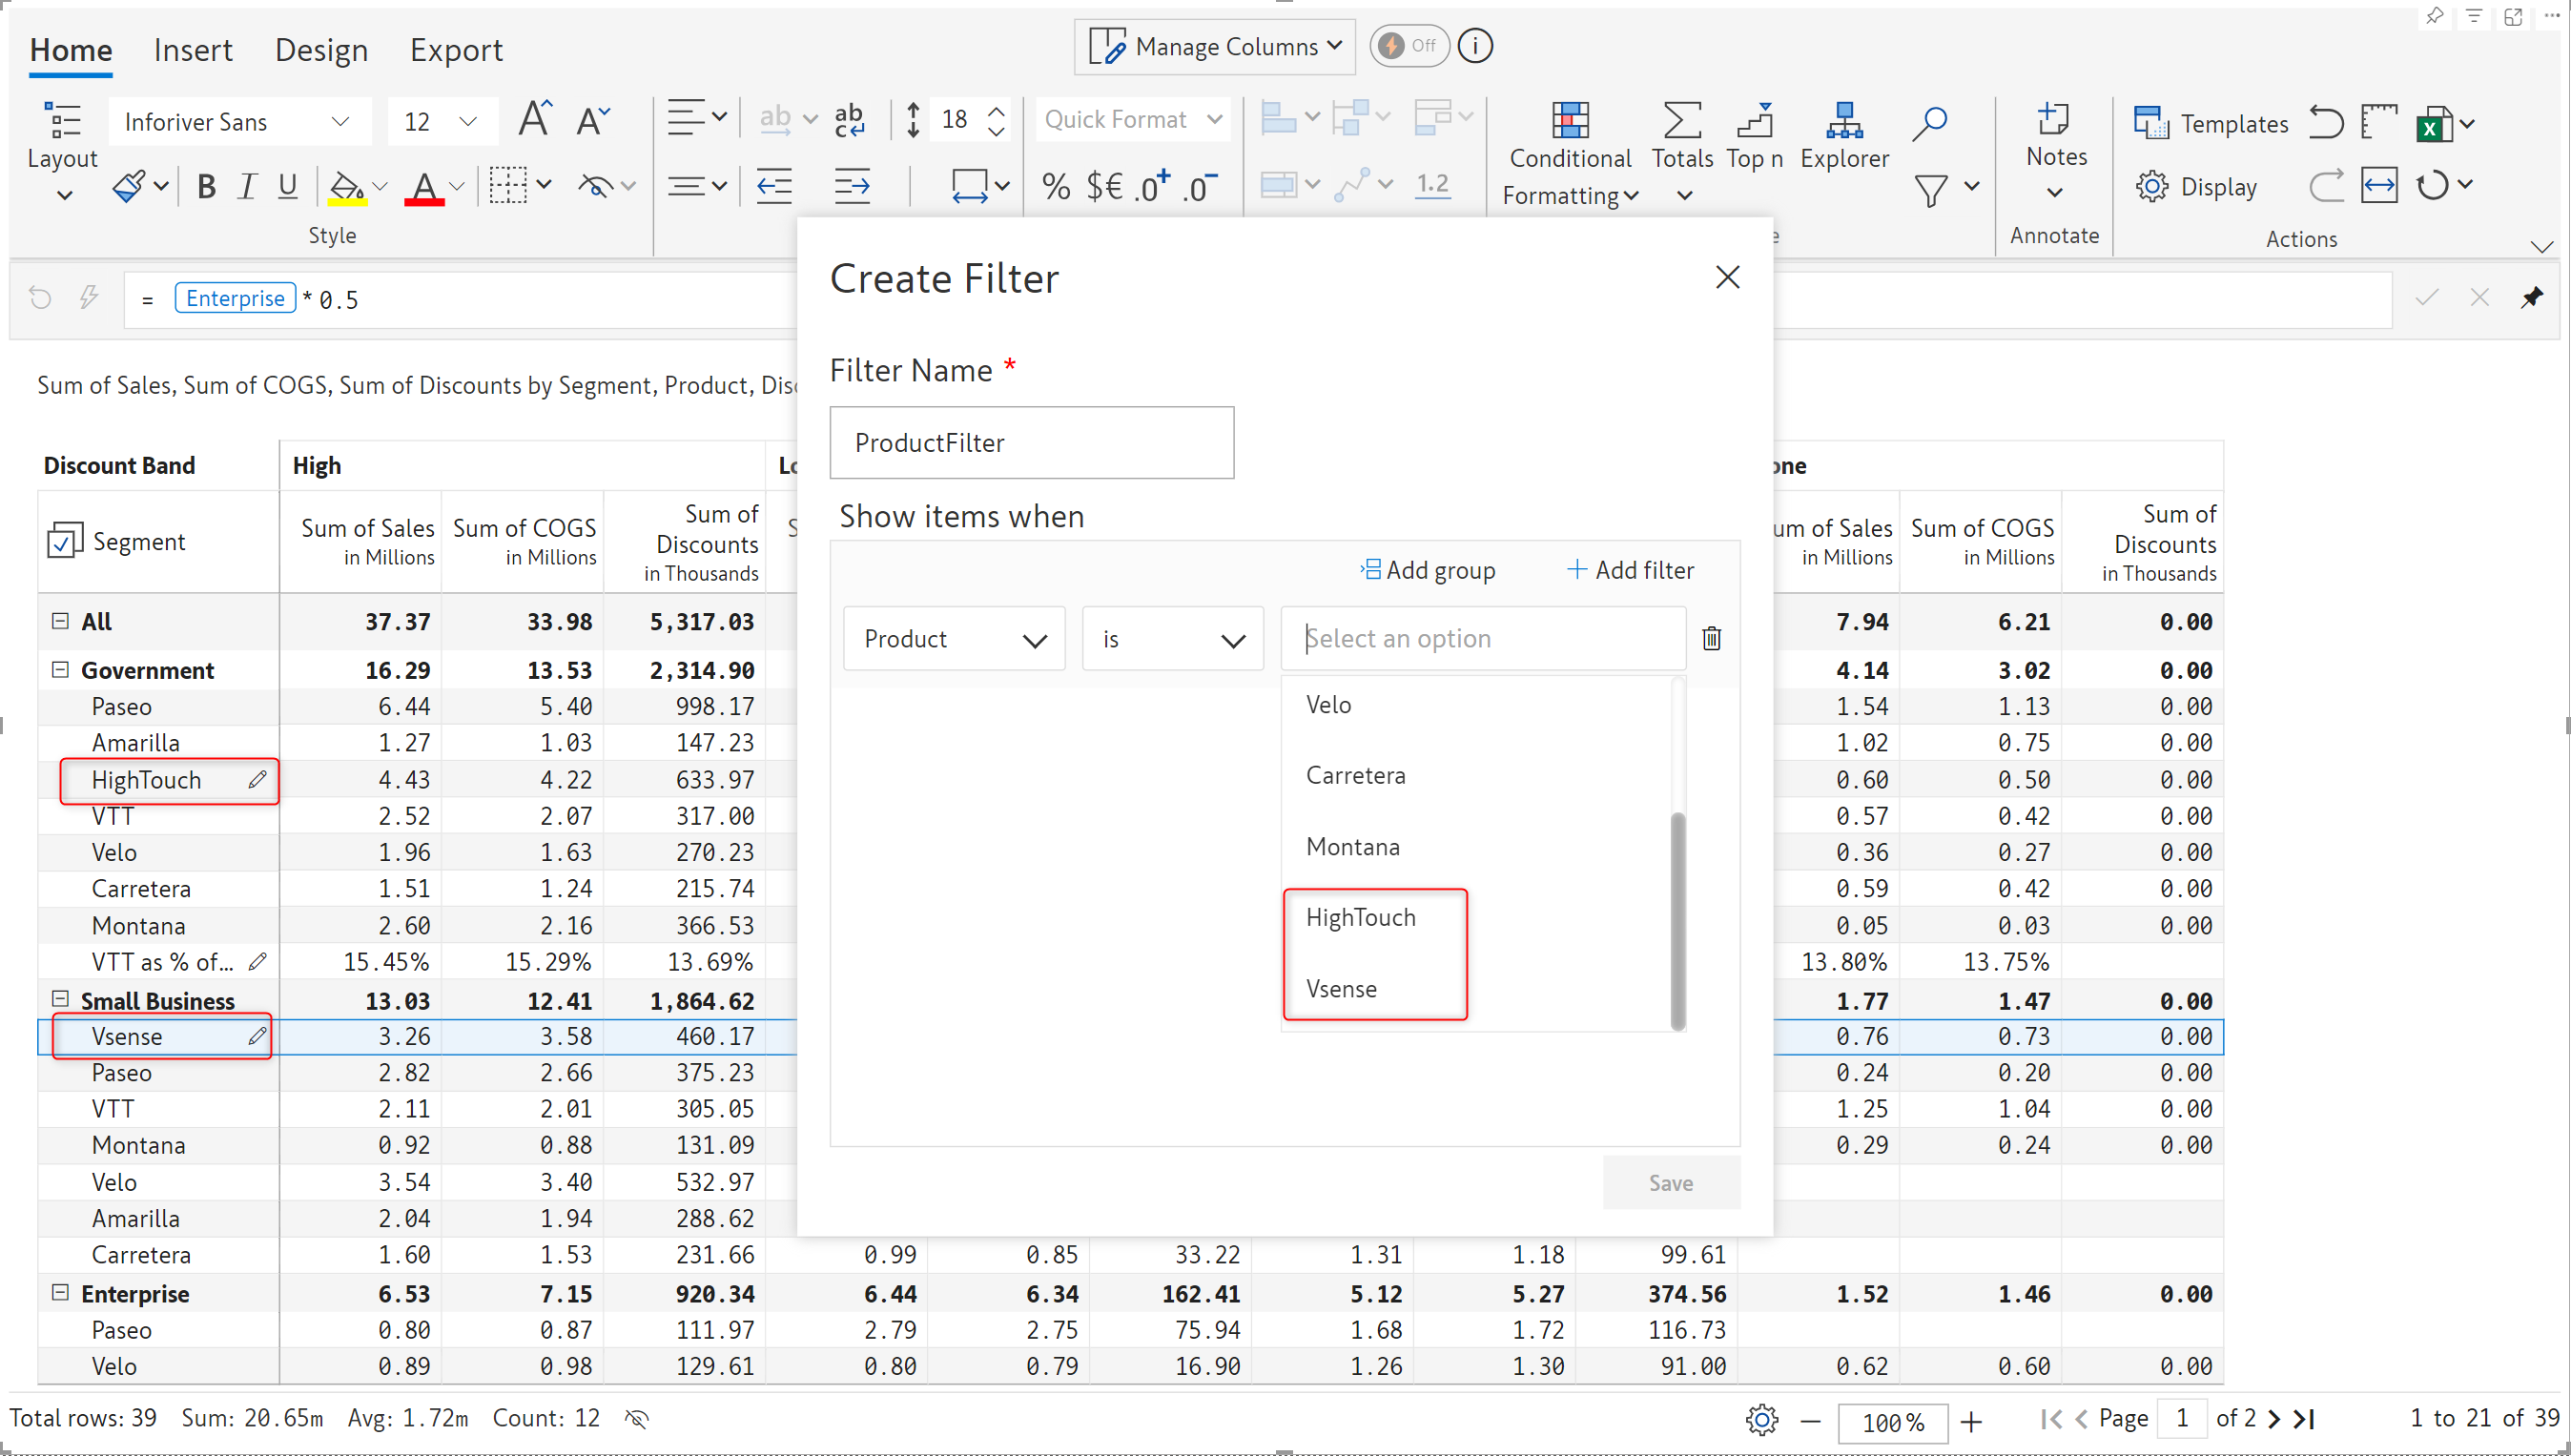
Inforiver enables you to insert rows directly into the report without having to modify the dataset. With the latest release, Inforiver filters can detect manually inserted row categories and calculated rows. You can apply filters for data input or calculated rows just like you do for row categories from the dataset.
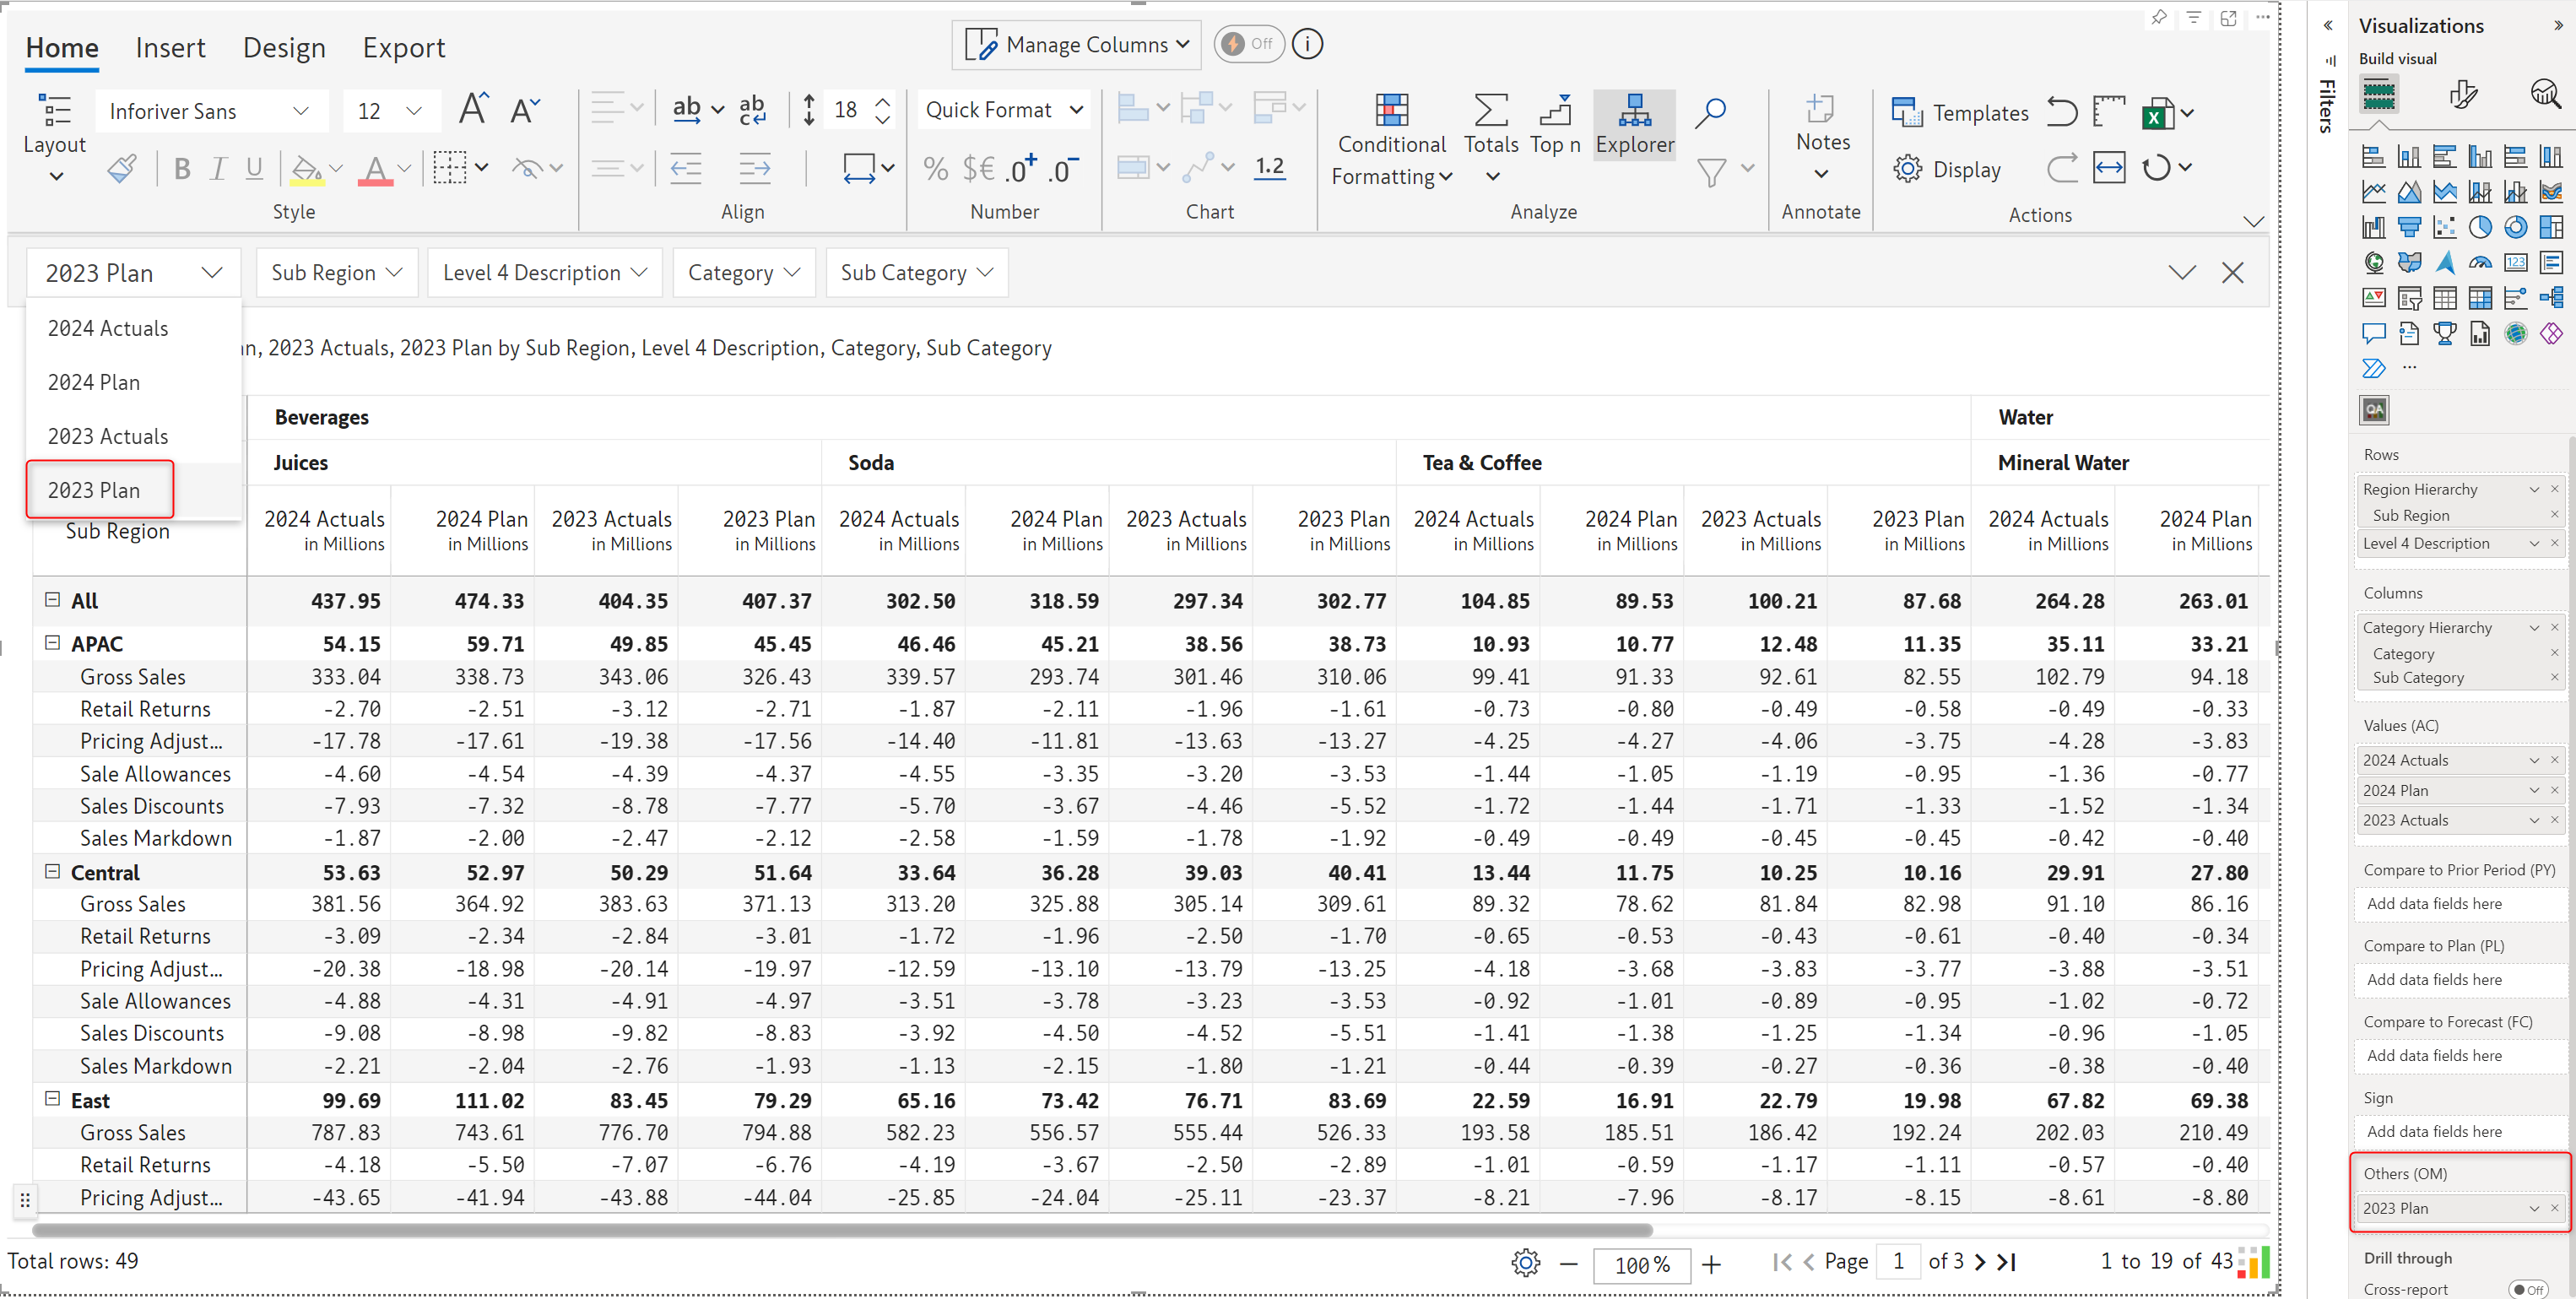
The KPI explorer can detect measures that are added to the Others (OM) visual parameter as well, enabling you to filter data based on the others’ measures.
Inforiver’s conditional formatting allows you to add icons to quickly grasp the trends in your data. With the latest release, you have an additional option to align your icons in the grid. By default, the icons are left aligned.
When this option is unchecked, the icon is displayed next to the value.
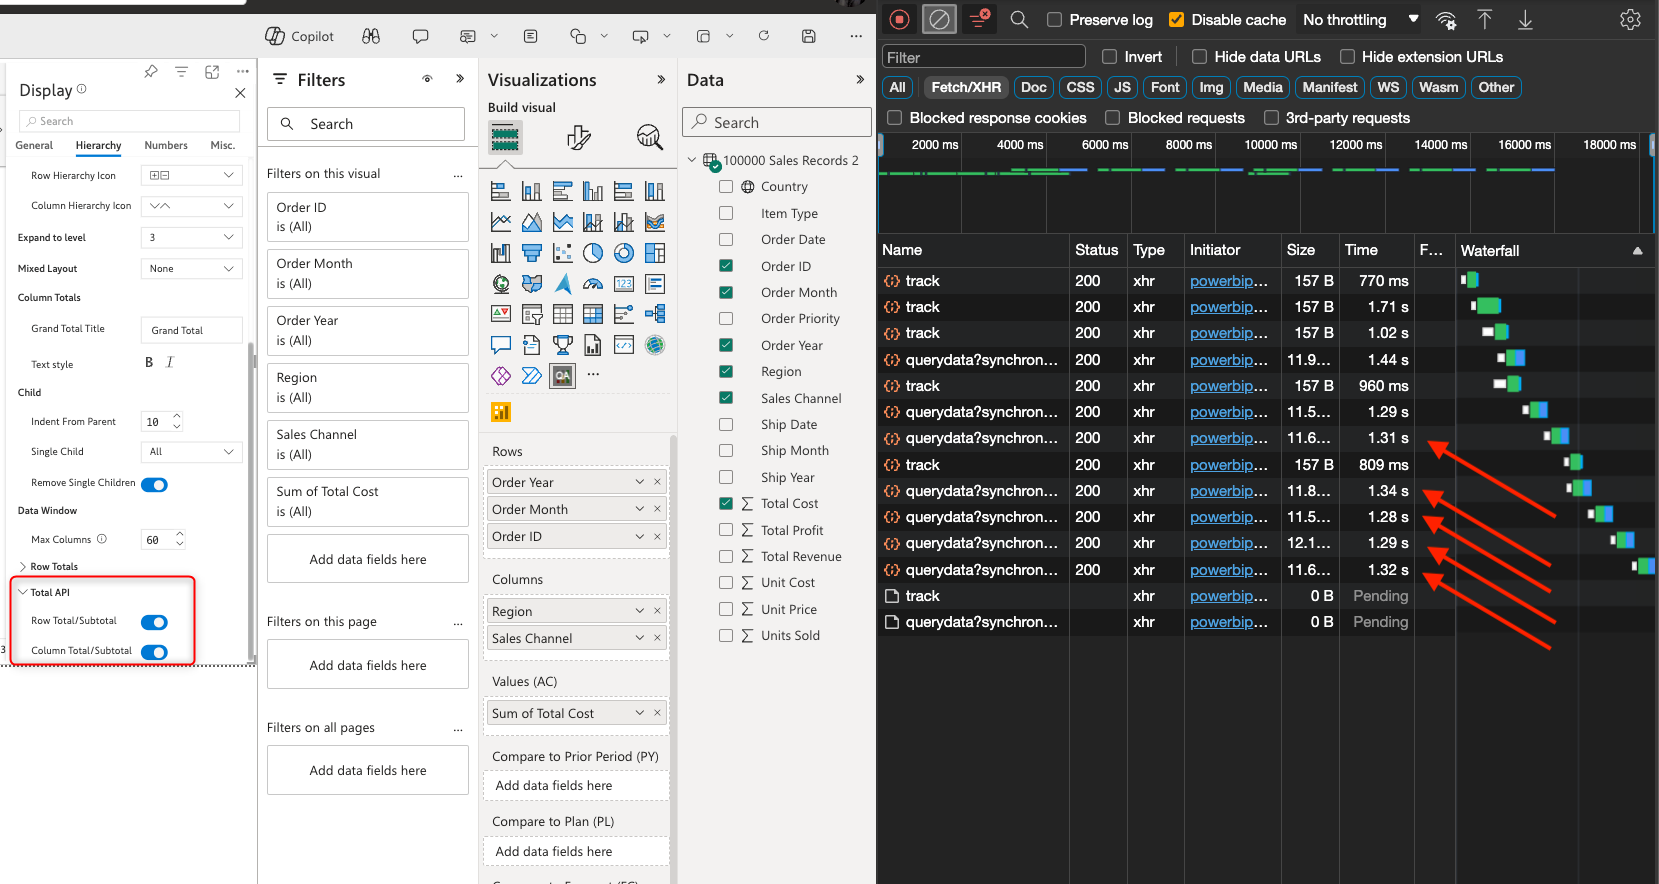
Inforiver pre-calculates the totals and subtotals for your data while loading the report. If your dataset is large and you do not require totals in your reports, you can substantially reduce the loading time of your report with the Total API options. Navigate to Display settings > Hierarchy tab; you can individually disable the row or column totals and subtotals.
Notice the time taken when Inforiver pre-calculates the totals and subtotals:
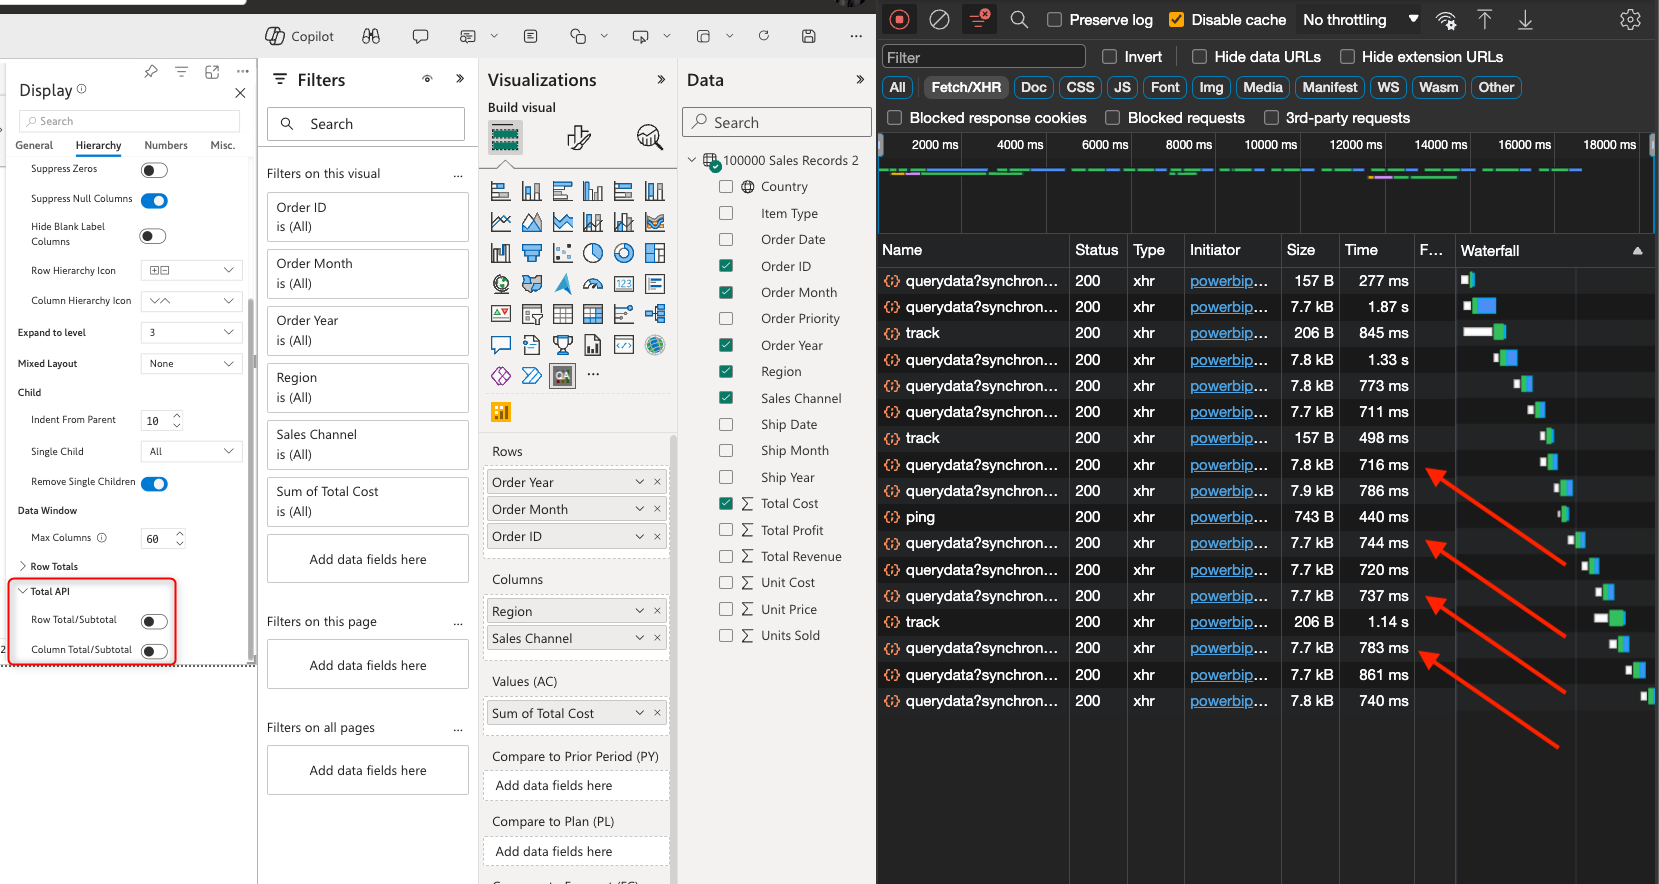
When the total calculation is disabled, large datasets can be fetched in milliseconds, as shown in the screenshot below.
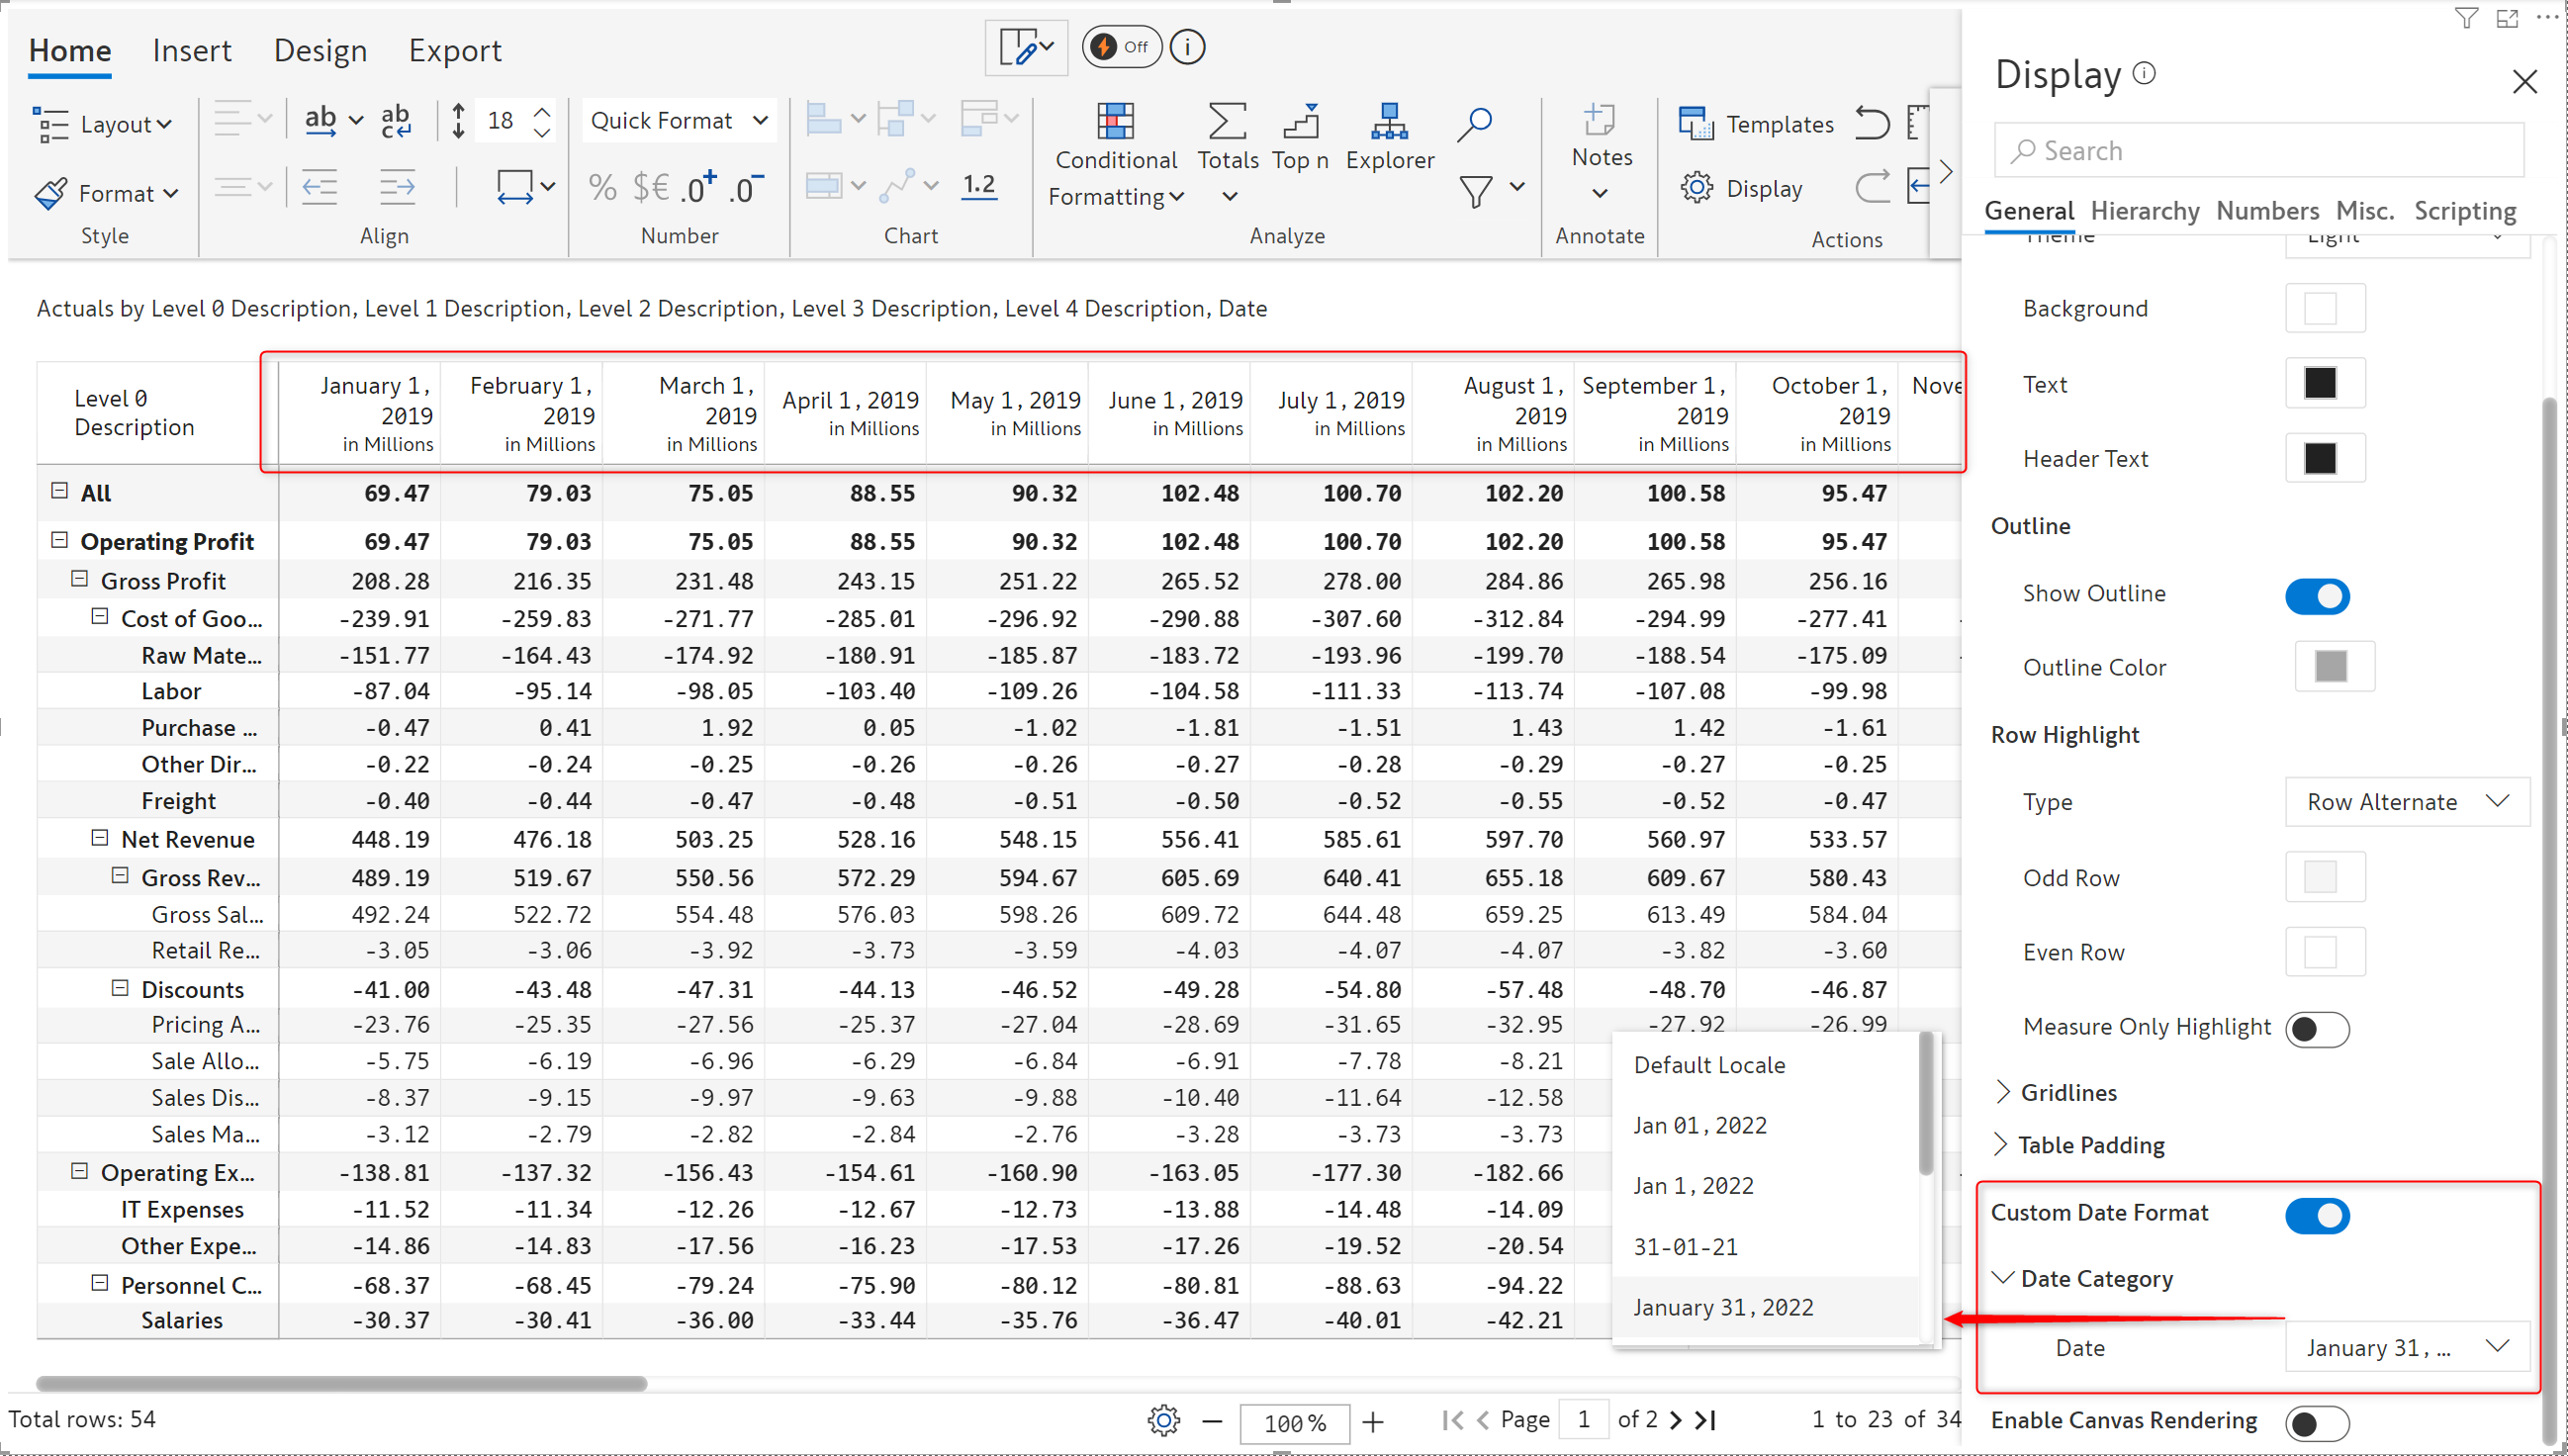
You can now set a specific date format for hierarchical date dimensions in rows or columns. Enable the Custom Date Format option to select the format from the Date category dropdown.
With Inforiver, you can add cell-level notes that offer additional details regarding the data presented in the report. In certain cases, you may need to enter a note that applies to multiple cells. For example, a particular marketing strategy may have contributed to the increase in sales for specific regions and quarters. You can now select a series of cells and add a single note that applies to all of them.
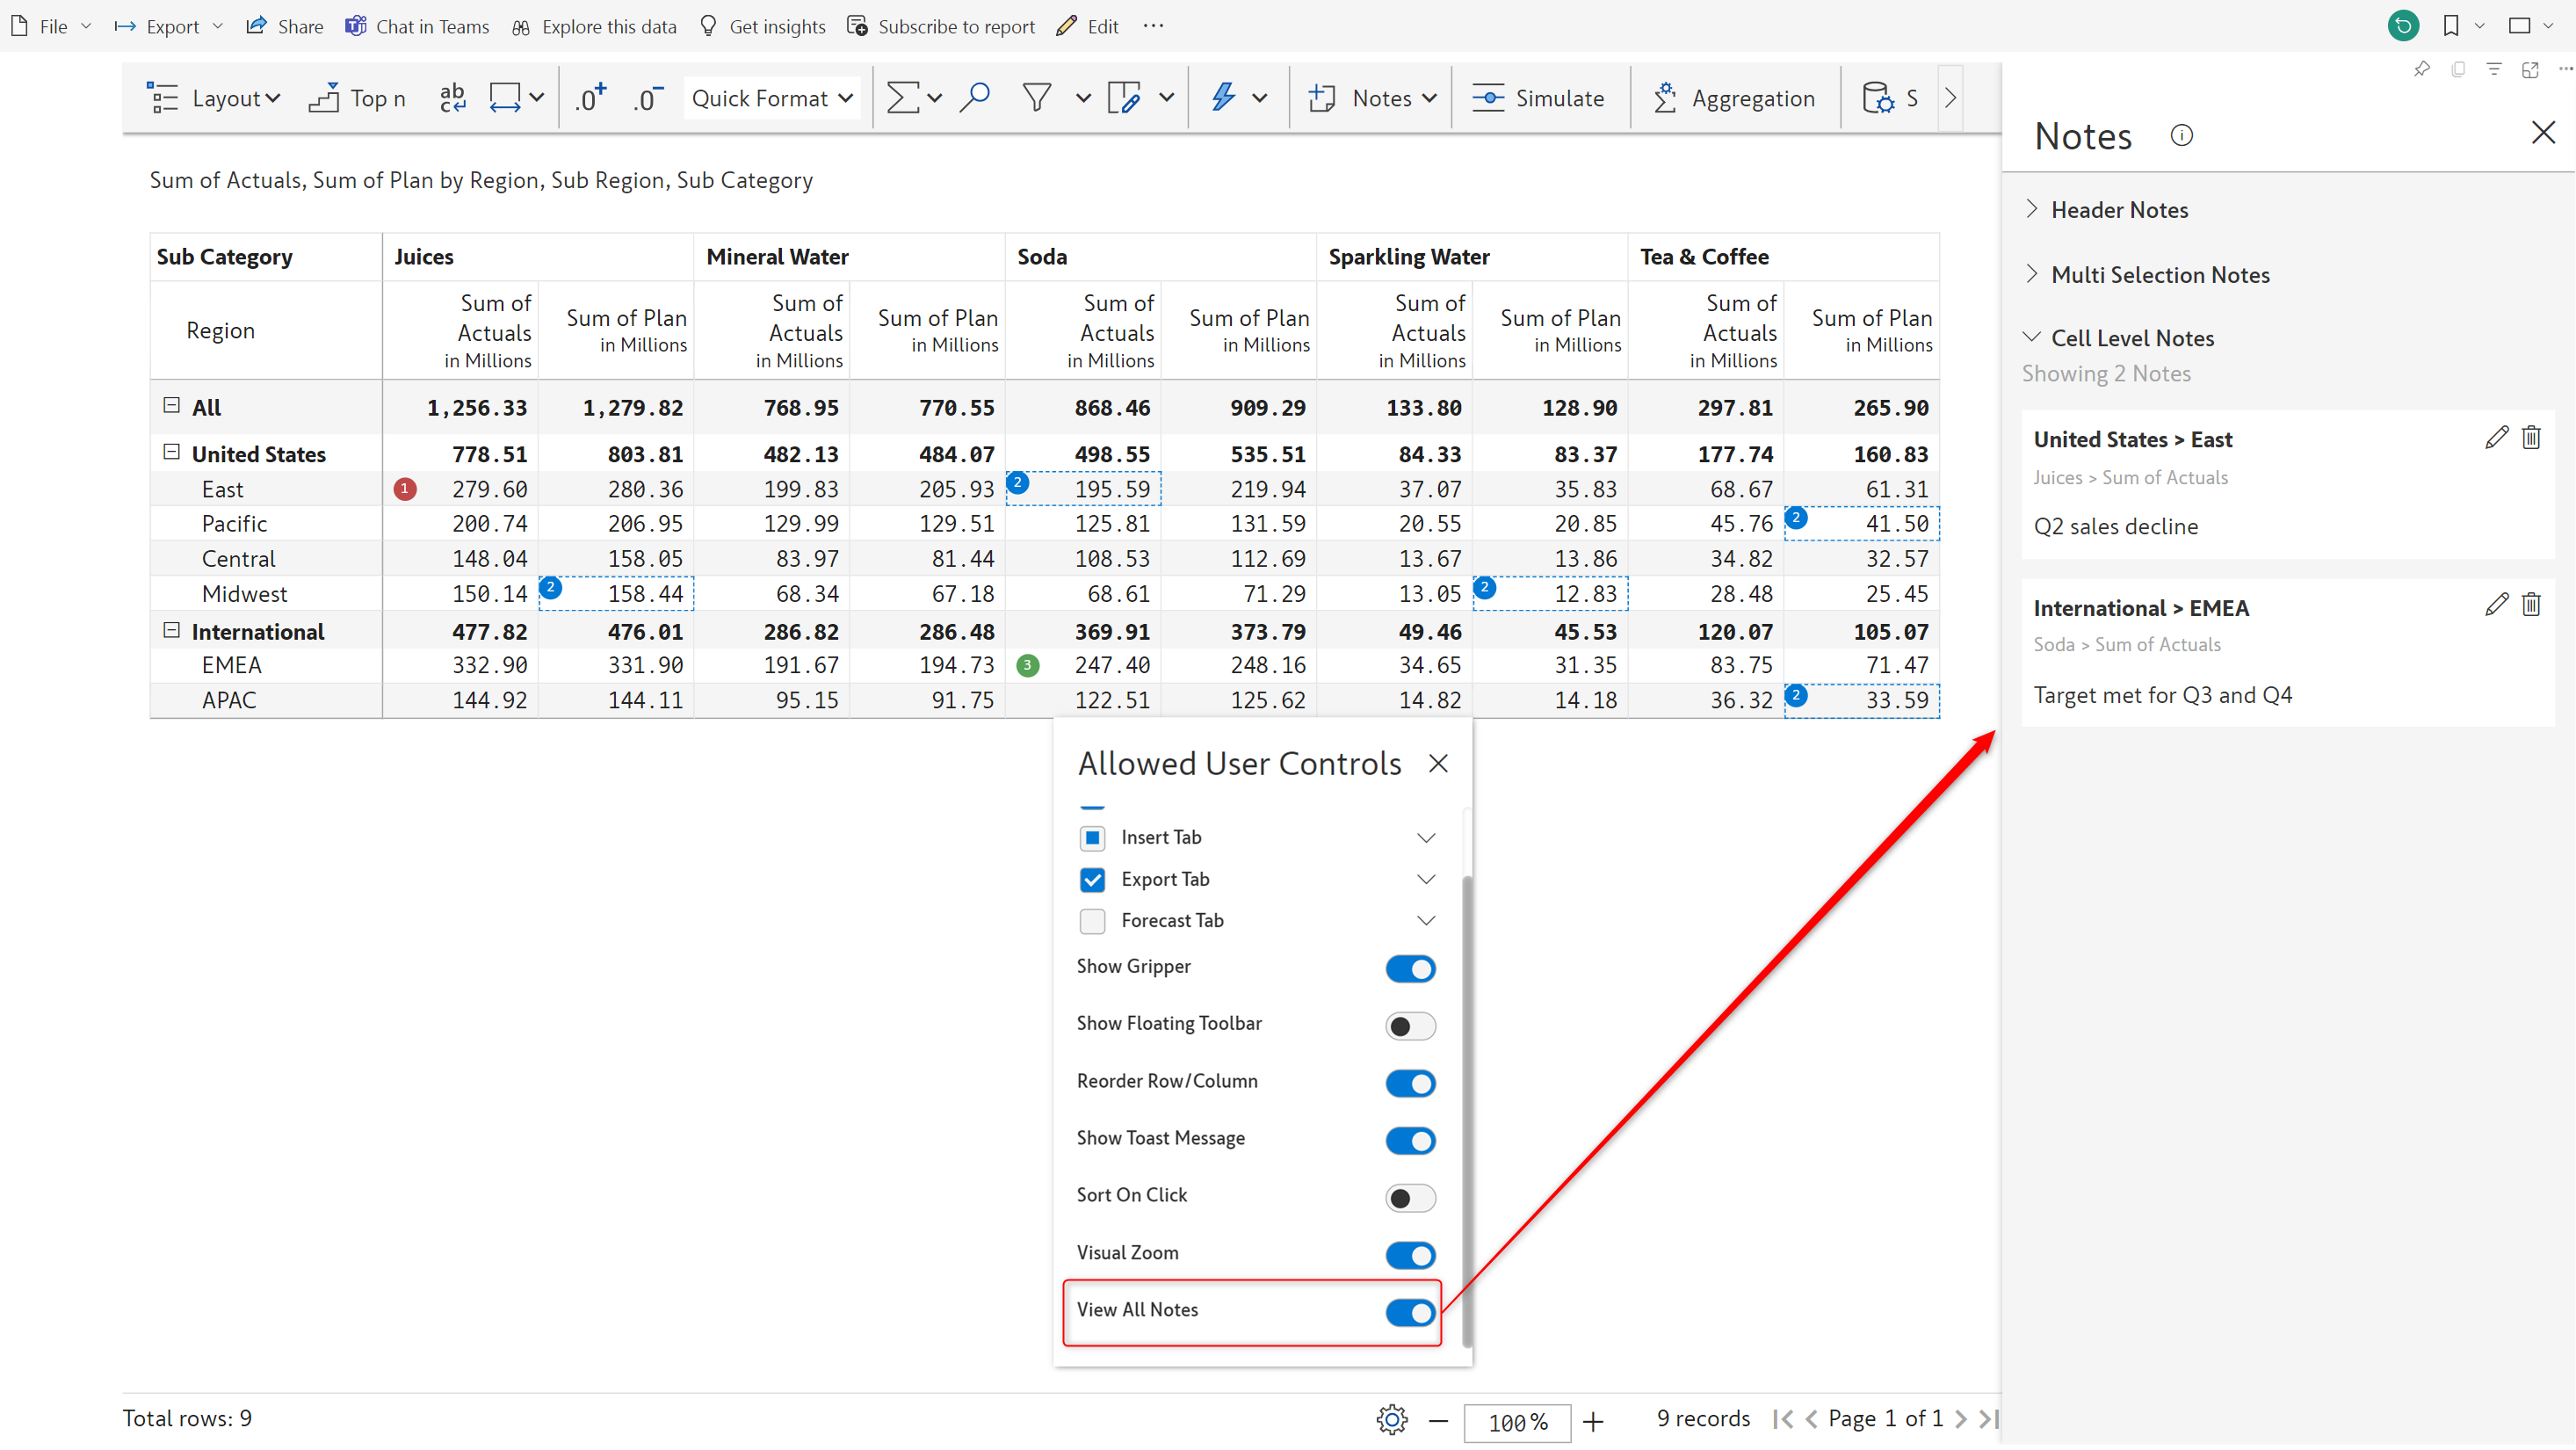
Report users can now view all the notes added to a report in a single, consolidated window. The Allowed User Controls setting has a new option to display the notes side pane by default in the reading view.
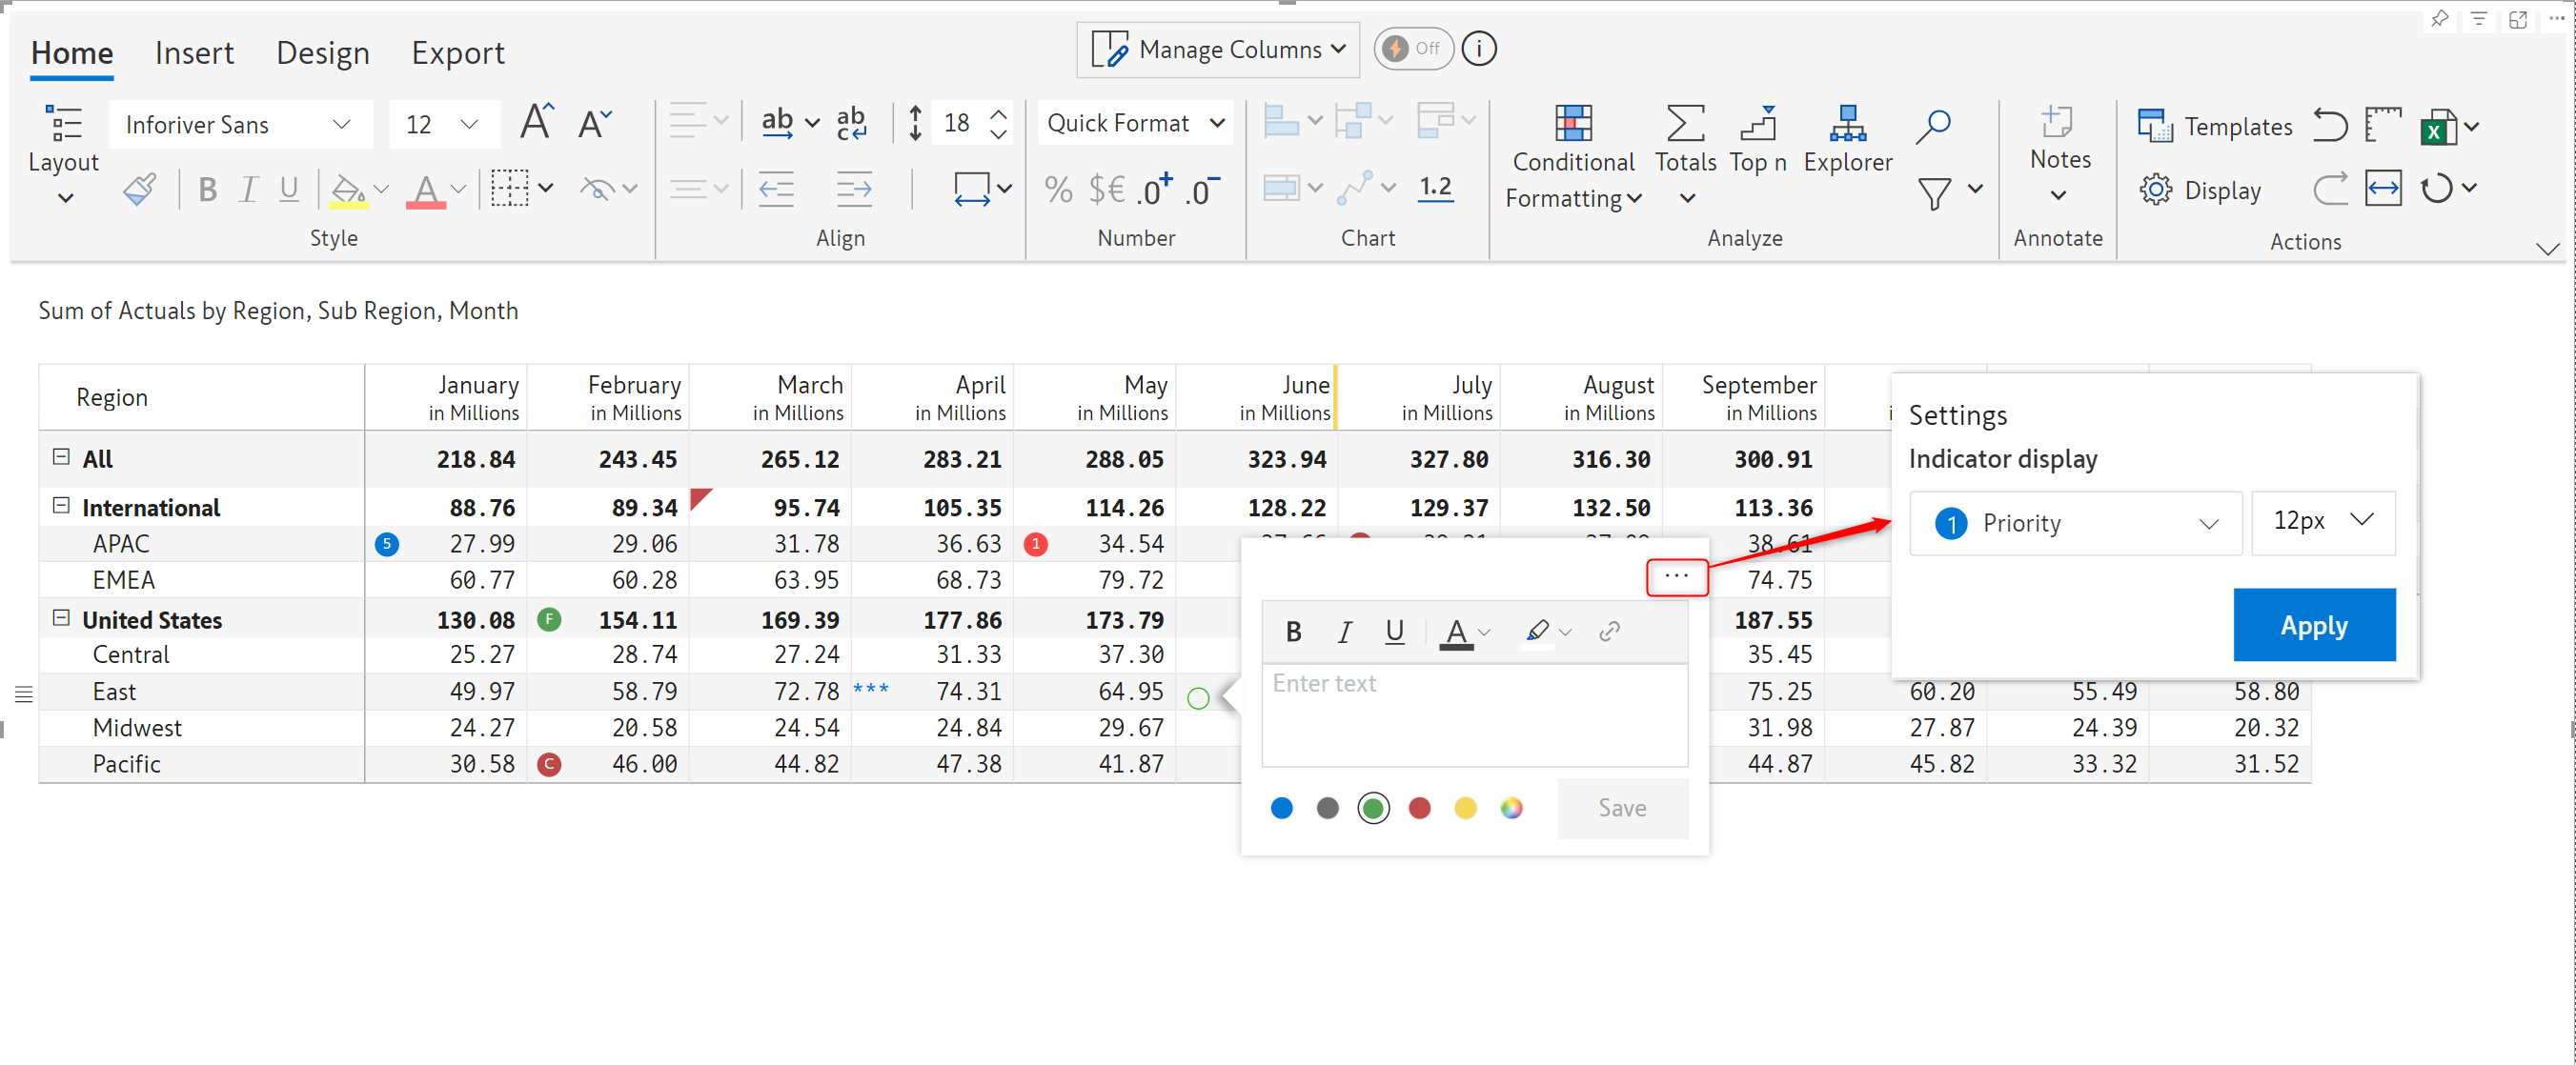
With Inforiver, you can even customize the notes indicator – you can use numbering, arrows, task indicators, etc. In earlier versions, the notes indicator could only be set at the report level, and all notes in a report would have the same indicator. With the February release, you can visually classify notes by setting individual indicators for each note.
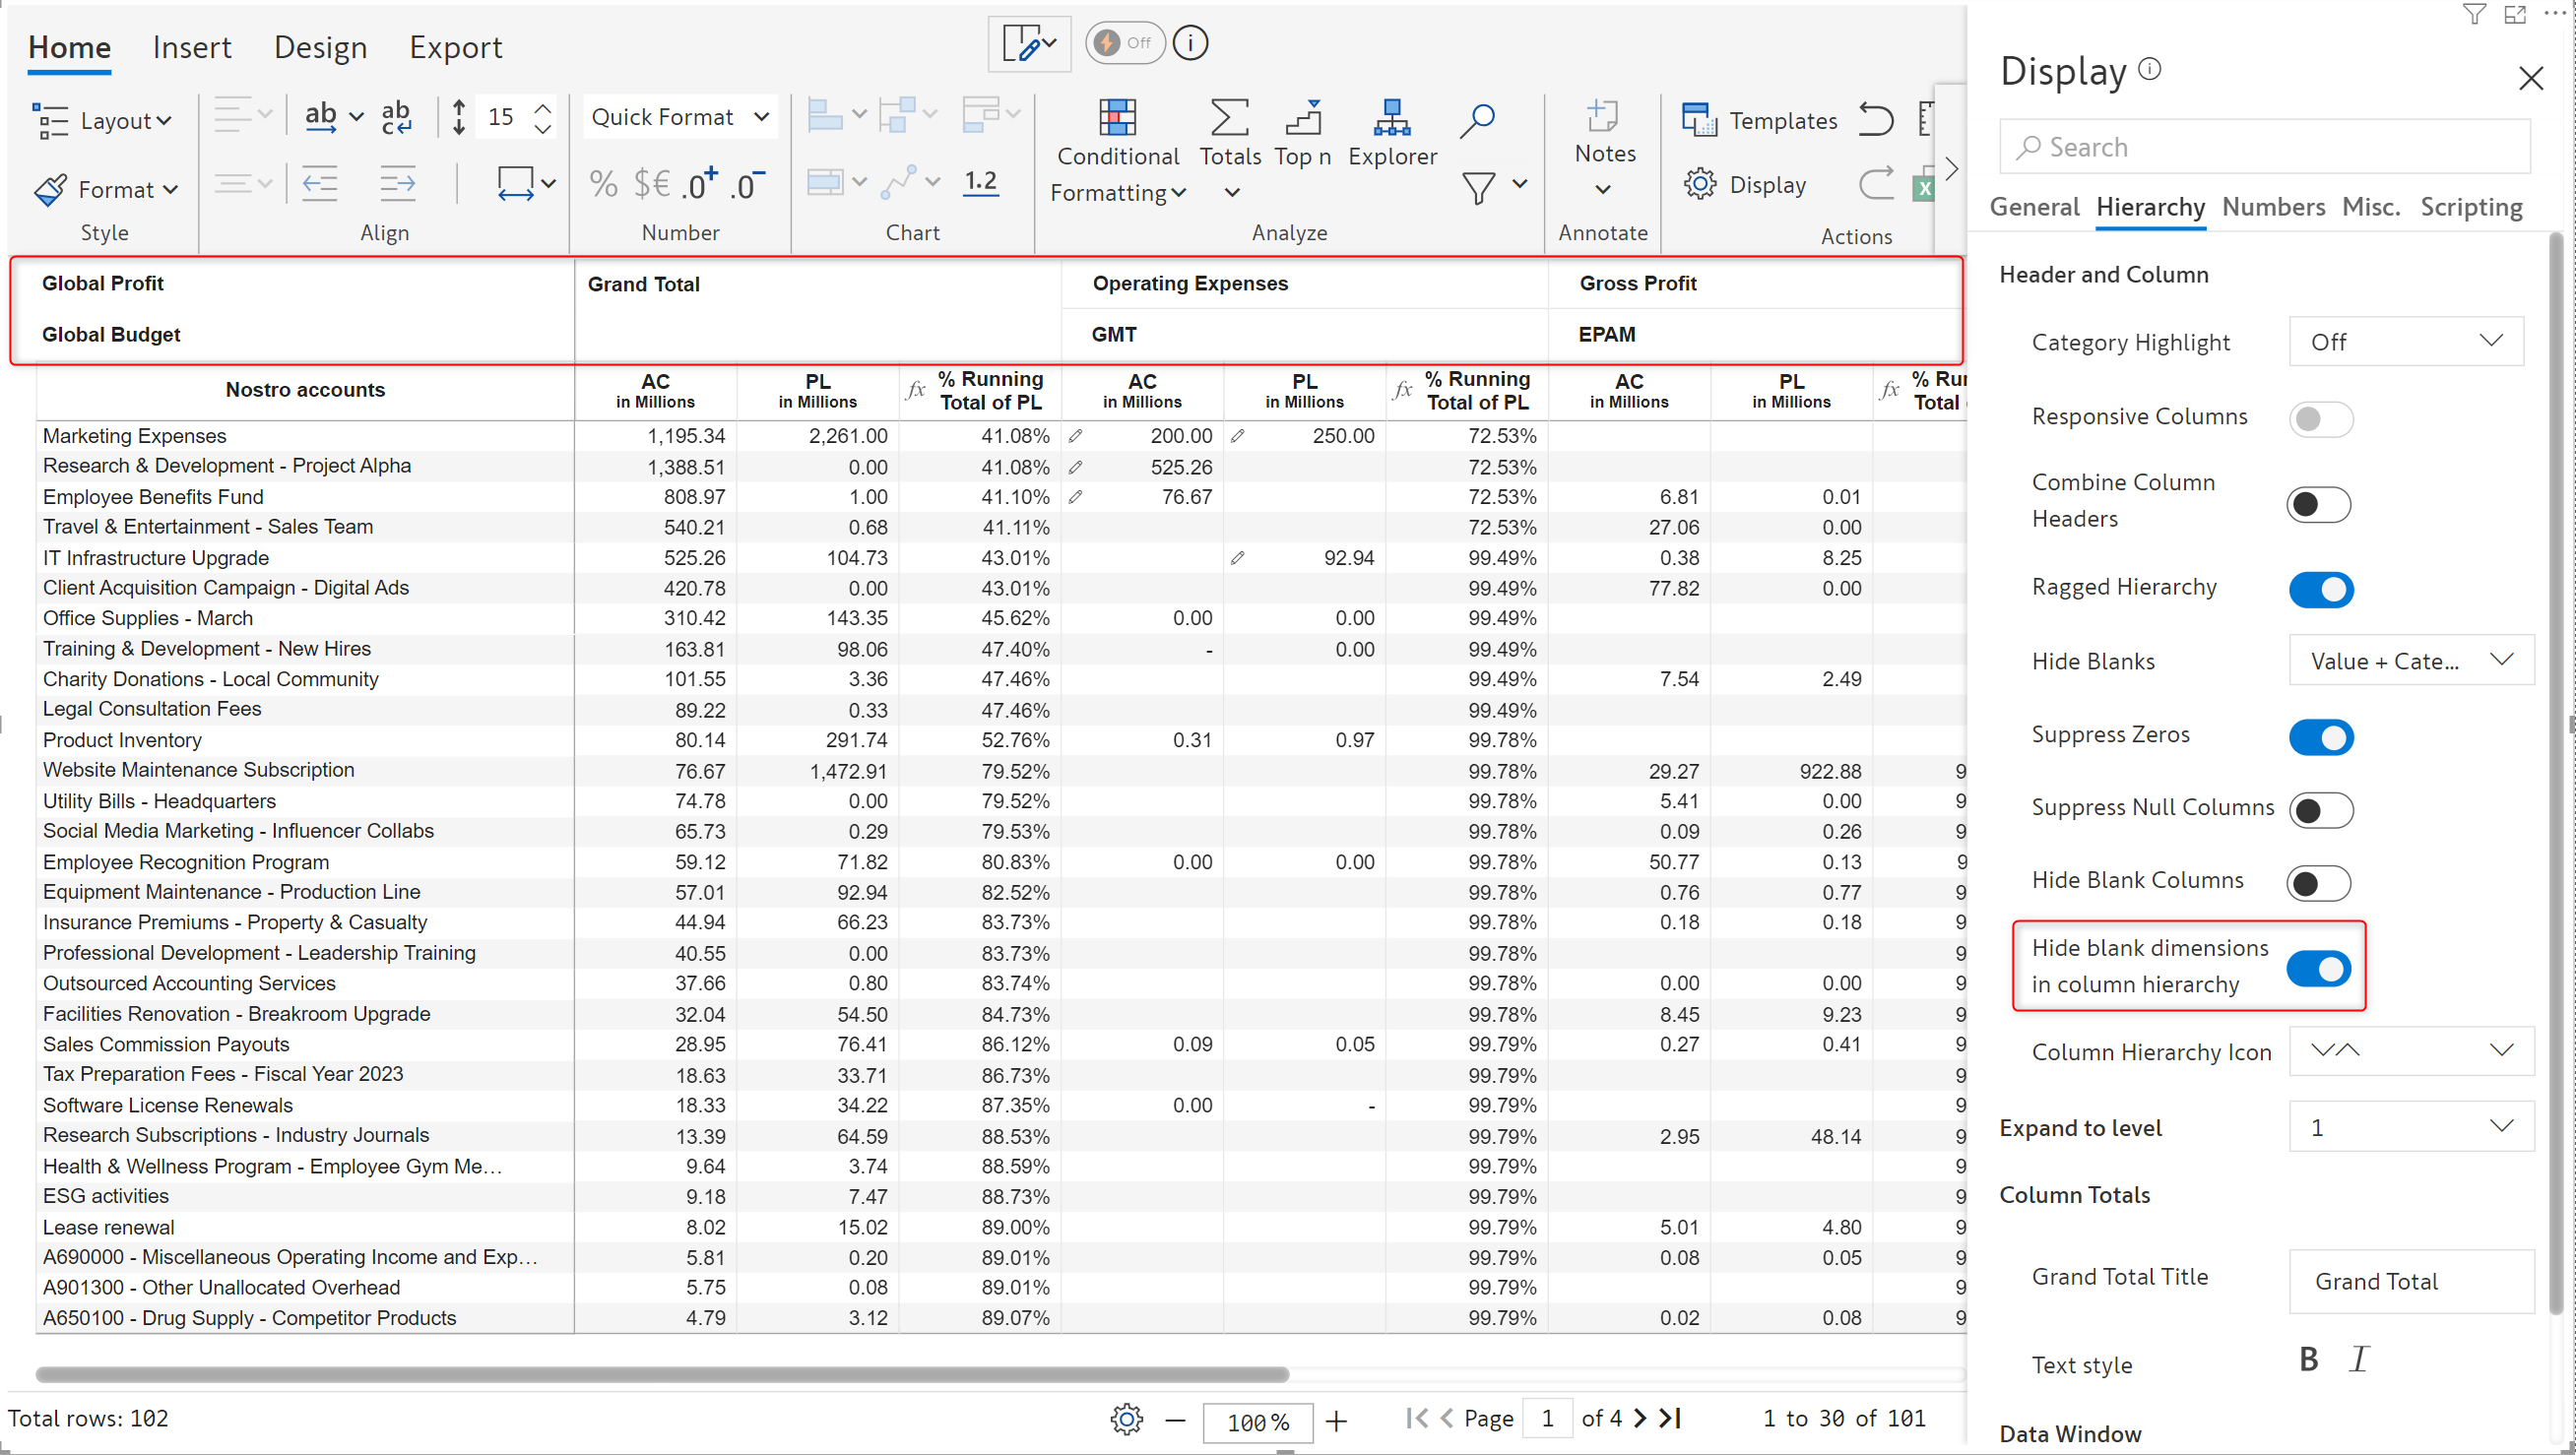
When you have hierarchical column dimensions, there may be cases where the entire dimension category is blank, as shown in the report below.
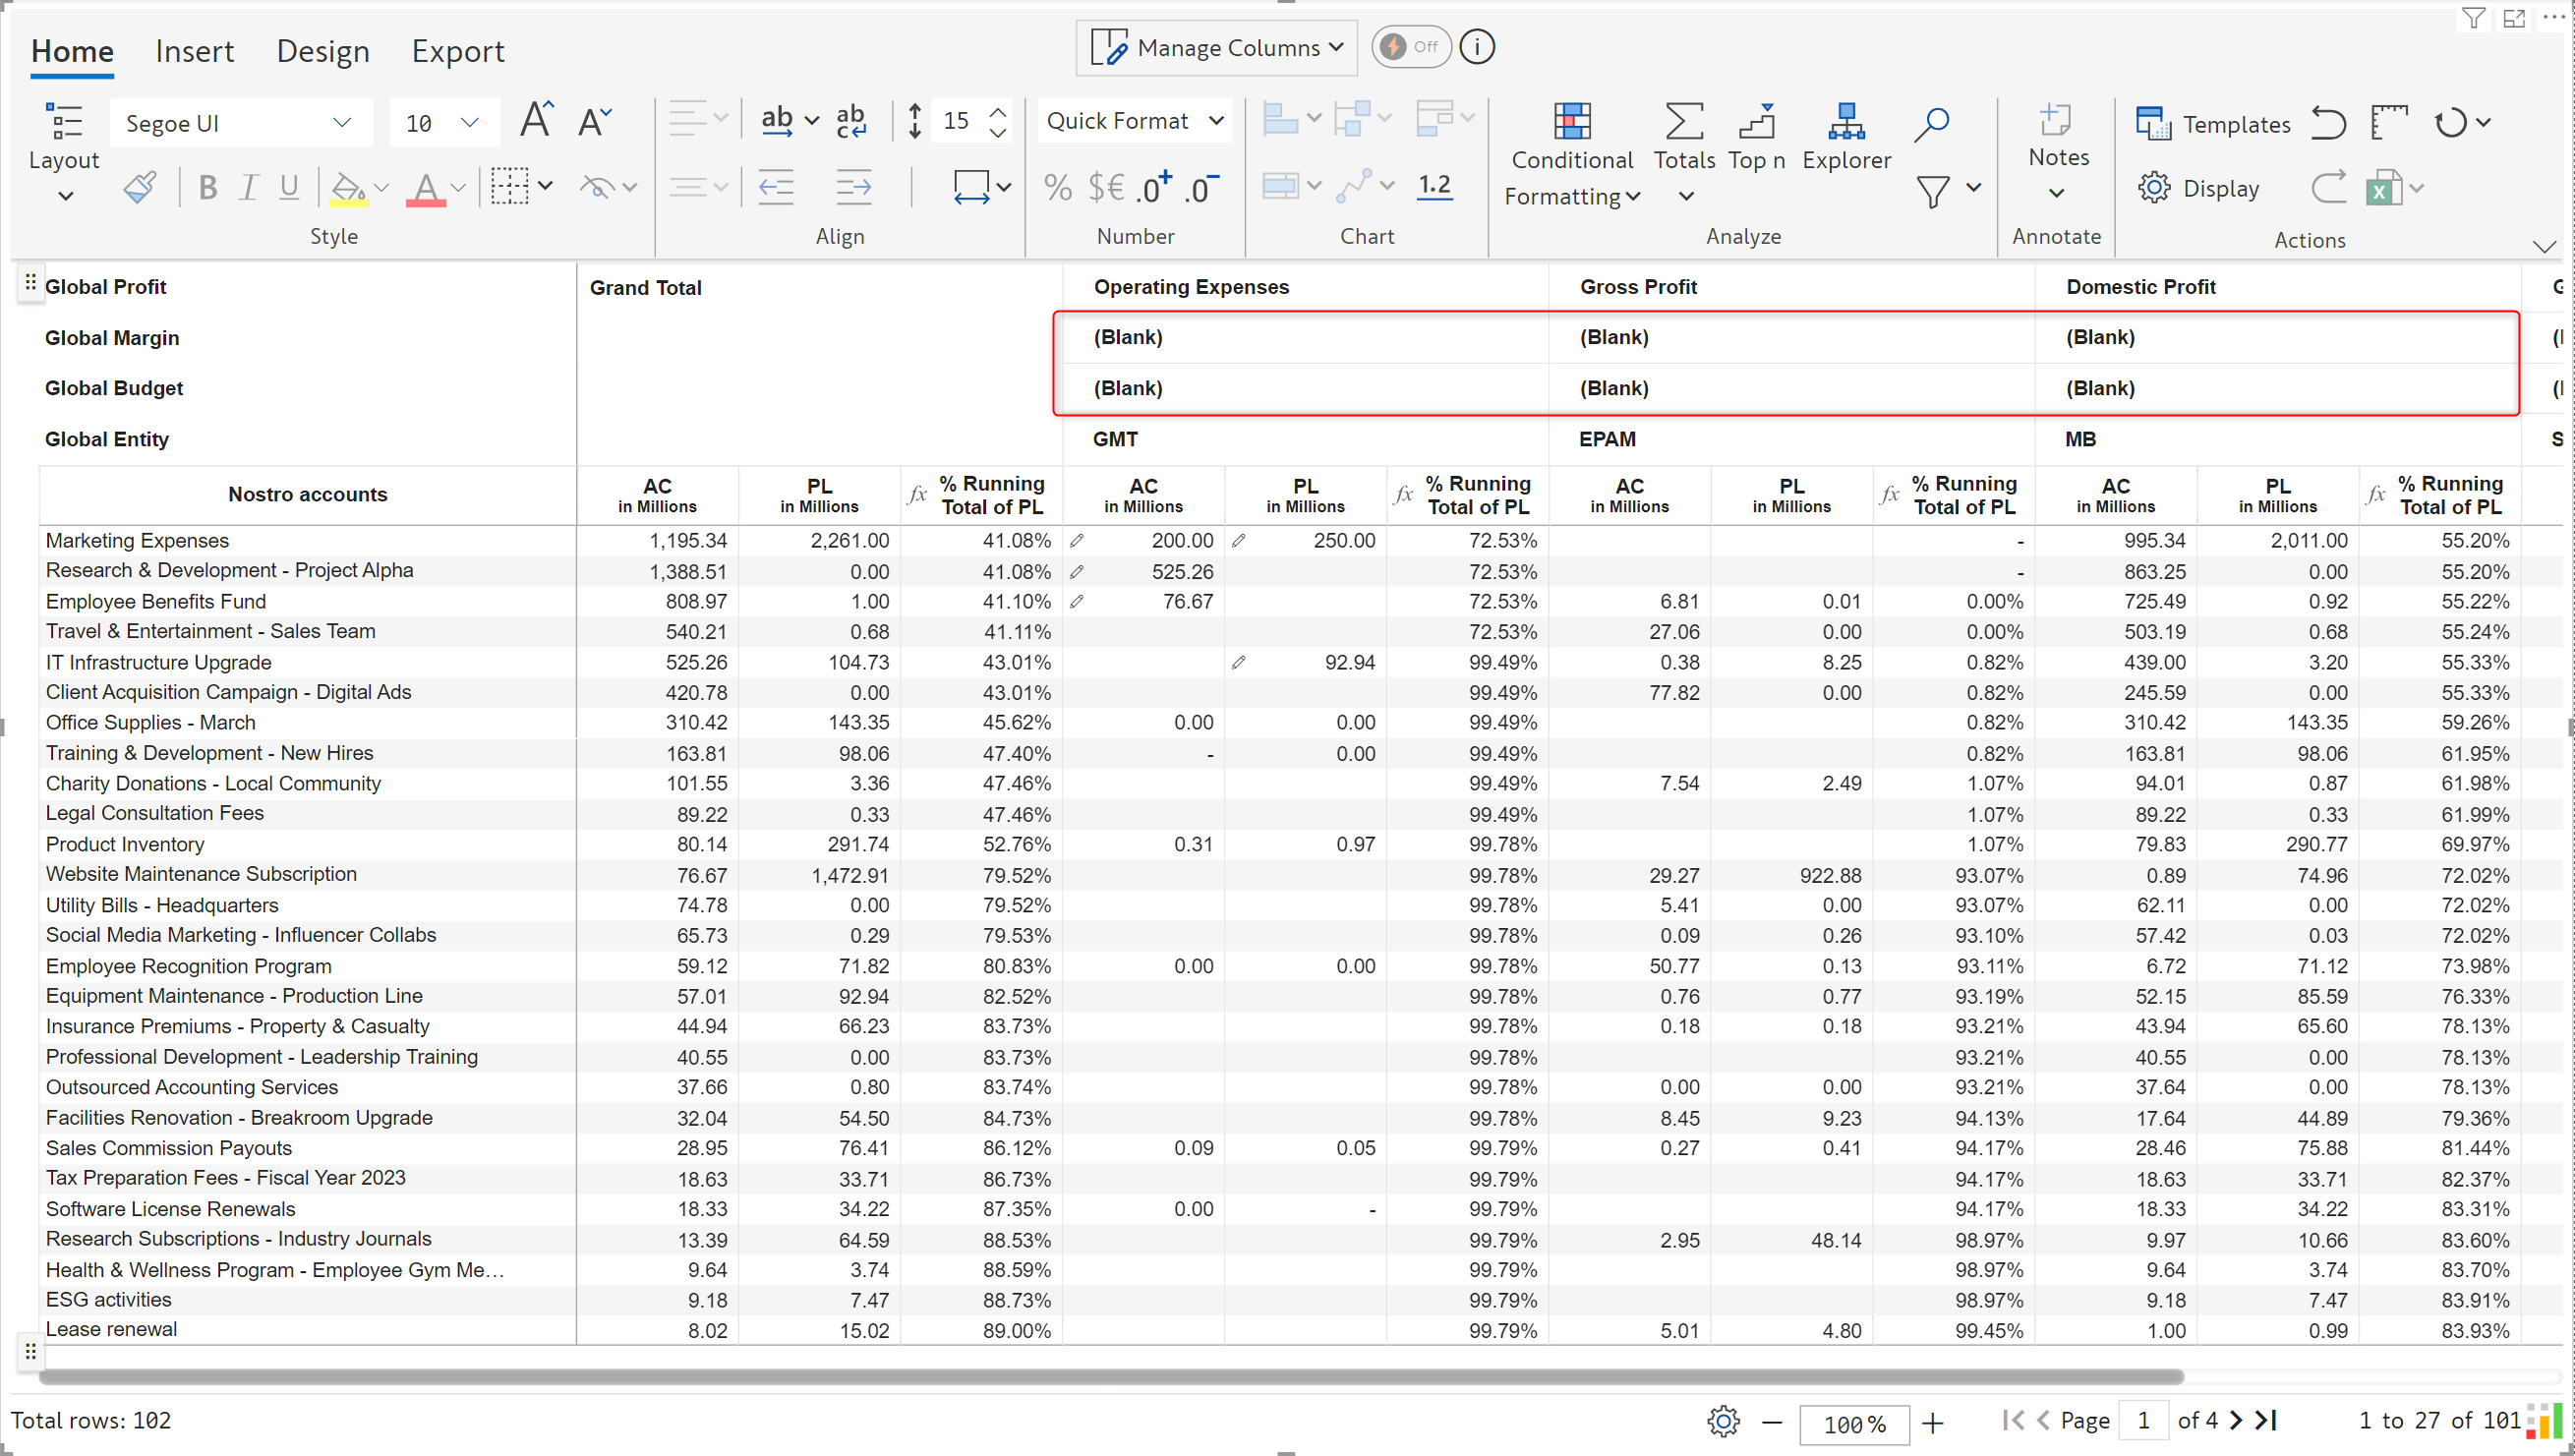
Since these categories do not add value to the report, you can suppress them by enabling the Hide blank dimensions in column hierarchy option.
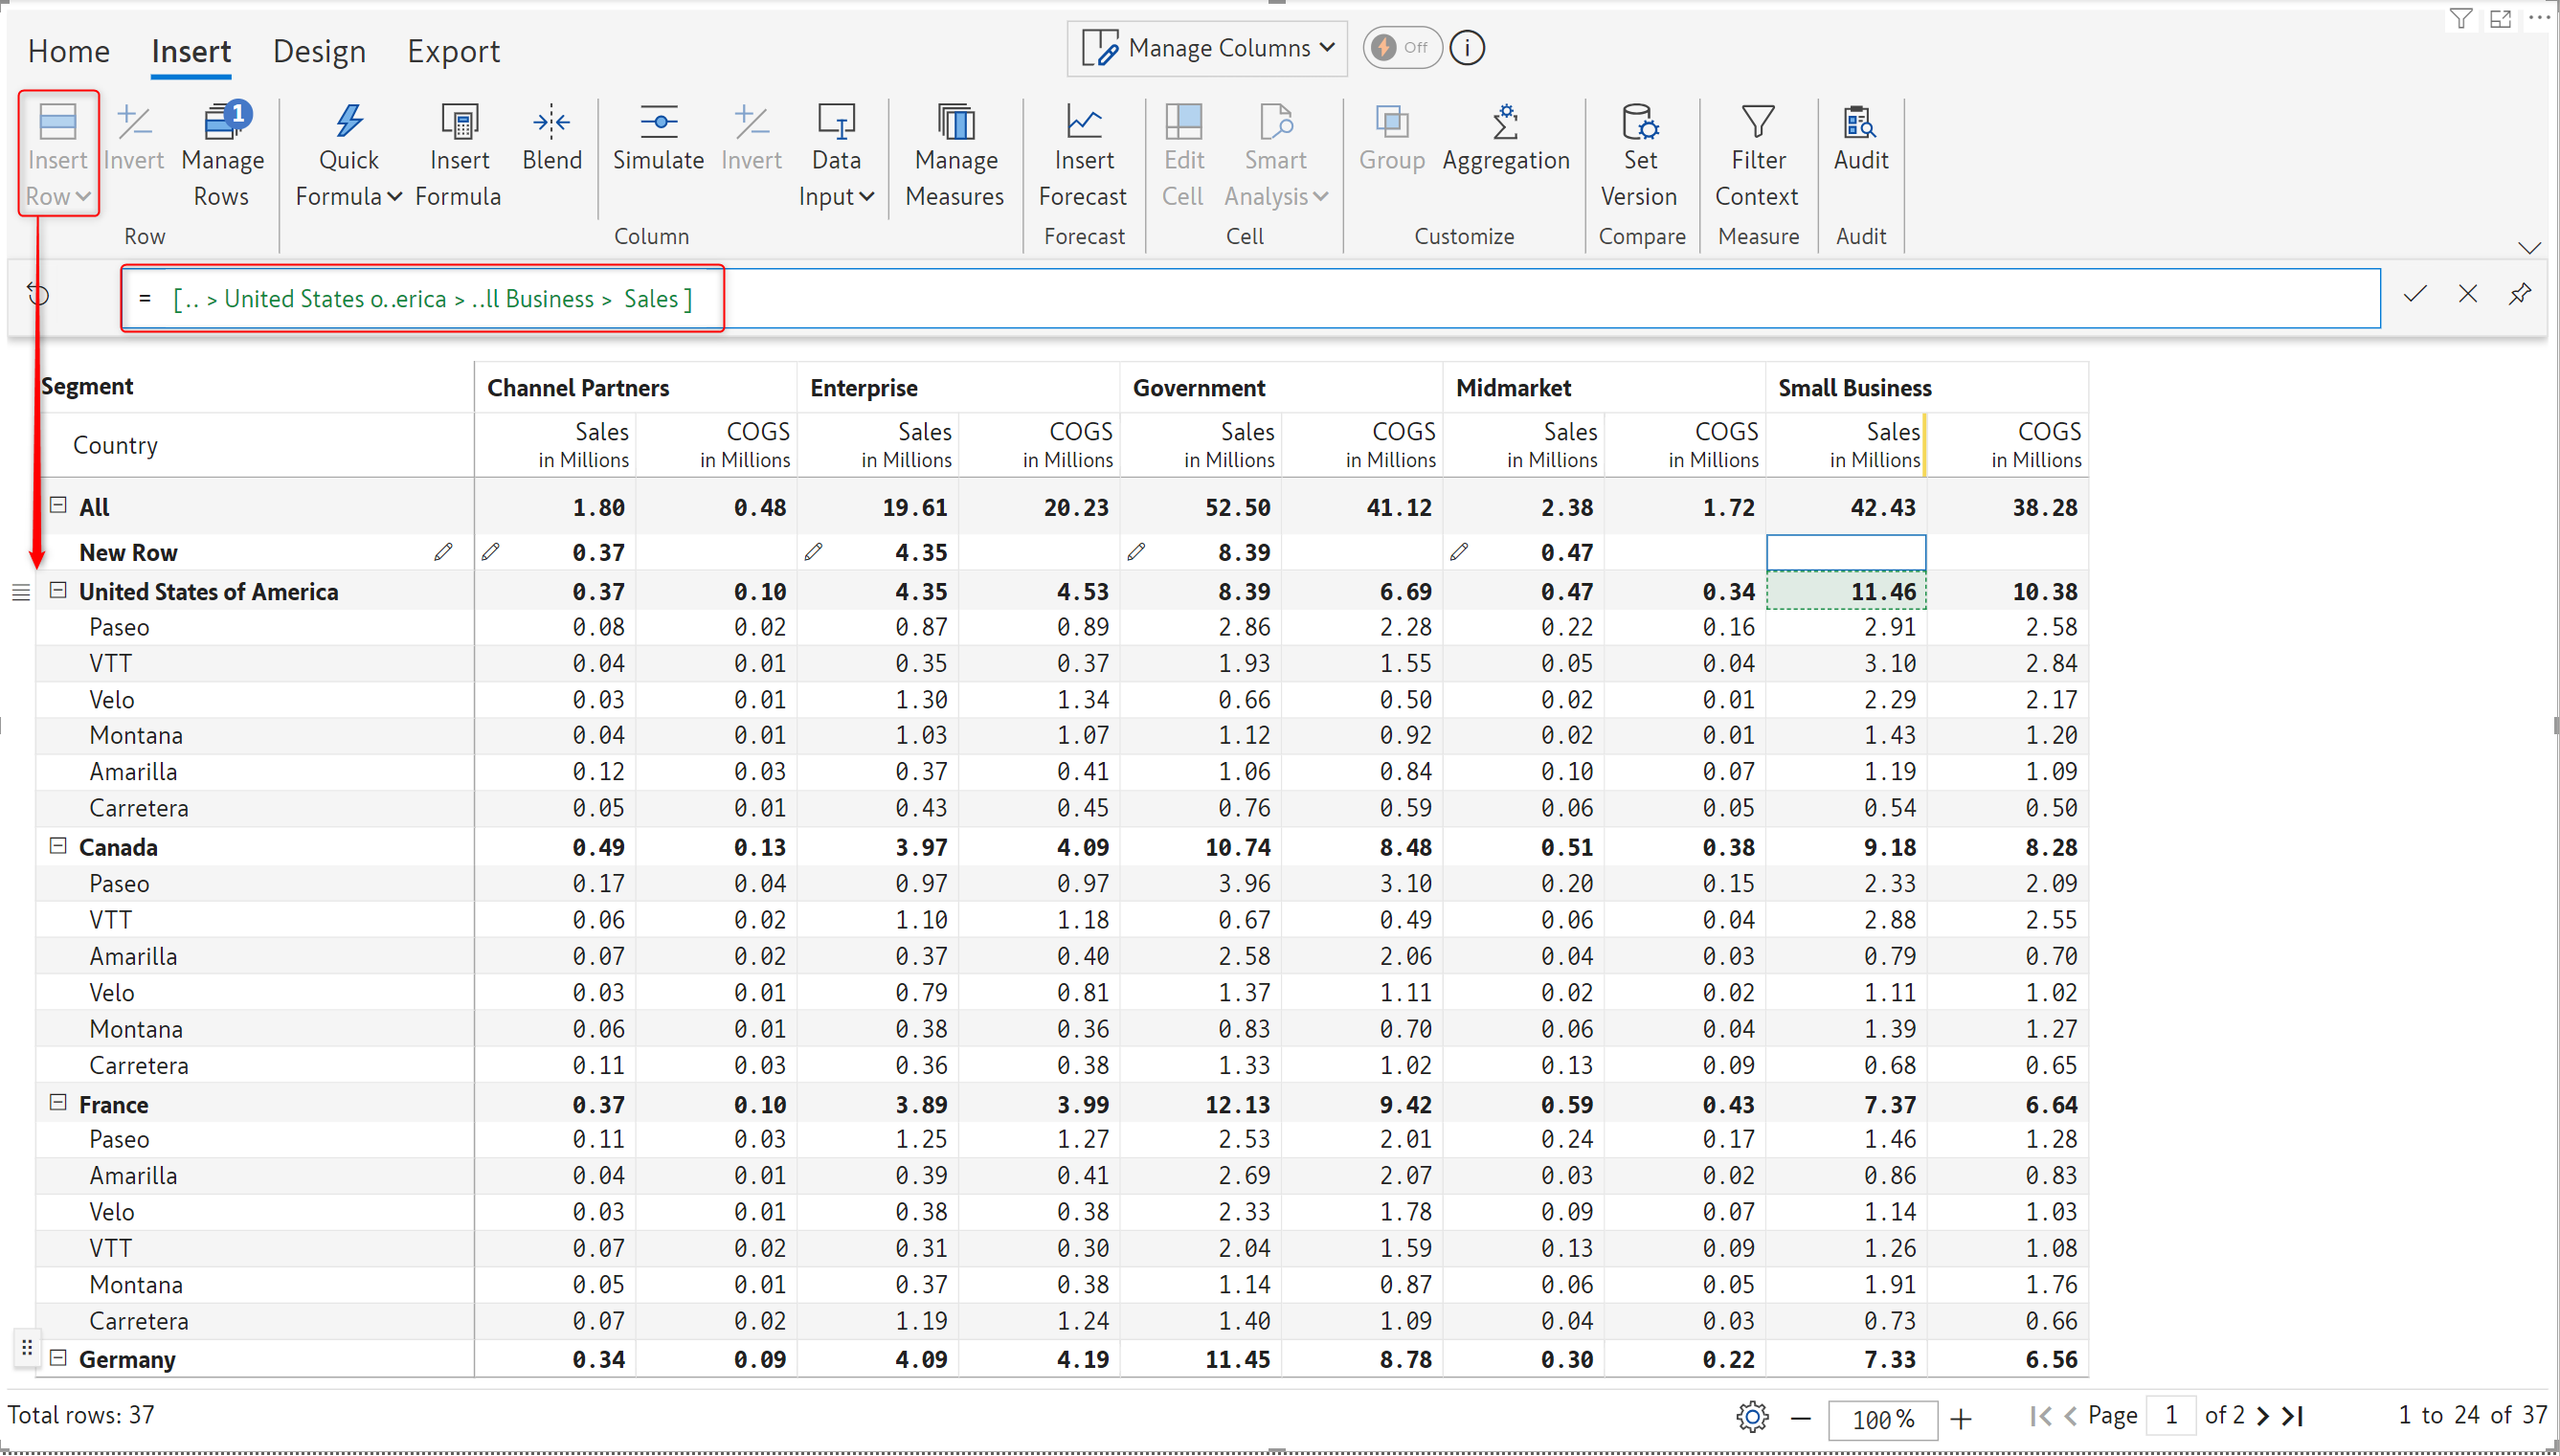
In Inforiver reports, you can reference values from other rows while inserting a row or a hierarchy. In earlier versions, visual rows would be visible to all the users irrespective of RLS permissions. For example, in the visual below, a manager handling Canada accounts would still be able to view the new row that references US data.
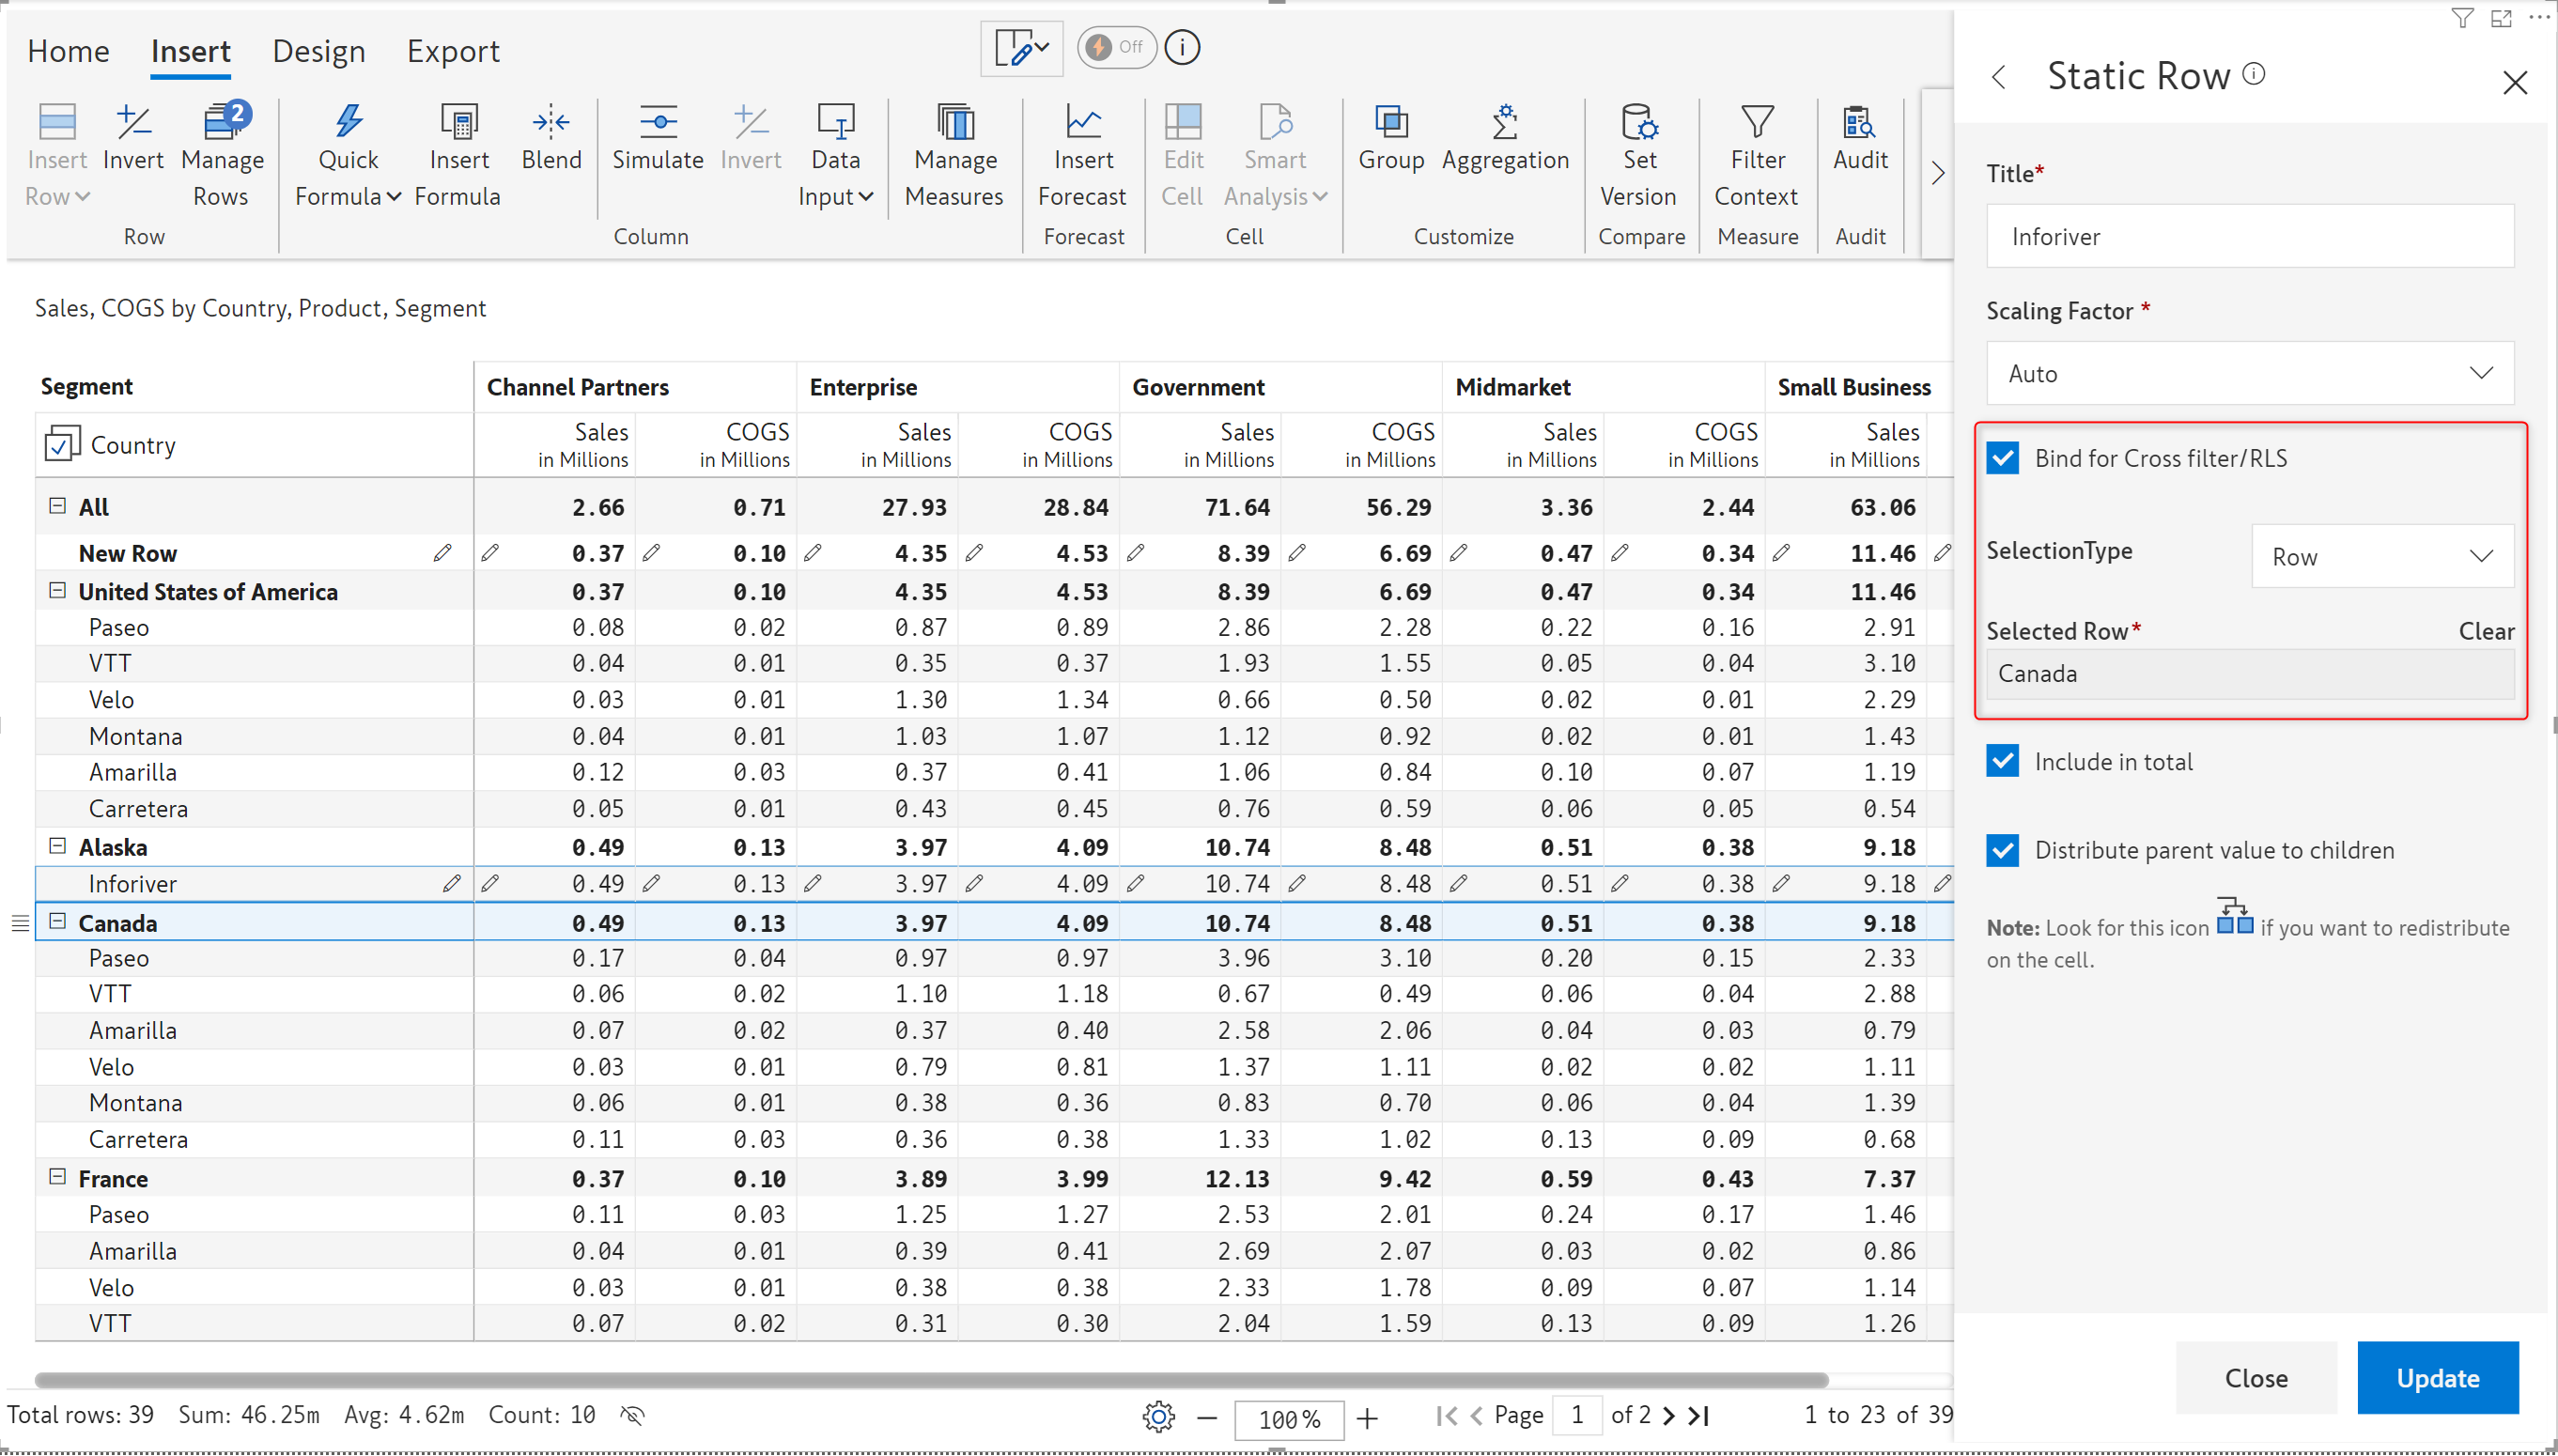
You can now enable the Bind for Cross filter/RLS option – this will ensure that cross filter selections and RLS settings apply to visual rows that reference other rows. You can bind inserted rows by selecting a reference row or a dimension category.
In the example below, the Alaska>Inforiver hierarchy references the Cananda row.
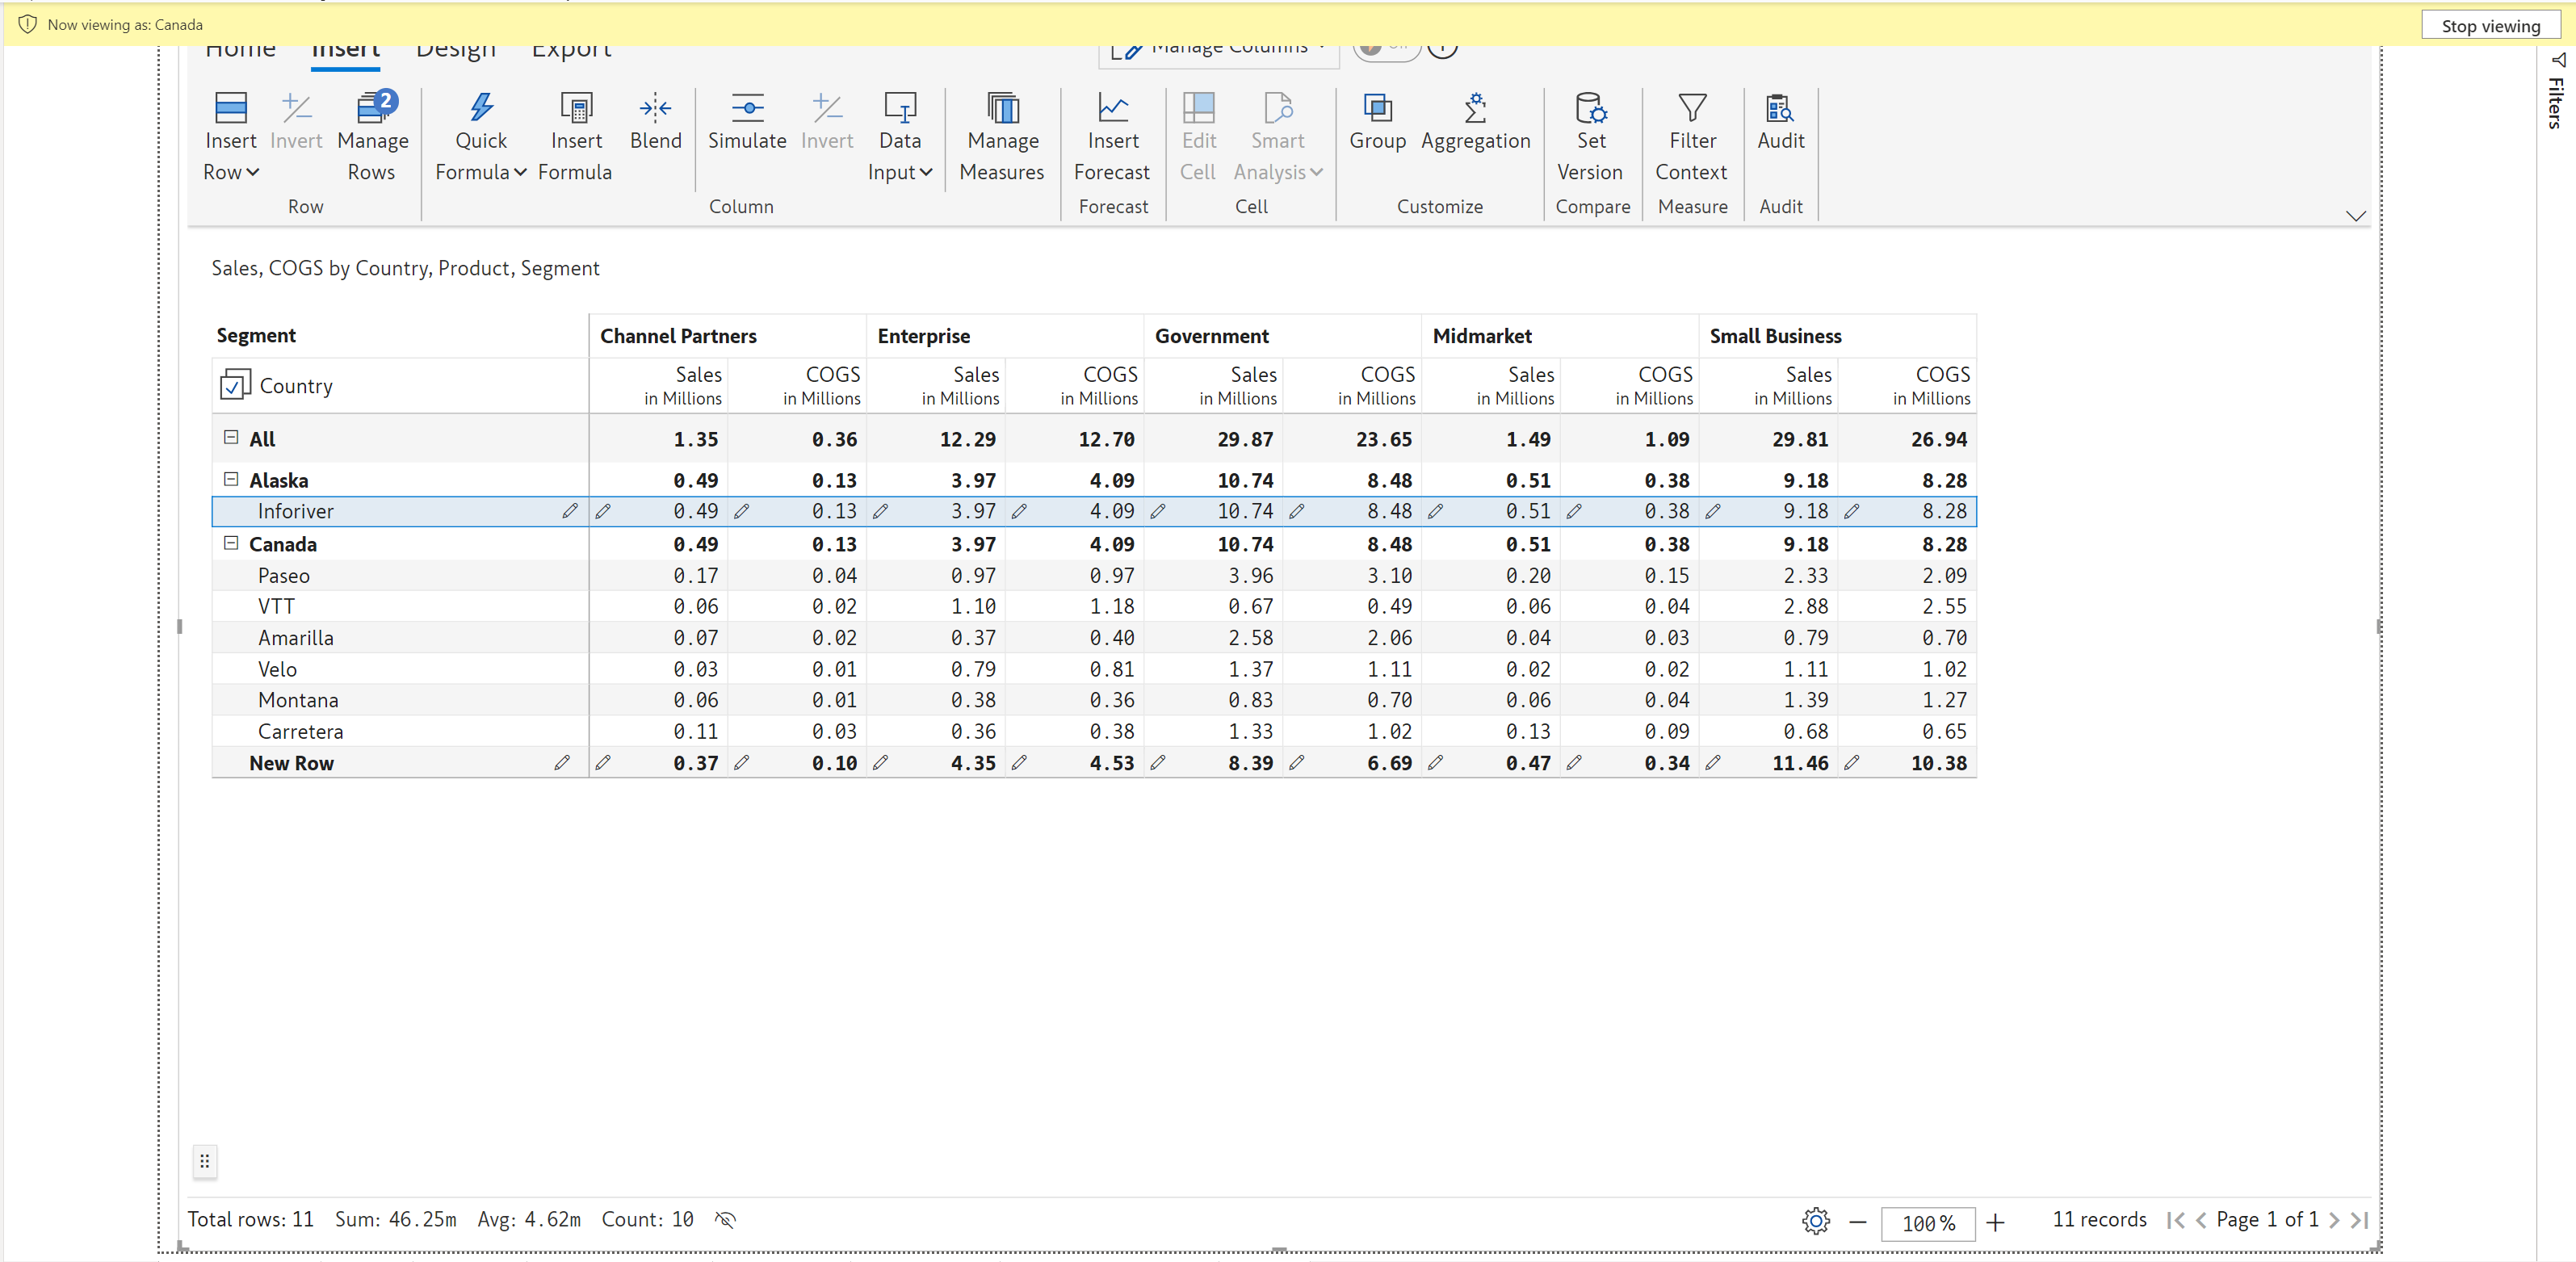
The Alaska hierarchy is displayed for users with RLS access to Canada data only.
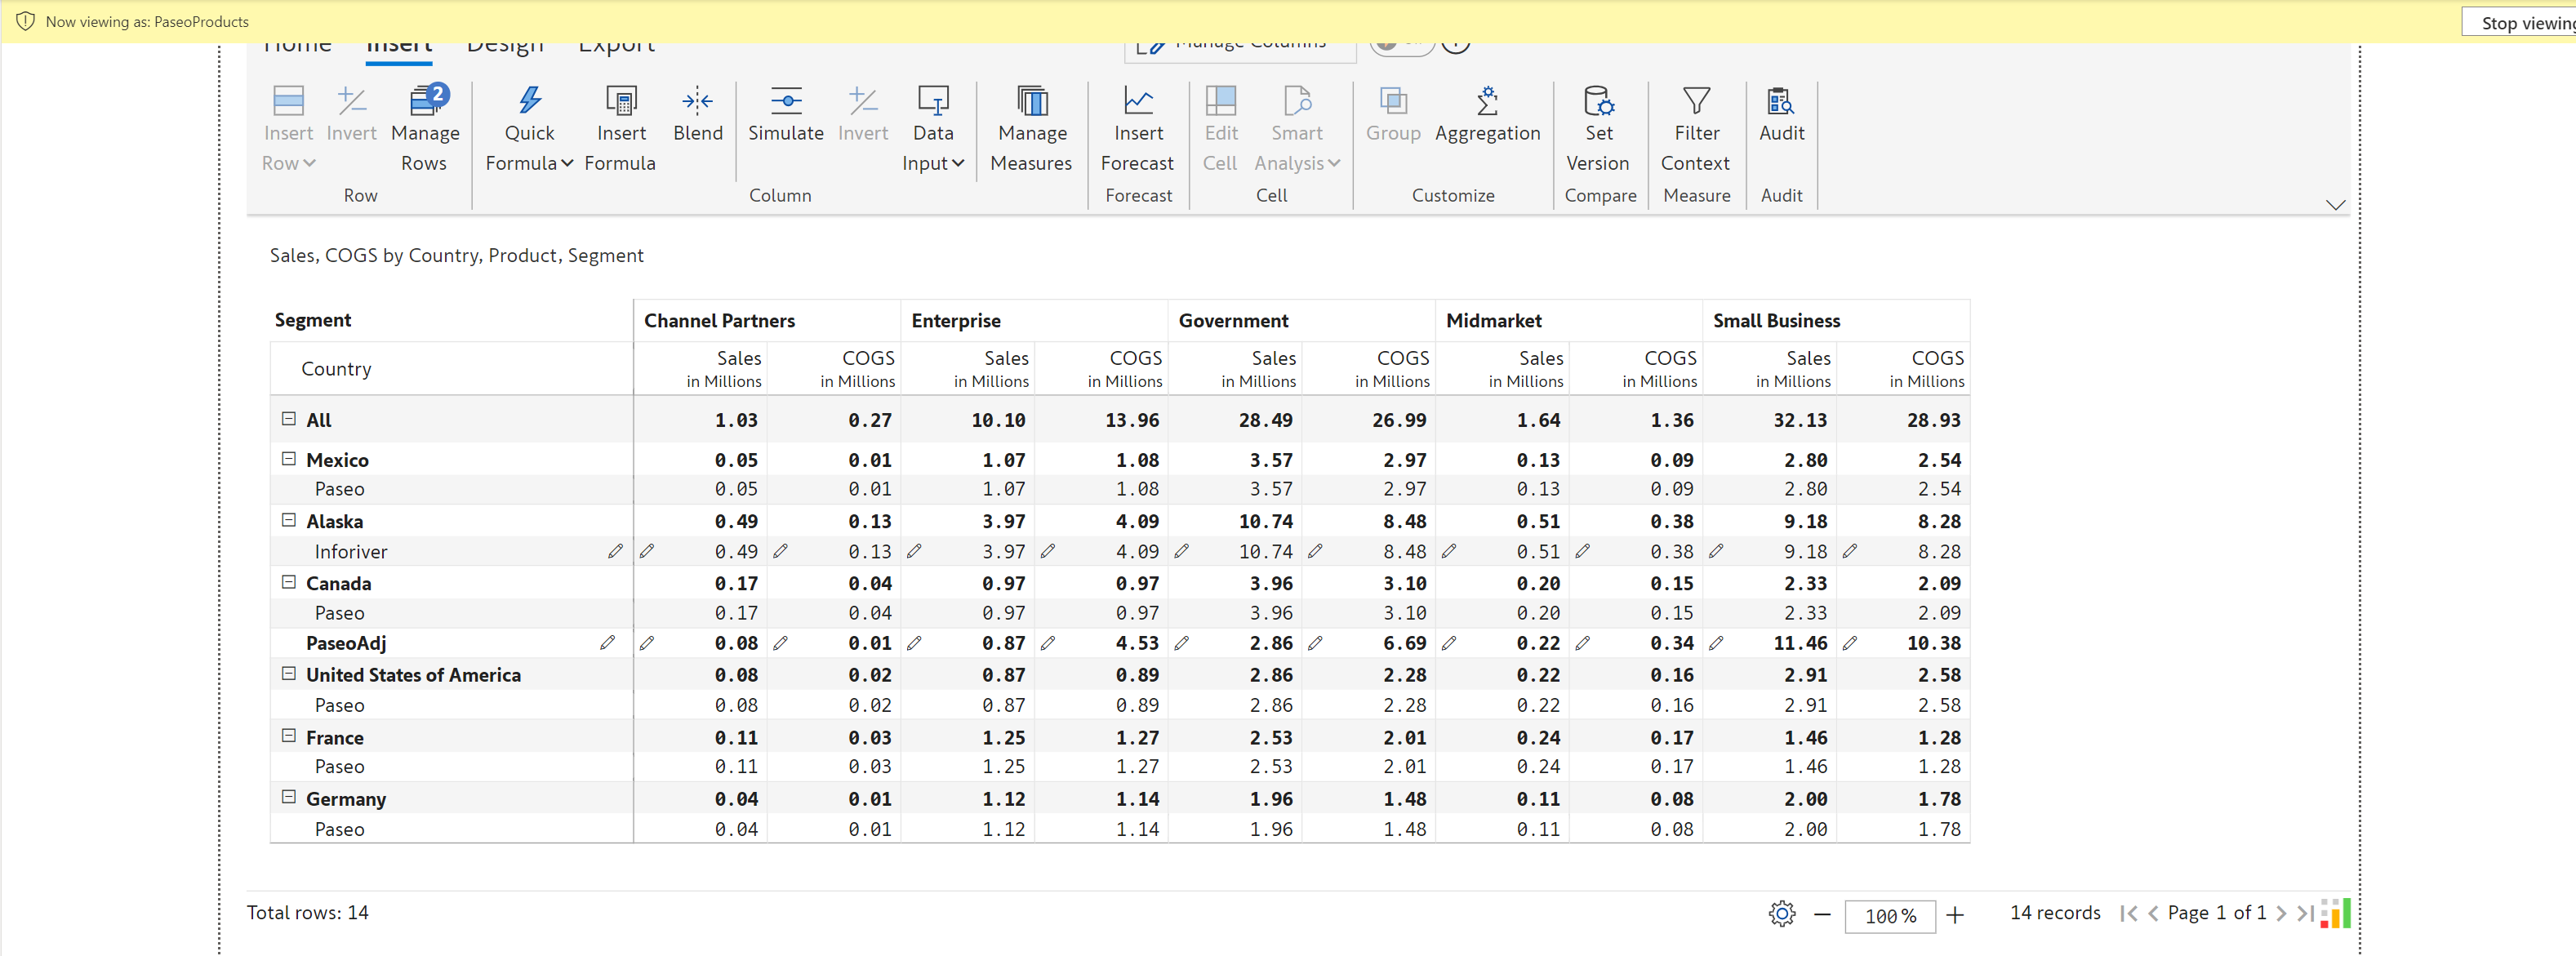
In the example below, the Paseo adjustment row references the Paseo product.
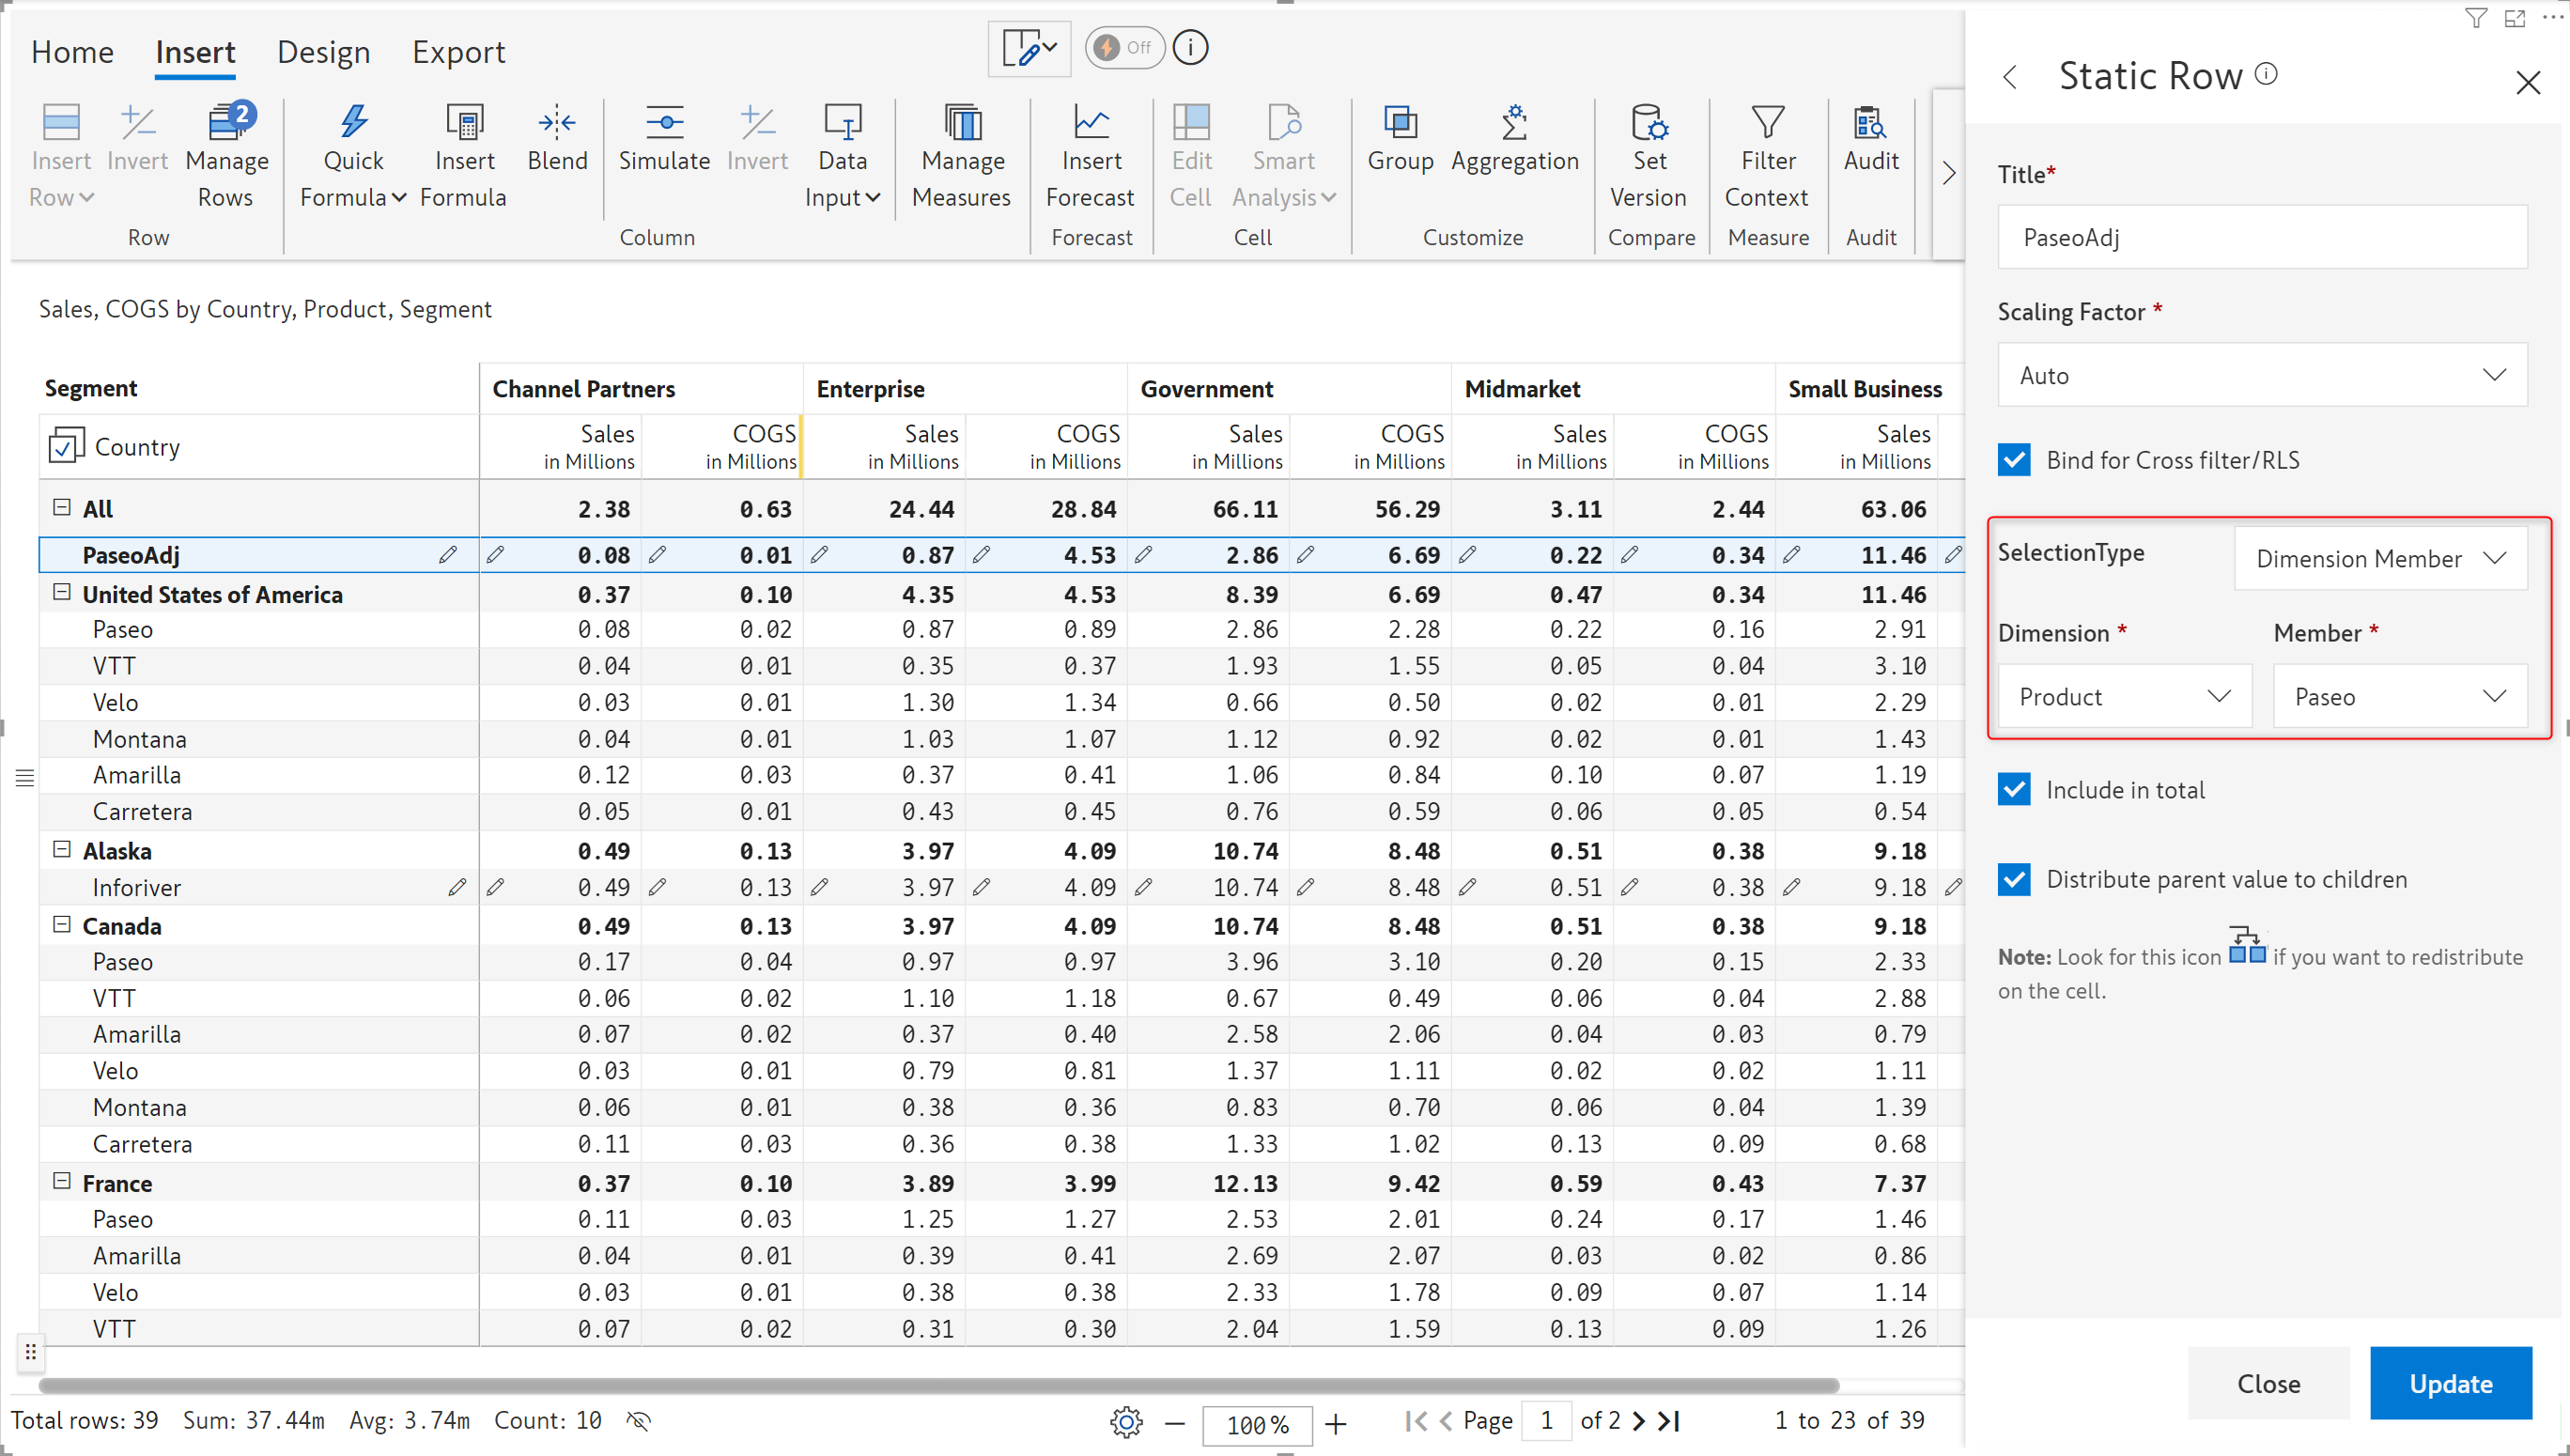
Notice how the adjustment row is displayed for users with access to Paseo products.
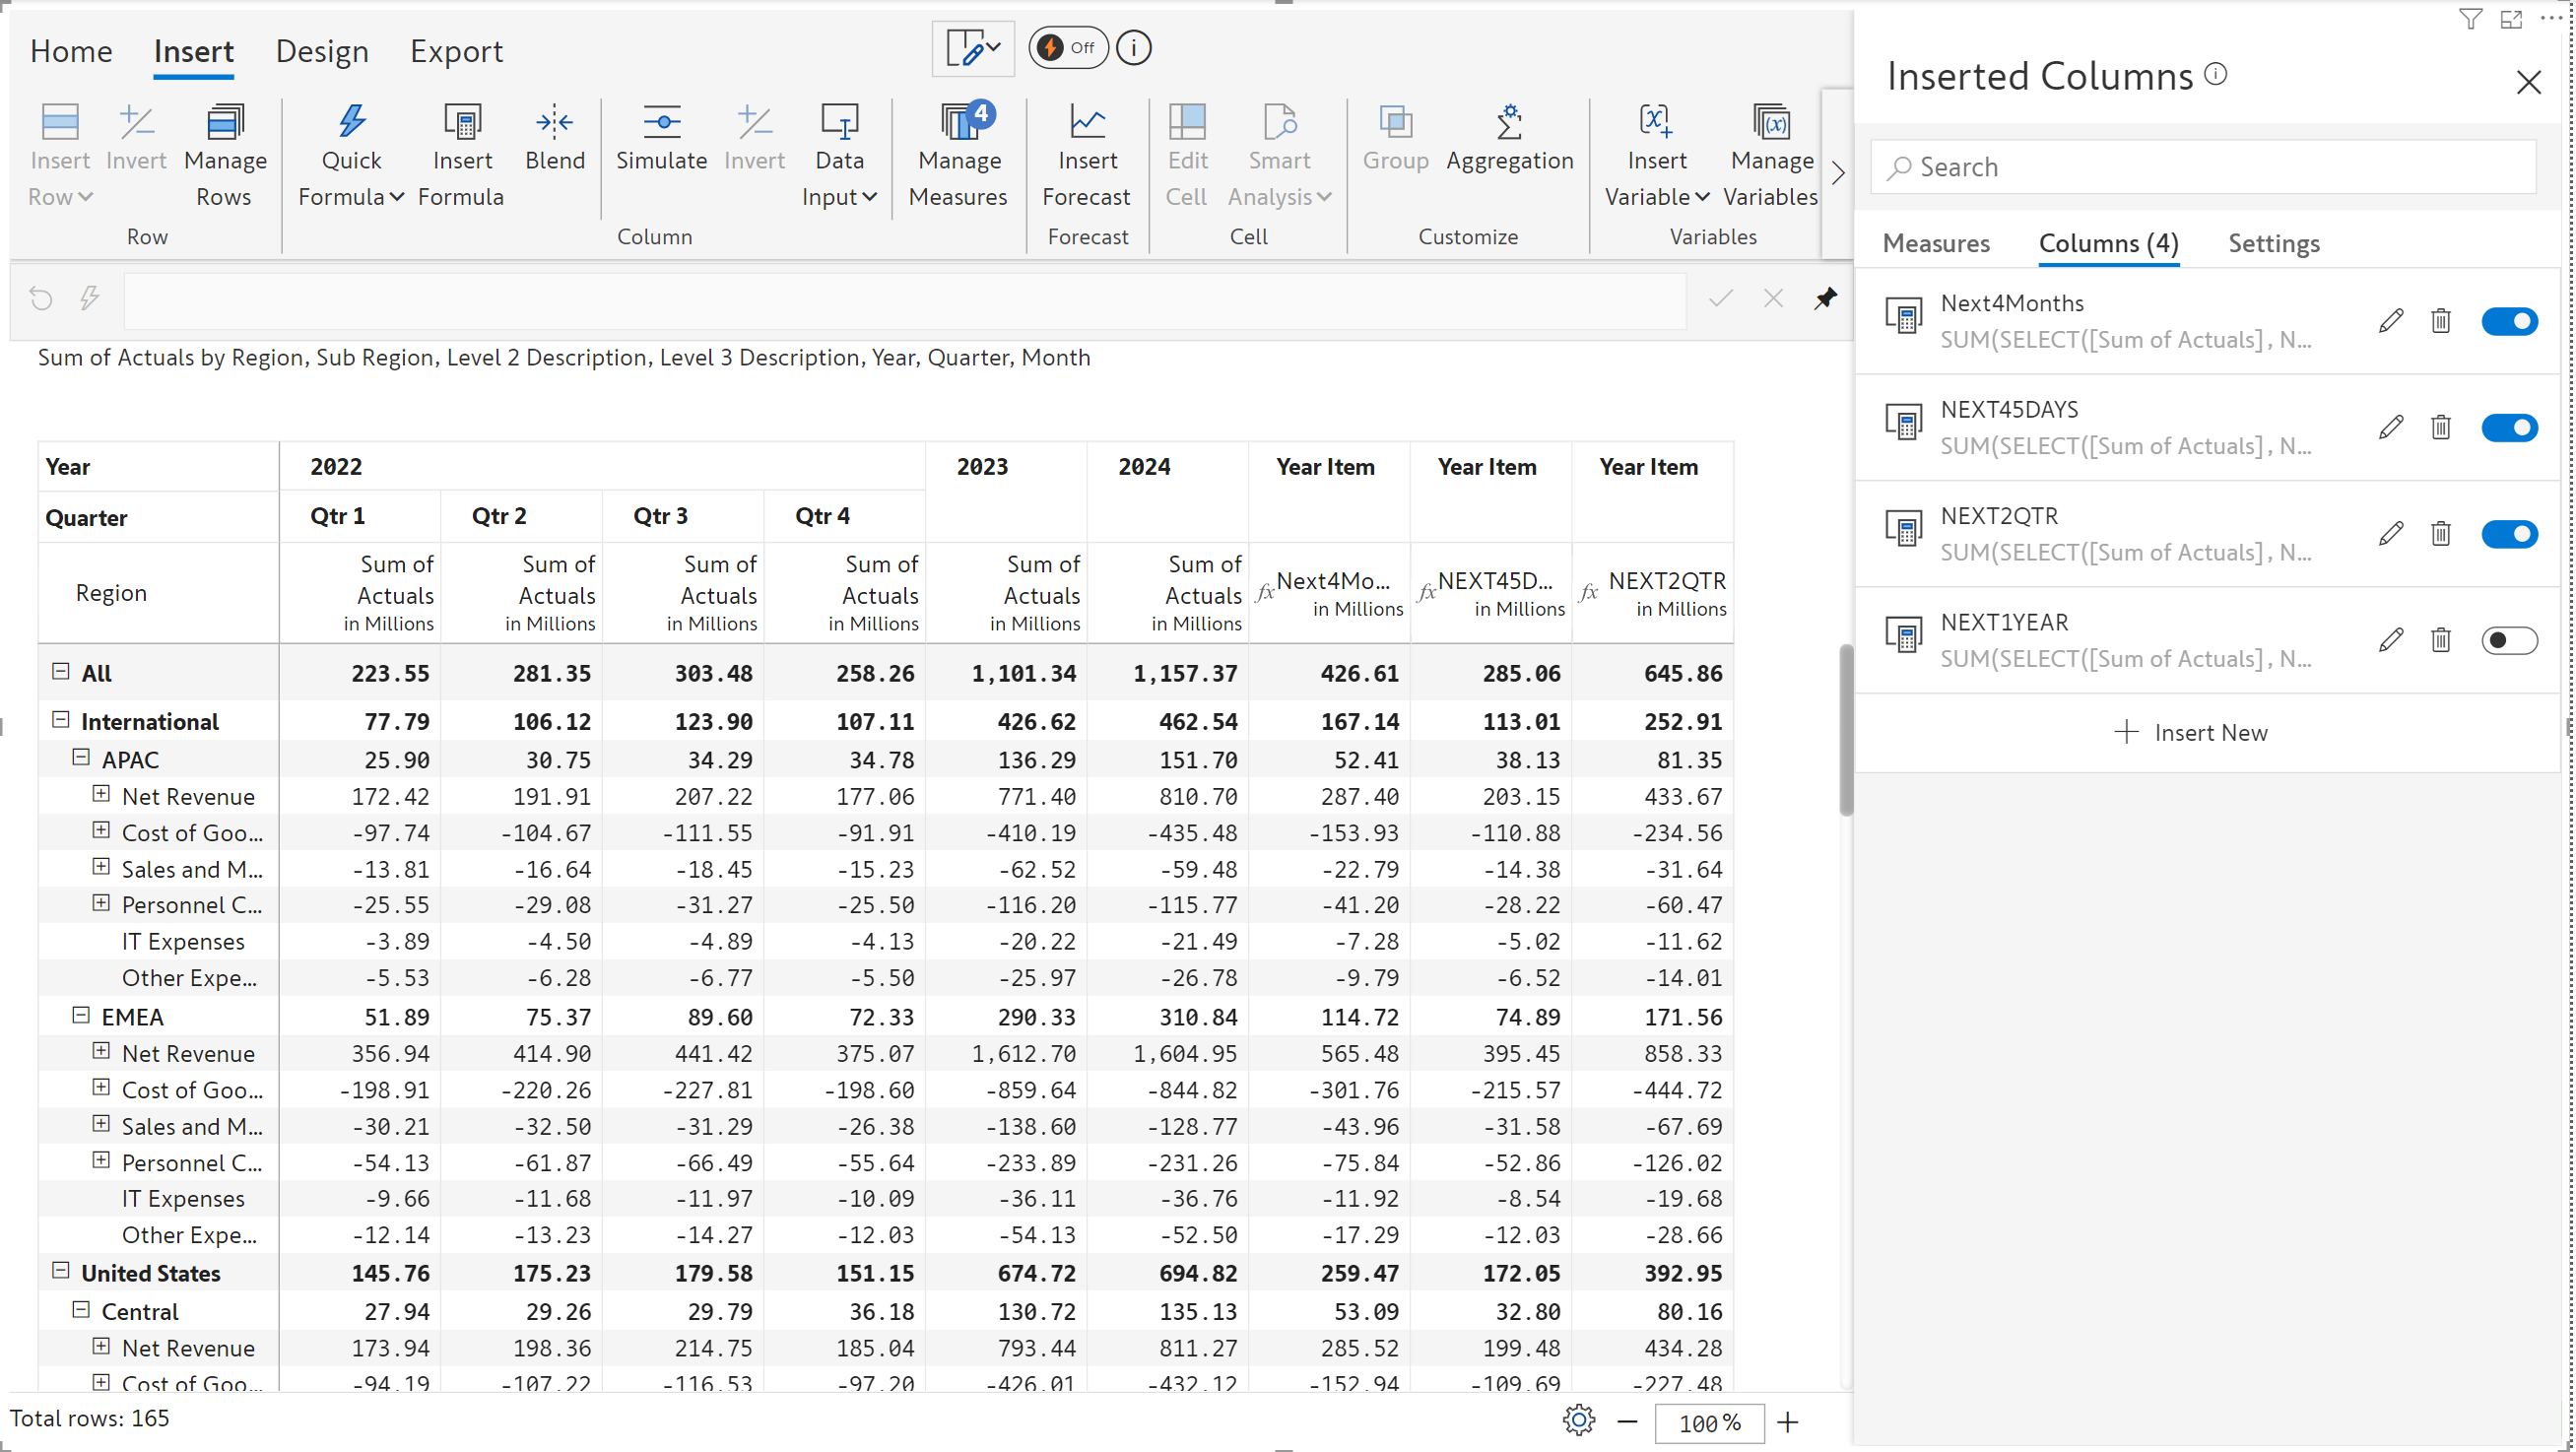
Inforiver’s built-in time intelligence is particularly useful when analyzing time-series data, such as sales or financial data. We have added additional functions that enable calculations on future time periods as well: NEXTNDAY, NEXTNMONTH, NEXTNQTR, NEXTNYEAR.
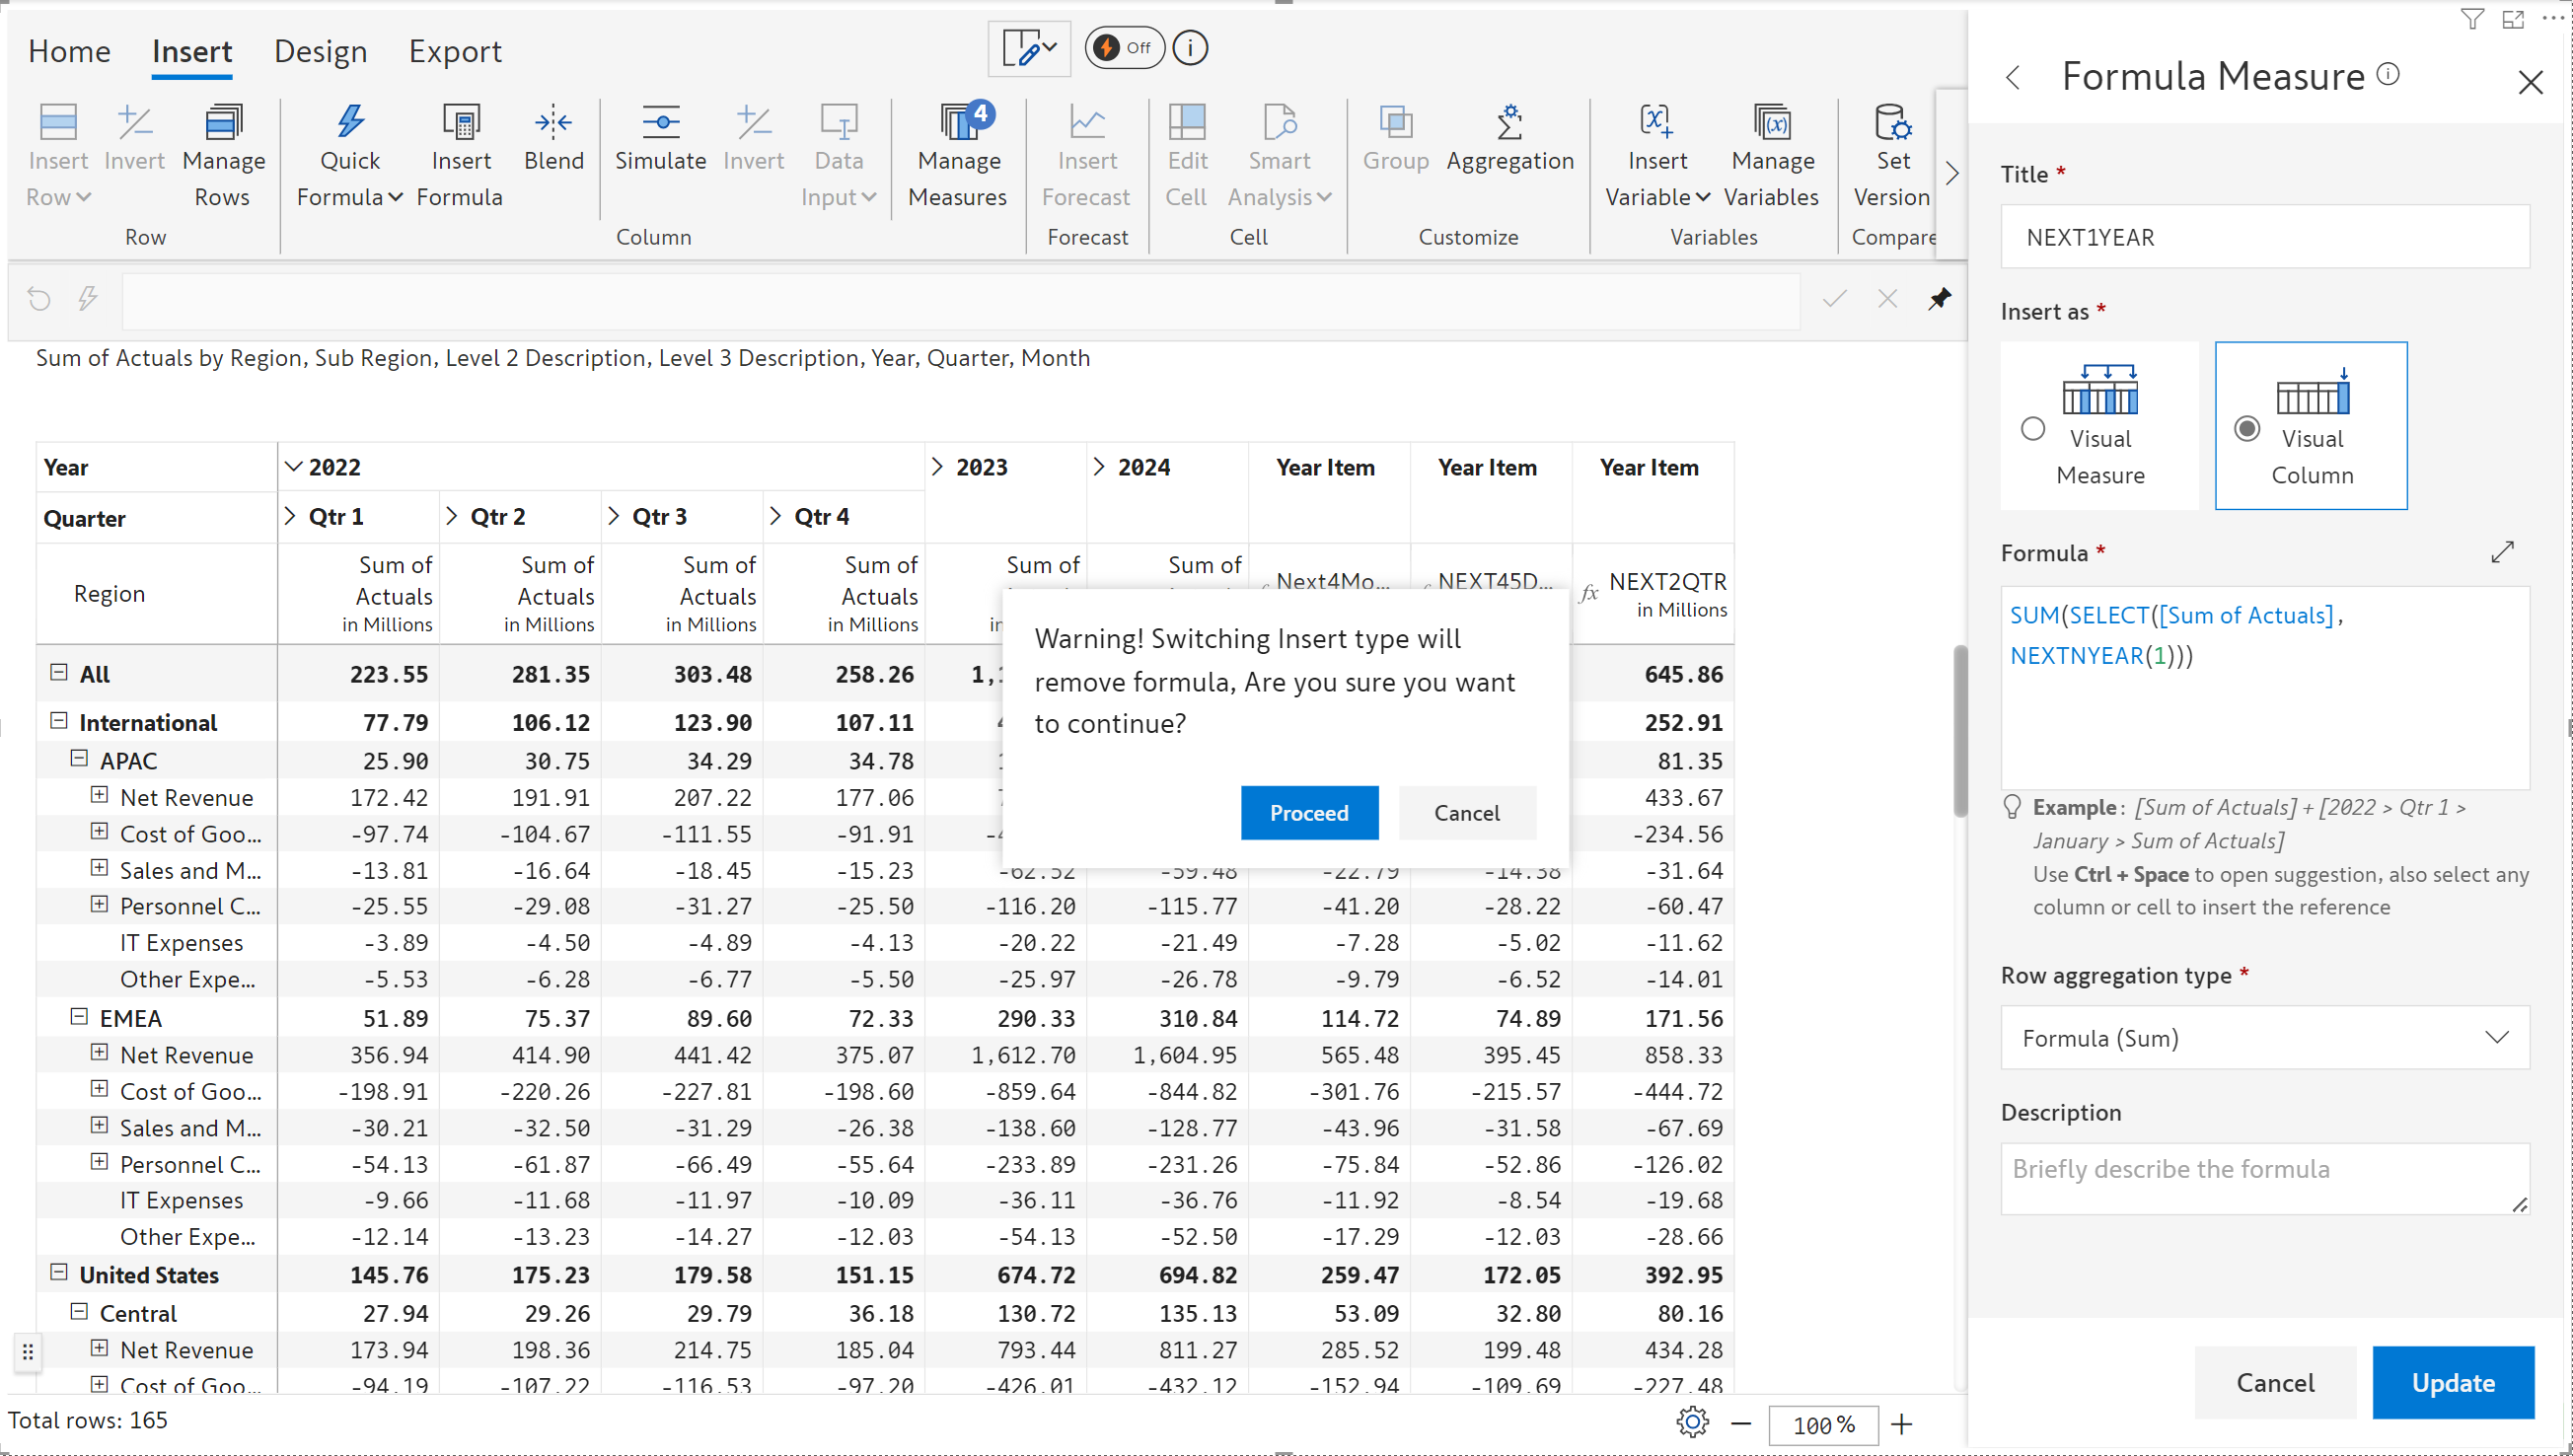
Have you ever typed in a long formula, then inadvertently switched from a visual measure to a visual column (or vice versa), and ended up losing your work? The good news is that it will not happen again. In the February release, we added a warning message while switching between visual measures and columns.
Inforiver has pre-built quick formulas that enable you to calculate running totals, lead/lag, rolling averages, or variances in a single click. In the latest release, you have the option to calculate continuous running totals: cumulative total will be calculated for all the leaf nodes, irrespective of the hierarchy level they belong to.
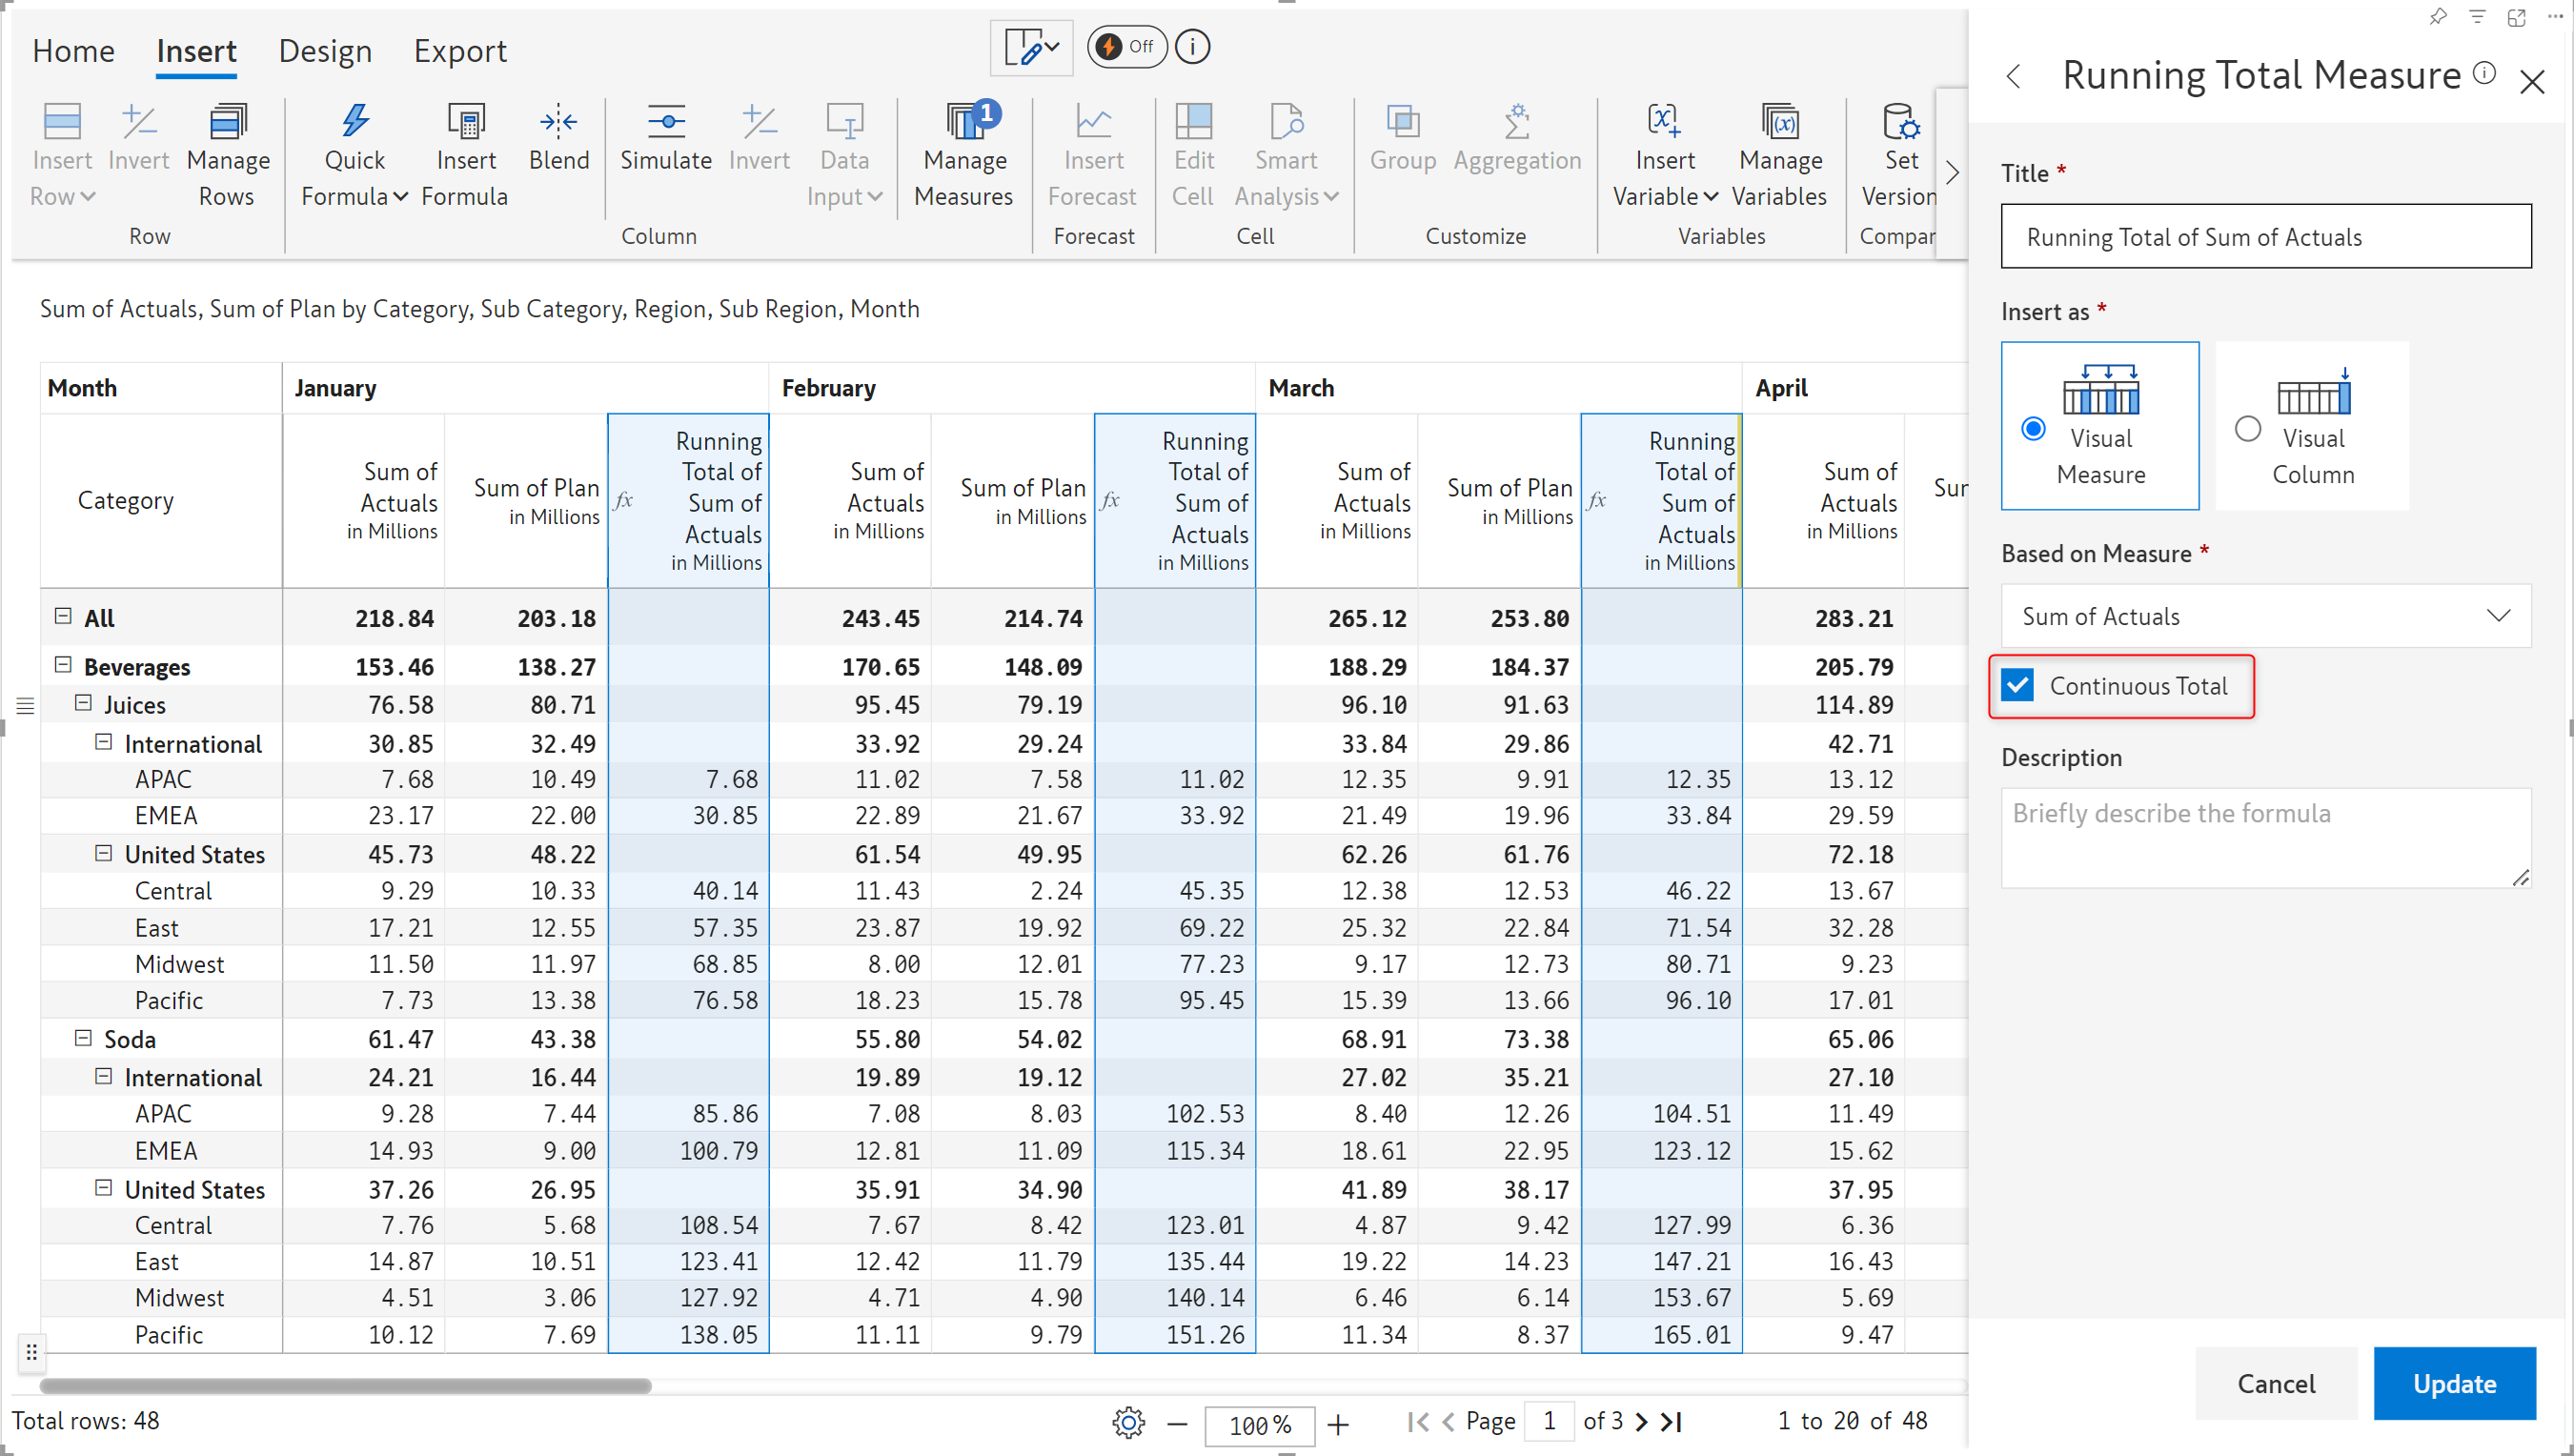
When the continuous total checkbox is disabled, the running total is calculated within hierarchy levels.
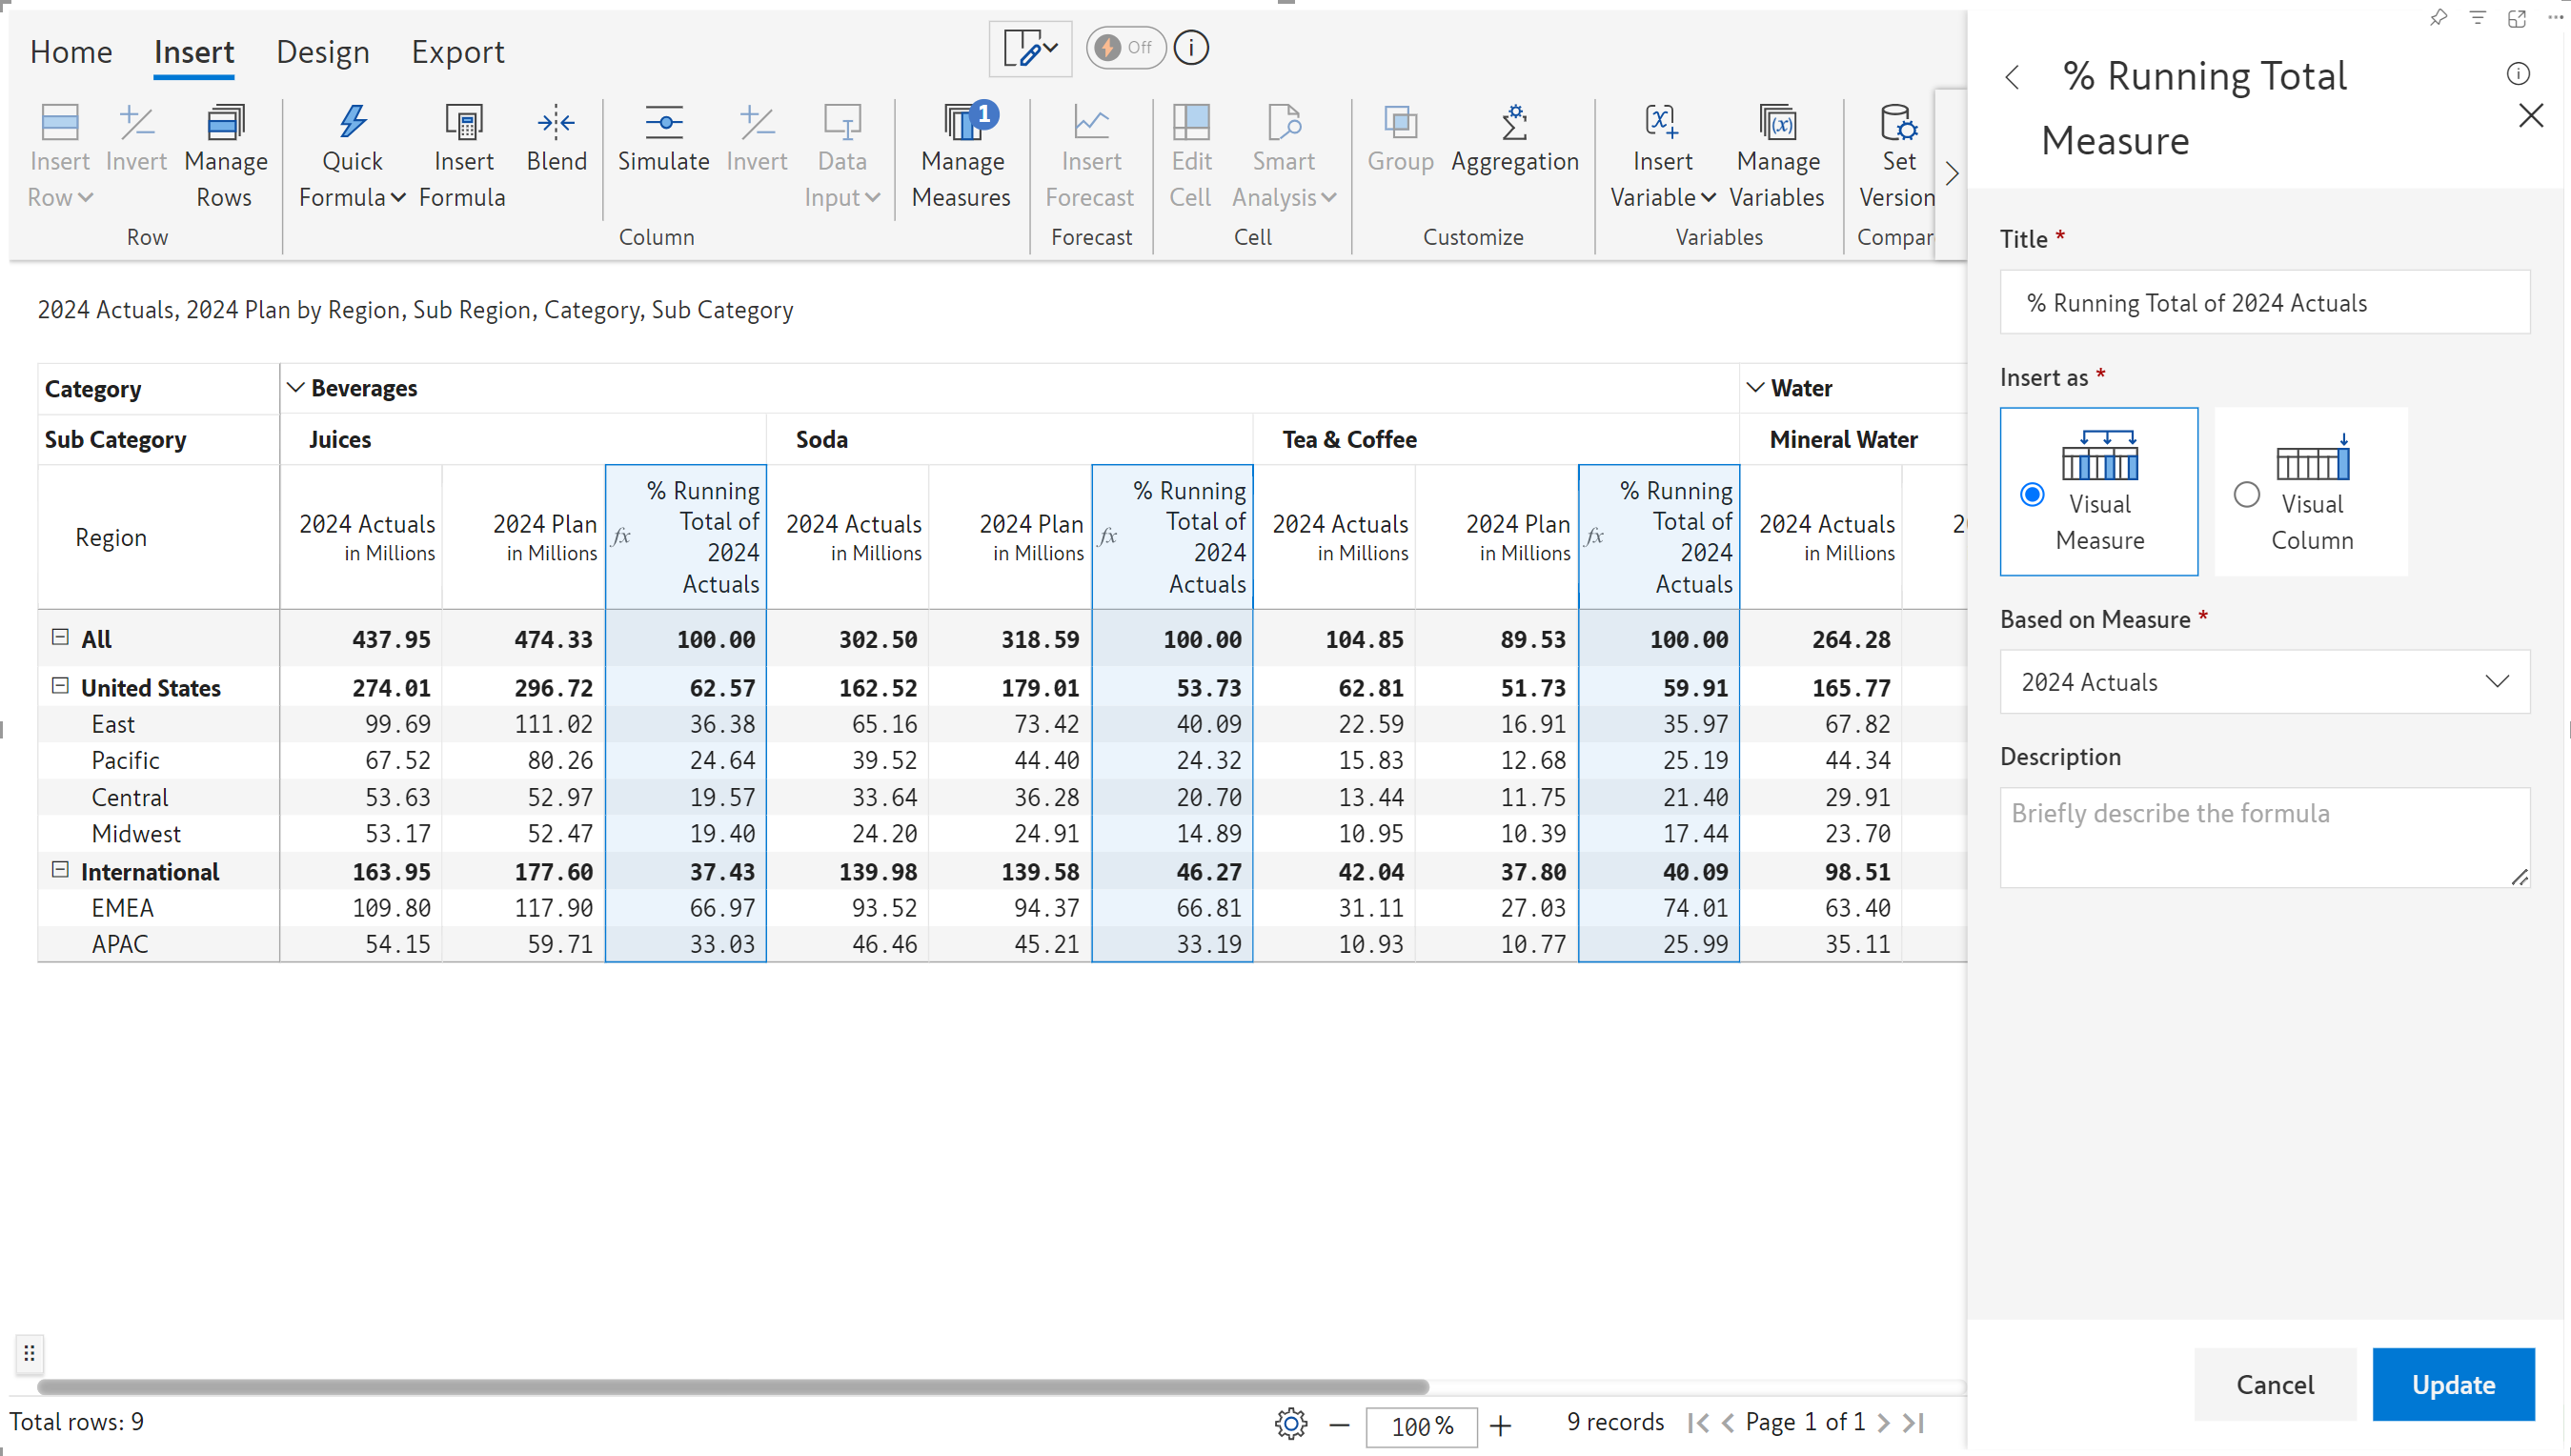
In the latest release, we have added a variant of the running total quick formula – percentage running total. The running total at each level of the hierarchy is expressed as a percentage of the total/subtotal.
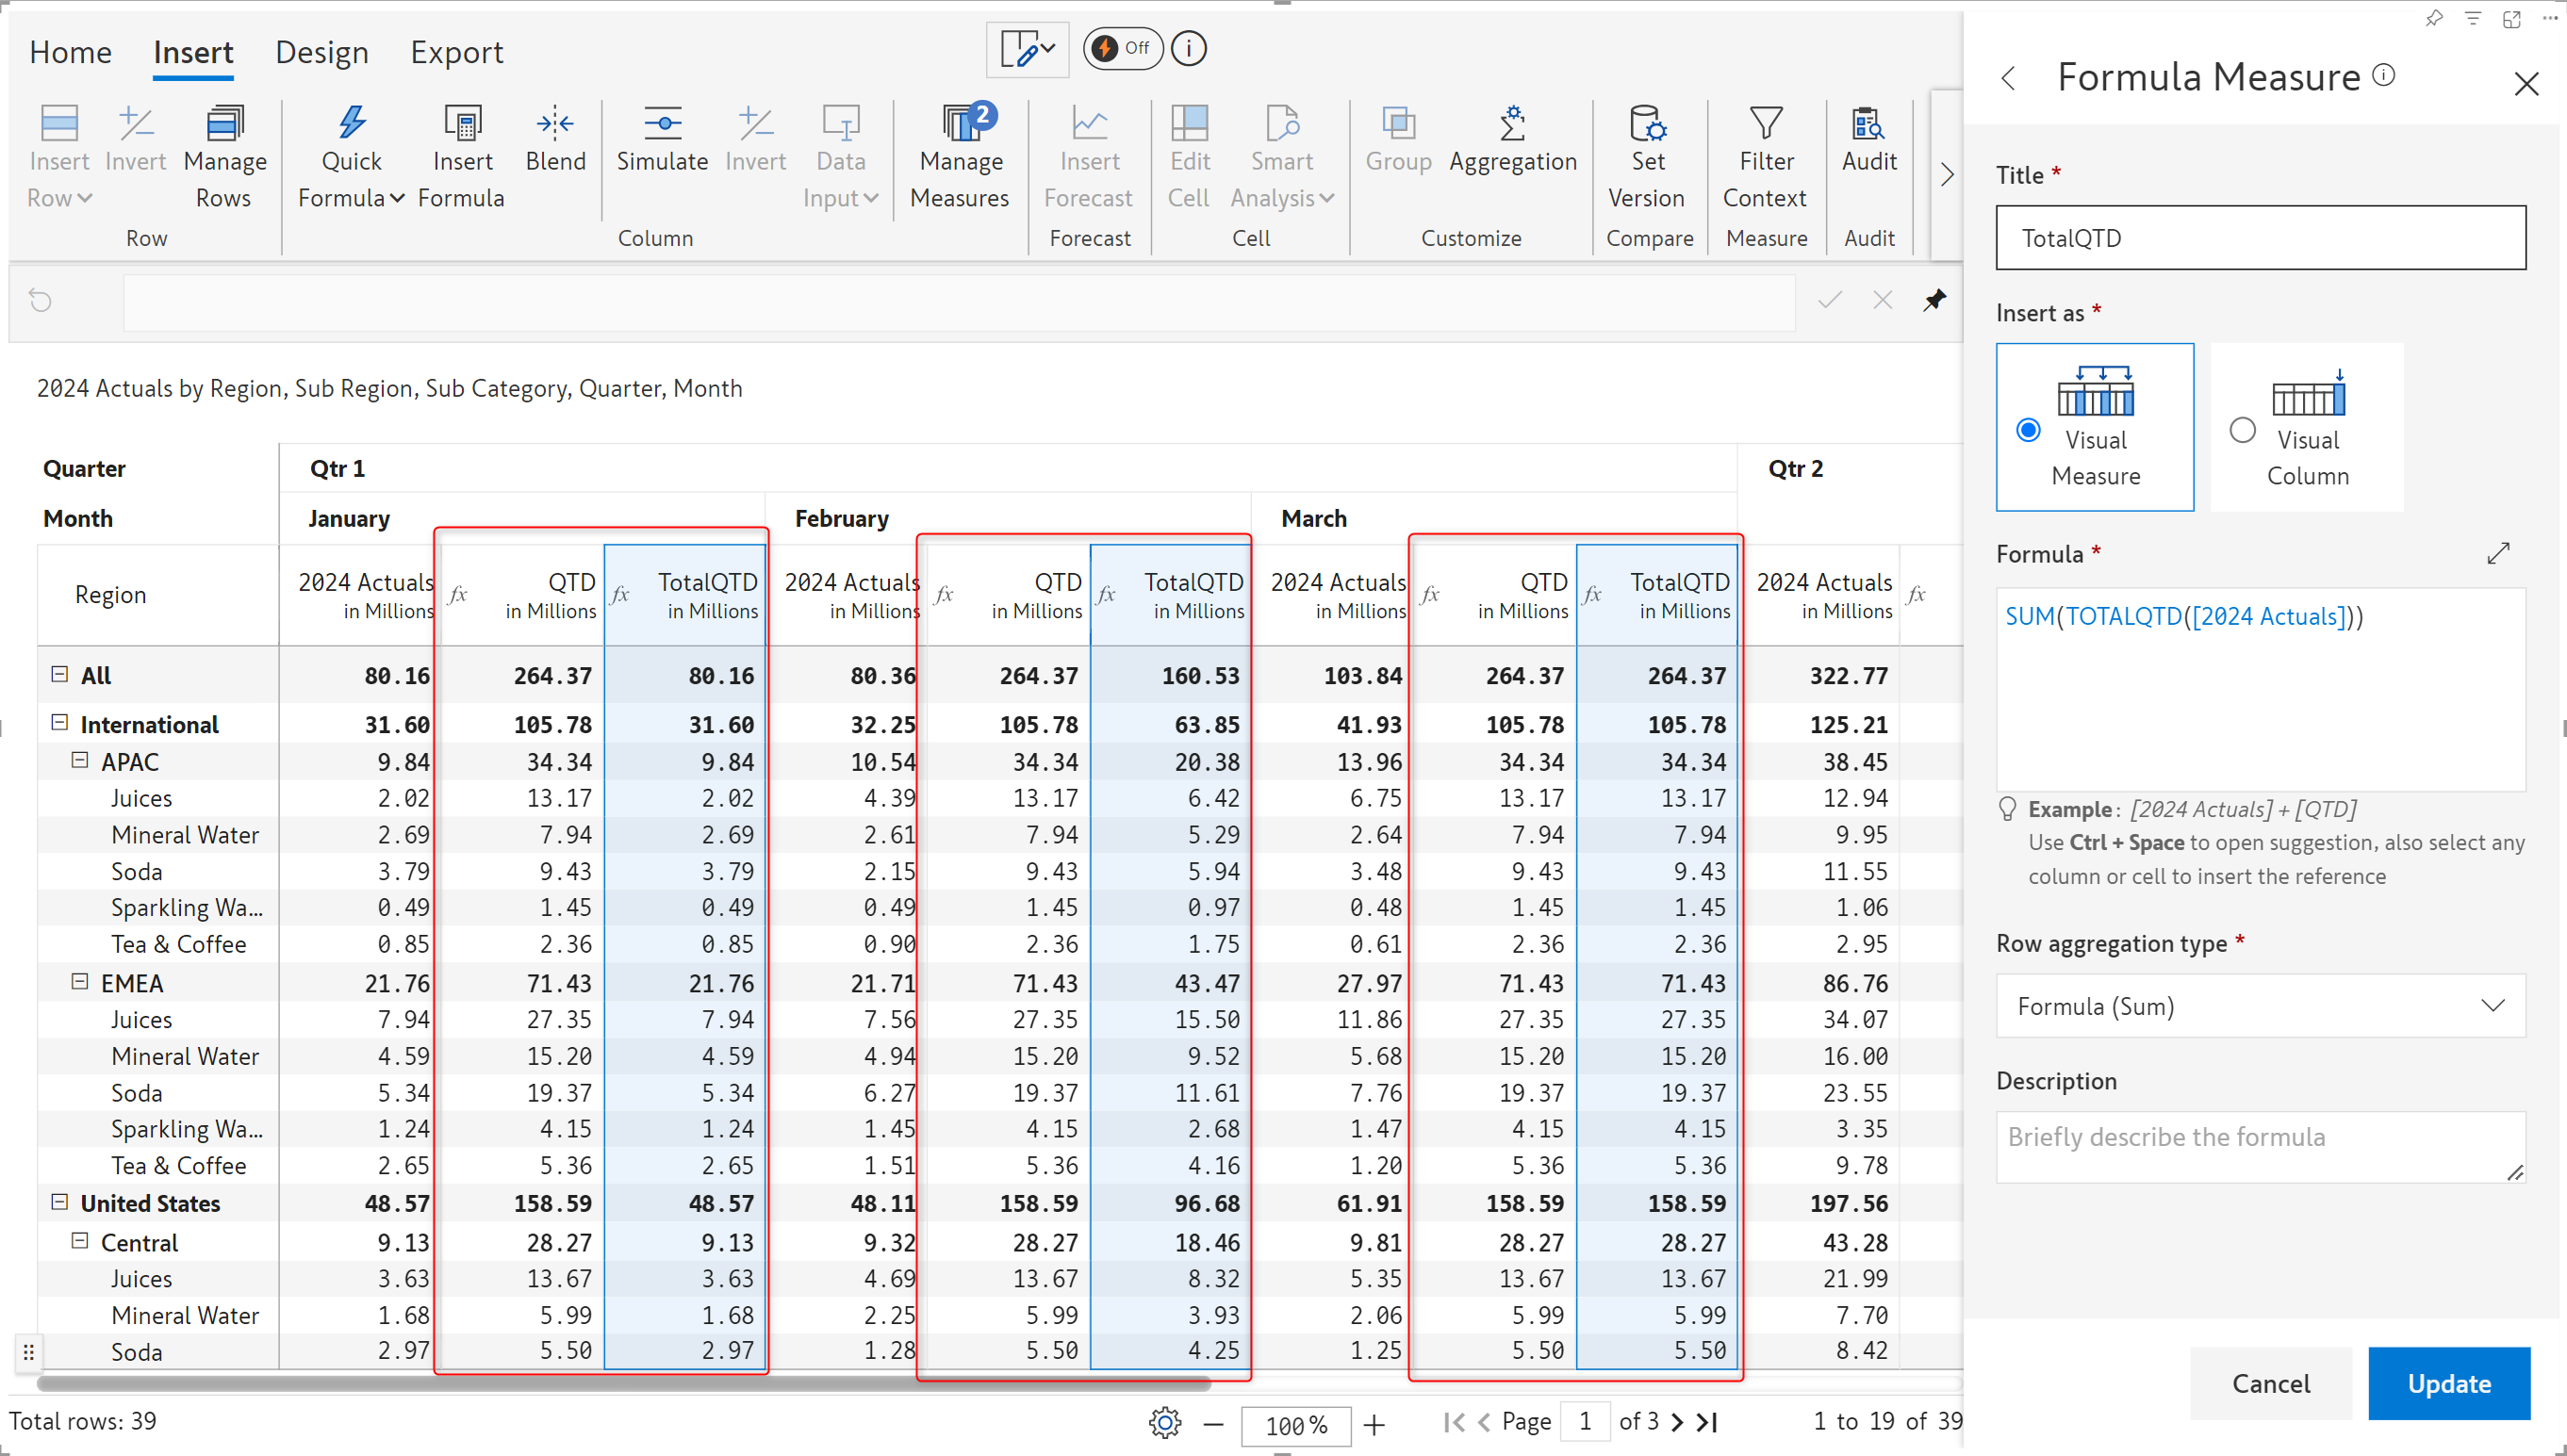
We have added new Total YTD/QTD/MTD functions which will calculate the year/quarter/month aggregate for each period in the report. For example, if we have data for 2022, 2023 and 2024, the TOTALYTD function will return the running aggregate for each year separately. The YTD function that was introduced in earlier releases will calculate a single aggregate for all 3 years. The difference between the formulae have been demonstrated in the image below.
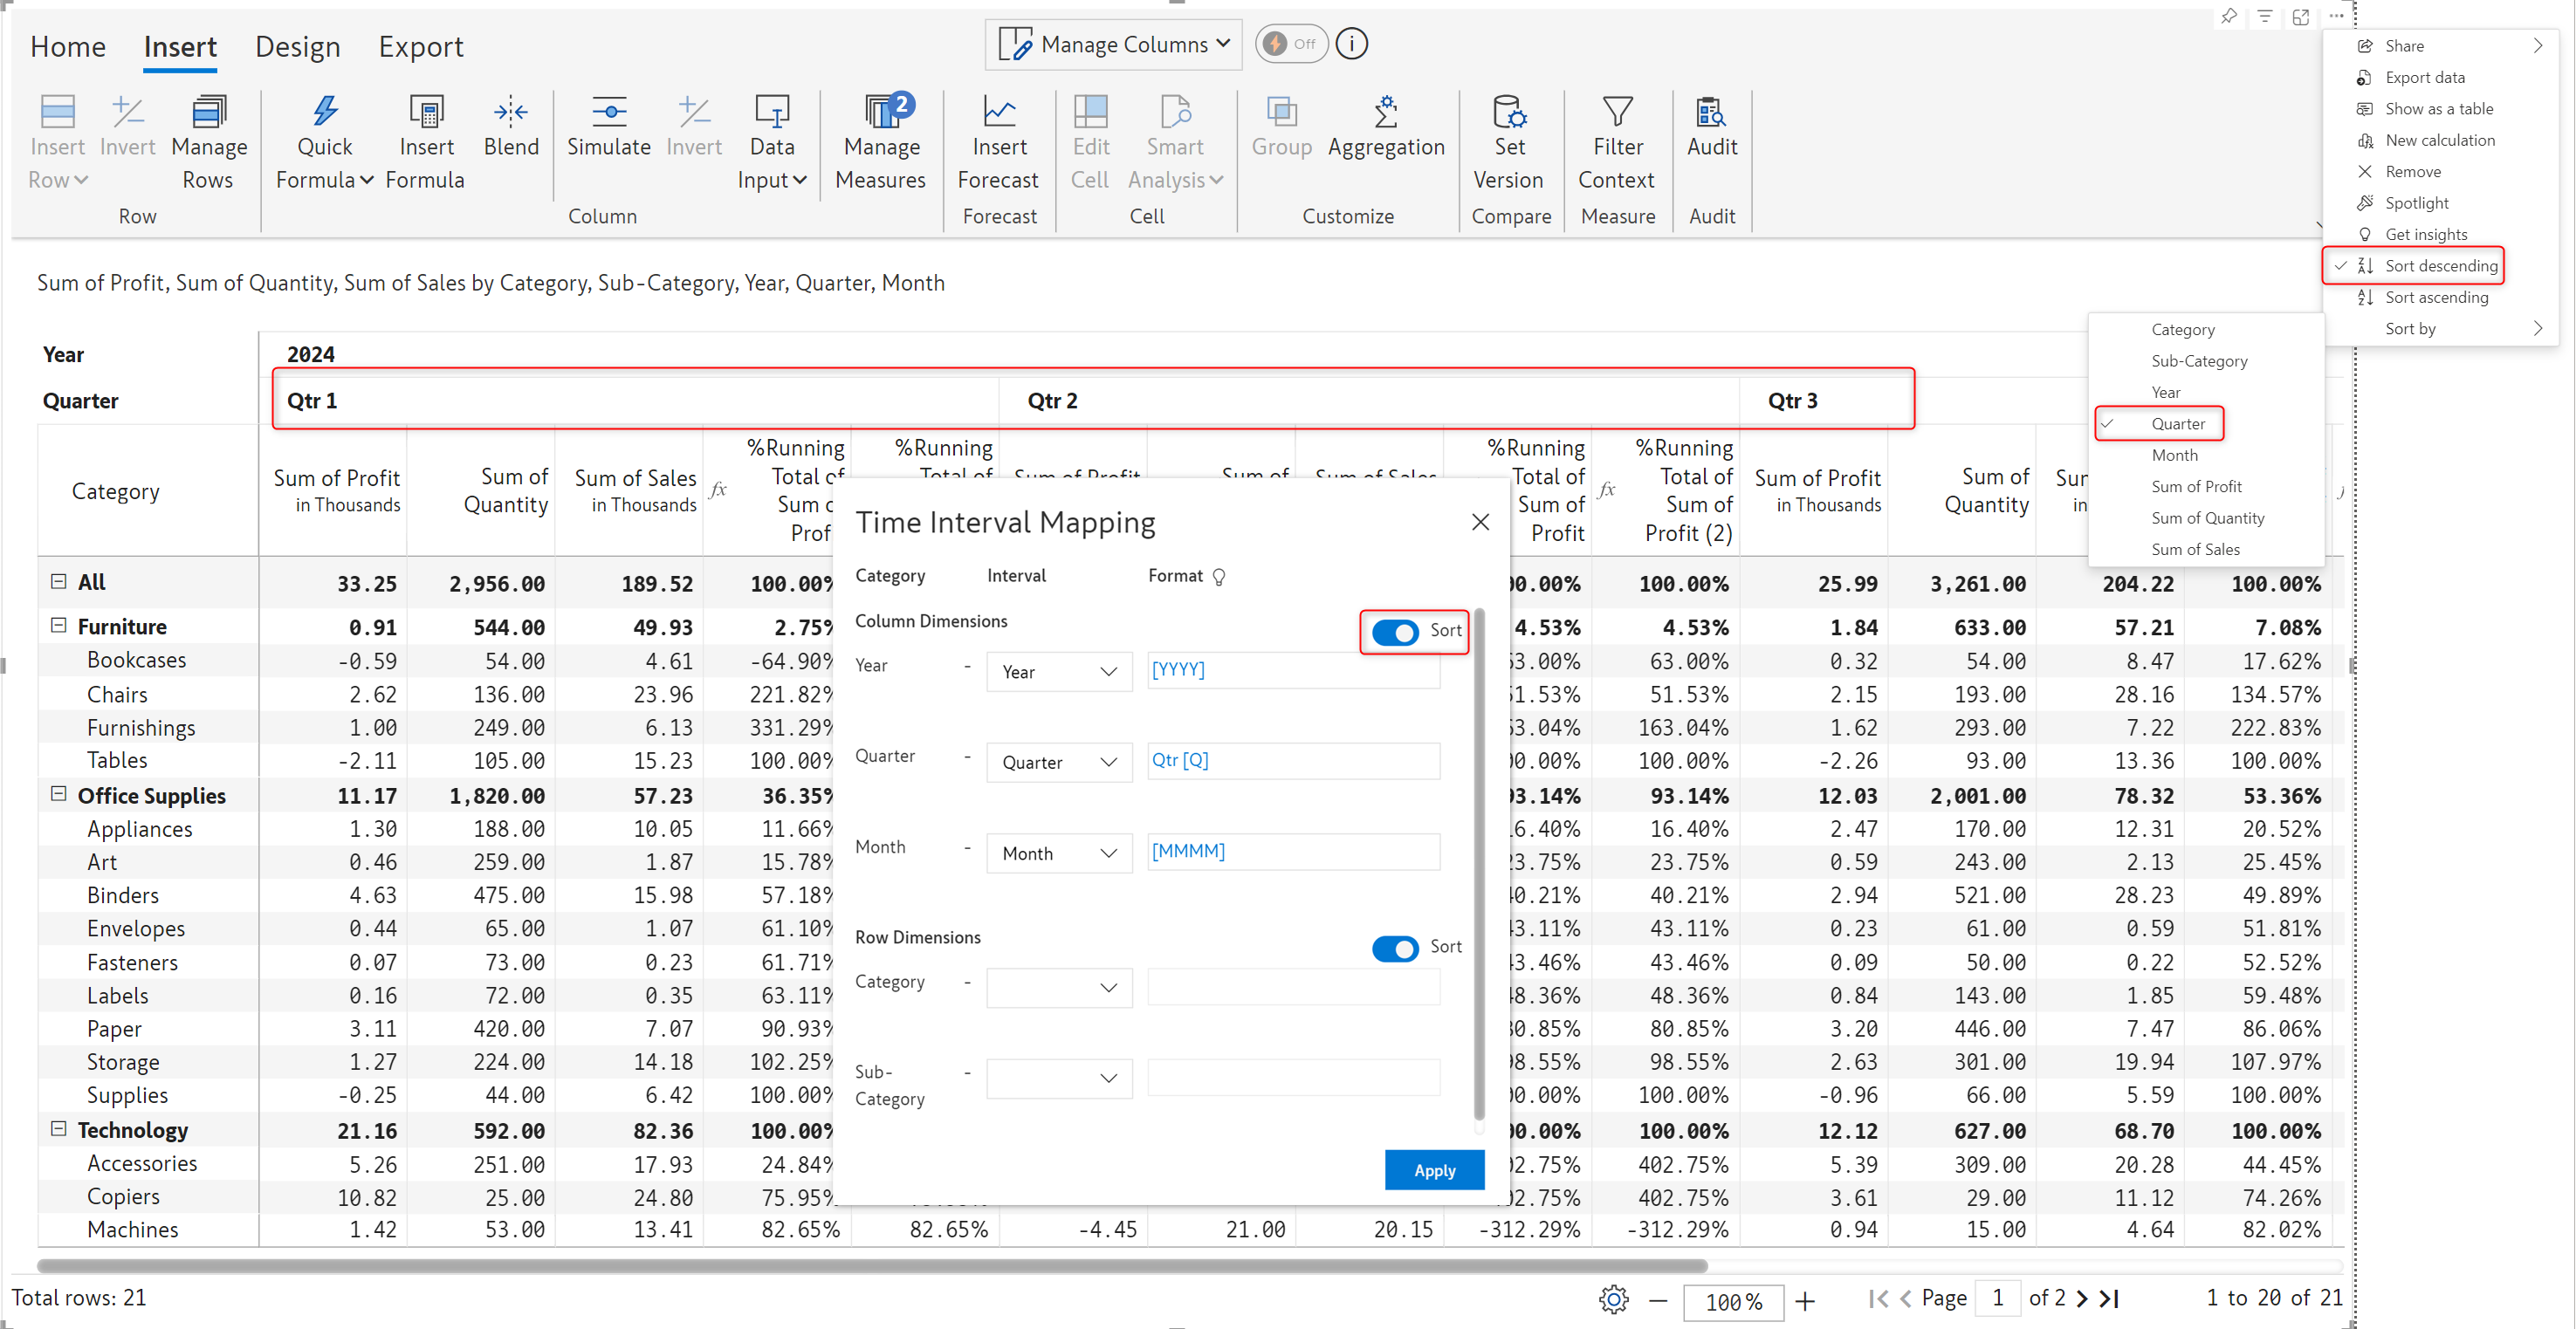
When you have a date hierarchy in your columns, you can choose whether to use Power BI sorting or Inforiver sorting. When the toggle is enabled, any sorting changes made at Power BI level will not be reflected in the visual. In the example, notice how the Power BI sorting is not applied on the Quarter when the Sort toggle is enabled.
Inforiver provides plug-and-play header presets to easily design your headers. If you have chosen the KPI preset, any selections made in the KPI explorer will now be reflected in the header as well.
With the latest release, we have added 3 options for manually selecting the data for header charts:
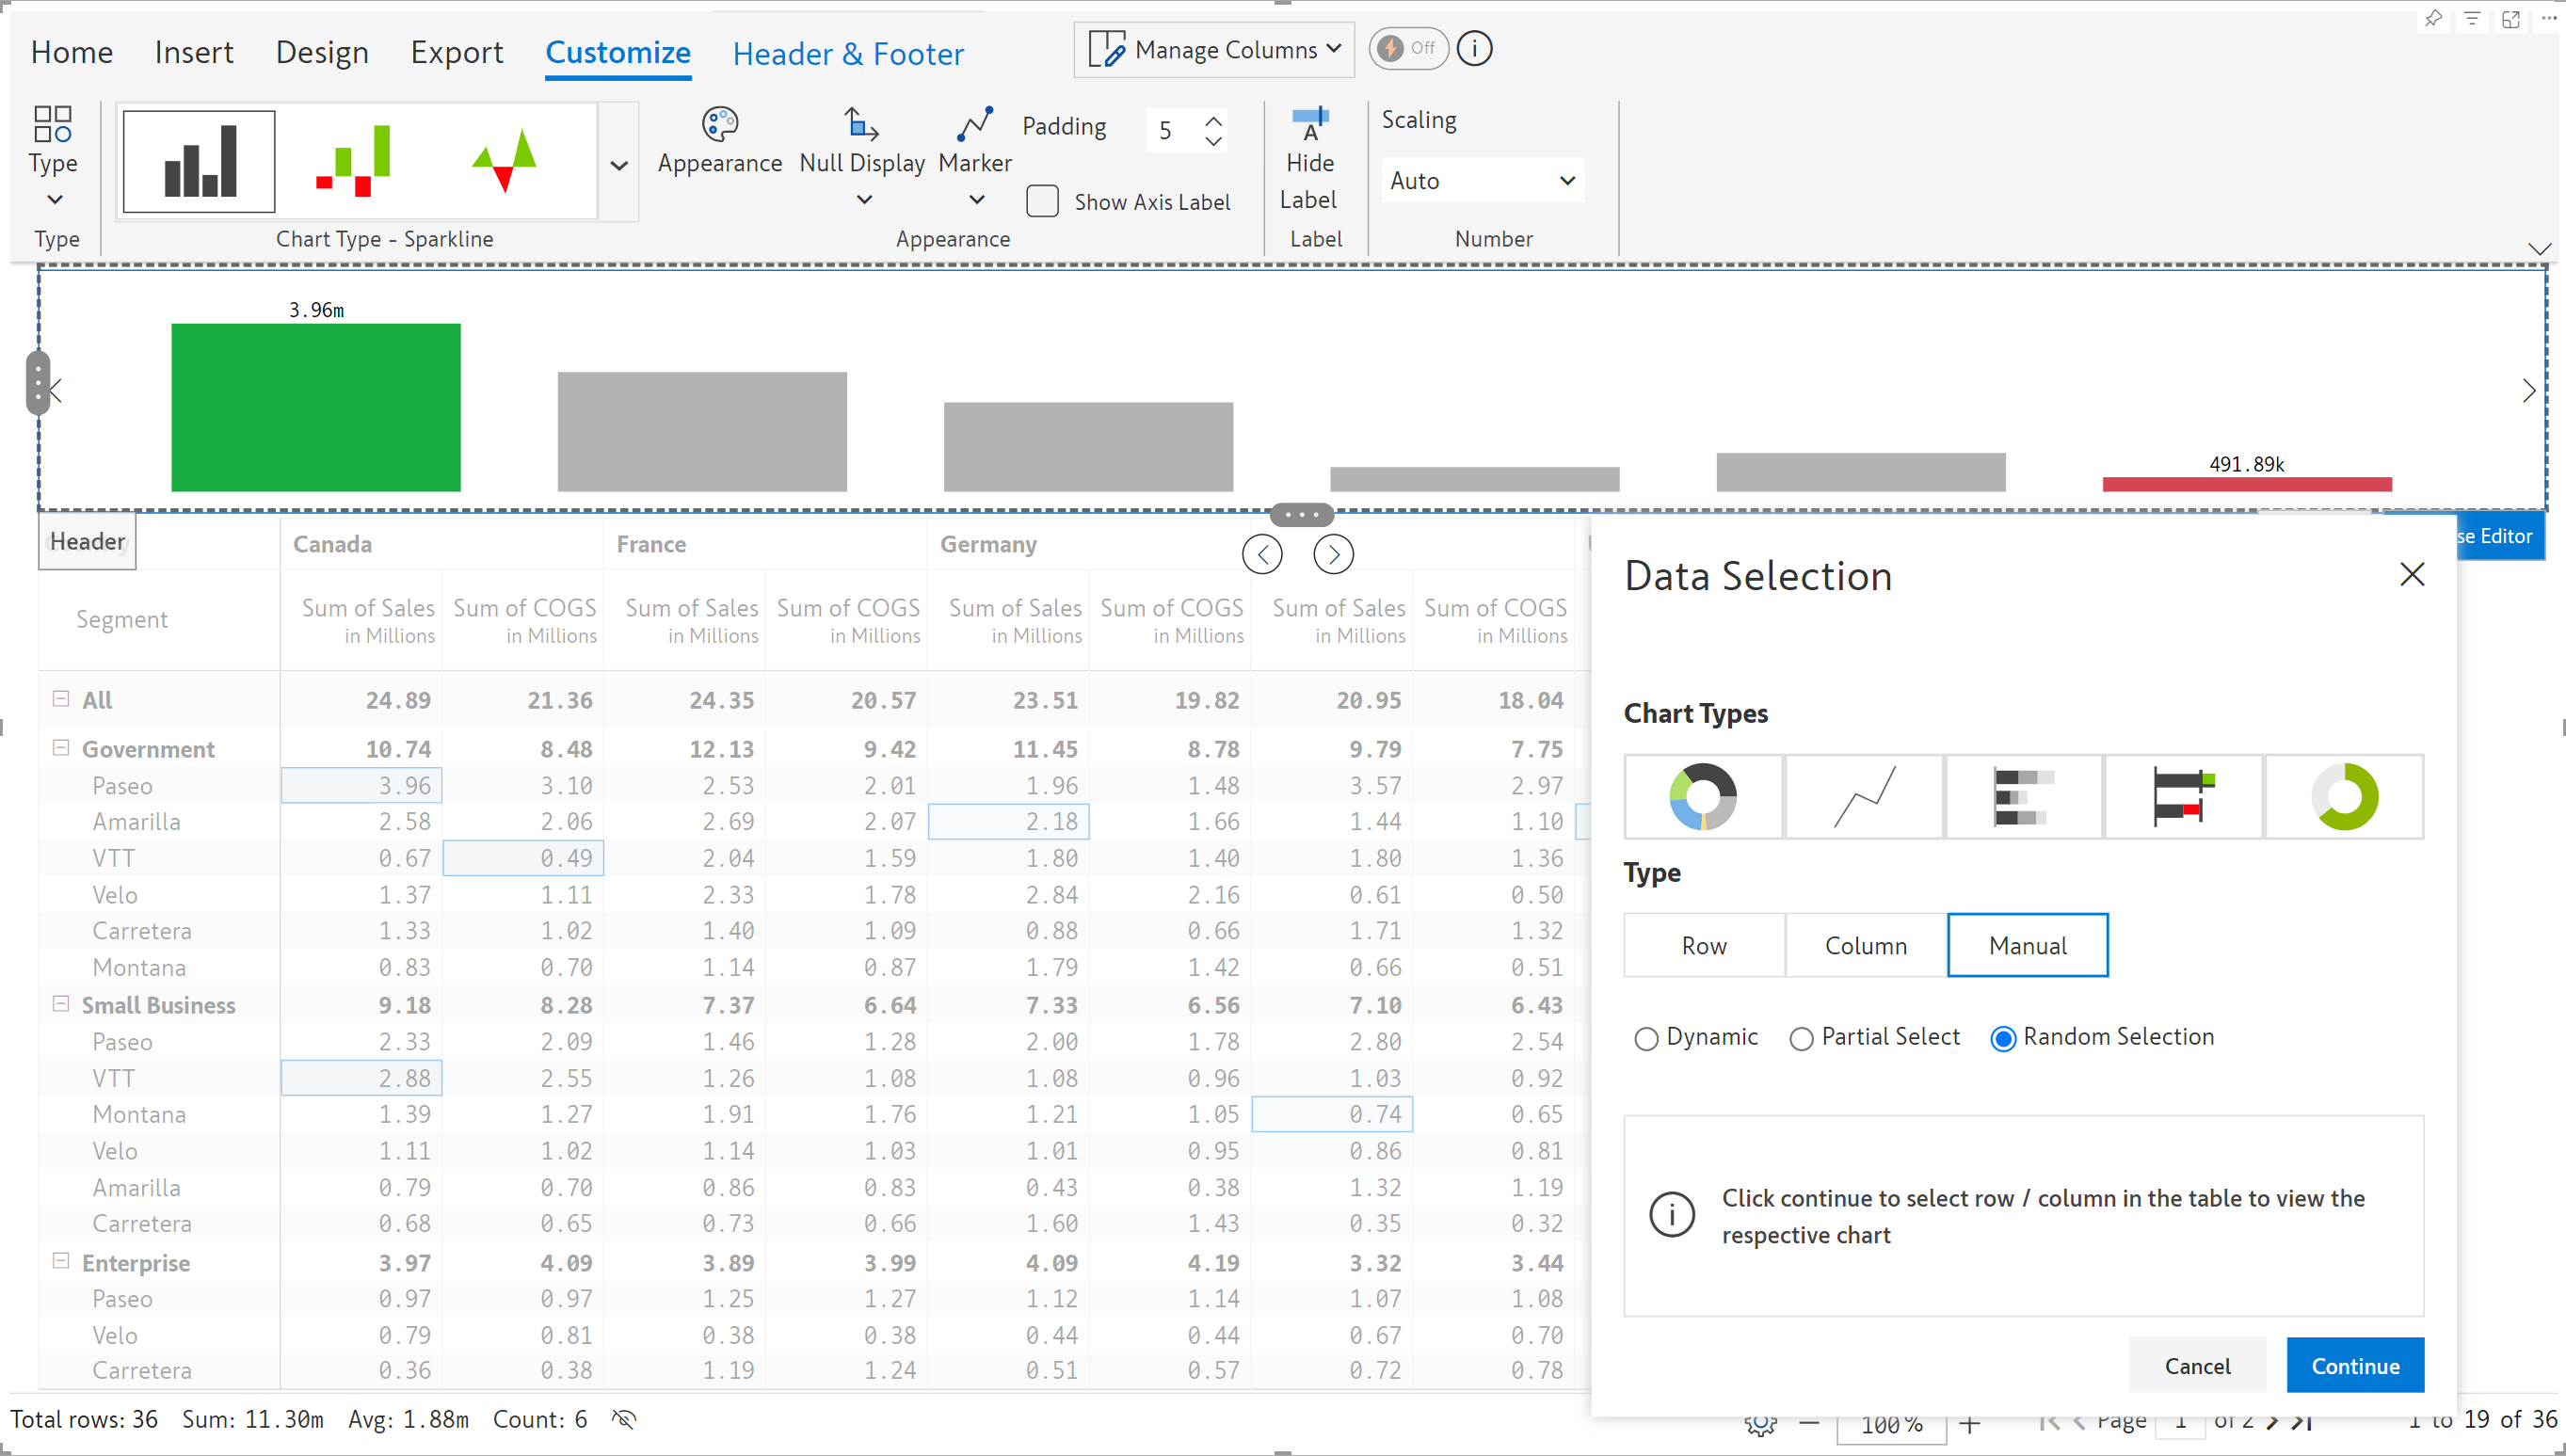
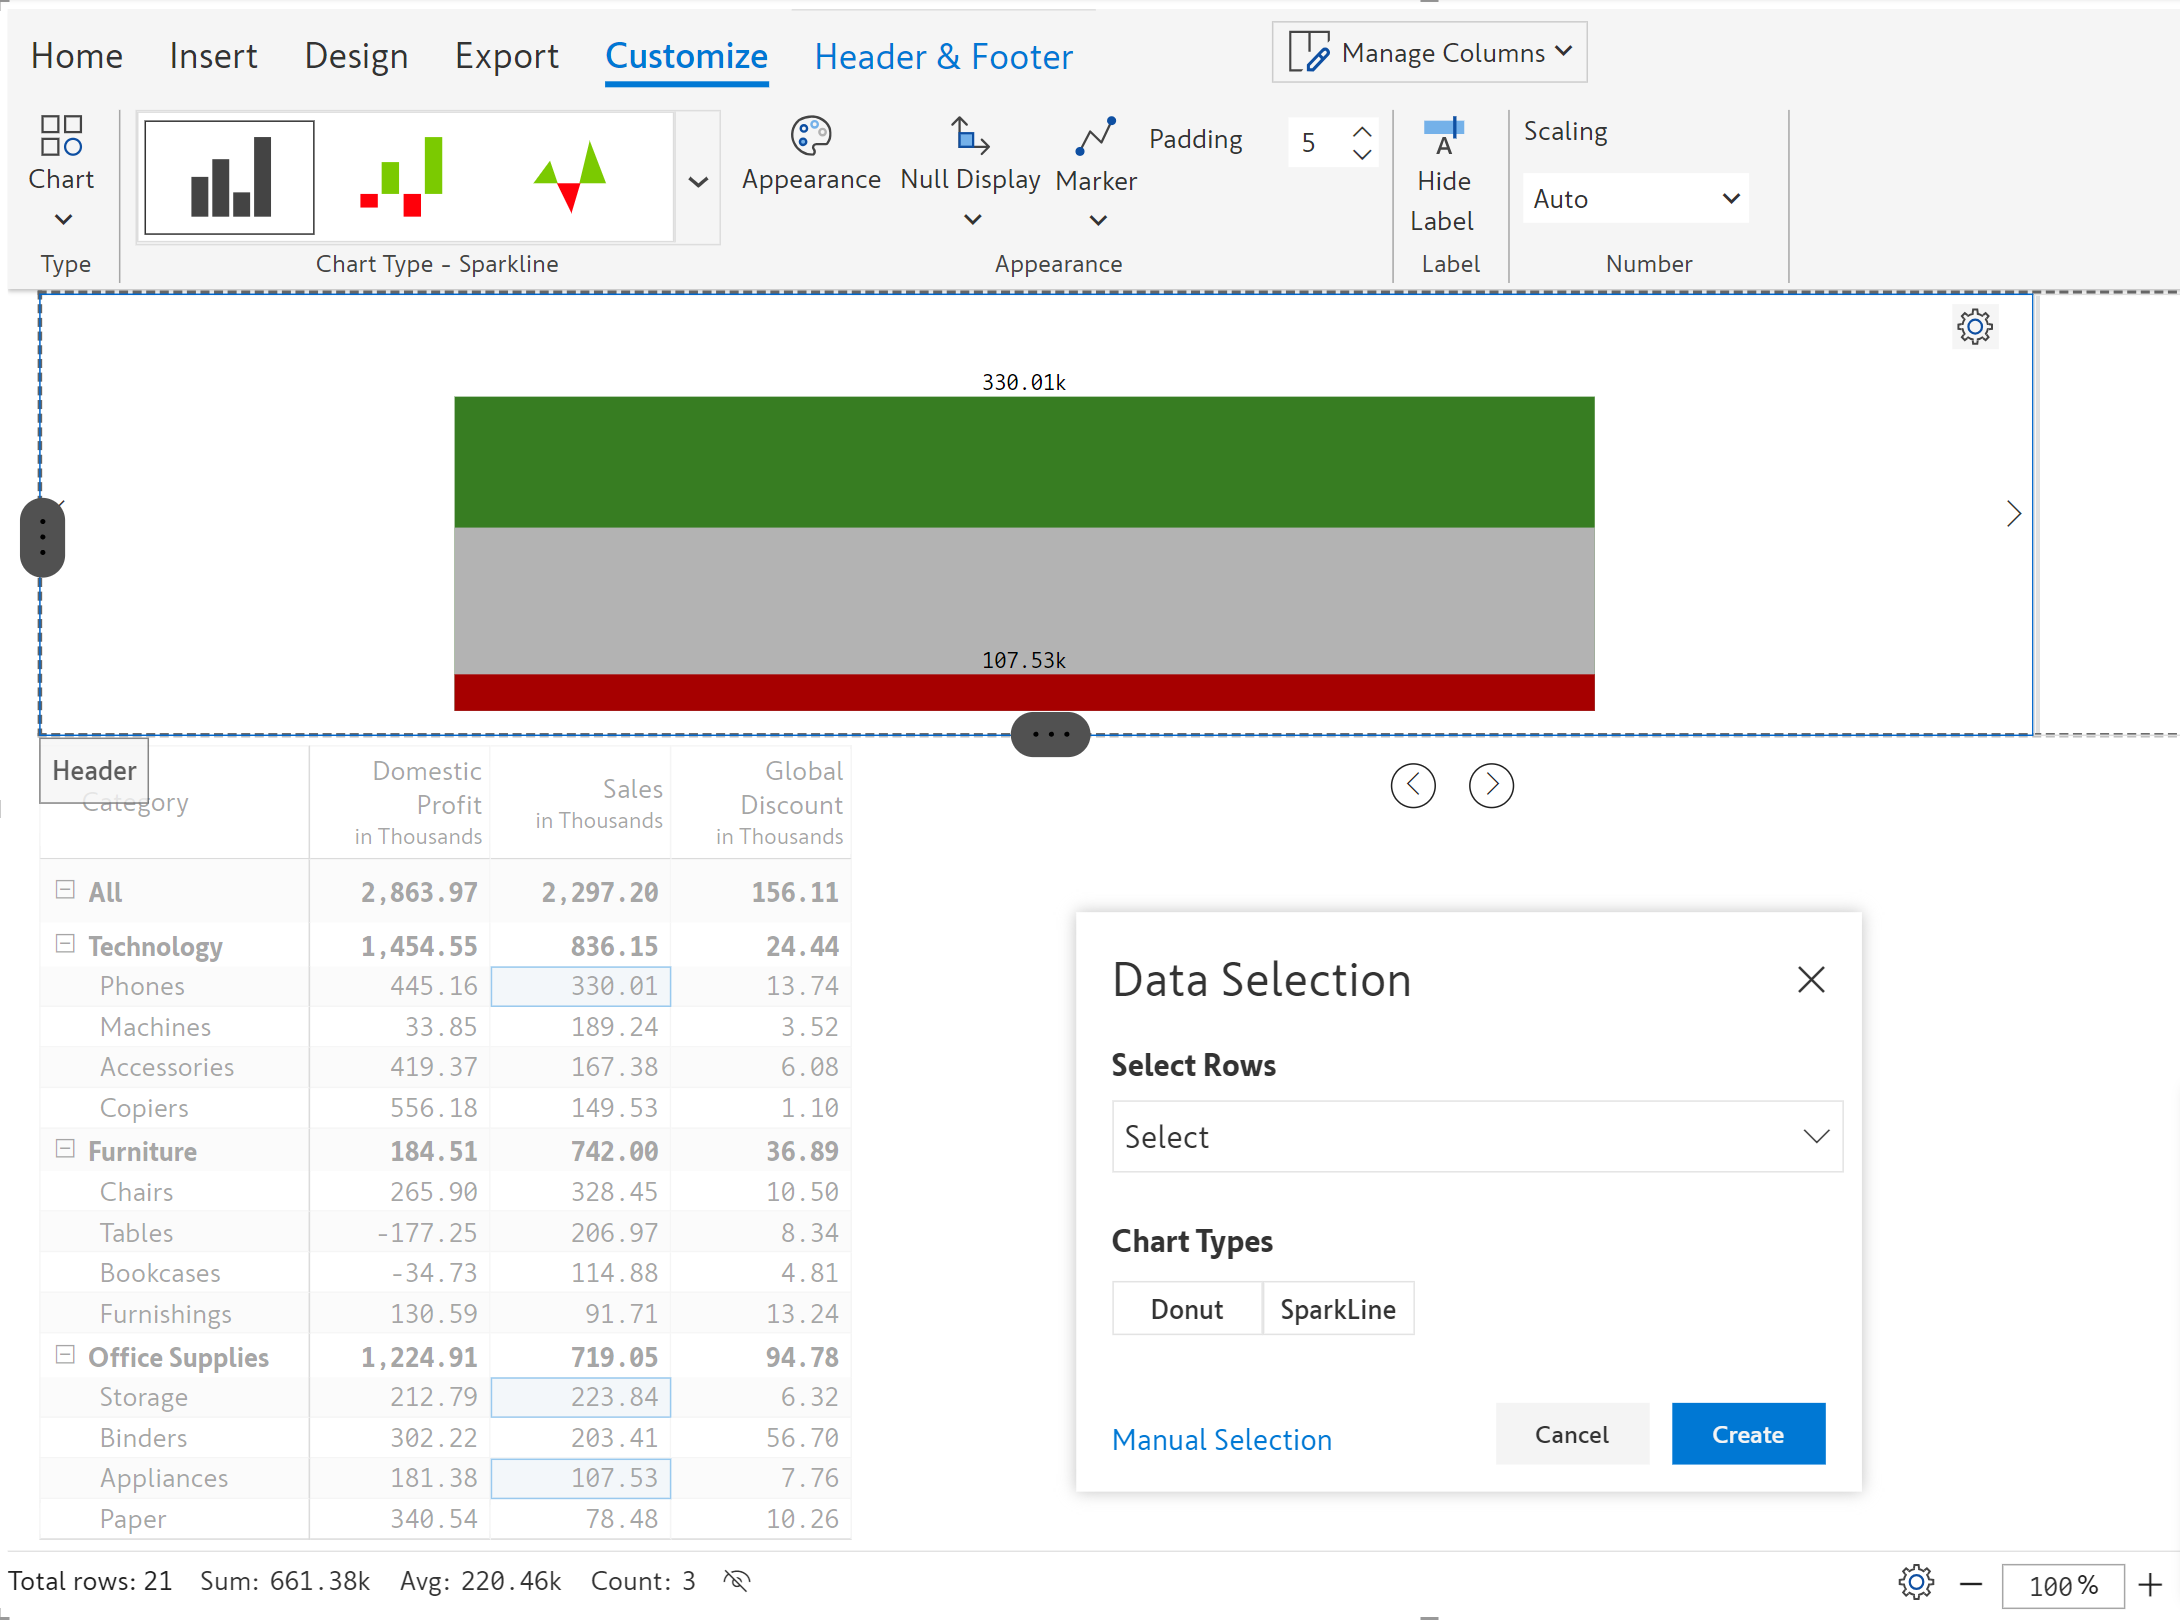
With Inforiver, you can render charts in the header, enabling the audience to get a high-level overview of the report. In earlier releases, if you opted for a bar chart with manual selection, the bars would be stacked on top of each other.
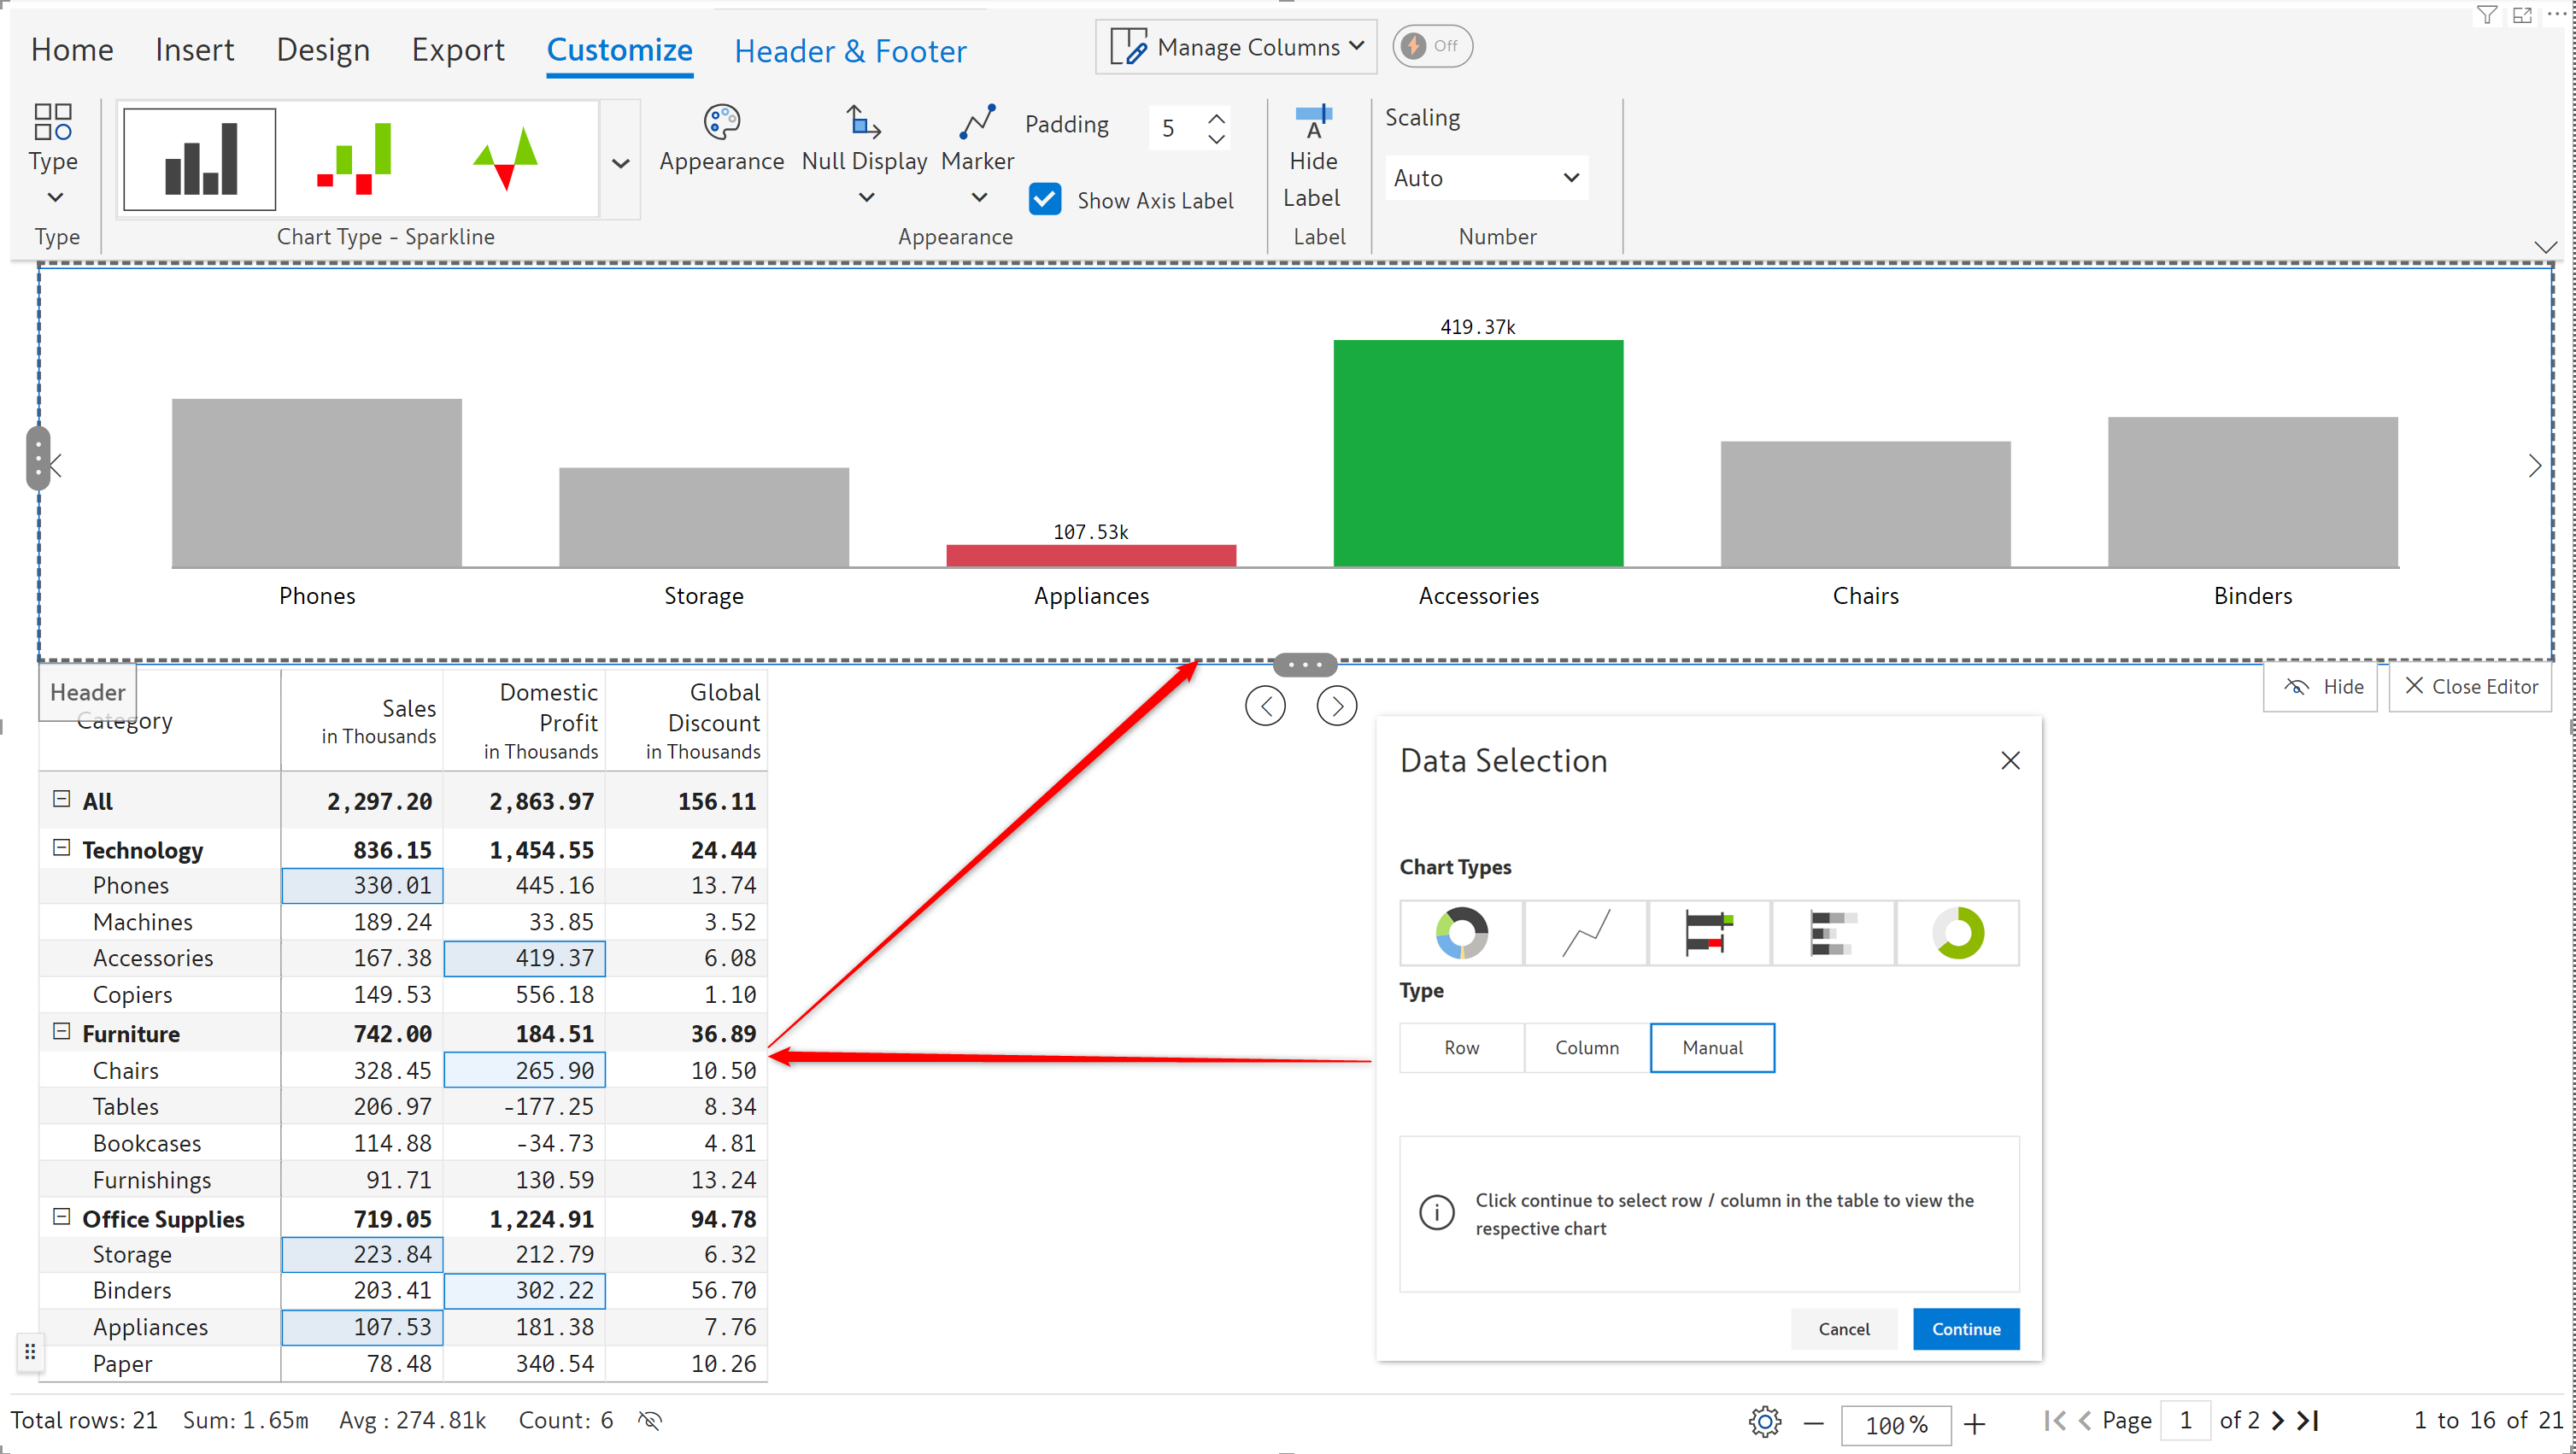
In the Apple version, the bars are displayed side by side when you select ad-hoc cells or select an entire column, enhancing readability and aesthetics.
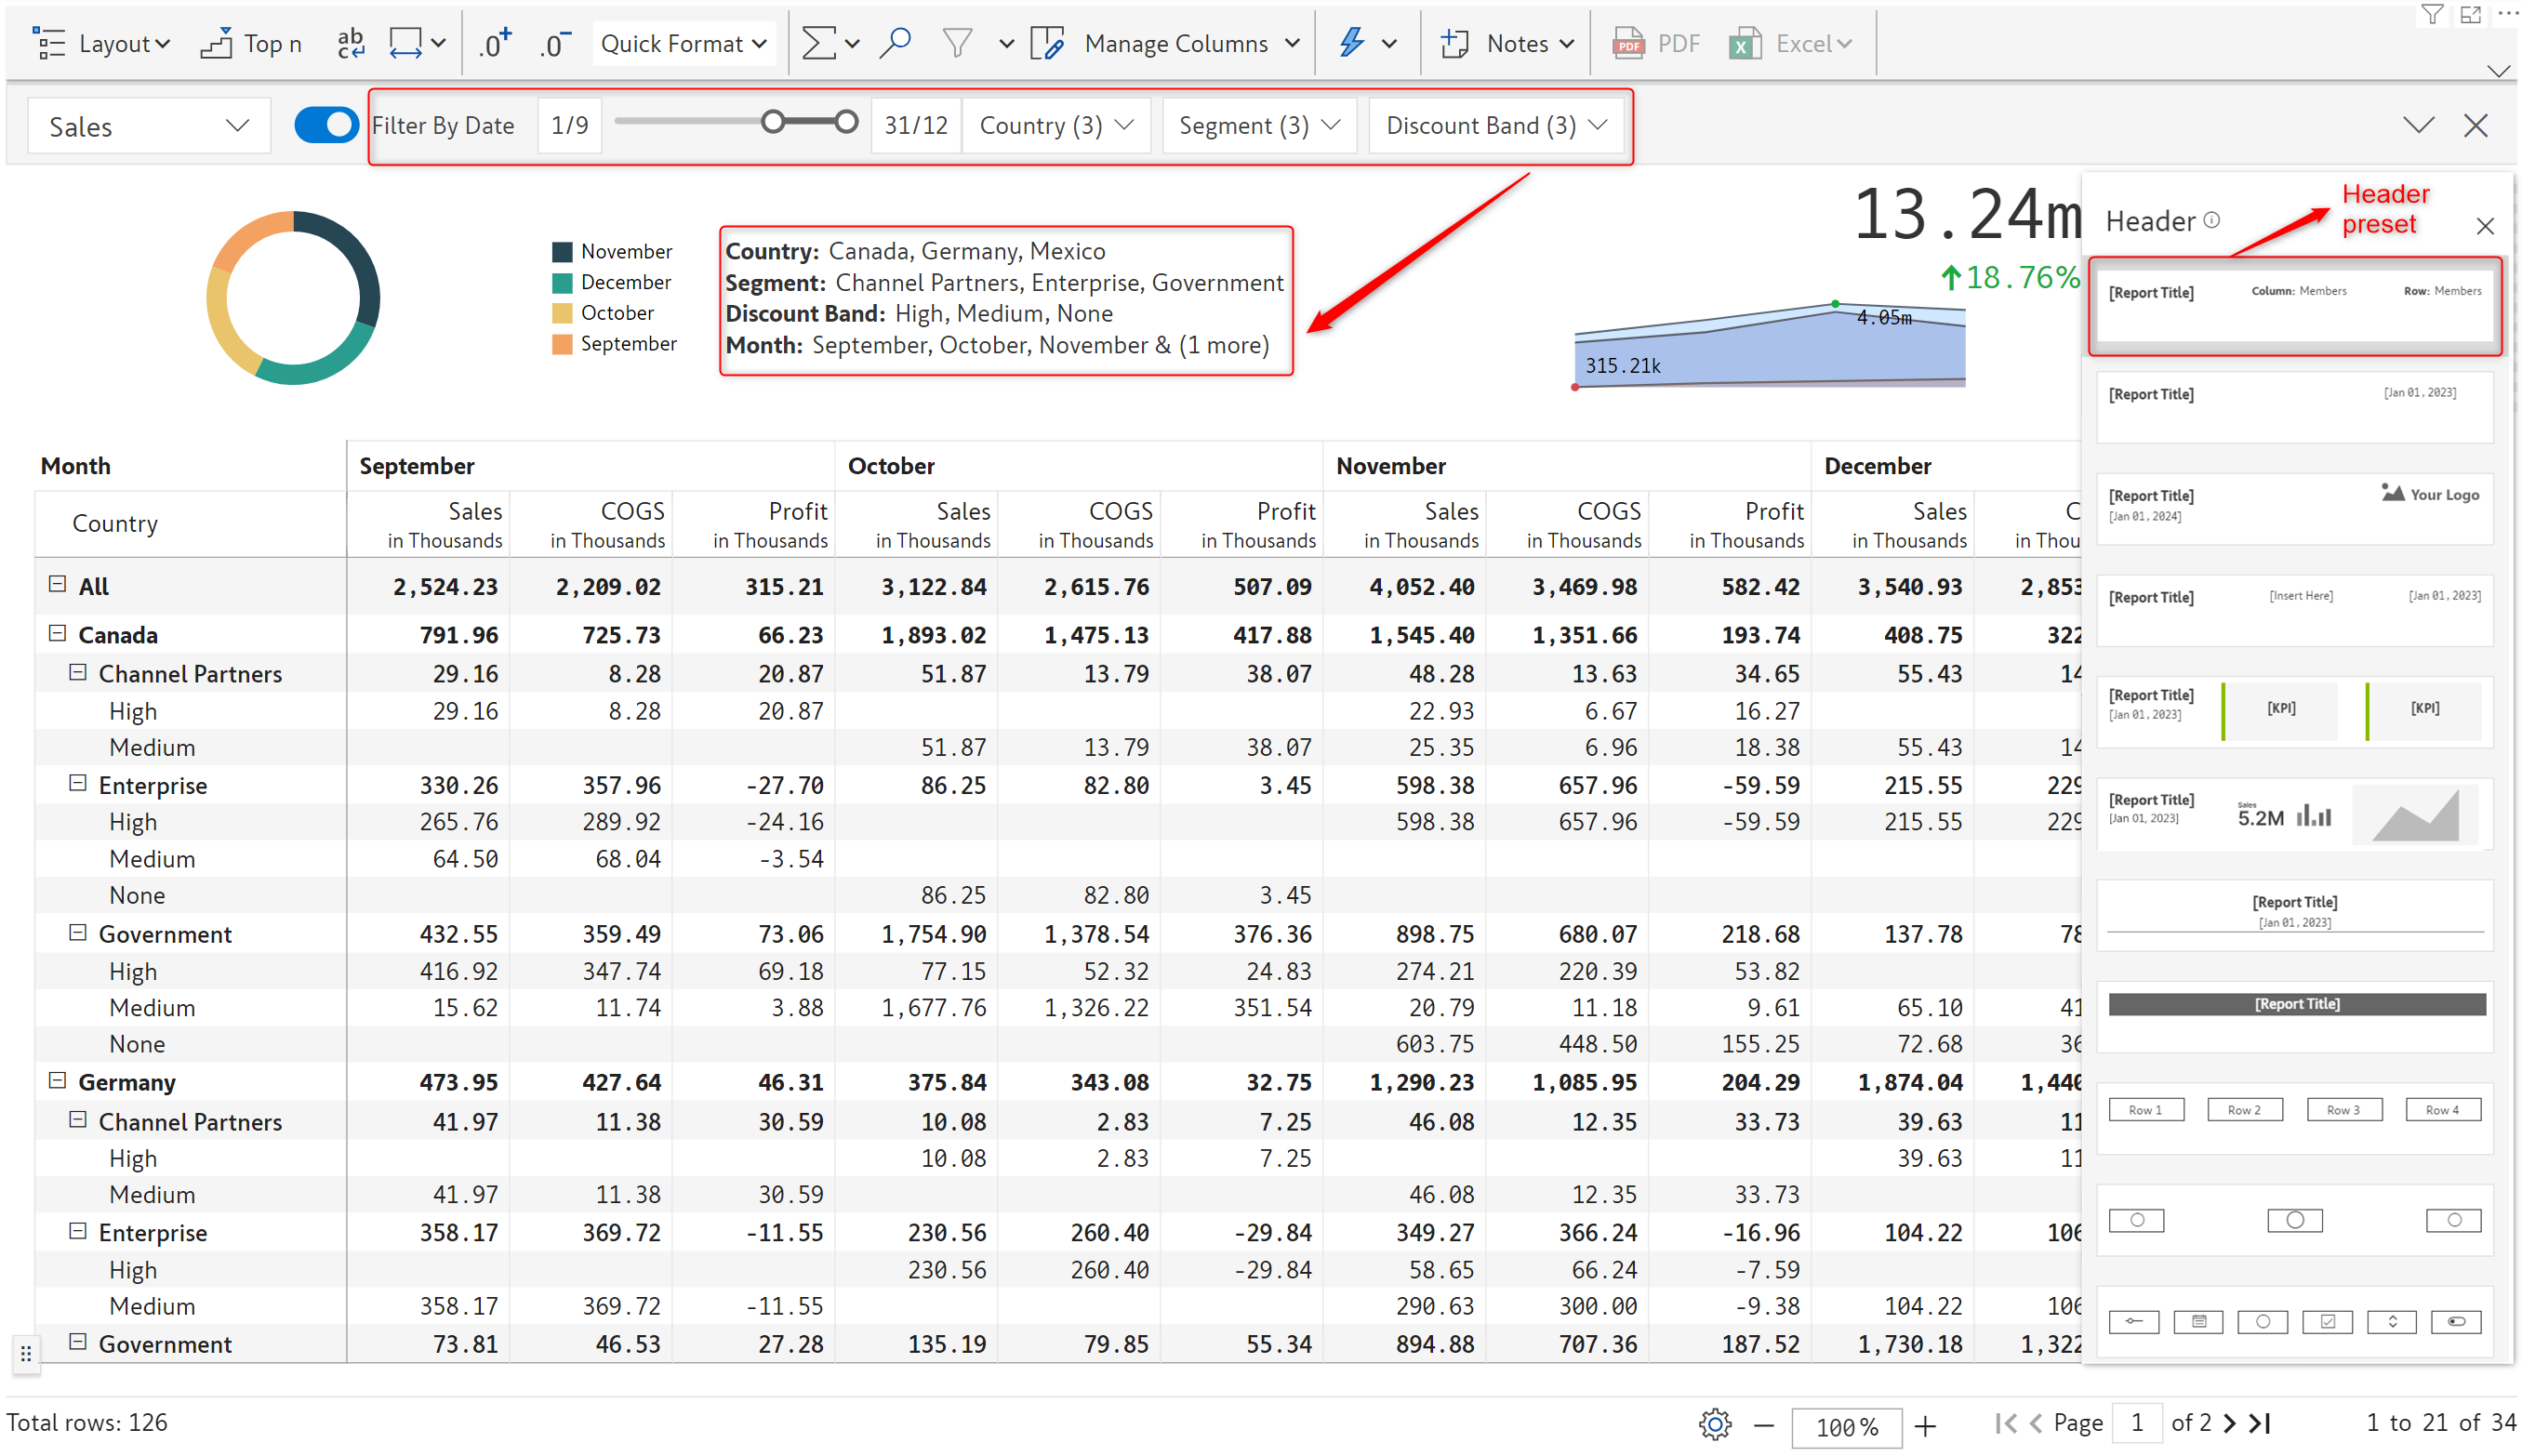
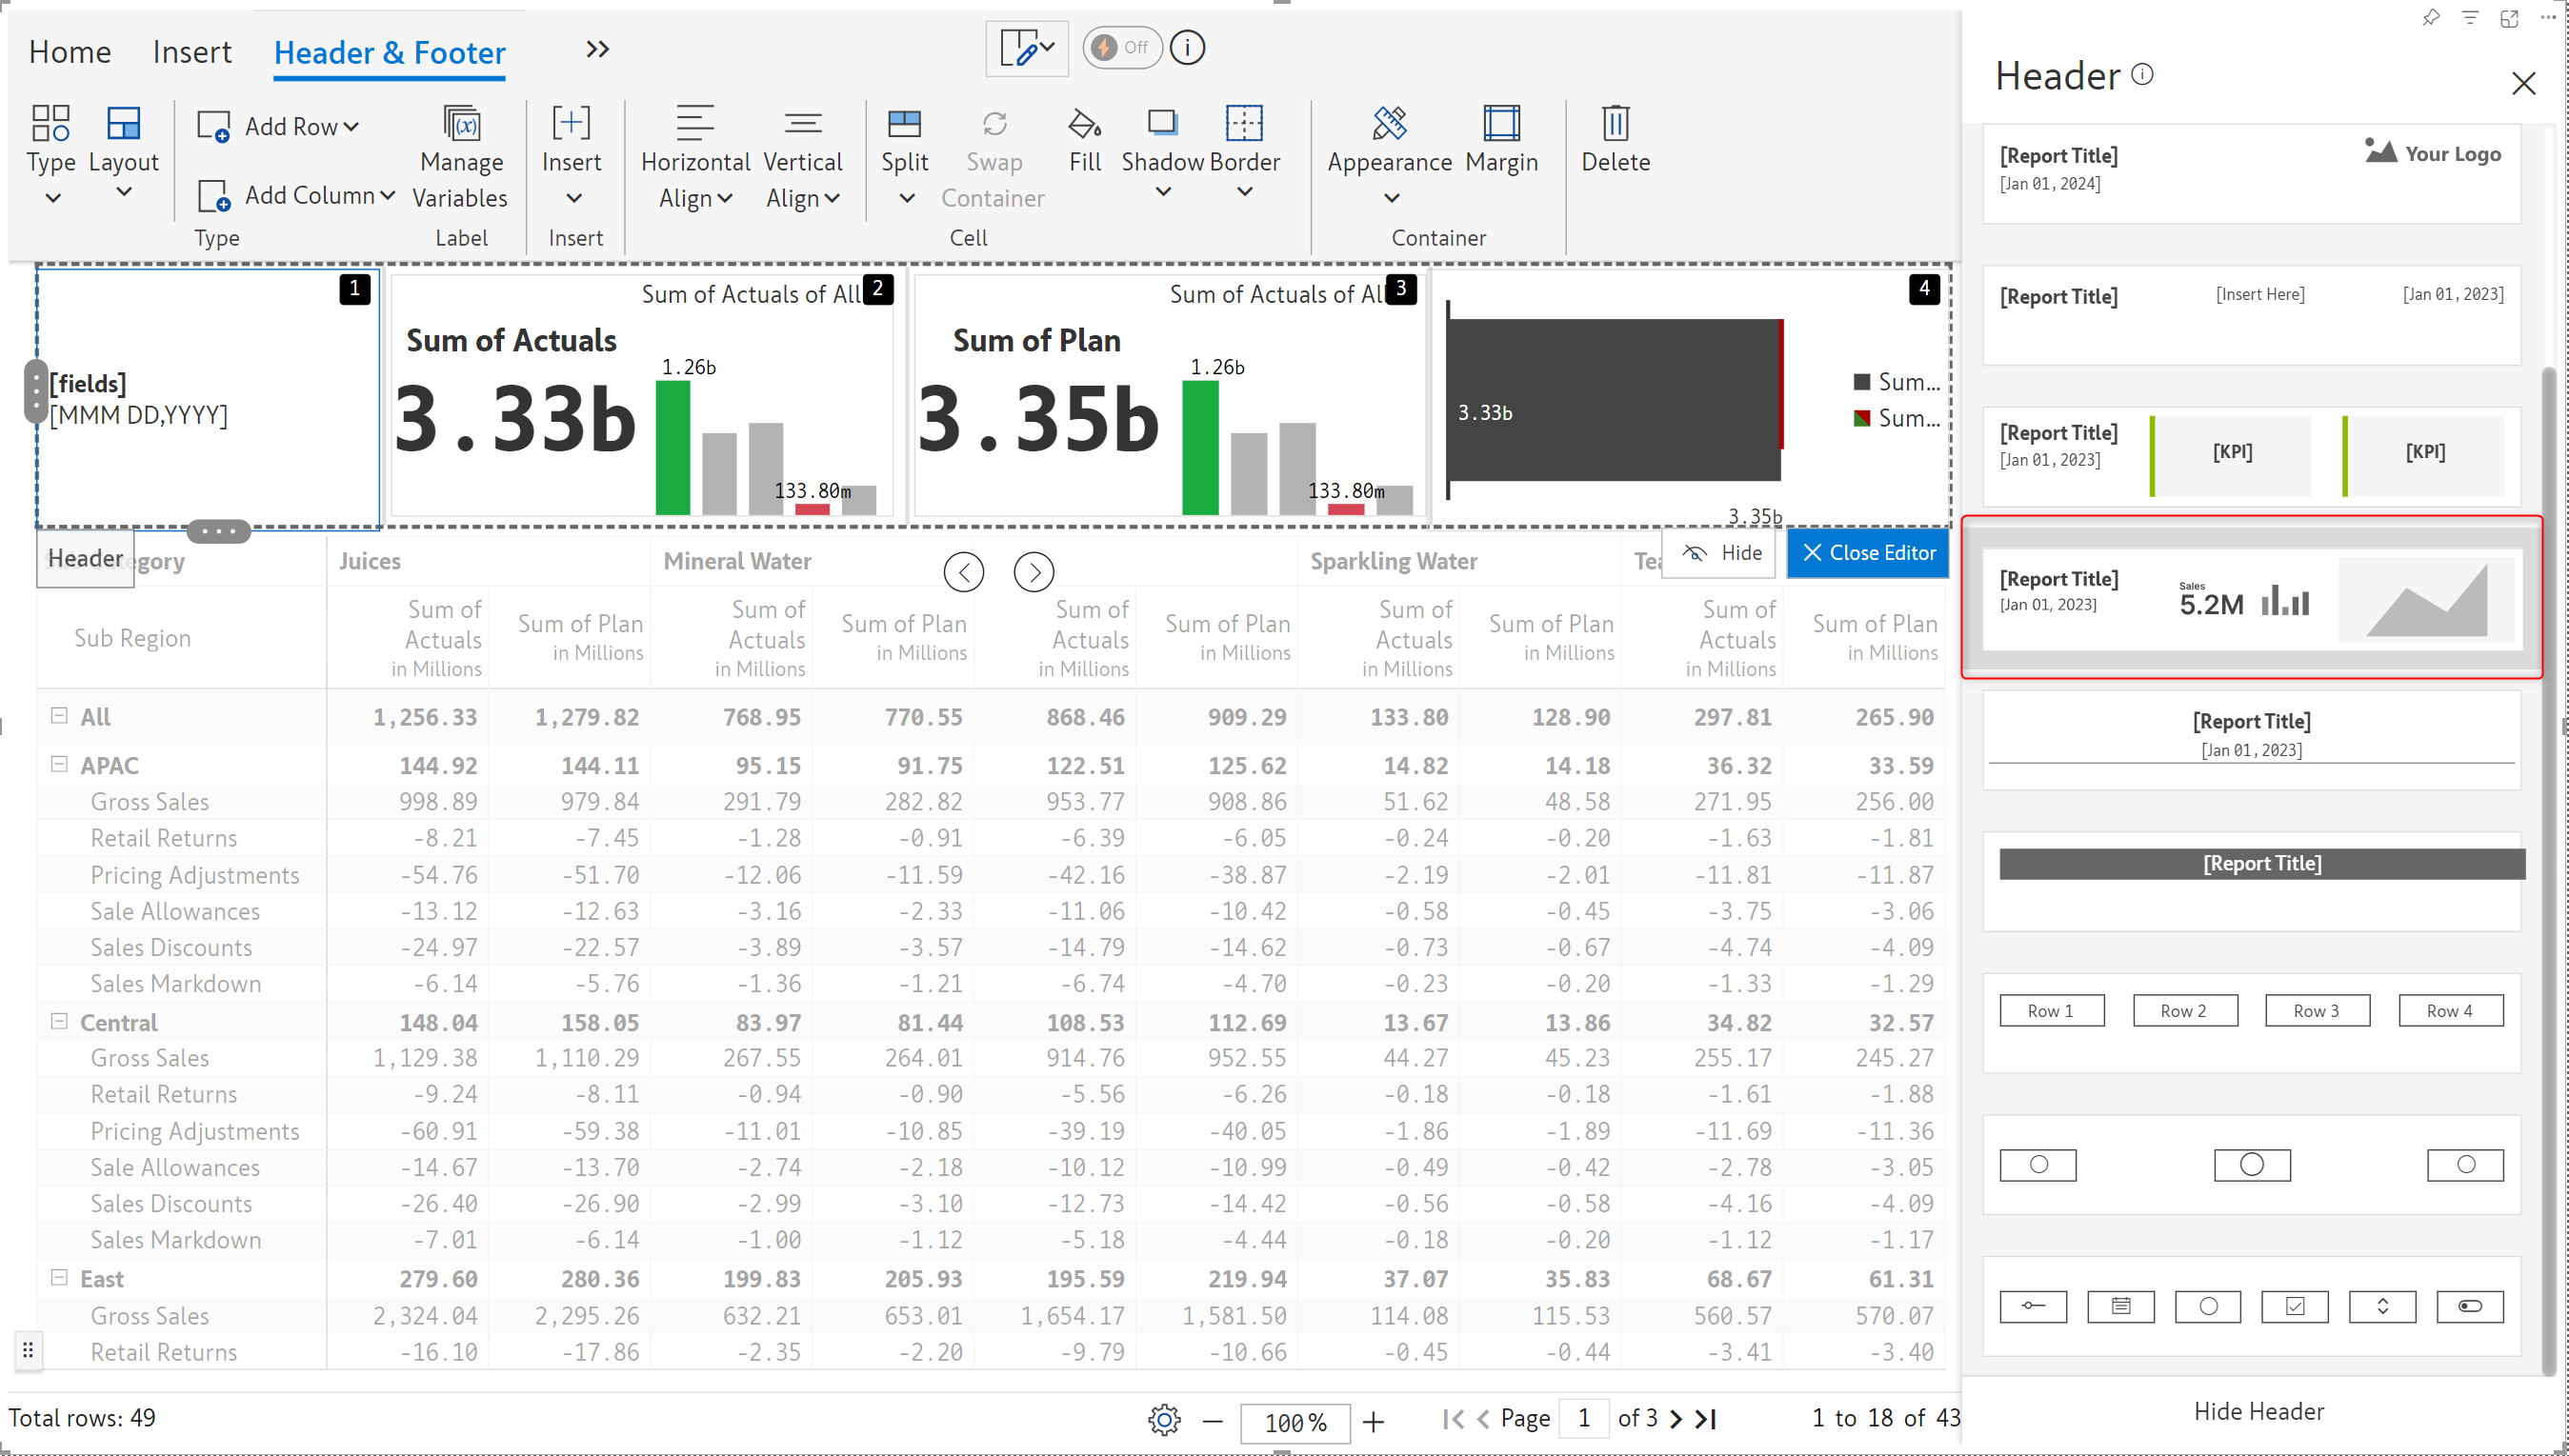
In the February release, we added a header preset that renders charts along with the KPIs. Adding visual elements to the header enables users to grasp the synopsis of the report at a glance. The type of chart is dynamically rendered based on the number of measures.
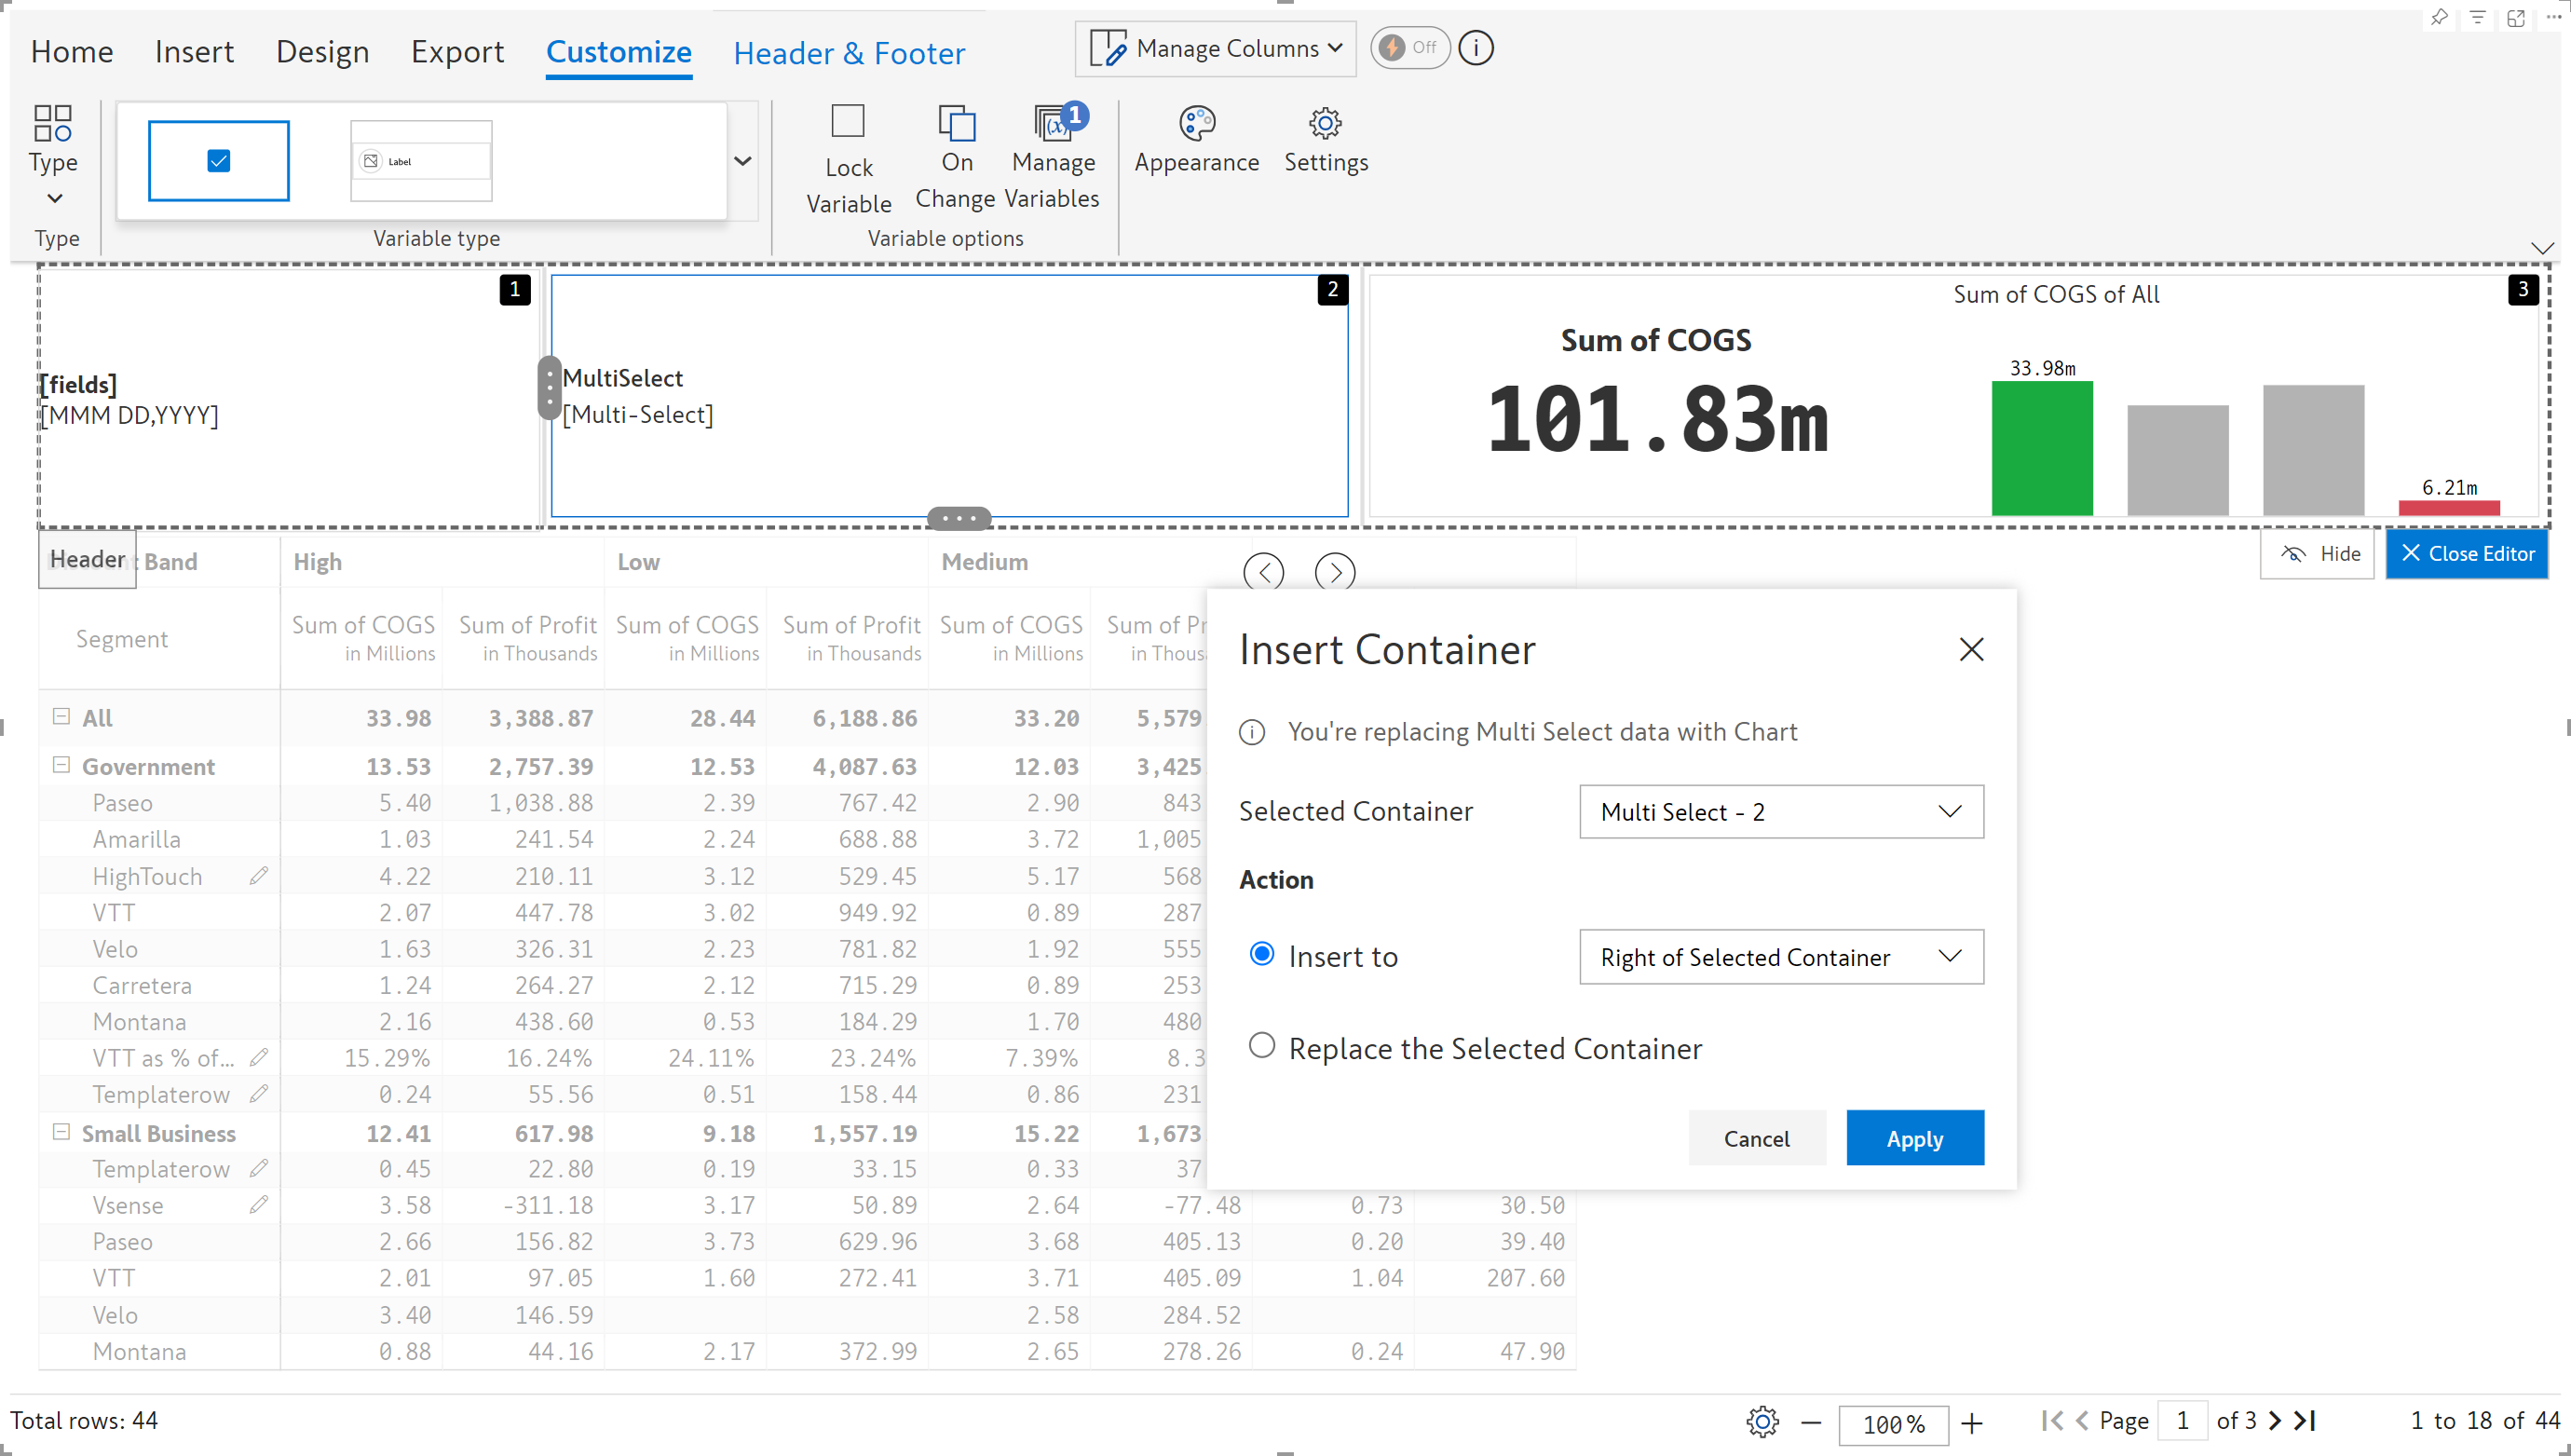
With Inforiver, you can divide your header into multiple containers and use charts, text, images, and KPIs to customize each container. When you edit a header container, you now have options to
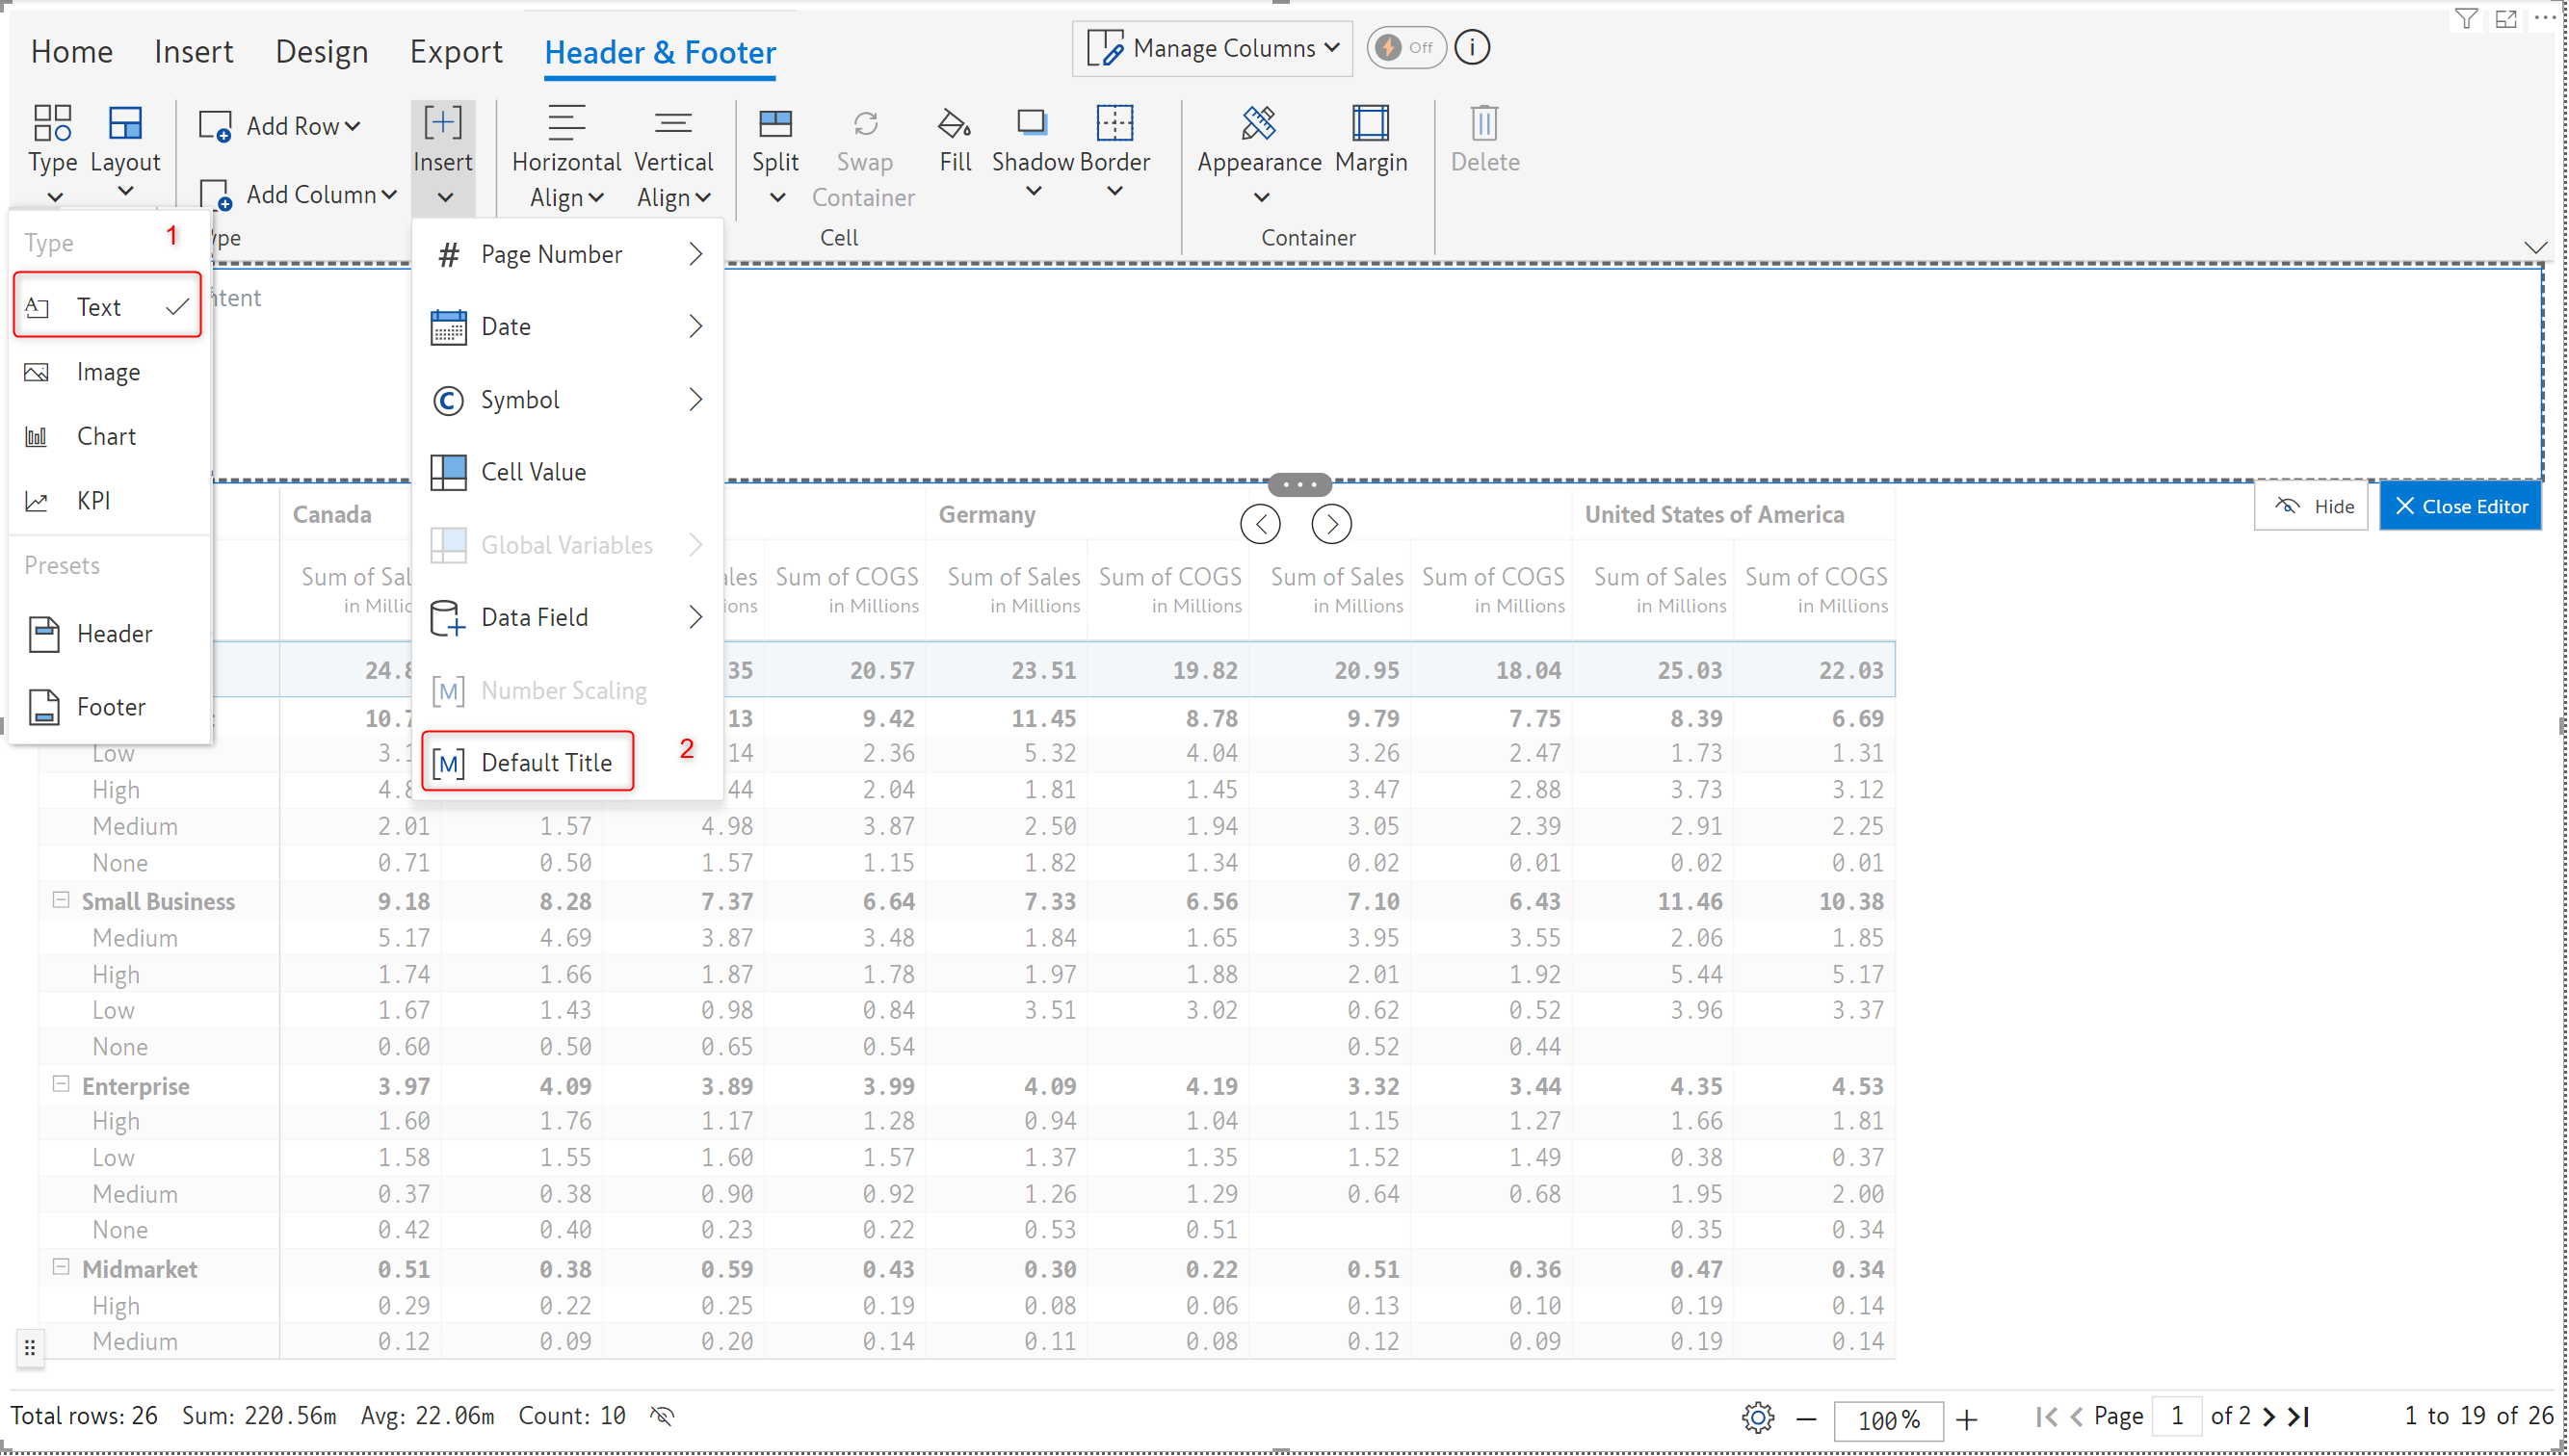
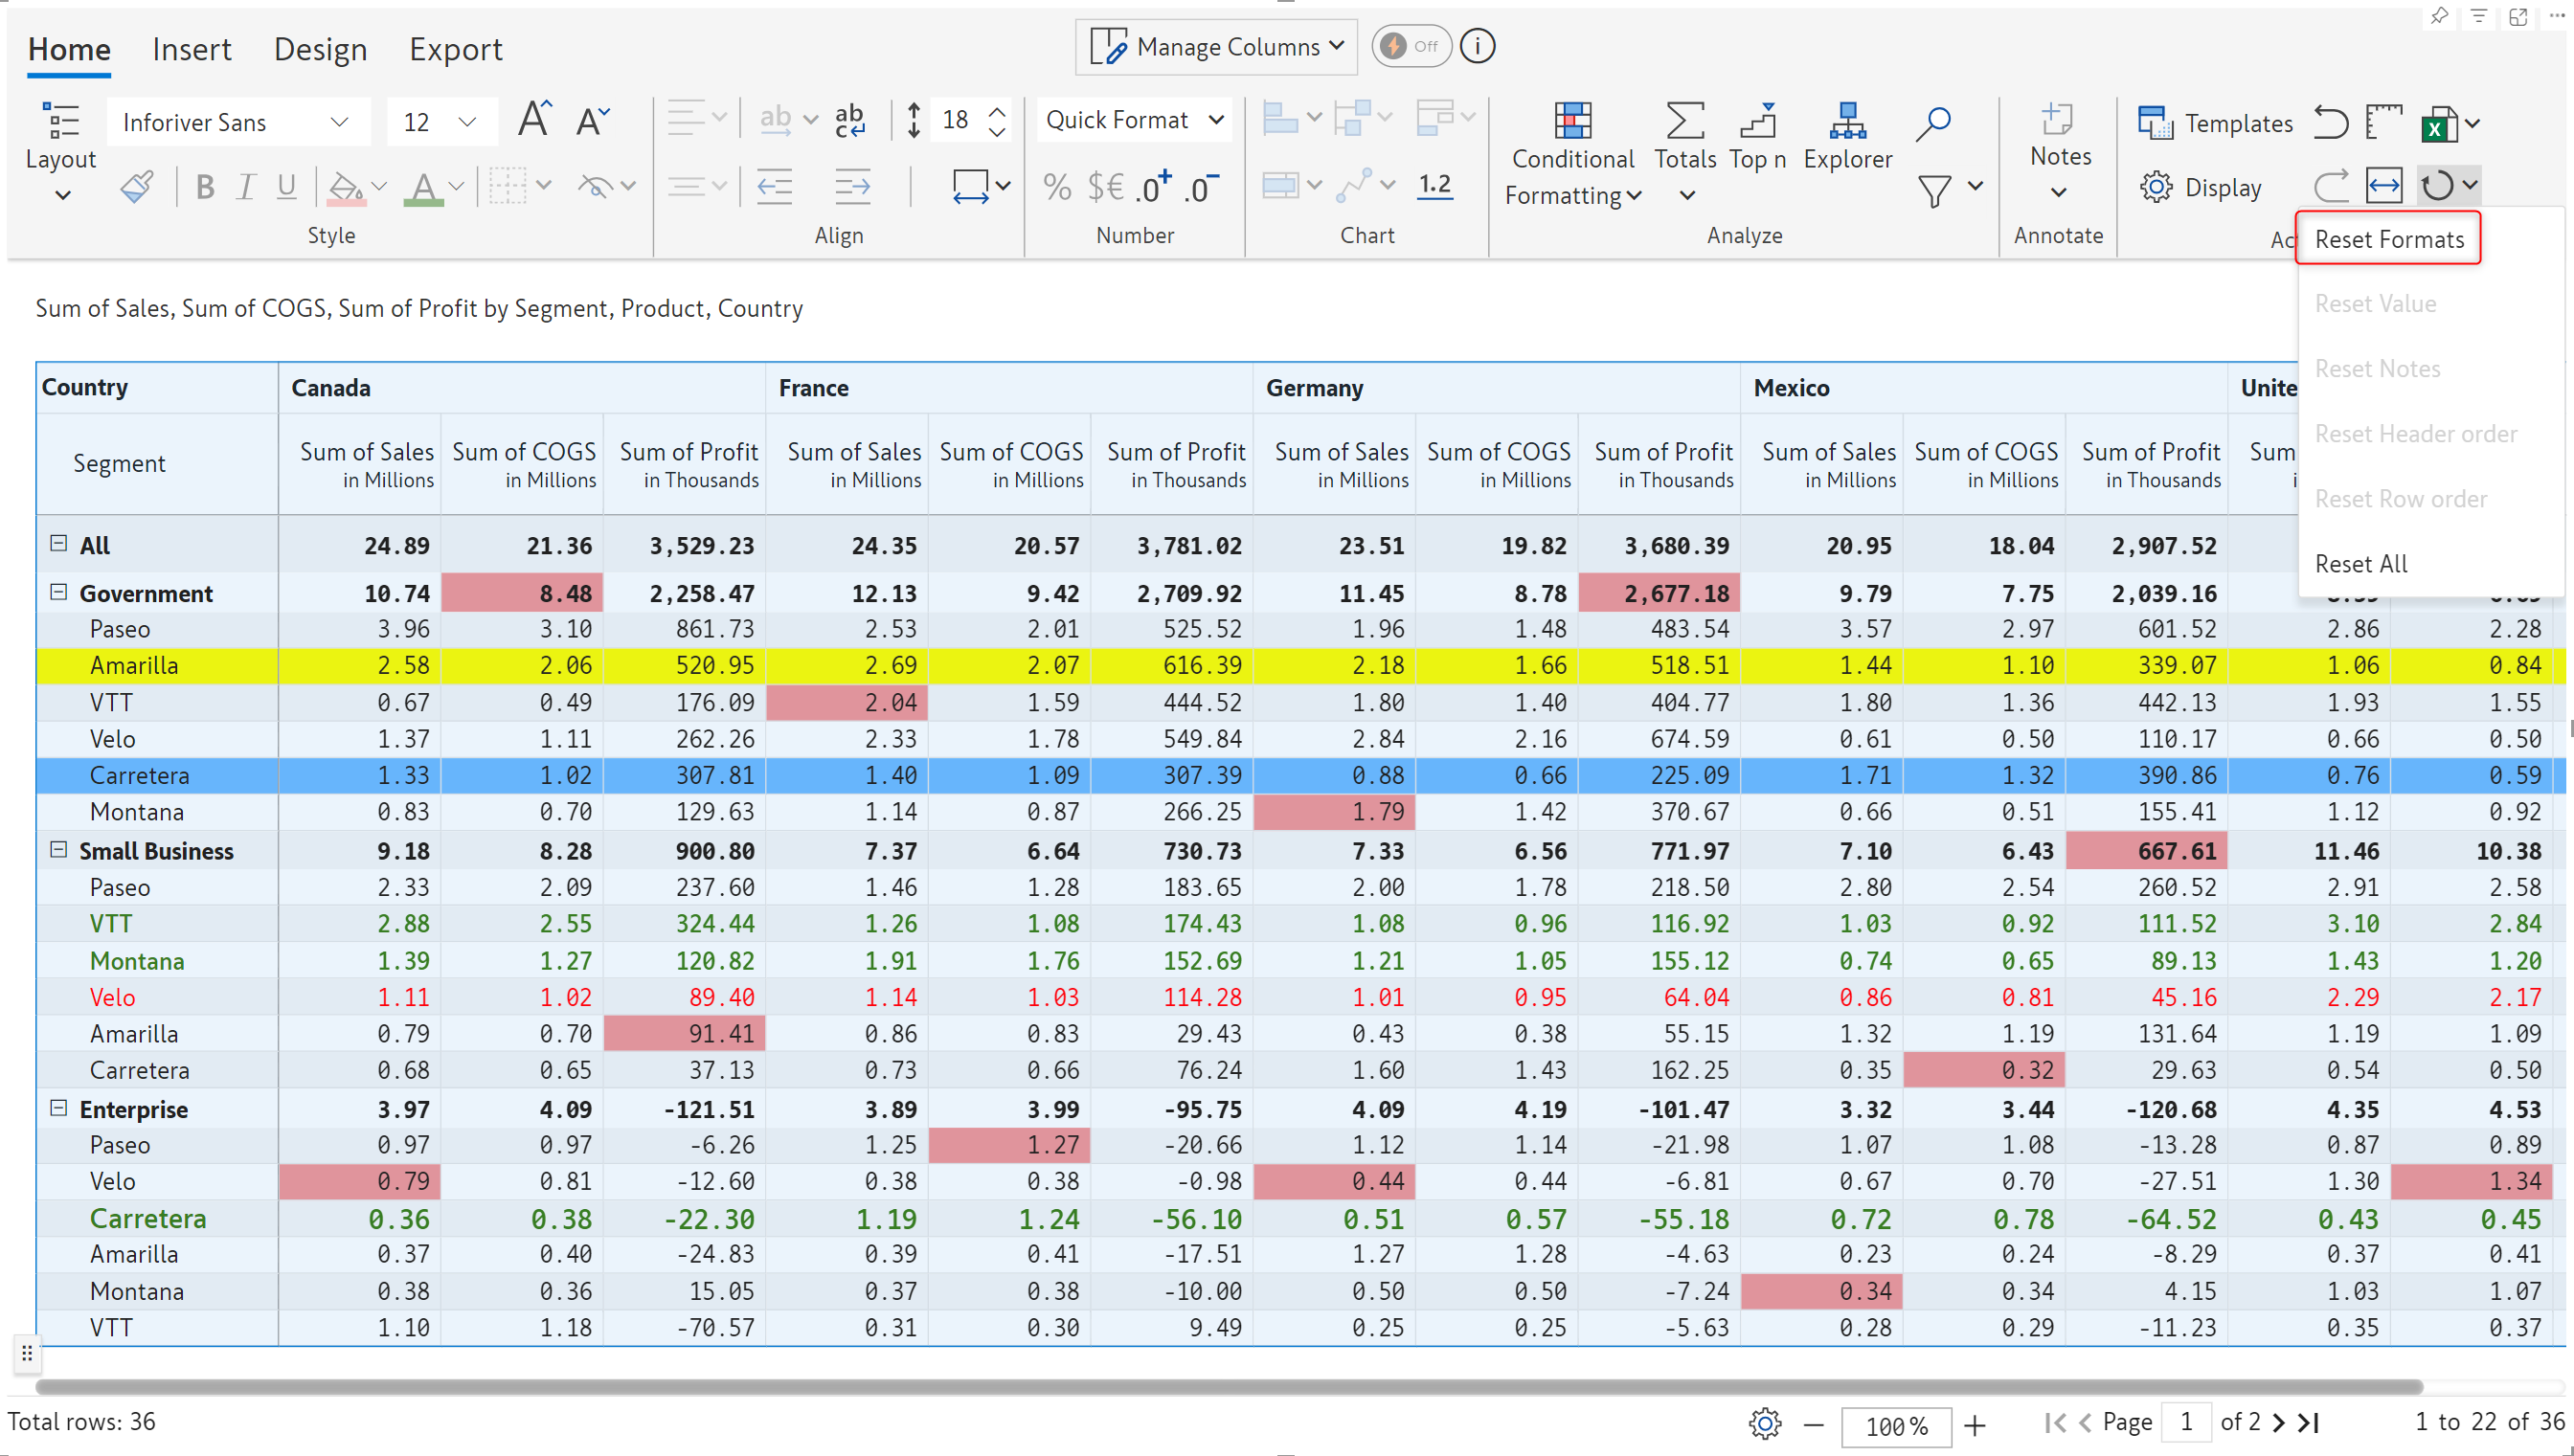
You can reset any changes made to the title. Select ‘Text’ from the Type dropdown in the Header & Footer ribbon, then select ‘Default Title’ from the Insert dropdown.
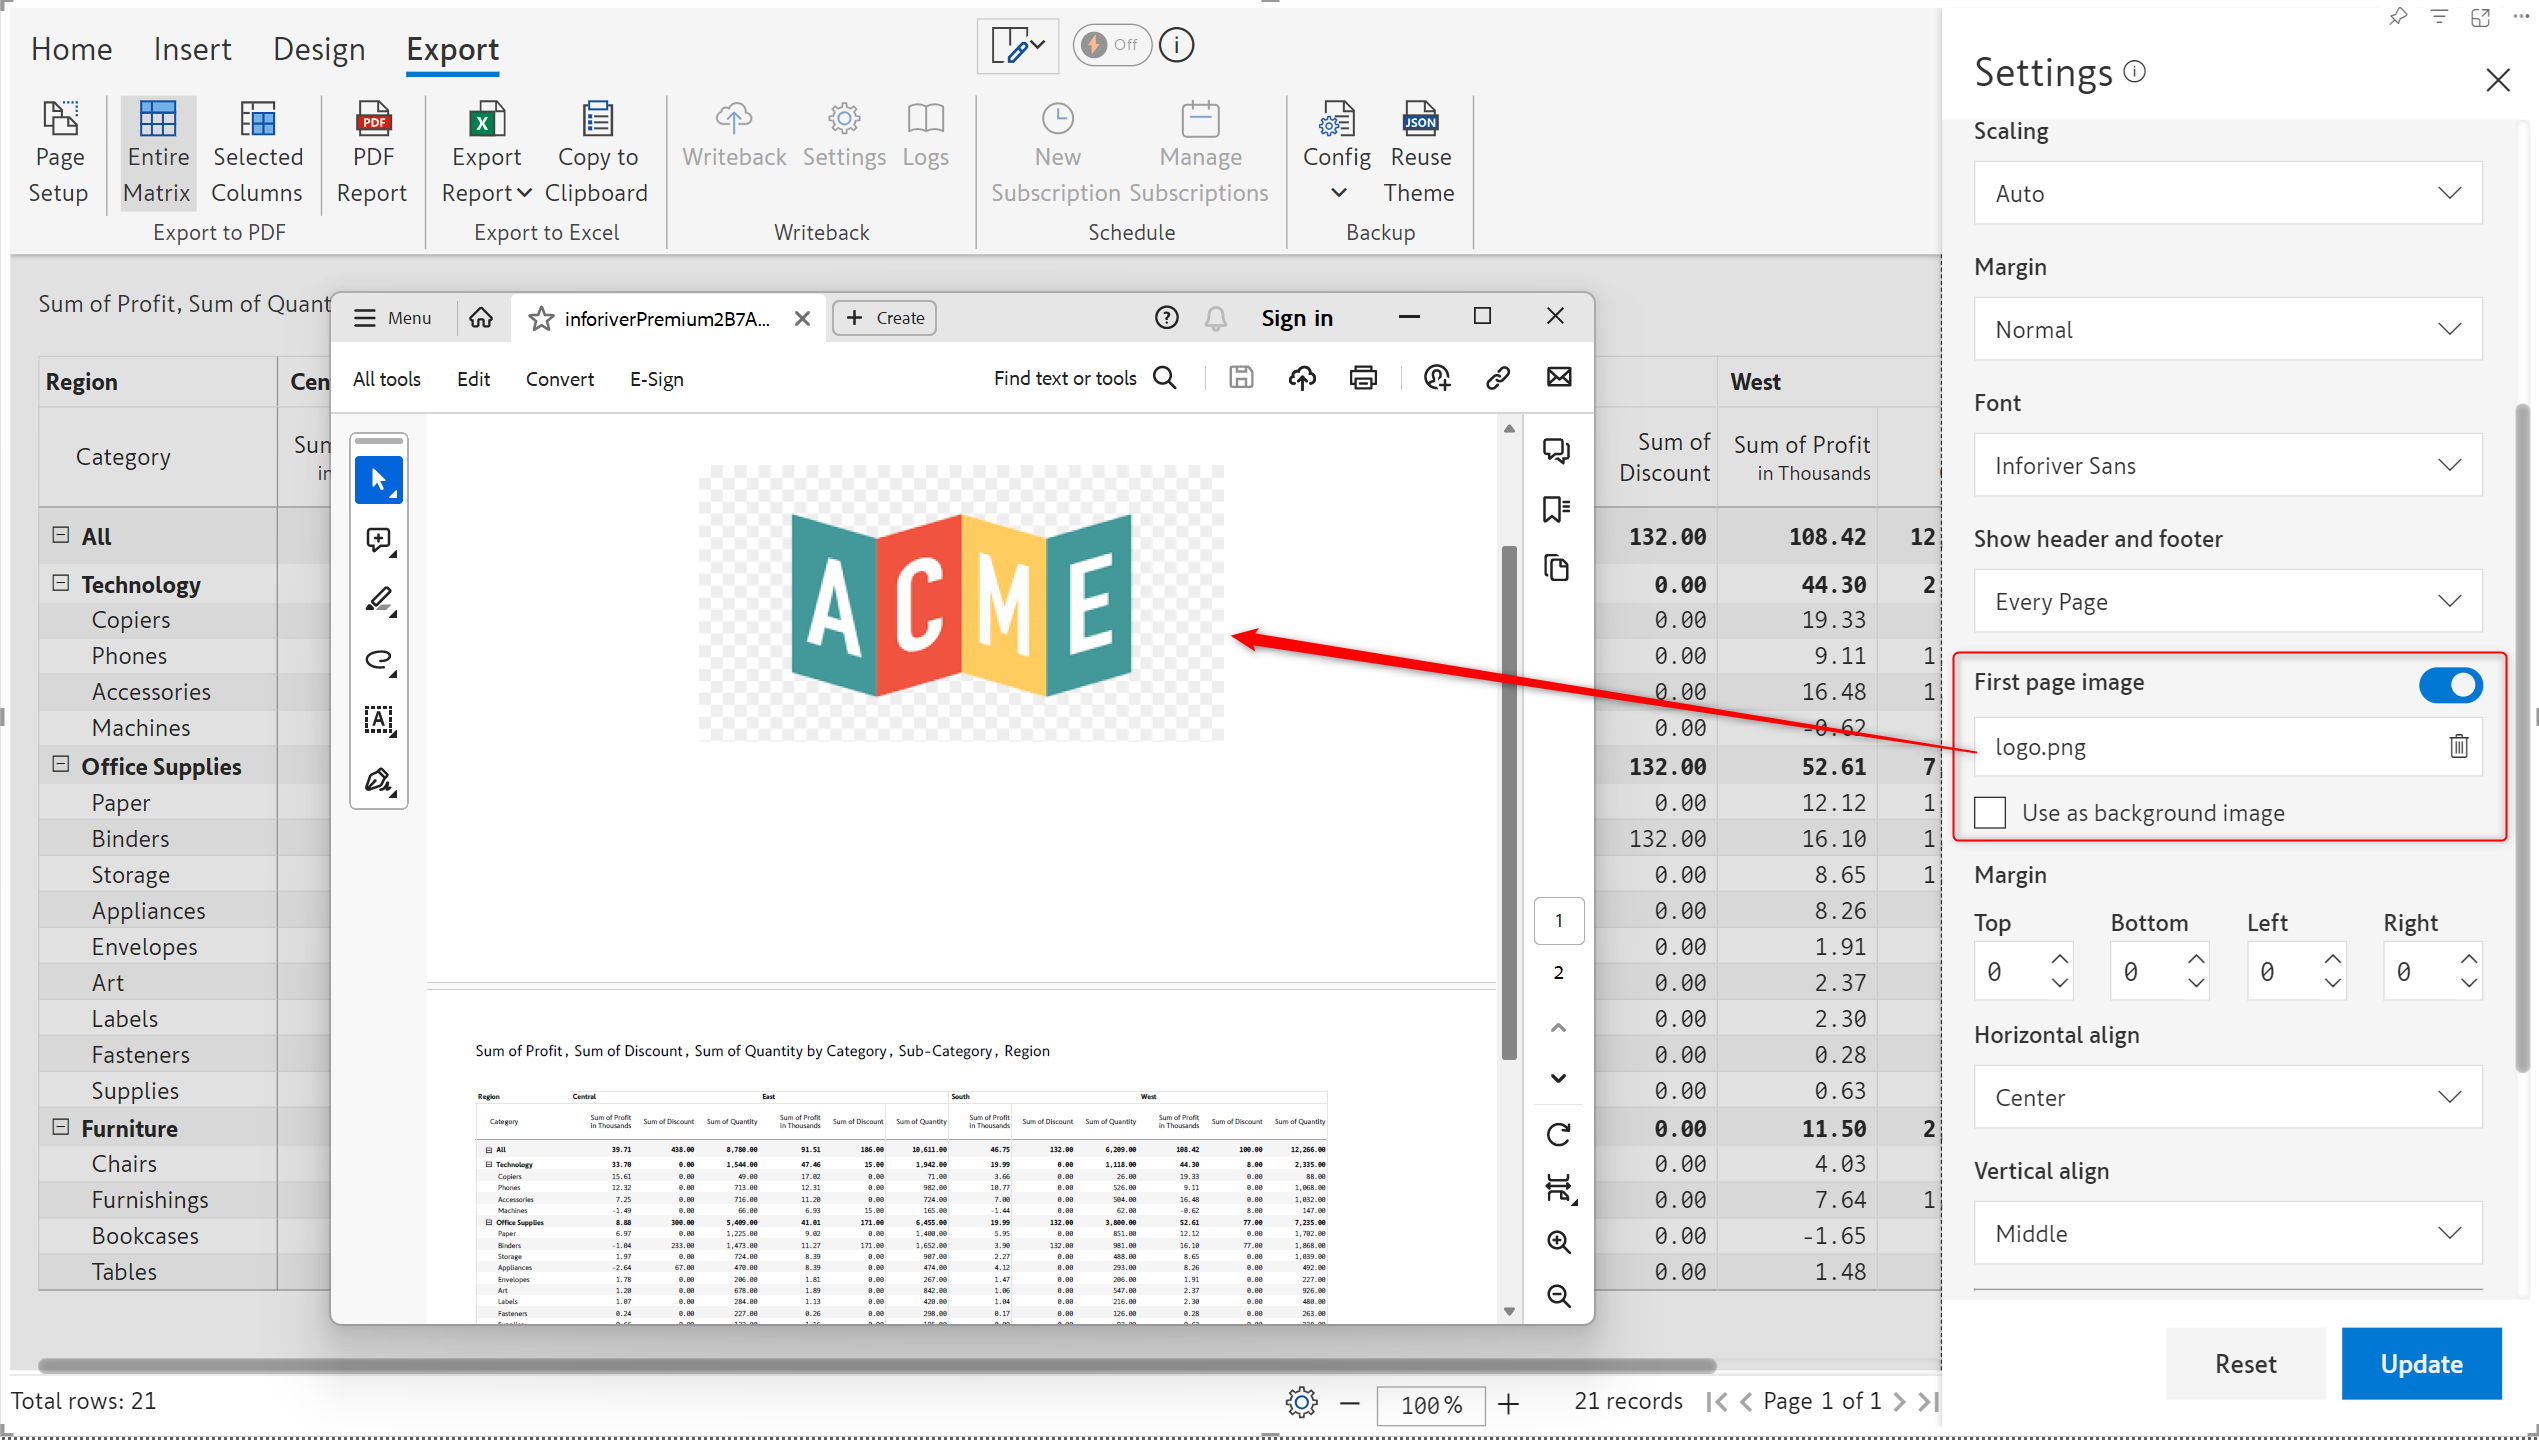
Cover pages are important for enhancing the presentation, branding, and usability of reports. Inforiver gives you the option of creating a custom report cover page when you export it. You can import an image and use it as a cover image.
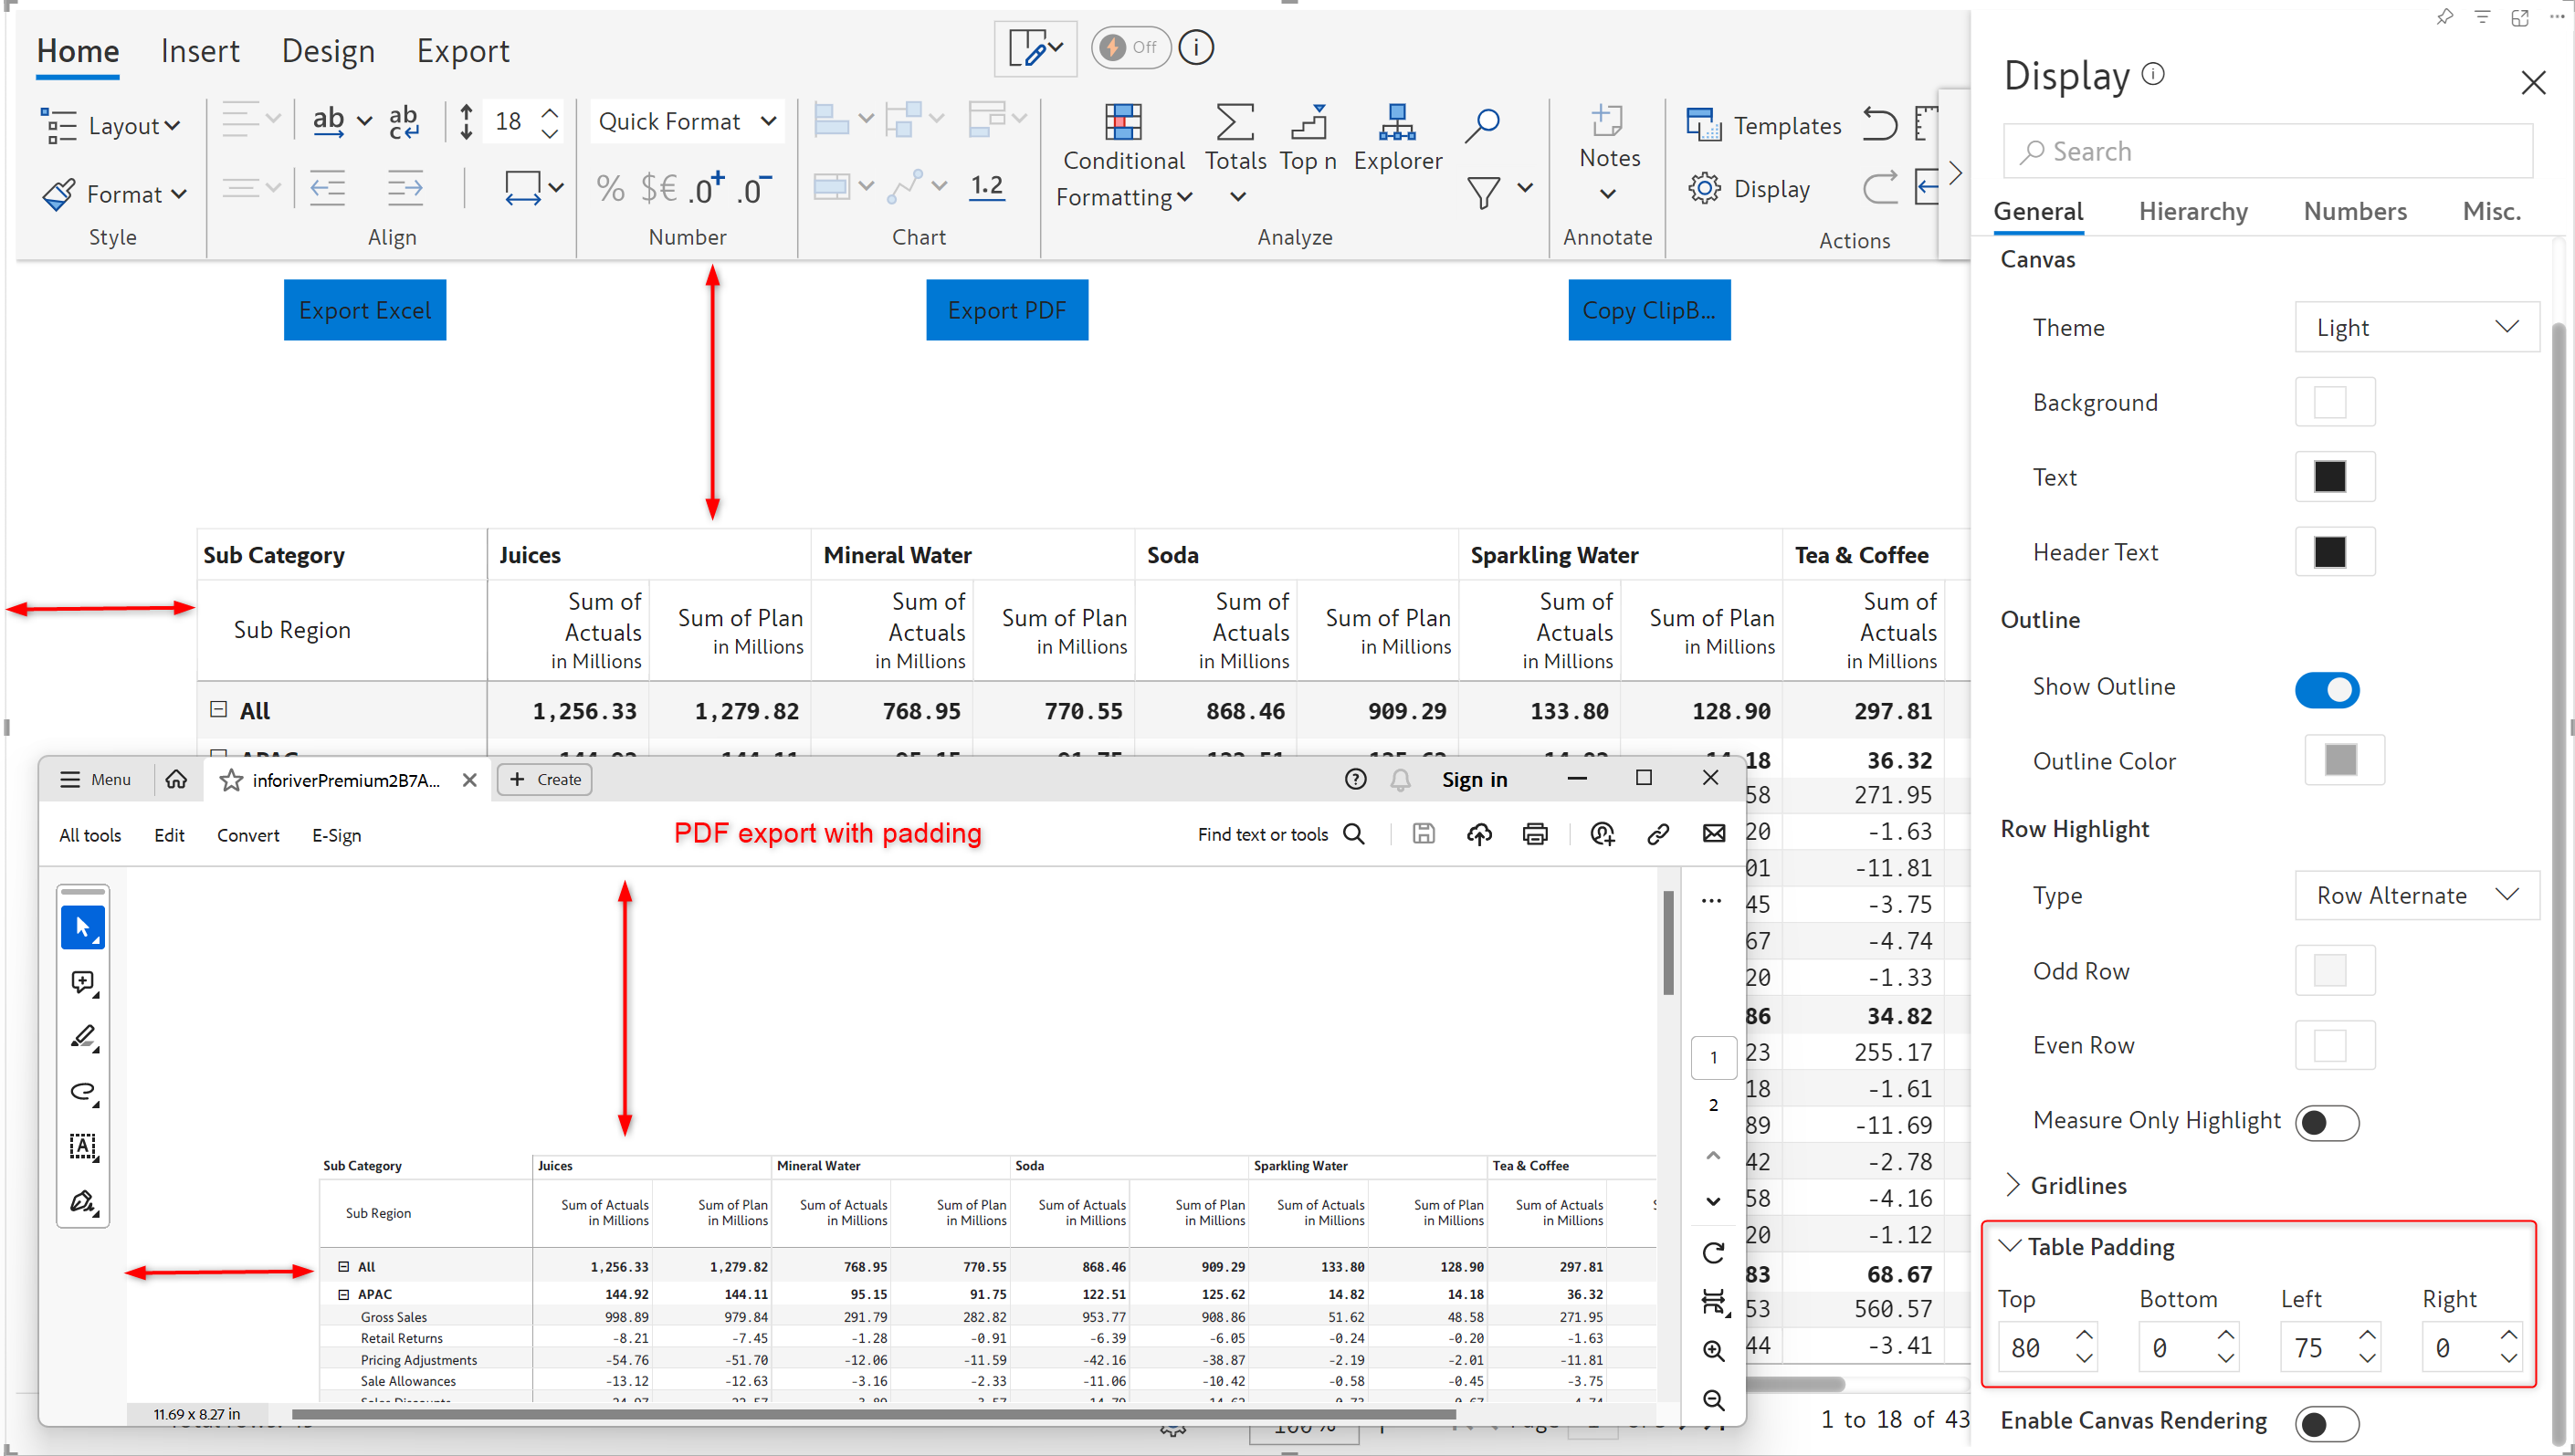
Inforiver inherently supports fully formatted PDF exports. In the latest version, if you have applied table padding in your report, it will be carried forward to the export as well.
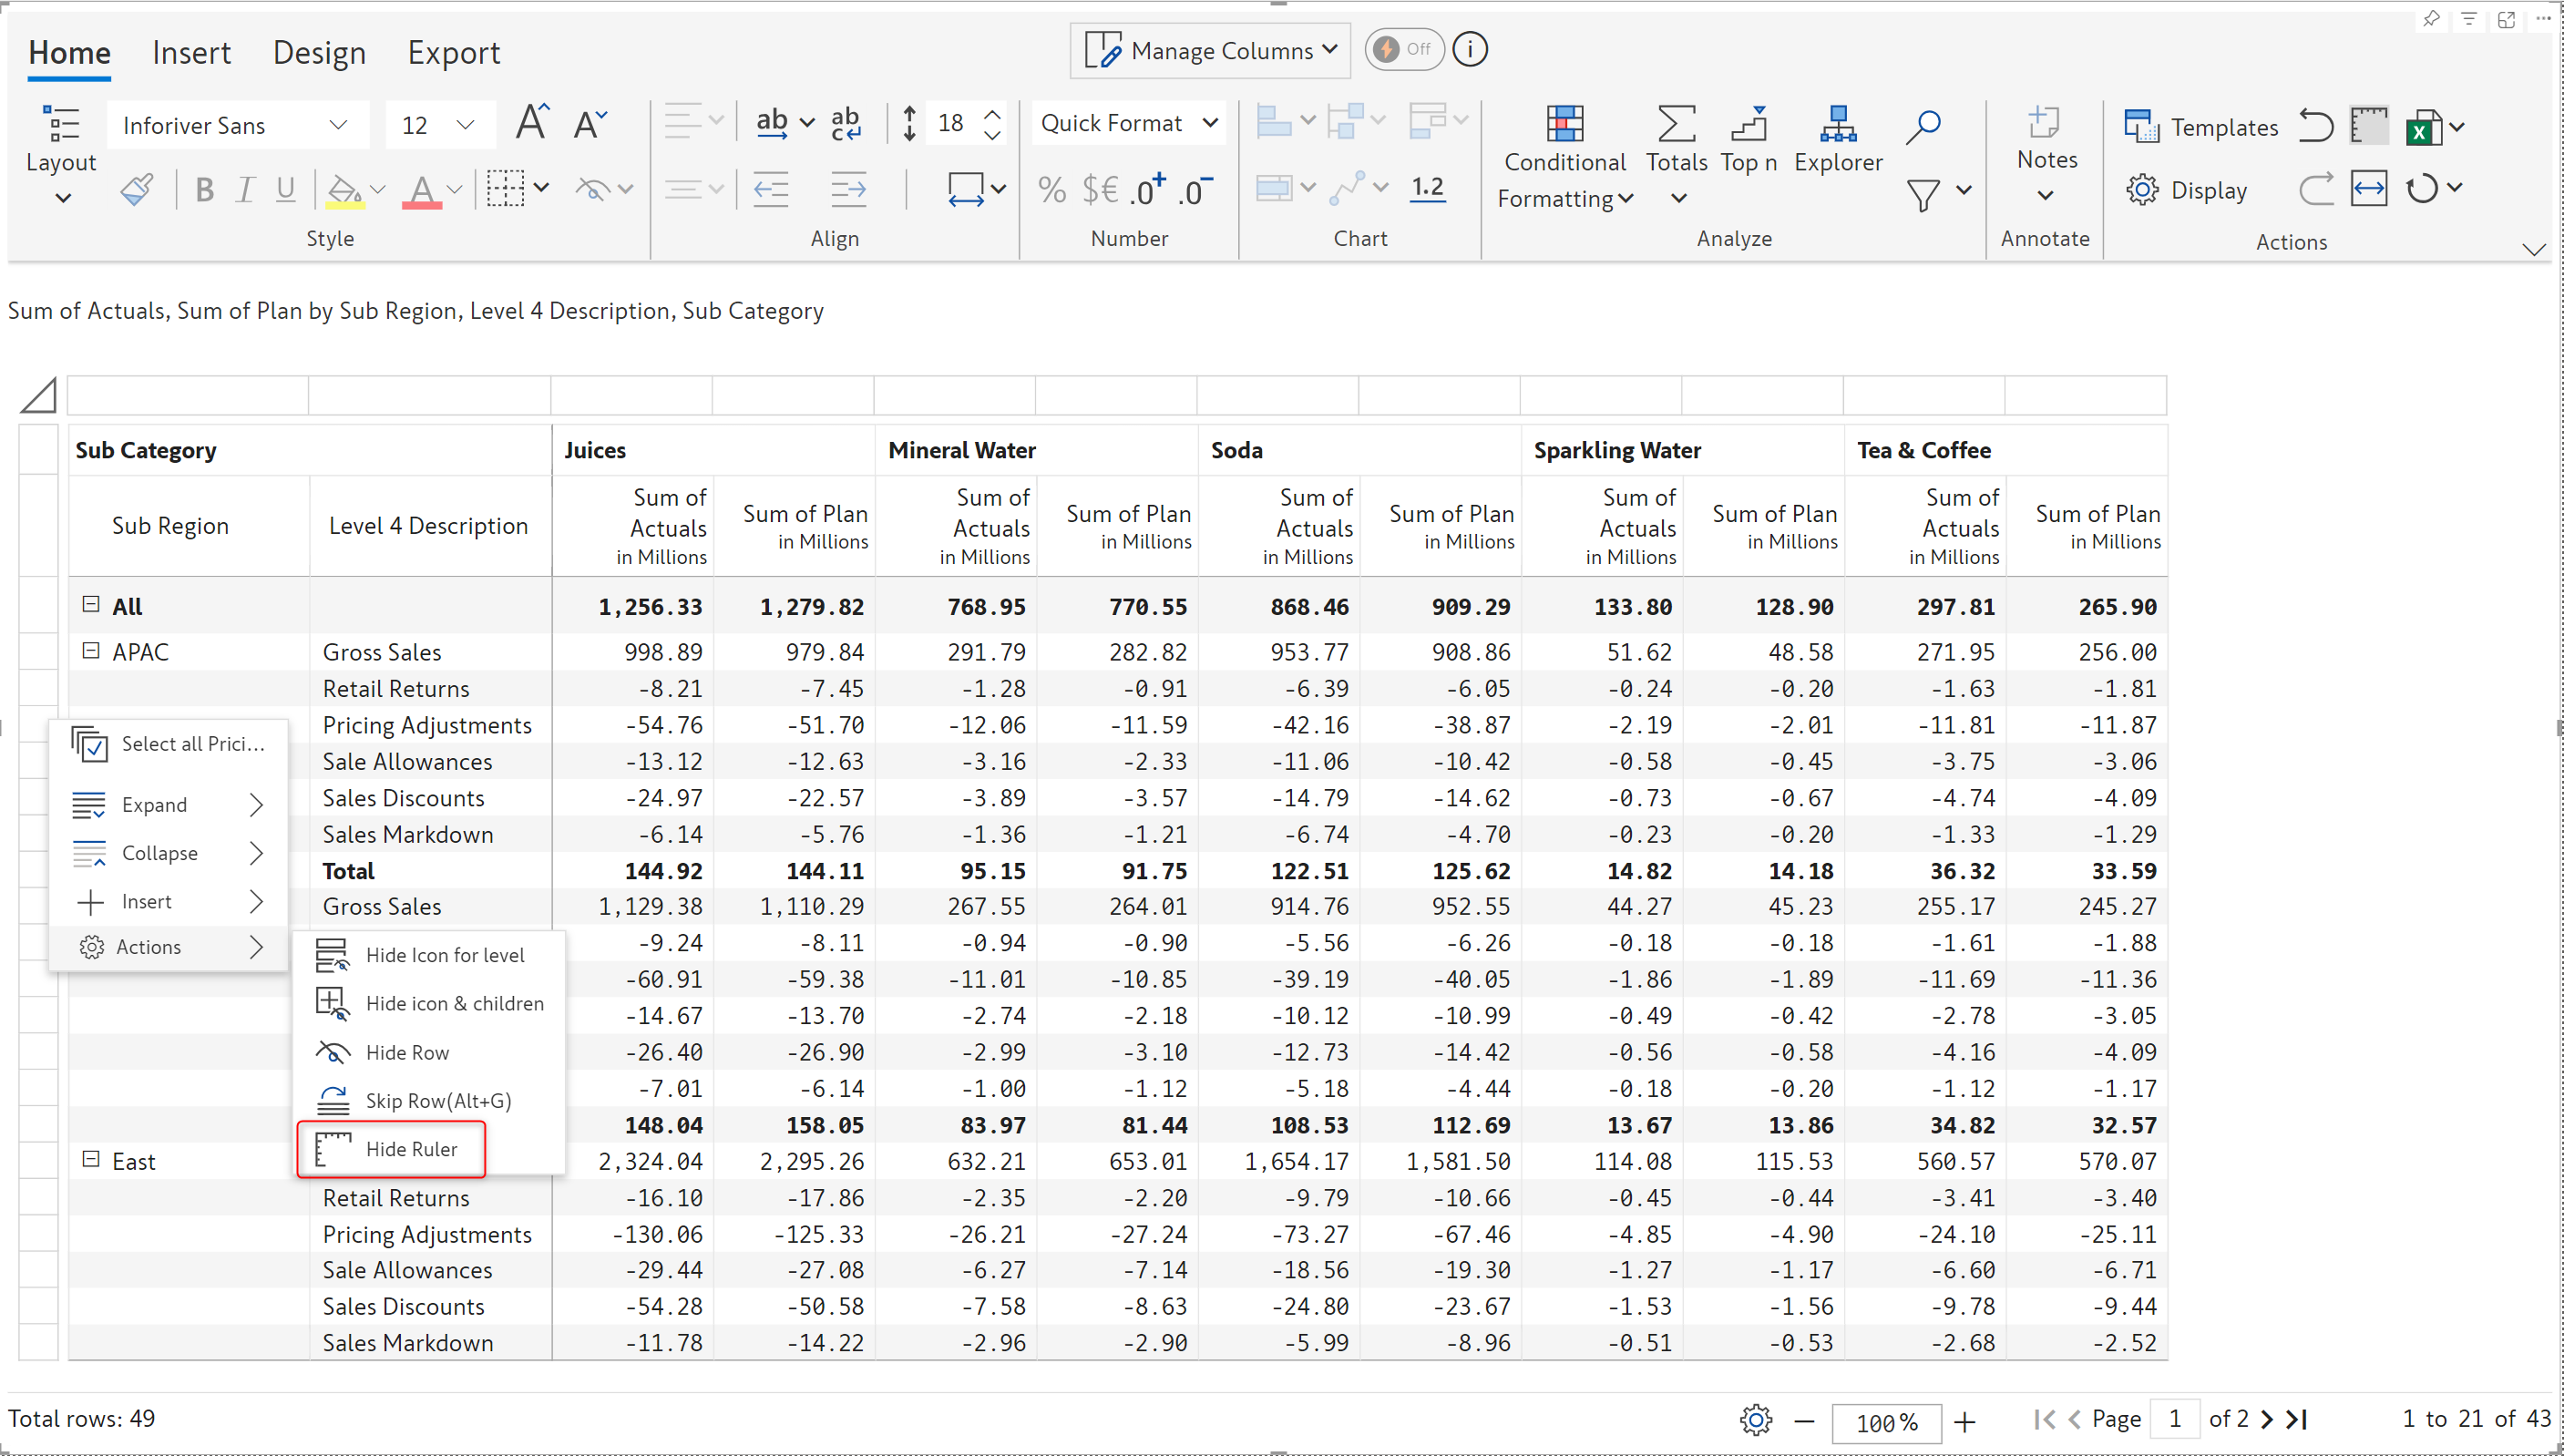
In the Table and Stepped layouts, rails are displayed in the report by default. Rails ensure that the selection and resizing of columns and rows is convenient and straightforward. If you do not require rails for formatting, a Hide ruler option has been added to the row gripper under the Actions section. This is primarily intended for report authors who are unaware of the rails option on the toolbar.
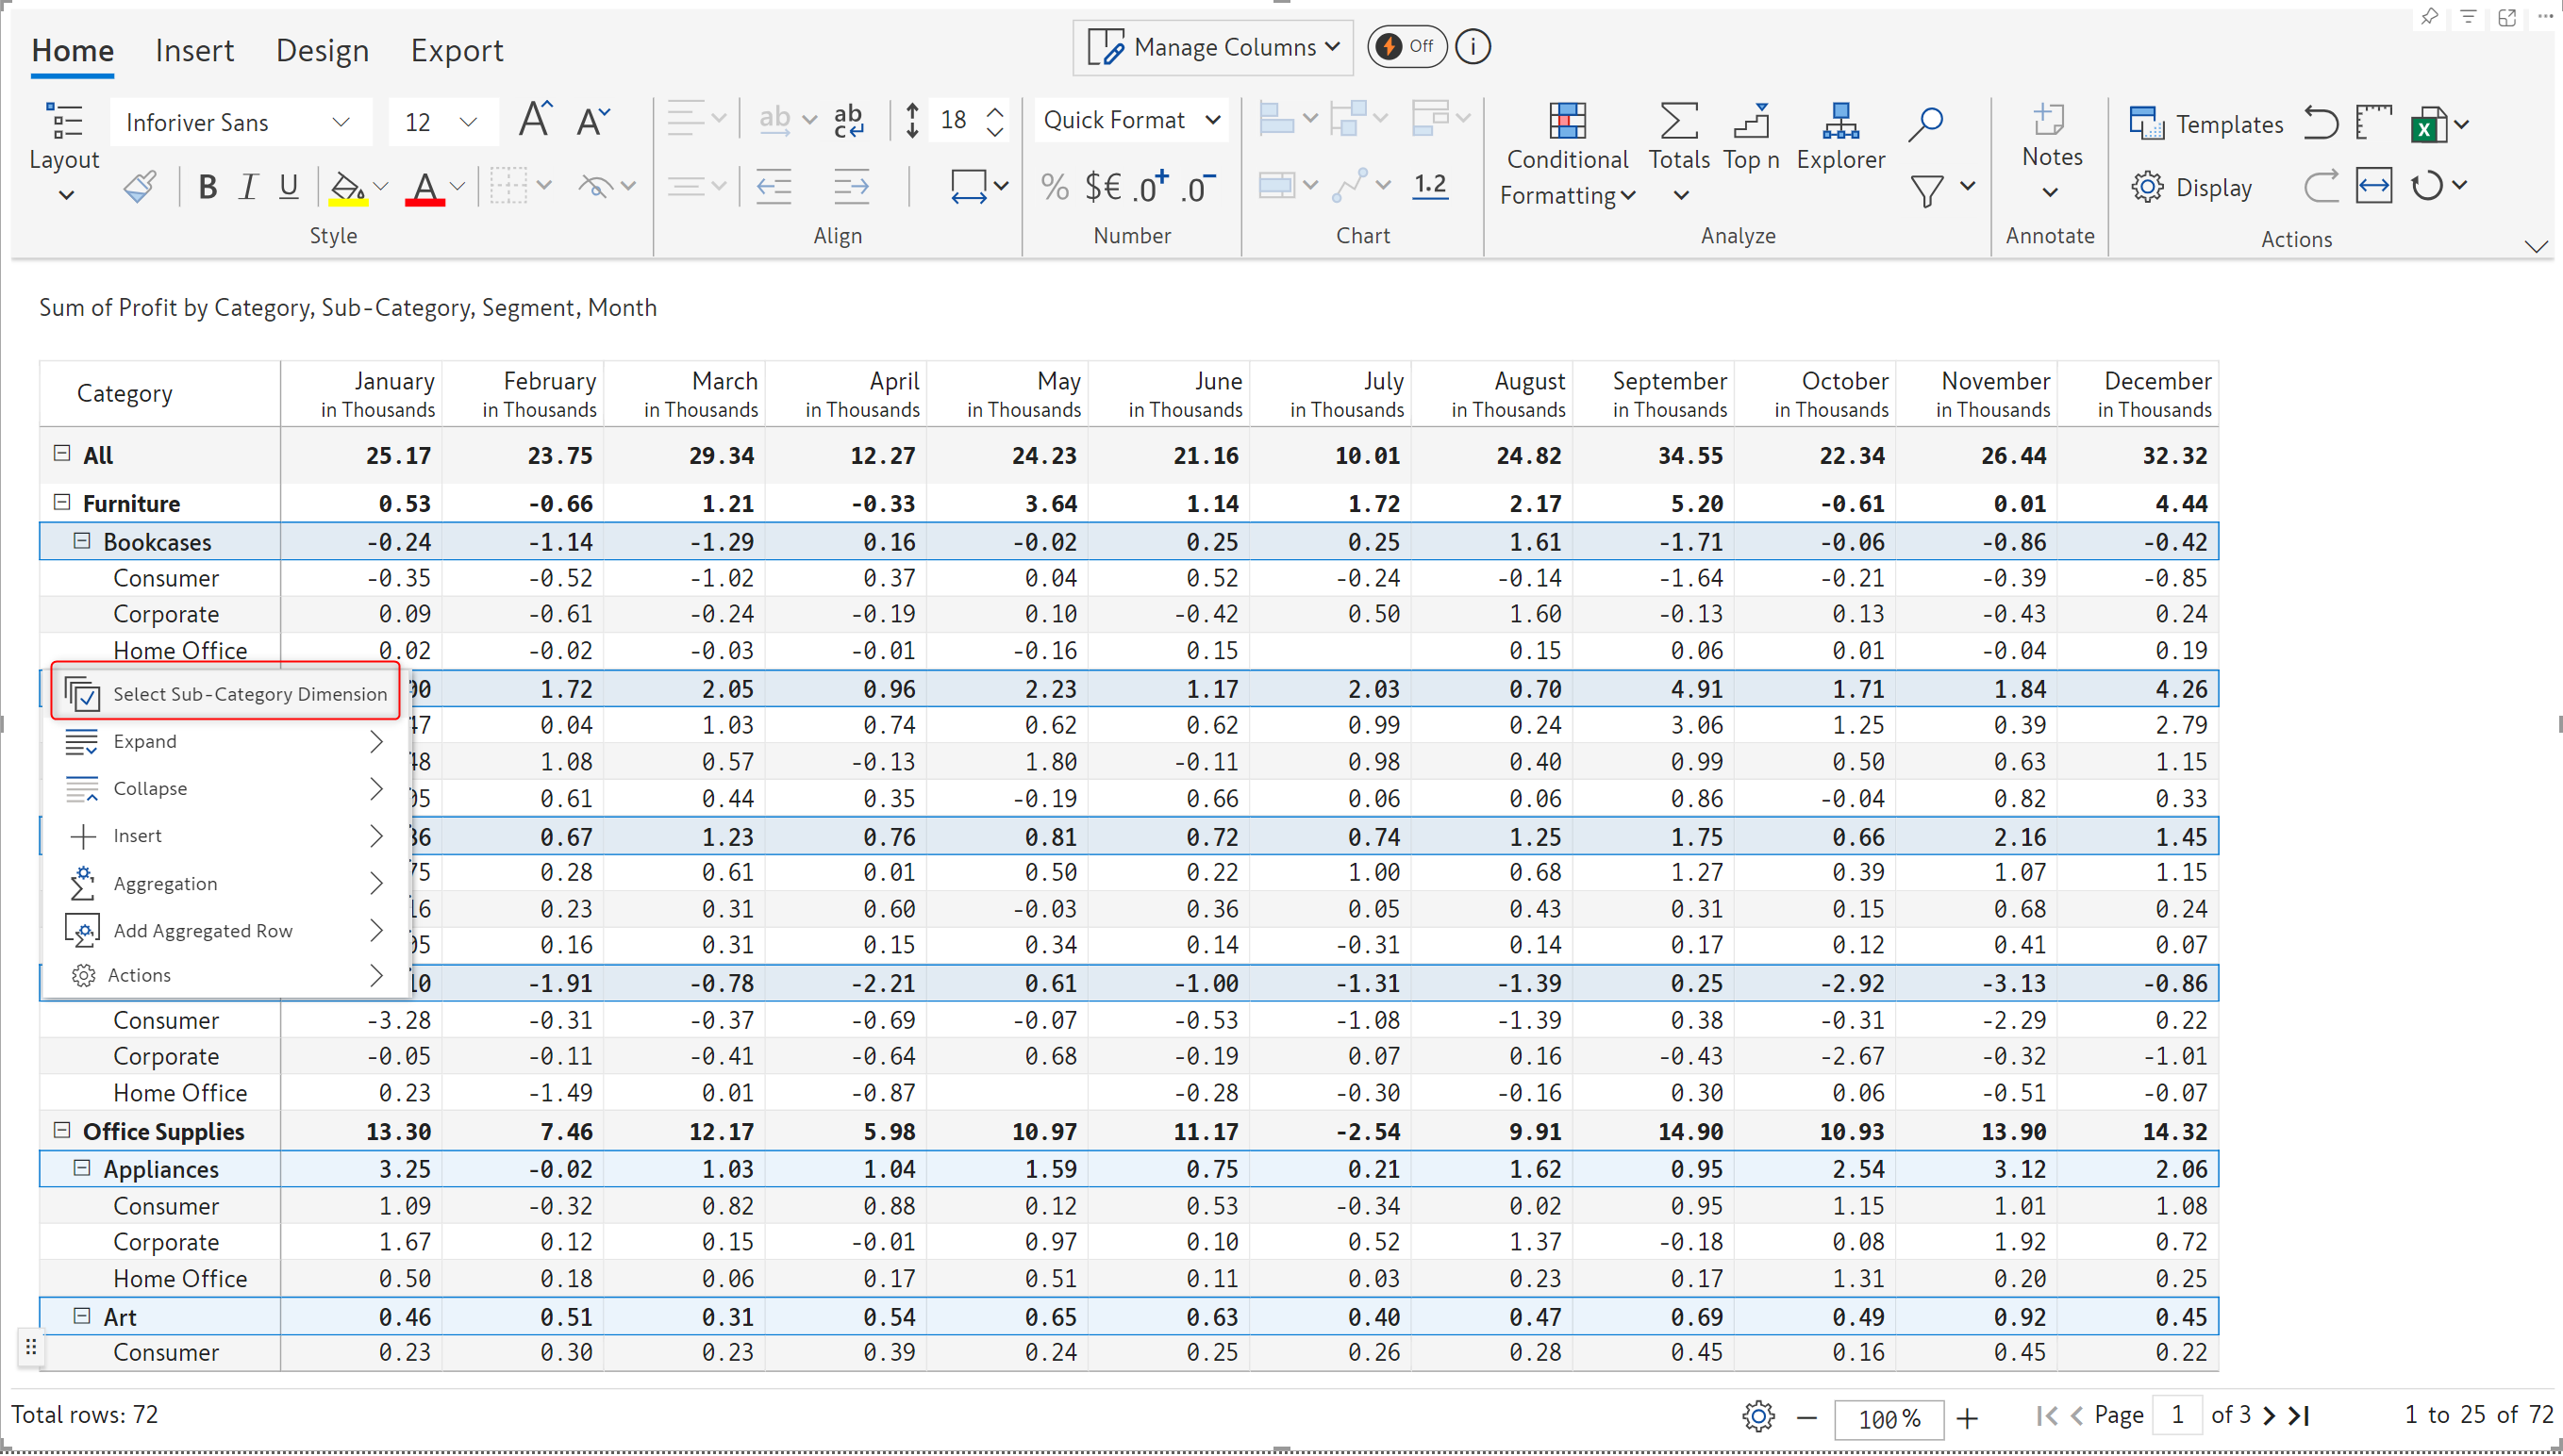
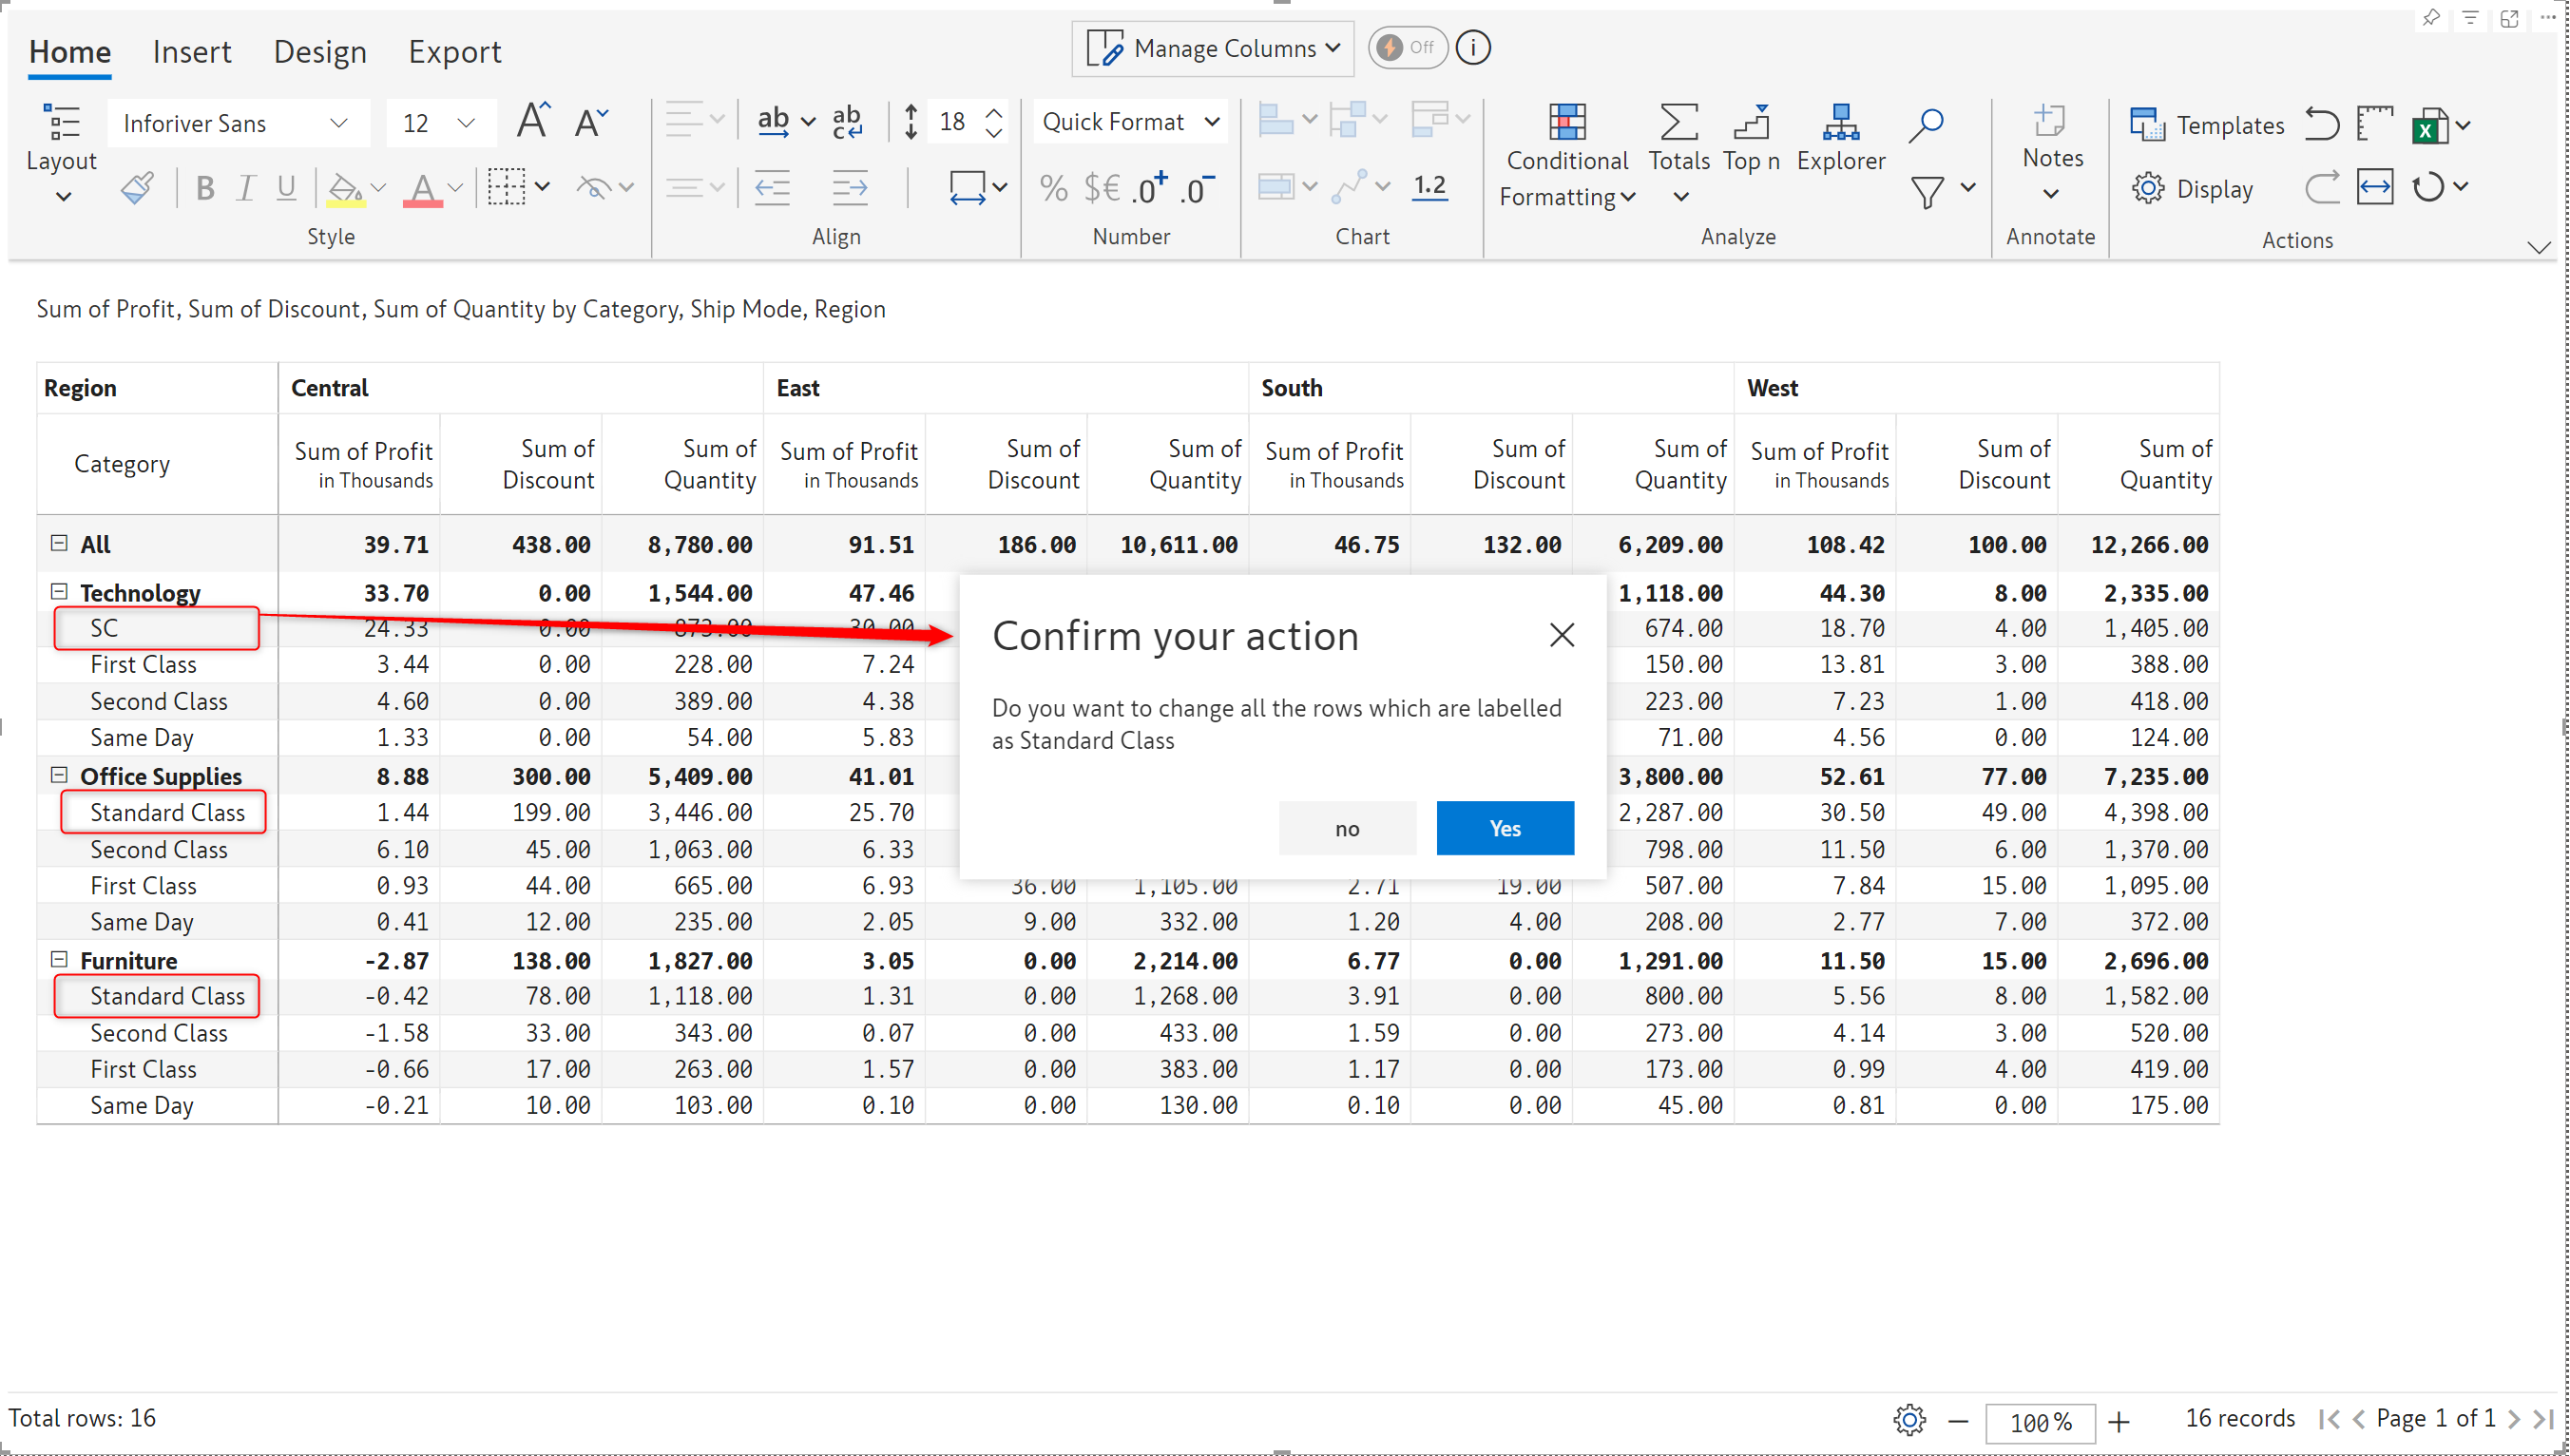
You can select all the categories at a particular hierarchy level using this option. In earlier versions, you would have to select each category one at a time to apply styling or number formatting.
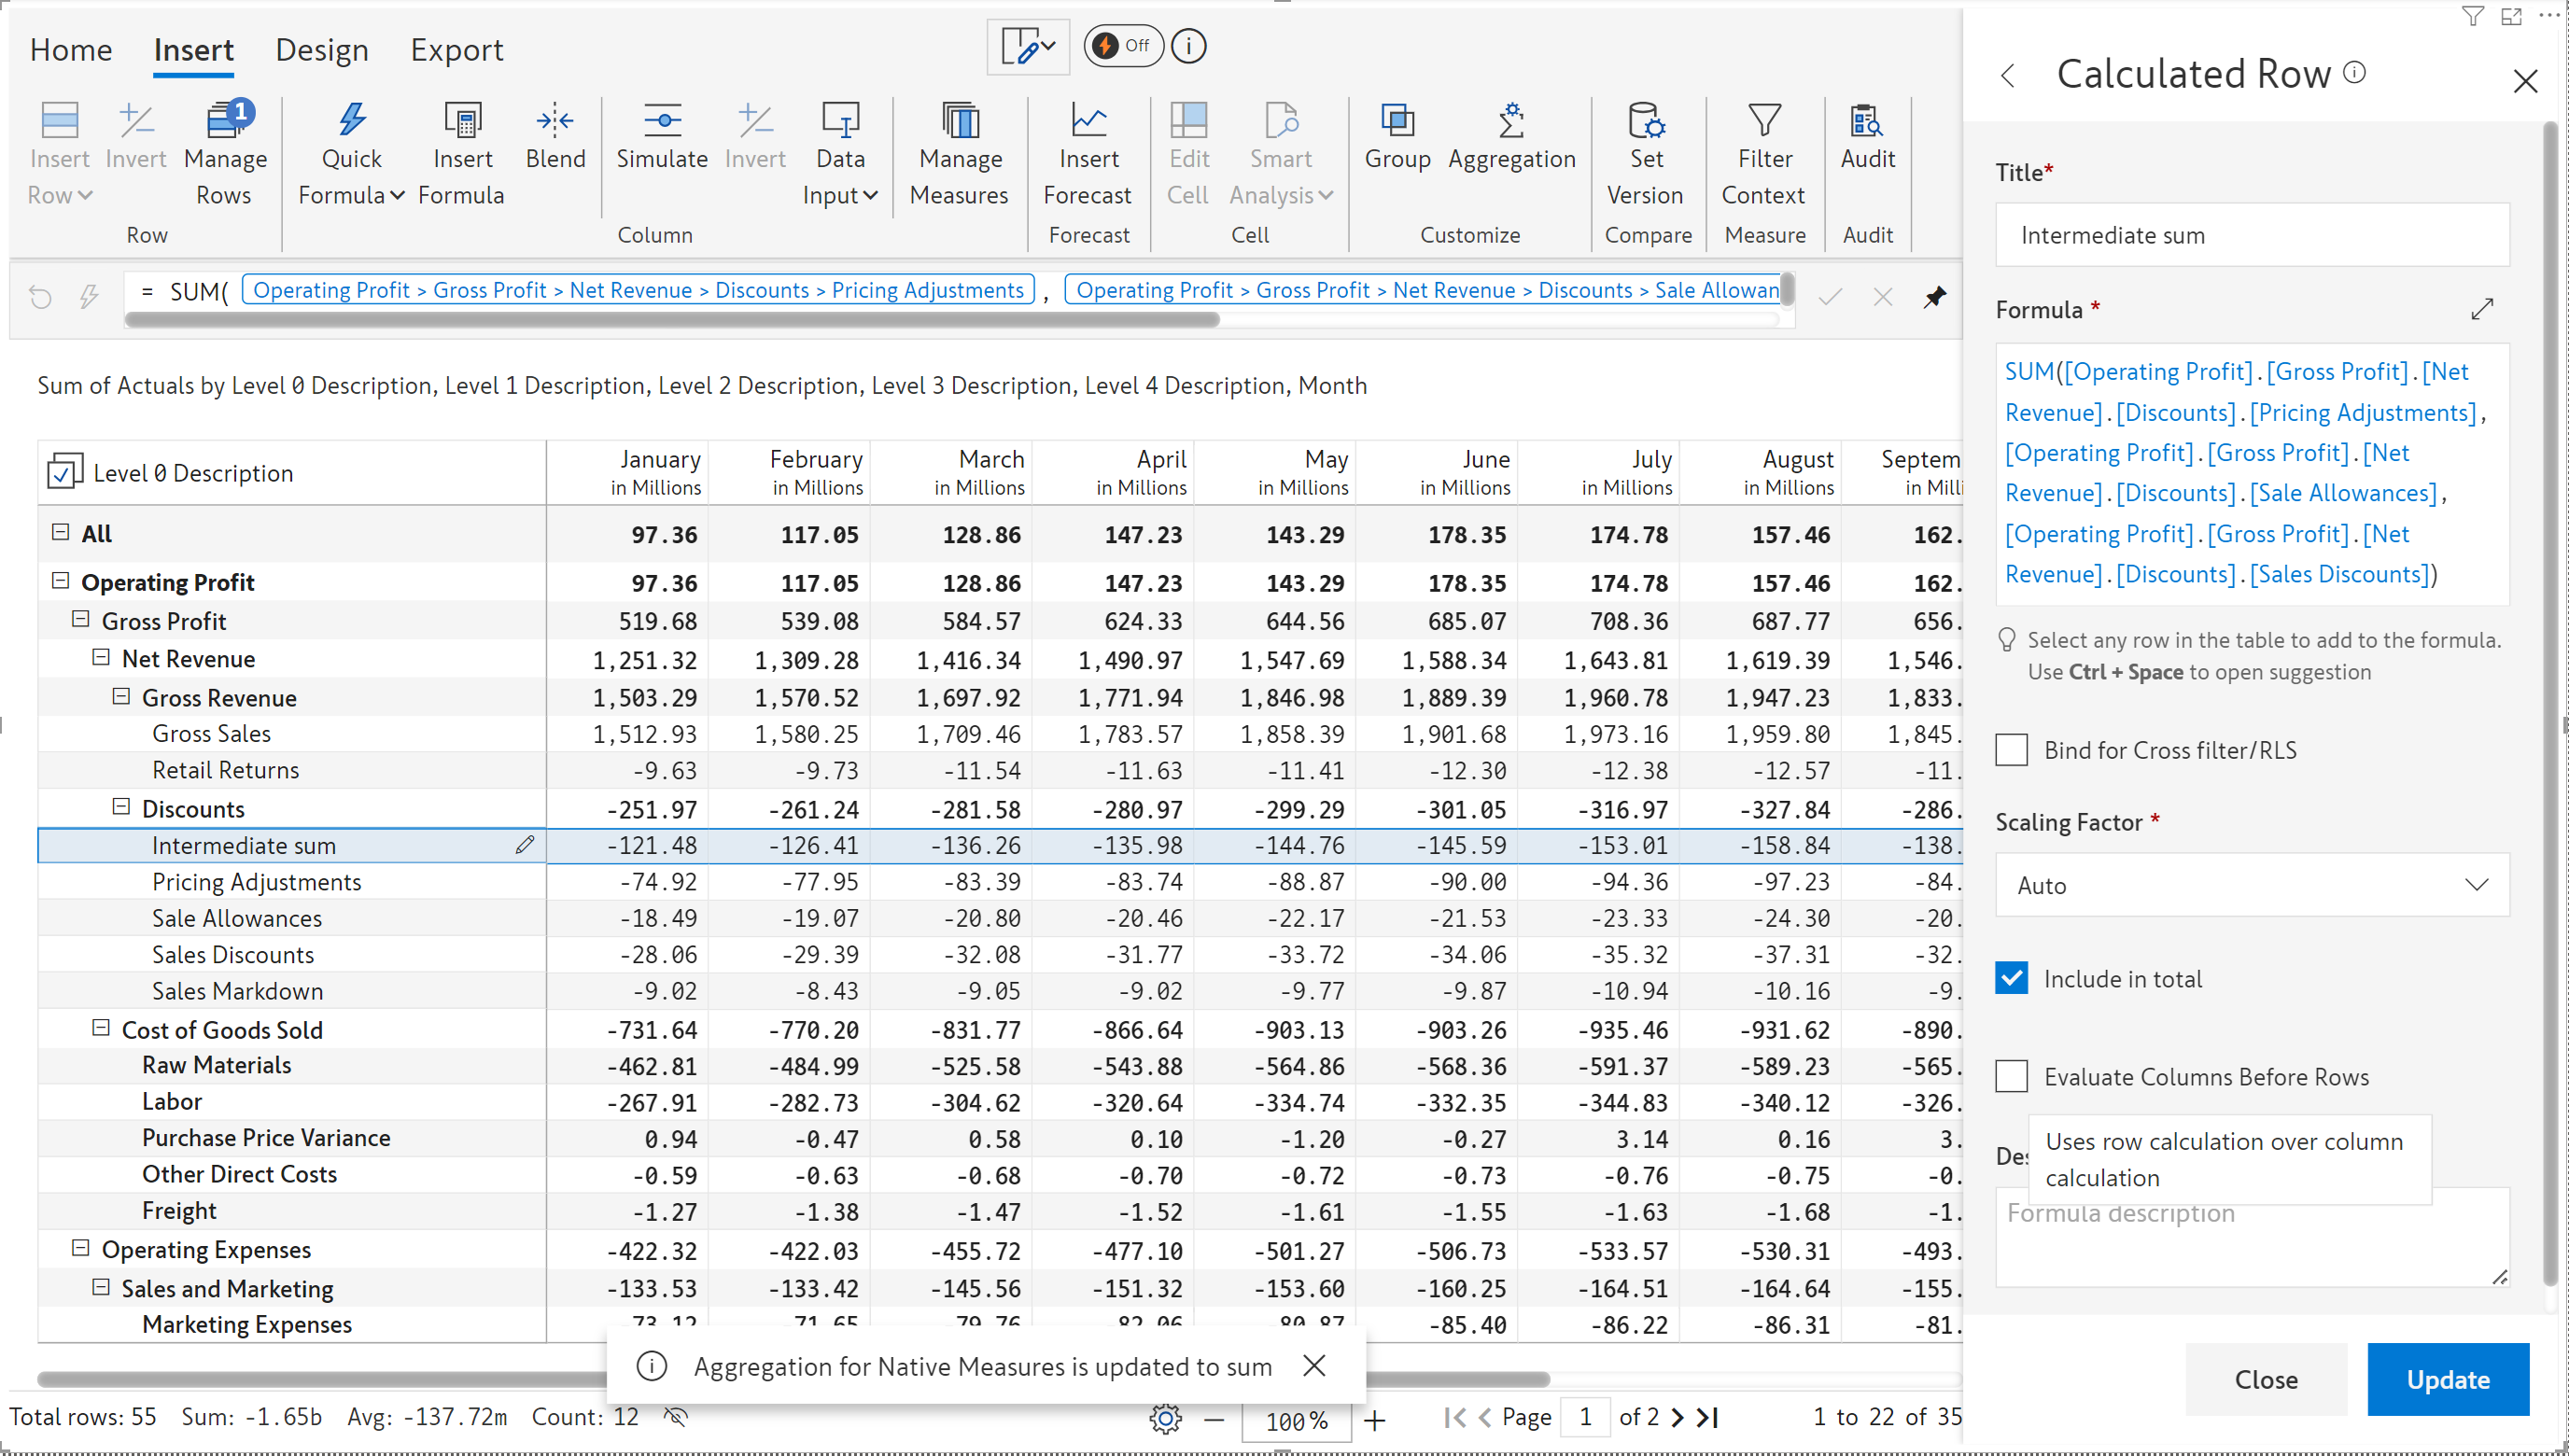
You can select rows and conveniently insert the sum or average right from the row gripper. In earlier versions, you would have to navigate to the insert ribbon and use the insert row options.
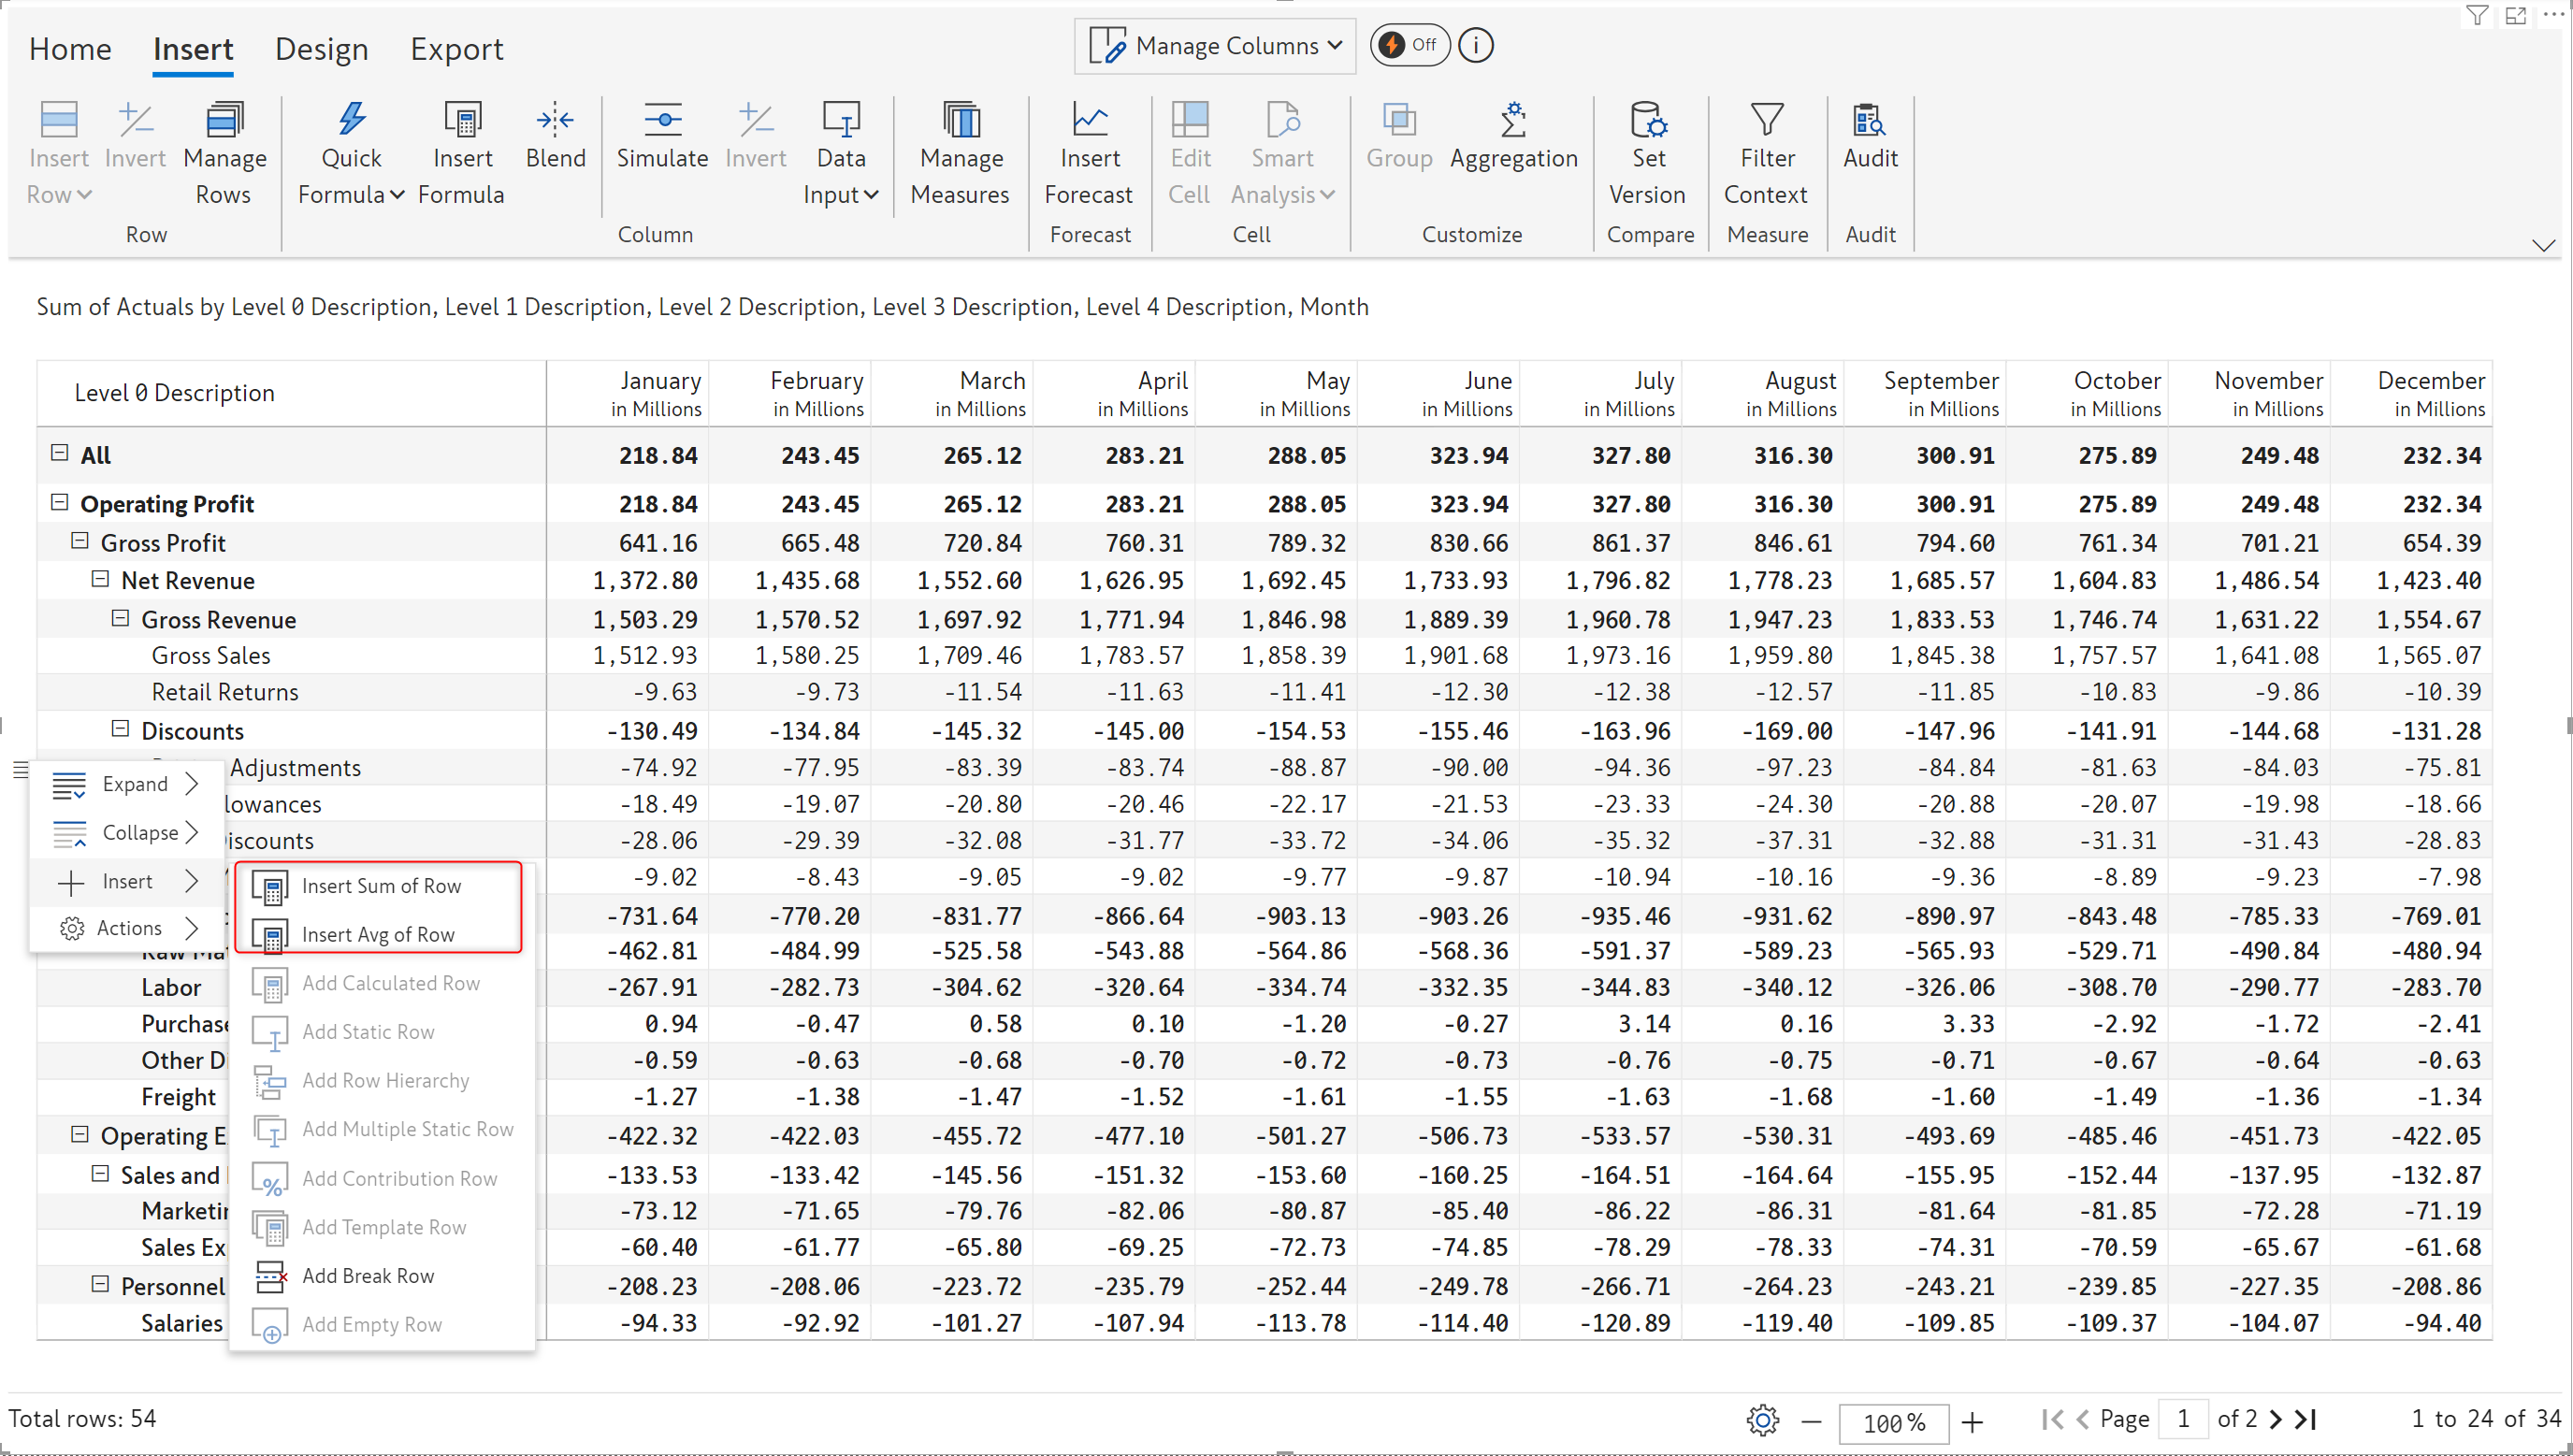
The highlighted row is the sum of the Pricing Adjustments, Sales Allowances, and Sale Discounts rows.
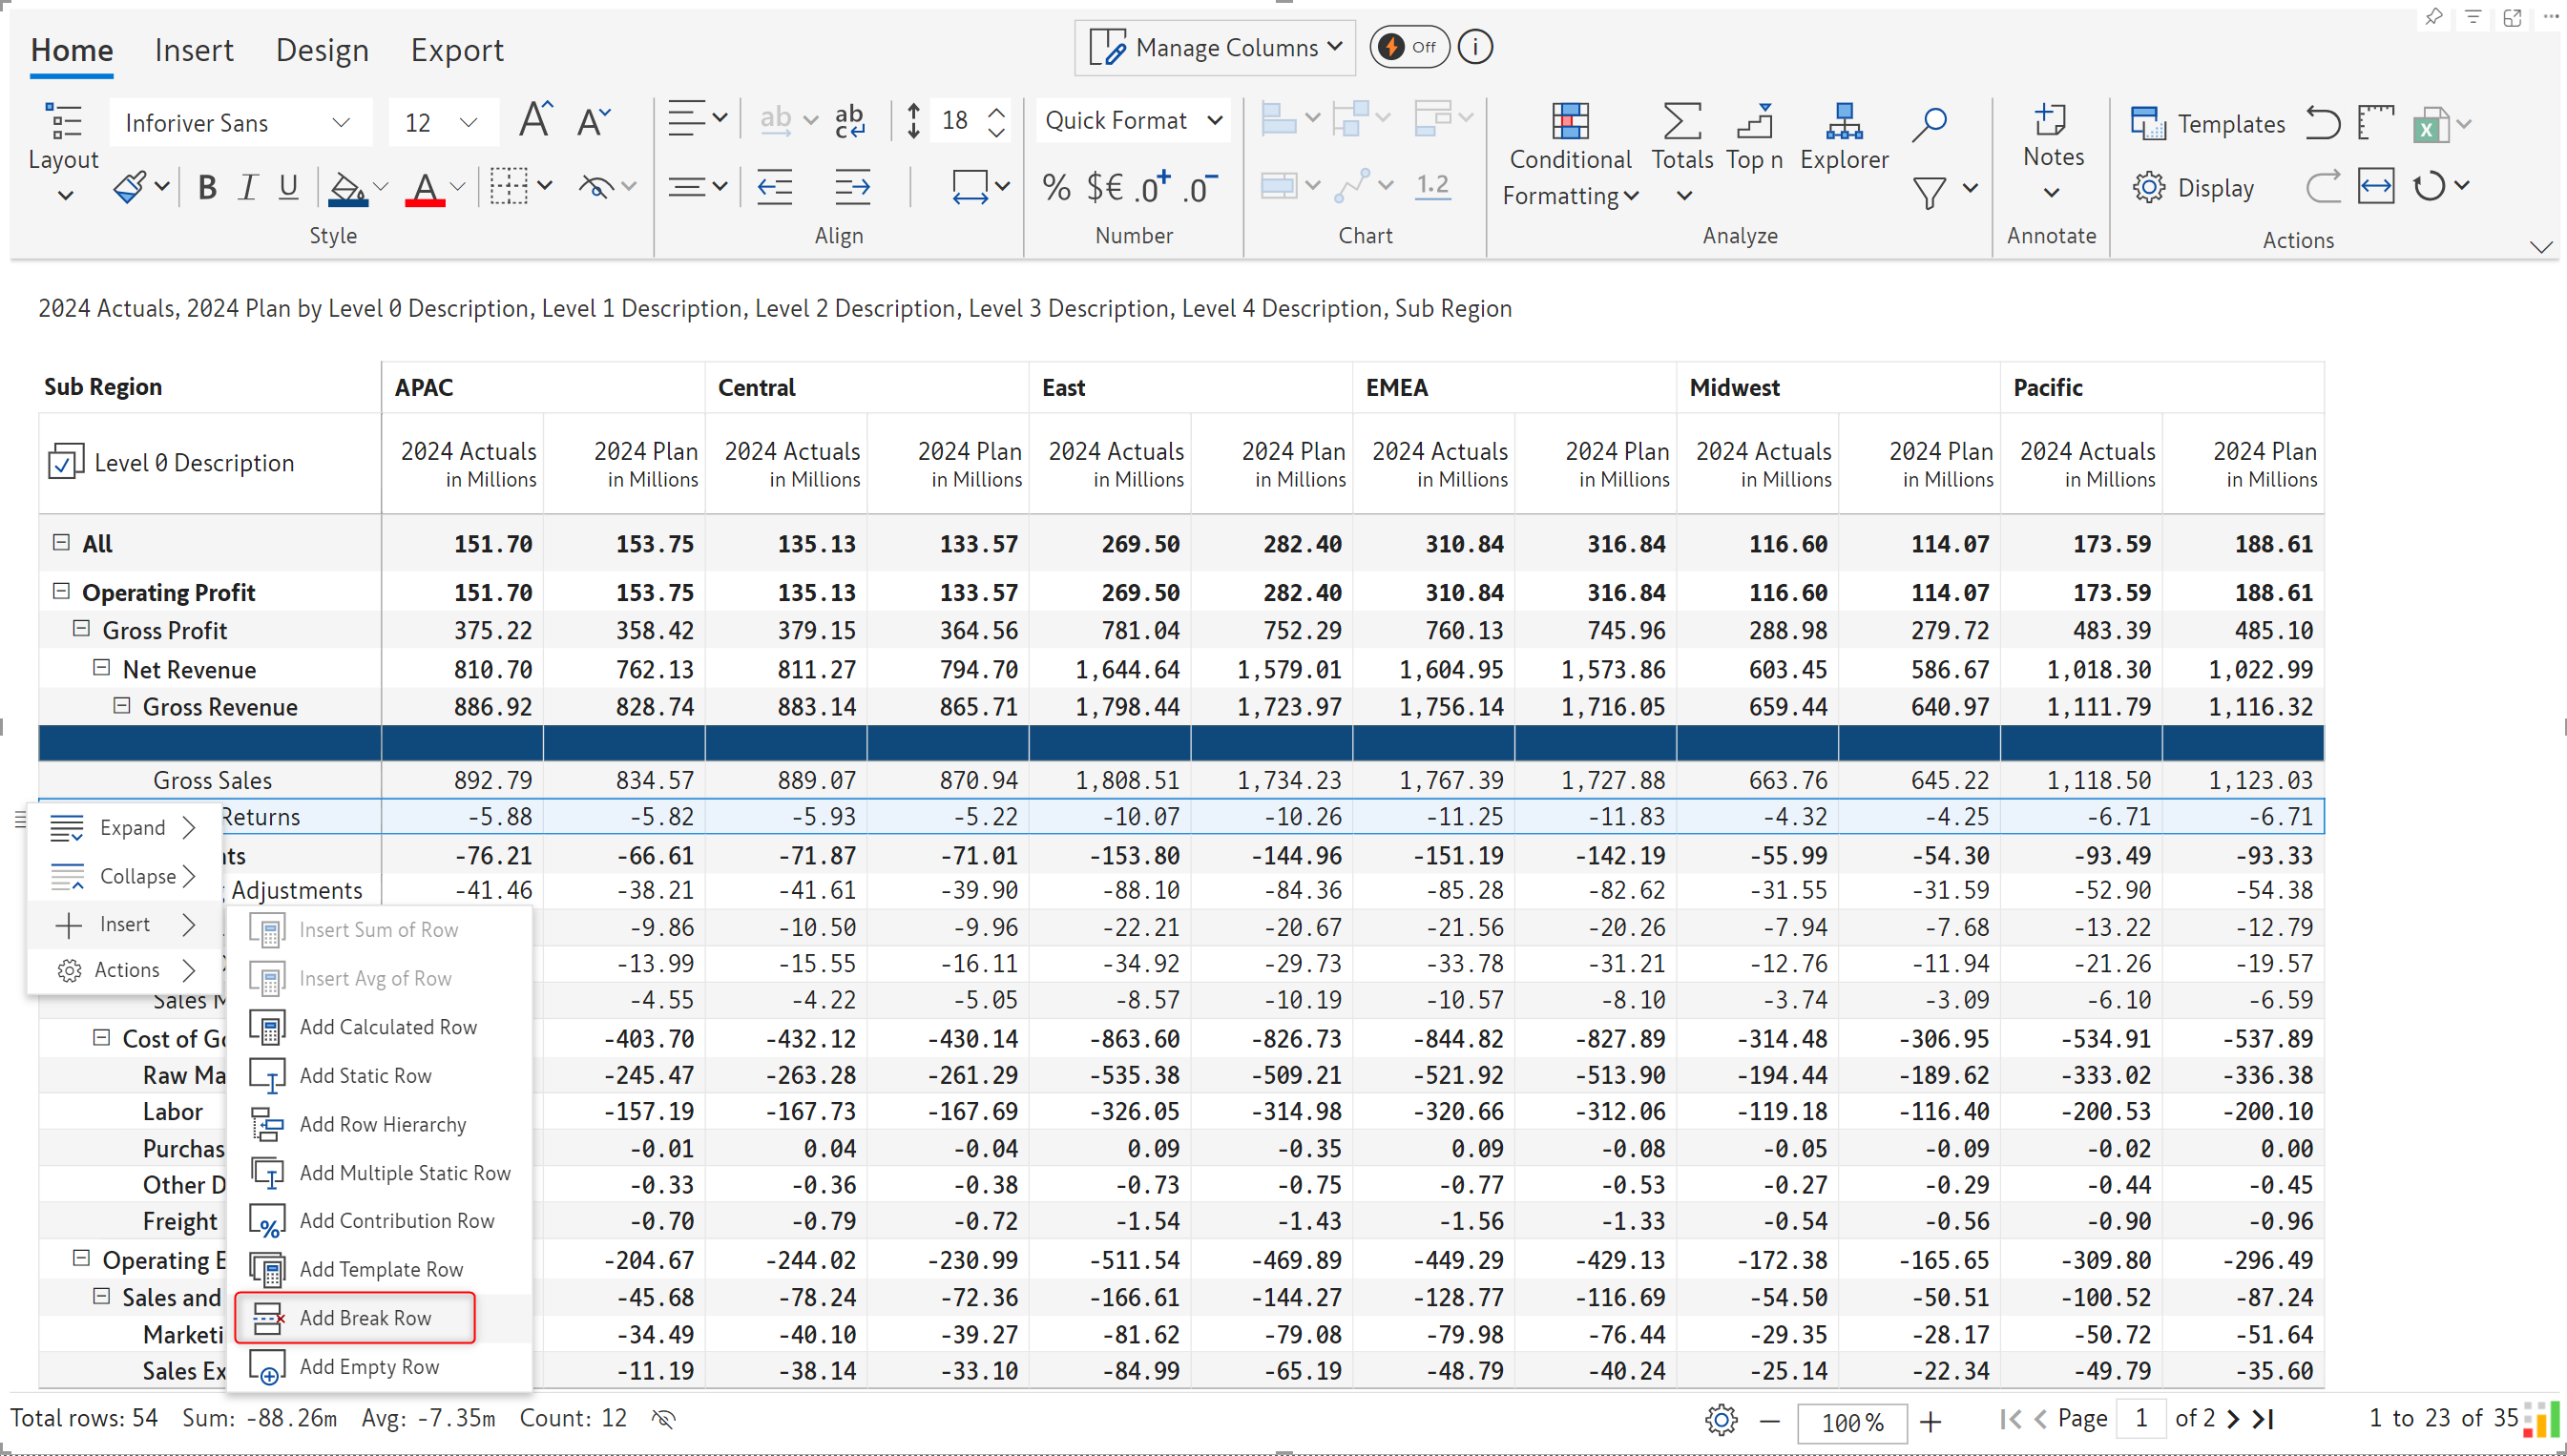
You can insert break rows directly from the row gripper. You can also apply formatting like setting the color for break rows.
The refinements that we continuously make to Inforiver were made possible with your support and feedback. We look forward to receiving your suggestions and have many more exciting innovations lined up! Visit the Inforiver Community to share your ideas, vote on other submissions, and interact with other users.

Inforiver helps enterprises consolidate planning, reporting & analytics on a single platform (Power BI). The no-code, self-service award-winning platform has been recognized as the industry’s best and is adopted by many Fortune 100 firms.
Inforiver is a product of Lumel, the #1 Power BI AppSource Partner. The firm serves over 3,000 customers worldwide through its portfolio of products offered under the brands Inforiver, EDITable, ValQ, and xViz.