Upcoming webinar on 'Inforiver Charts : The fastest way to deliver stories in Power BI', Aug 29th , Monday, 10.30 AM CST. Register Now
Upcoming webinar on 'Inforiver Charts : The fastest way to deliver stories in Power BI', Aug 29th , Monday, 10.30 AM CST. Register Now
Welcome to the Inforiver Enterprise 2.8 release update!
The February release ships with exciting features like the fully redesigned forecasting interface, which has capabilities to extend the forecast period, auto-close, and distribute deficits. We also have enhancements across writeback, data input, and support for images. Discover the innovations driving our product as we continue delivering features most anticipated by the Inforiver community. Thank you for choosing Inforiver!
Feel free to explore the sections that interest you.
1.1. Filter context for writeback
1.2. Relabelled writeback types
1.3. Custom names for writeback columns
1.4. Writeback destination list redesign
2.1. Filter-based dropdowns with data source sync
2.2. Text data input: use dimensions values
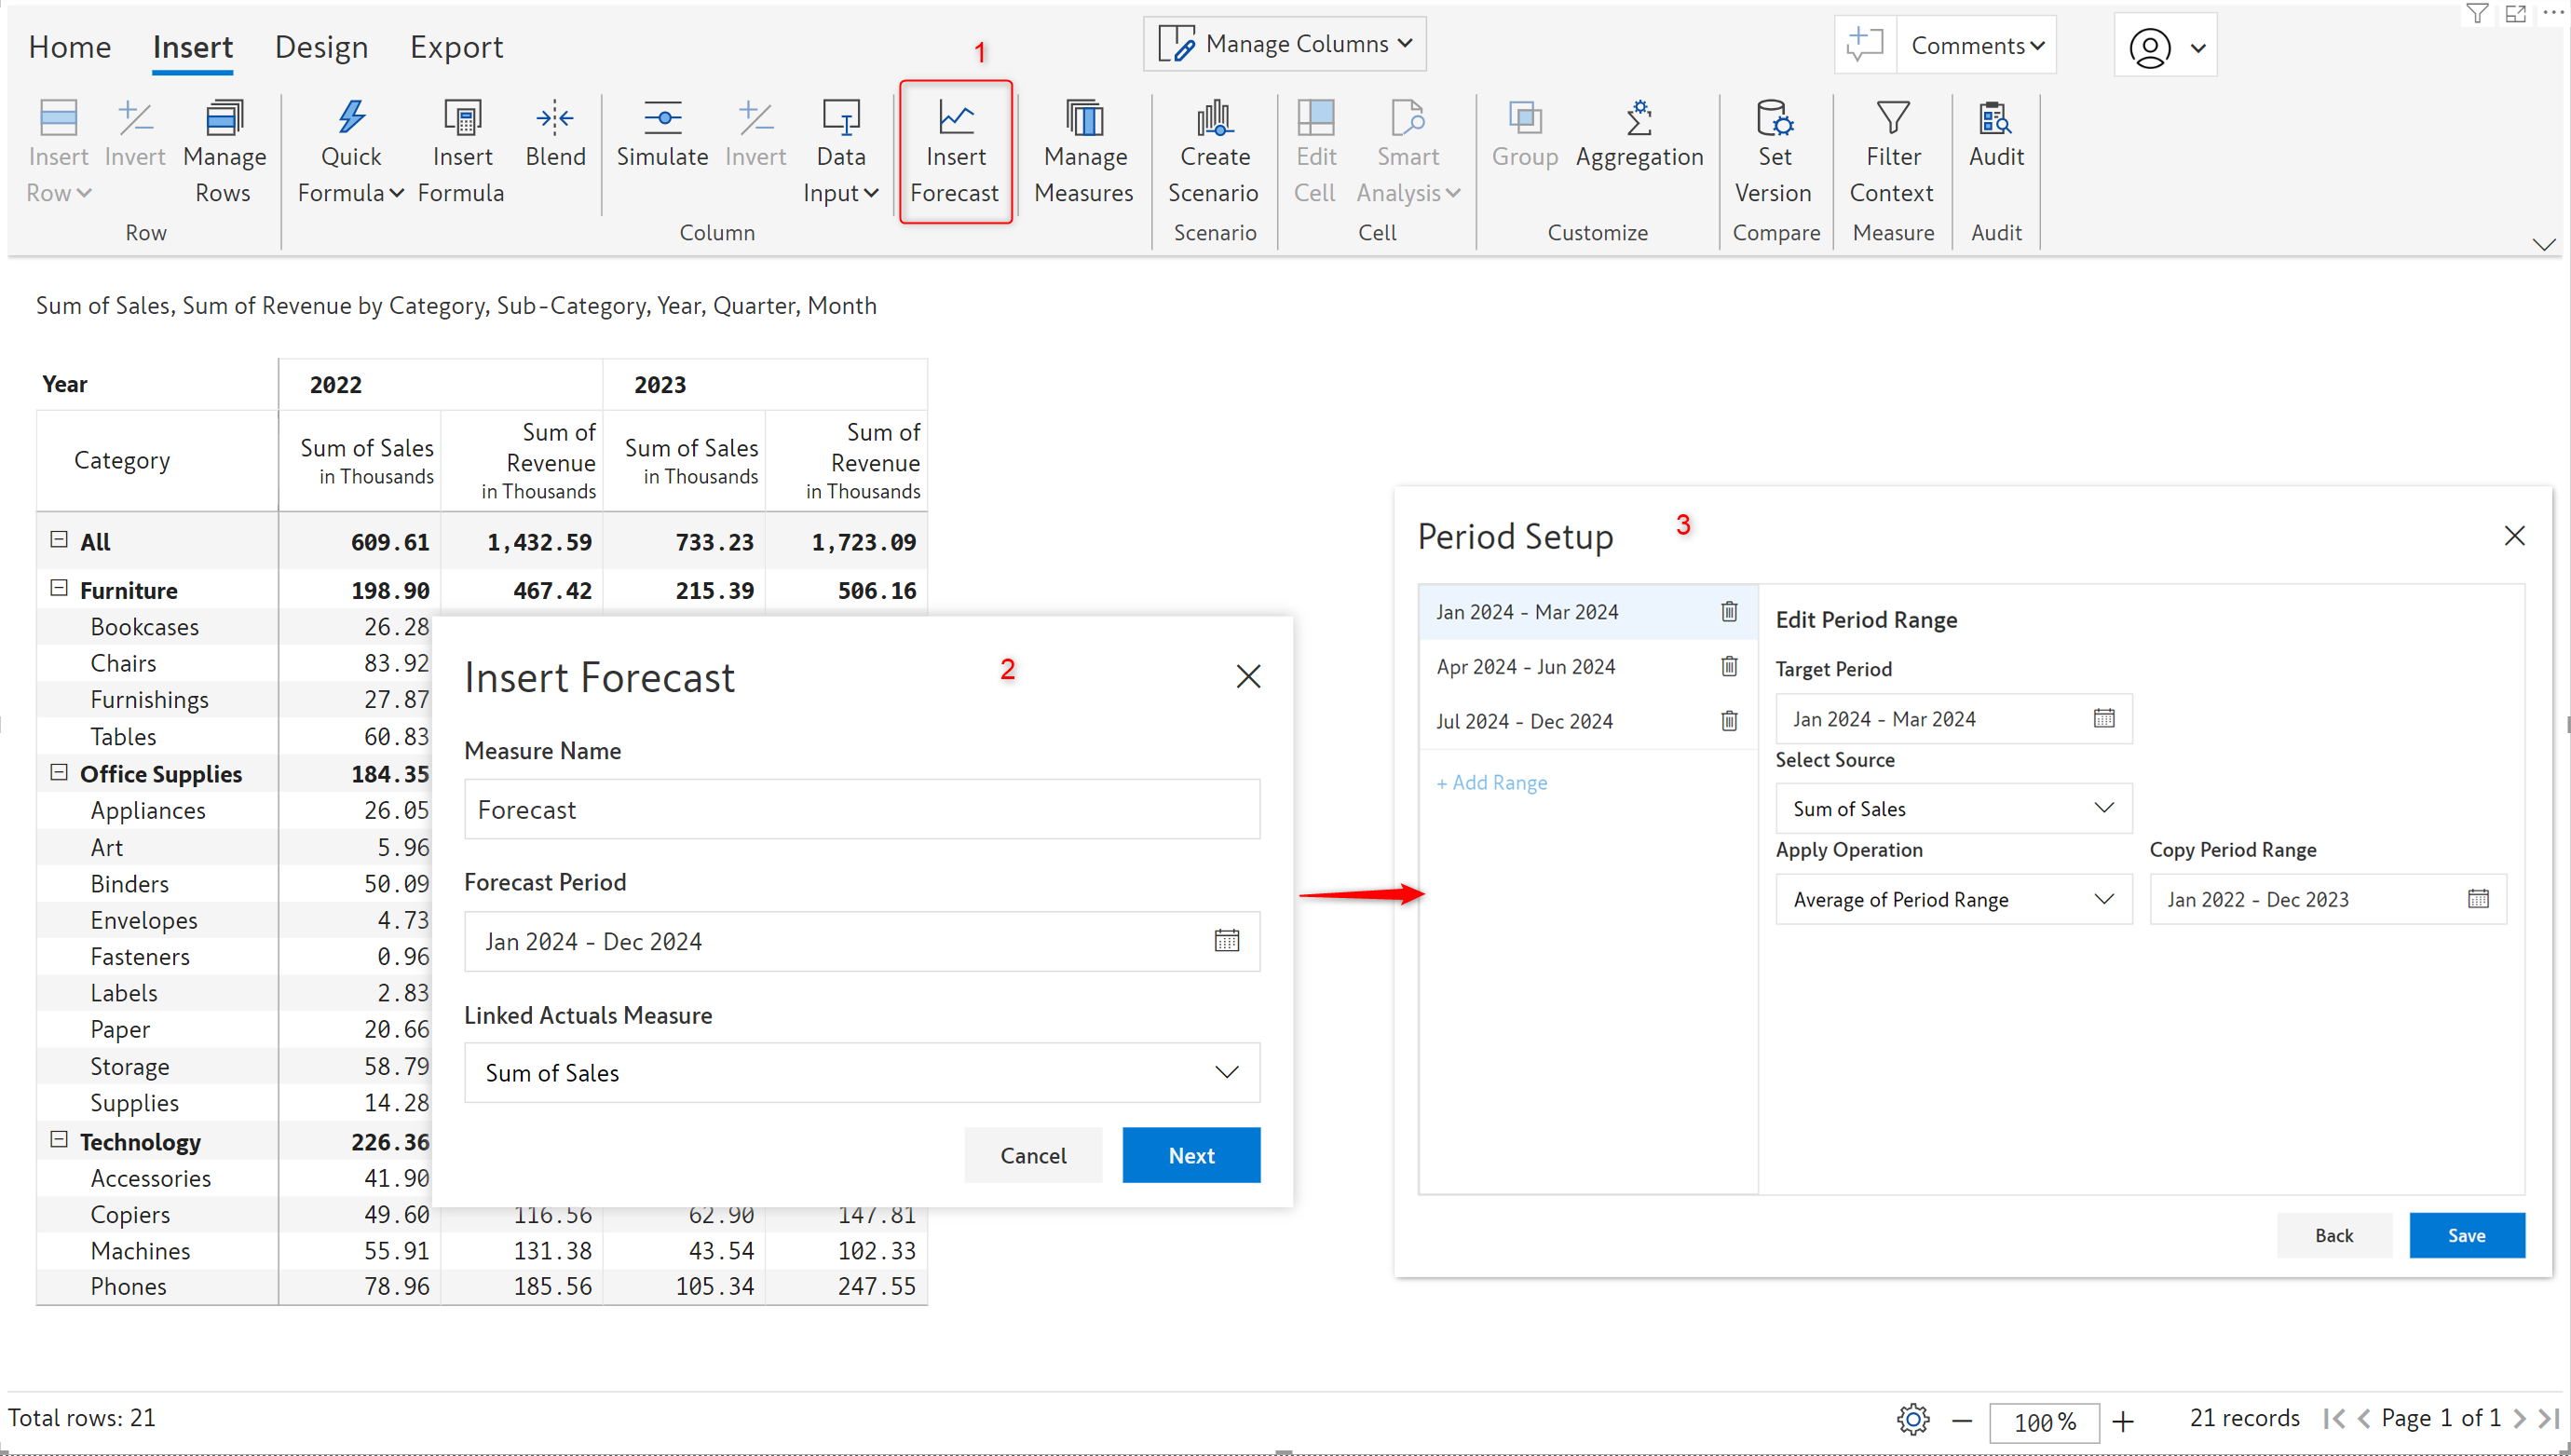
3.1. New forecasting interface with dedicated toolbar
3.2. Closing forecasts and extending the forecast period
3.7. Value display for closed forecasts
4.1. Toolbar access from scenarios
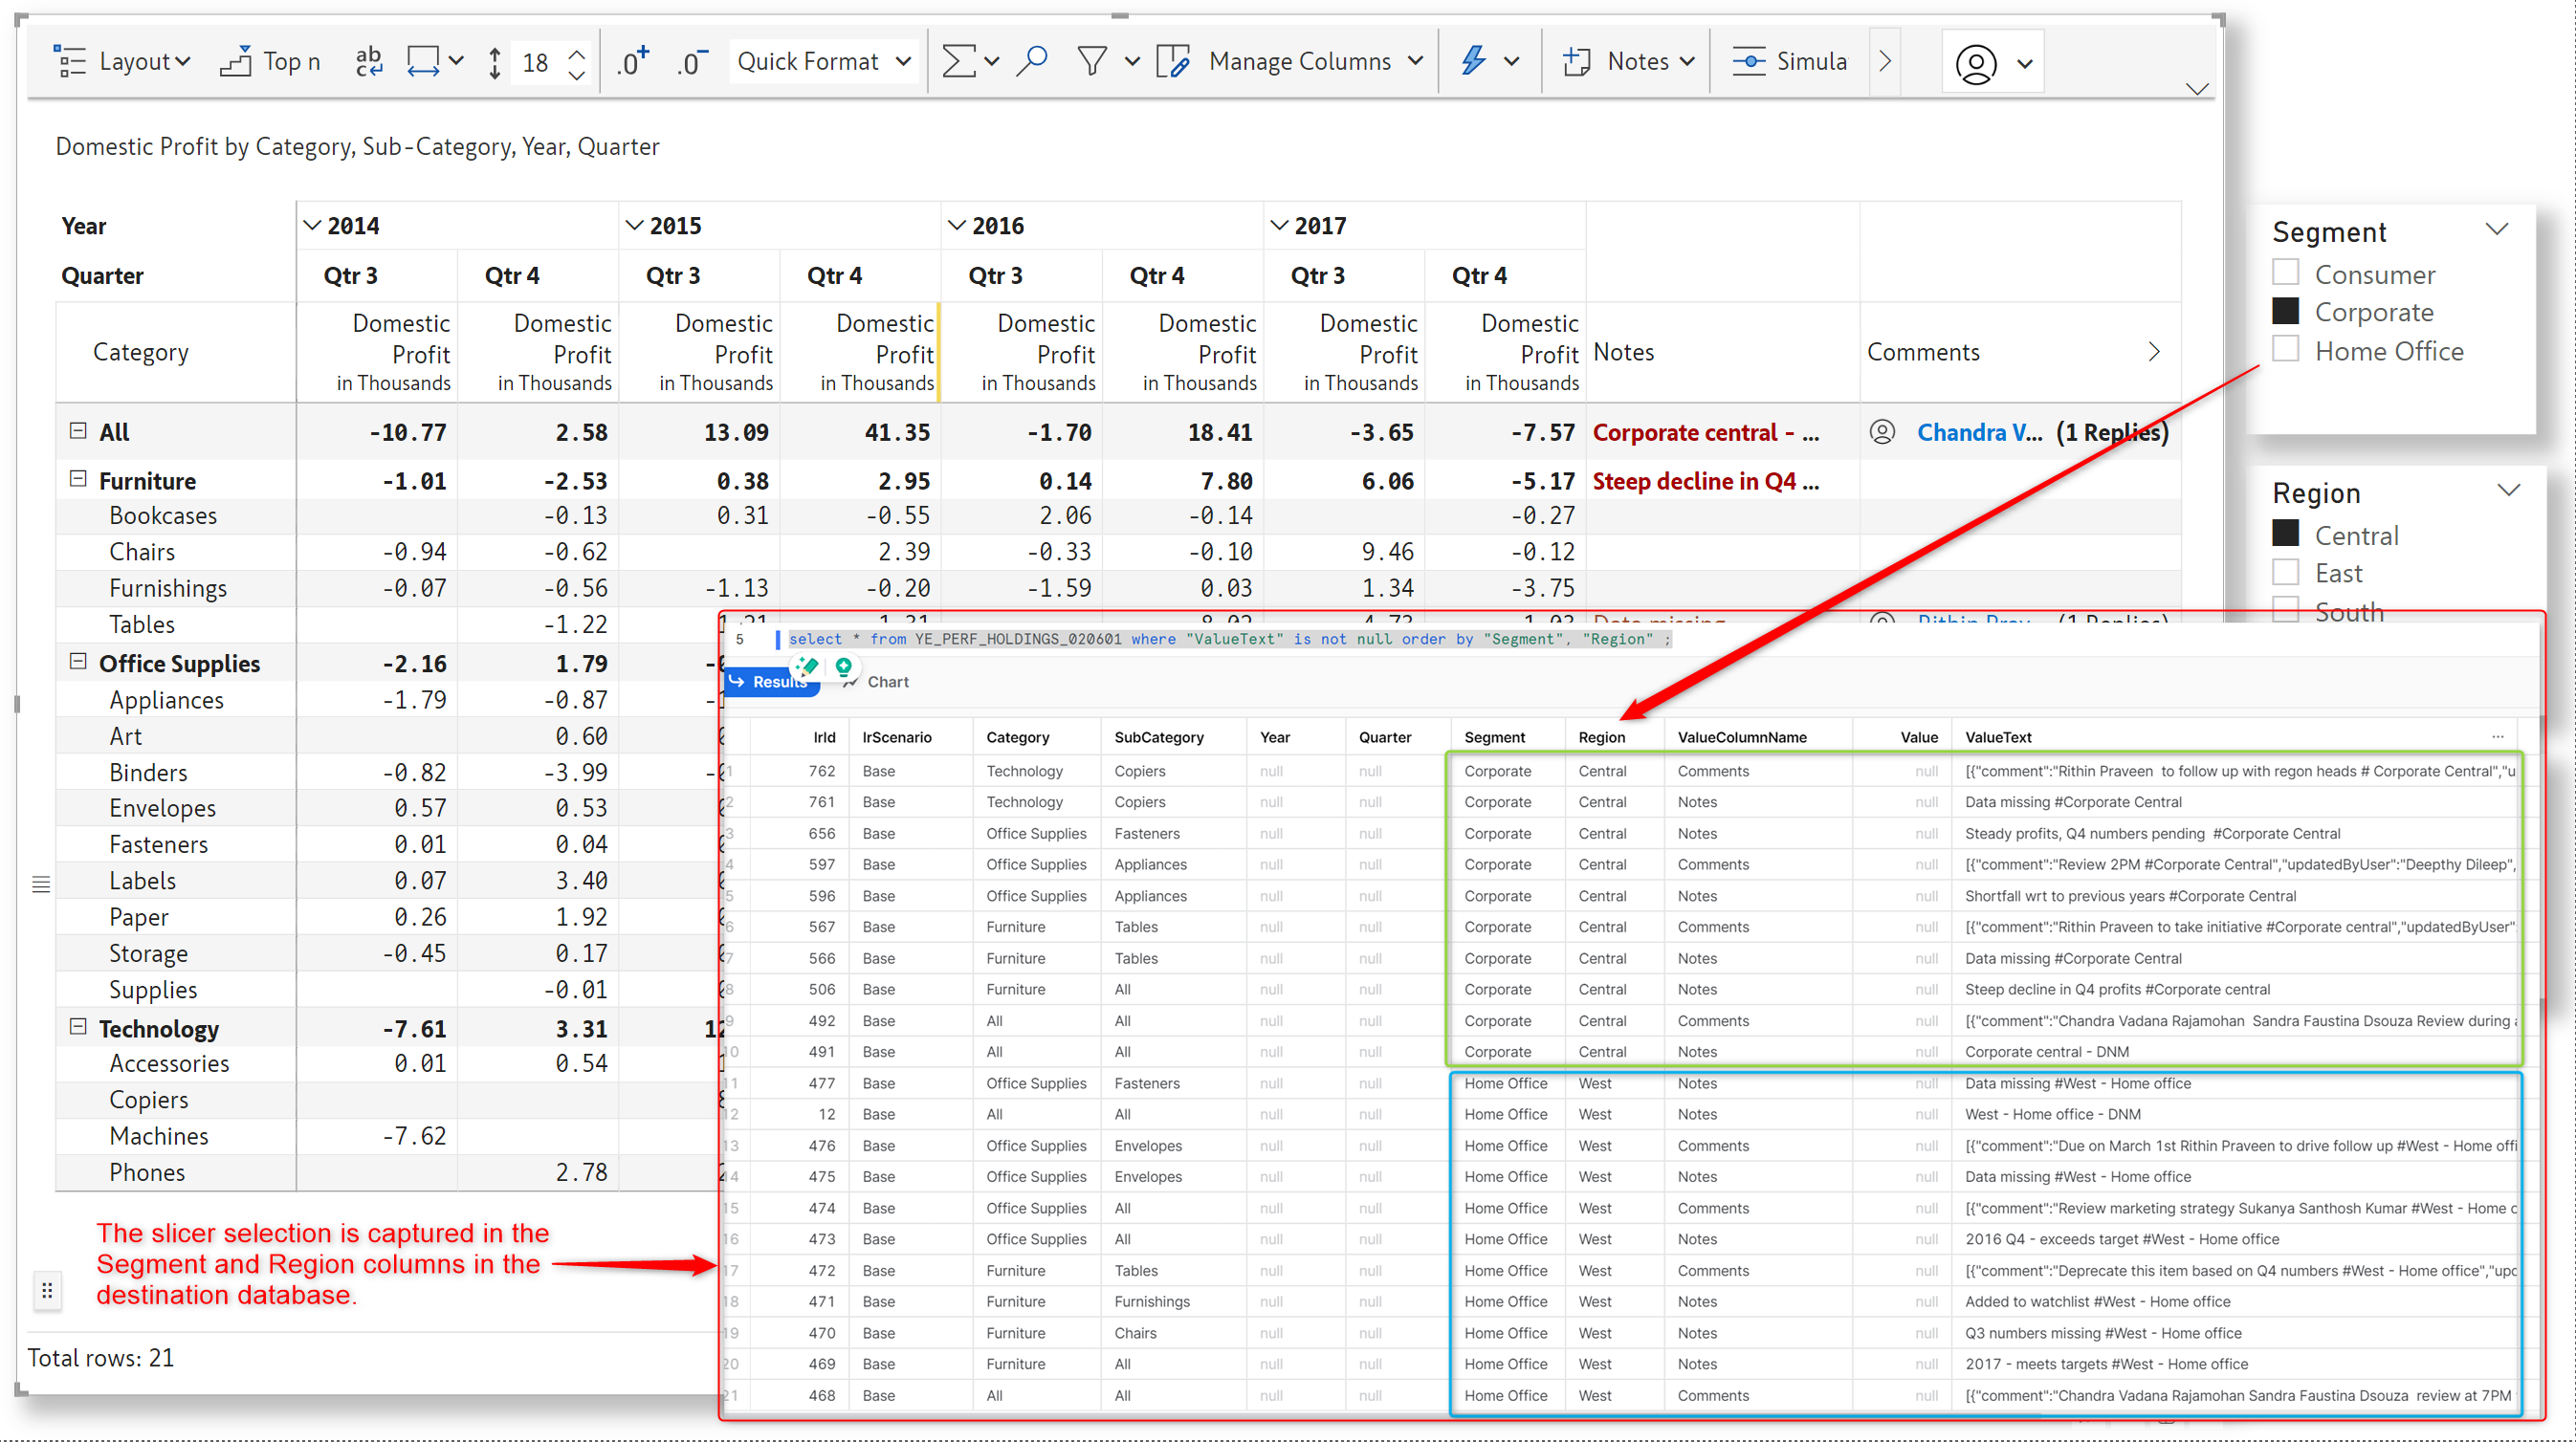
The Inforiver visual is context-aware and responsive to external filter/slicer changes. With the latest release, context awareness has been extended to writeback as well. The slicer selections are captured in the data that is written back to the destination.
In the example below, the Segment and Region selections are captured as part of the writeback.
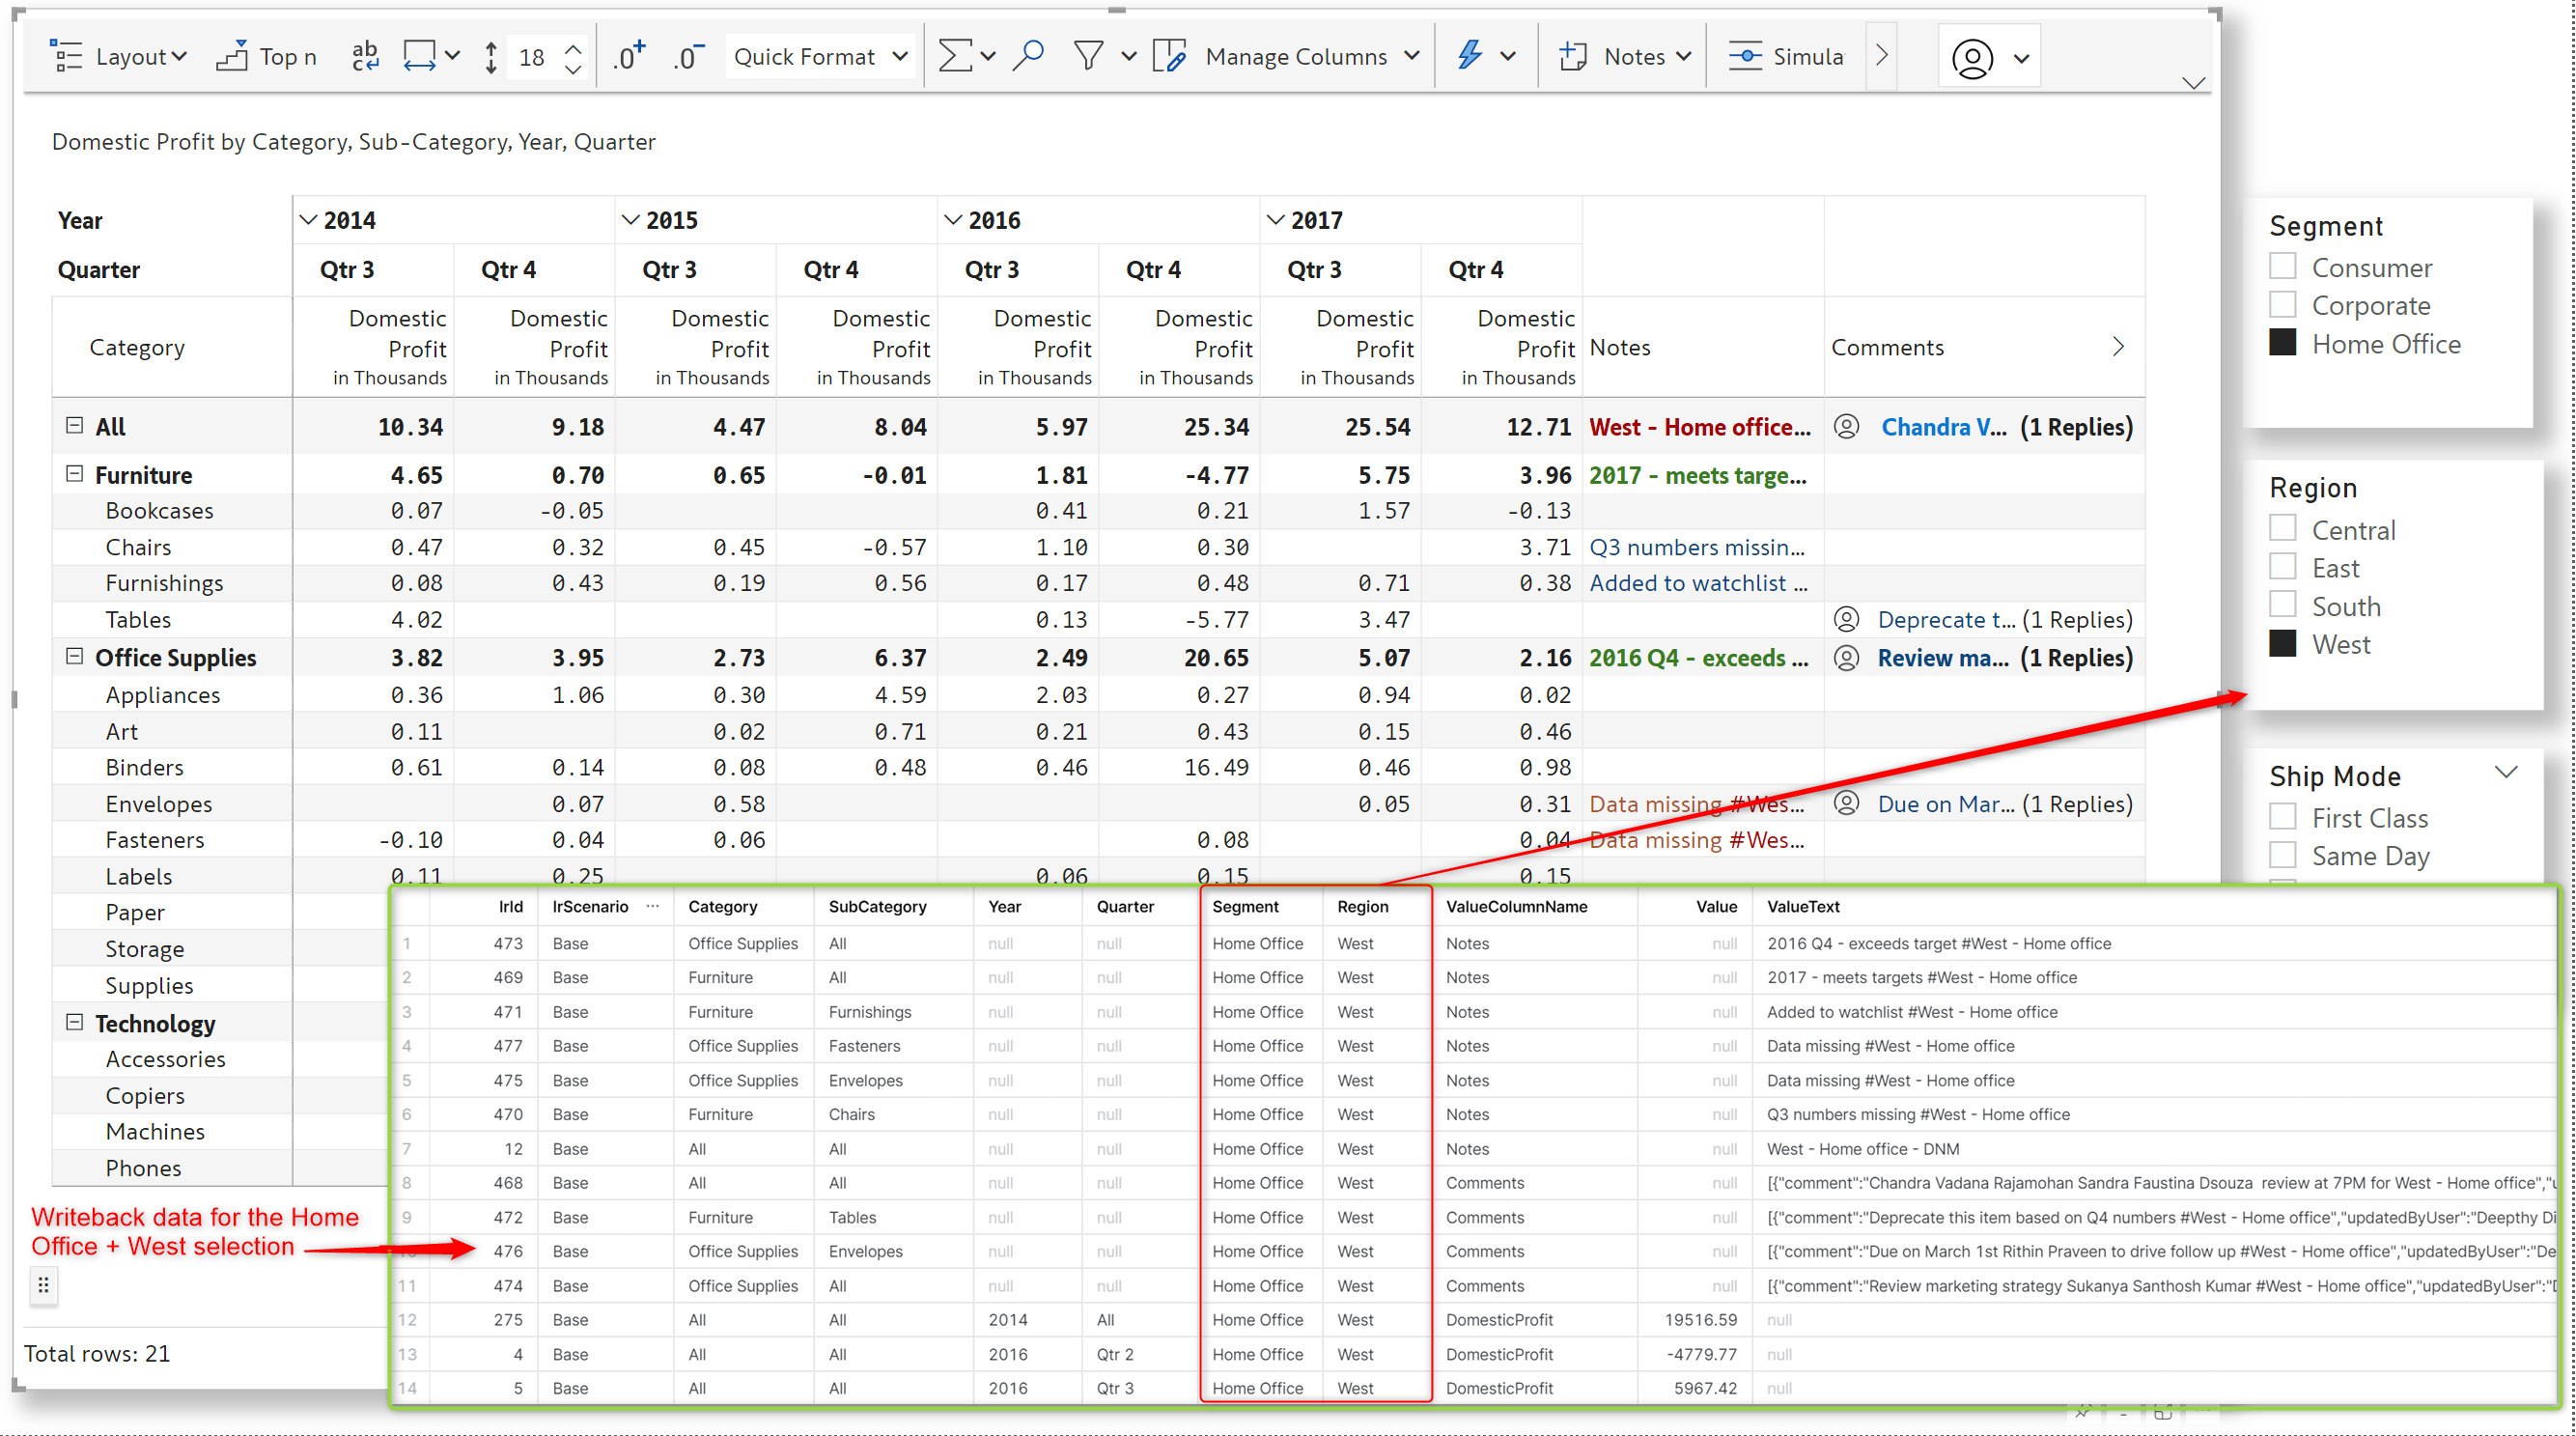
When the Segment and Region selection is changed to Corporate + Central, the notes and comments are inserted as separate rows in the destination and tagged against the changed categories.
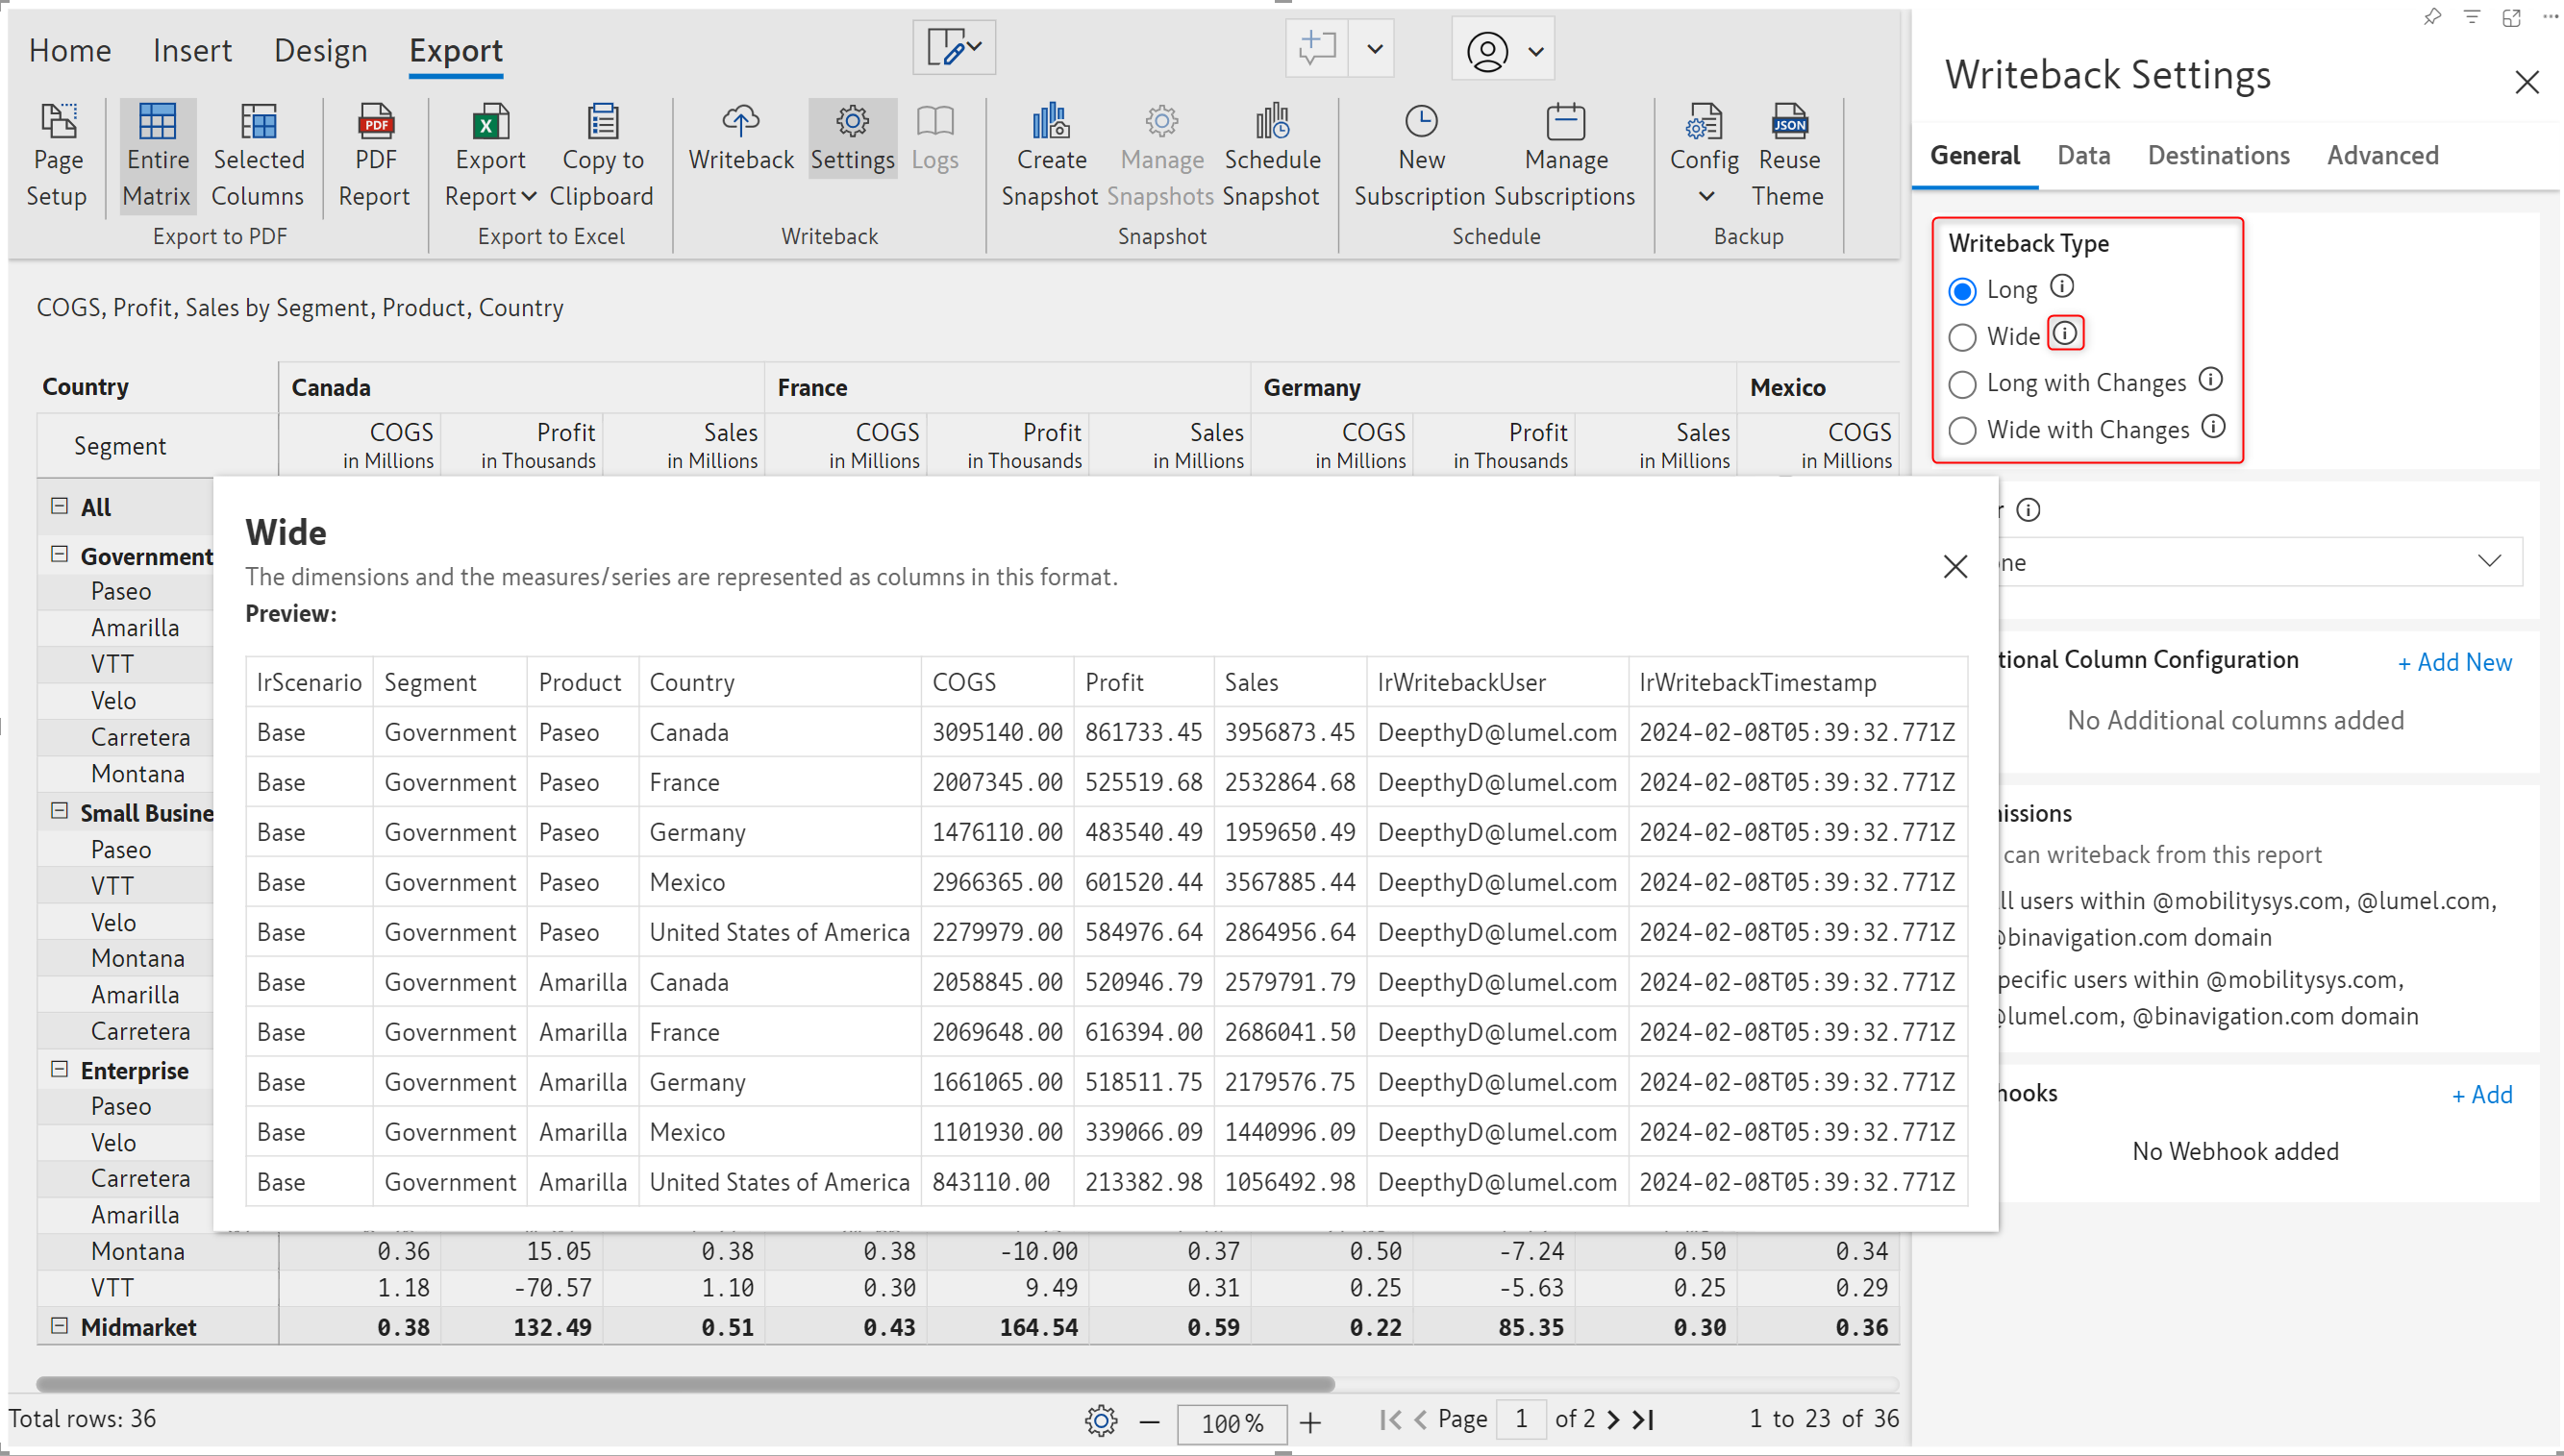
The names for writeback types have been updated to crisp identifiers. You can click on the ‘i’ icon next to each type to preview the writeback data structure.
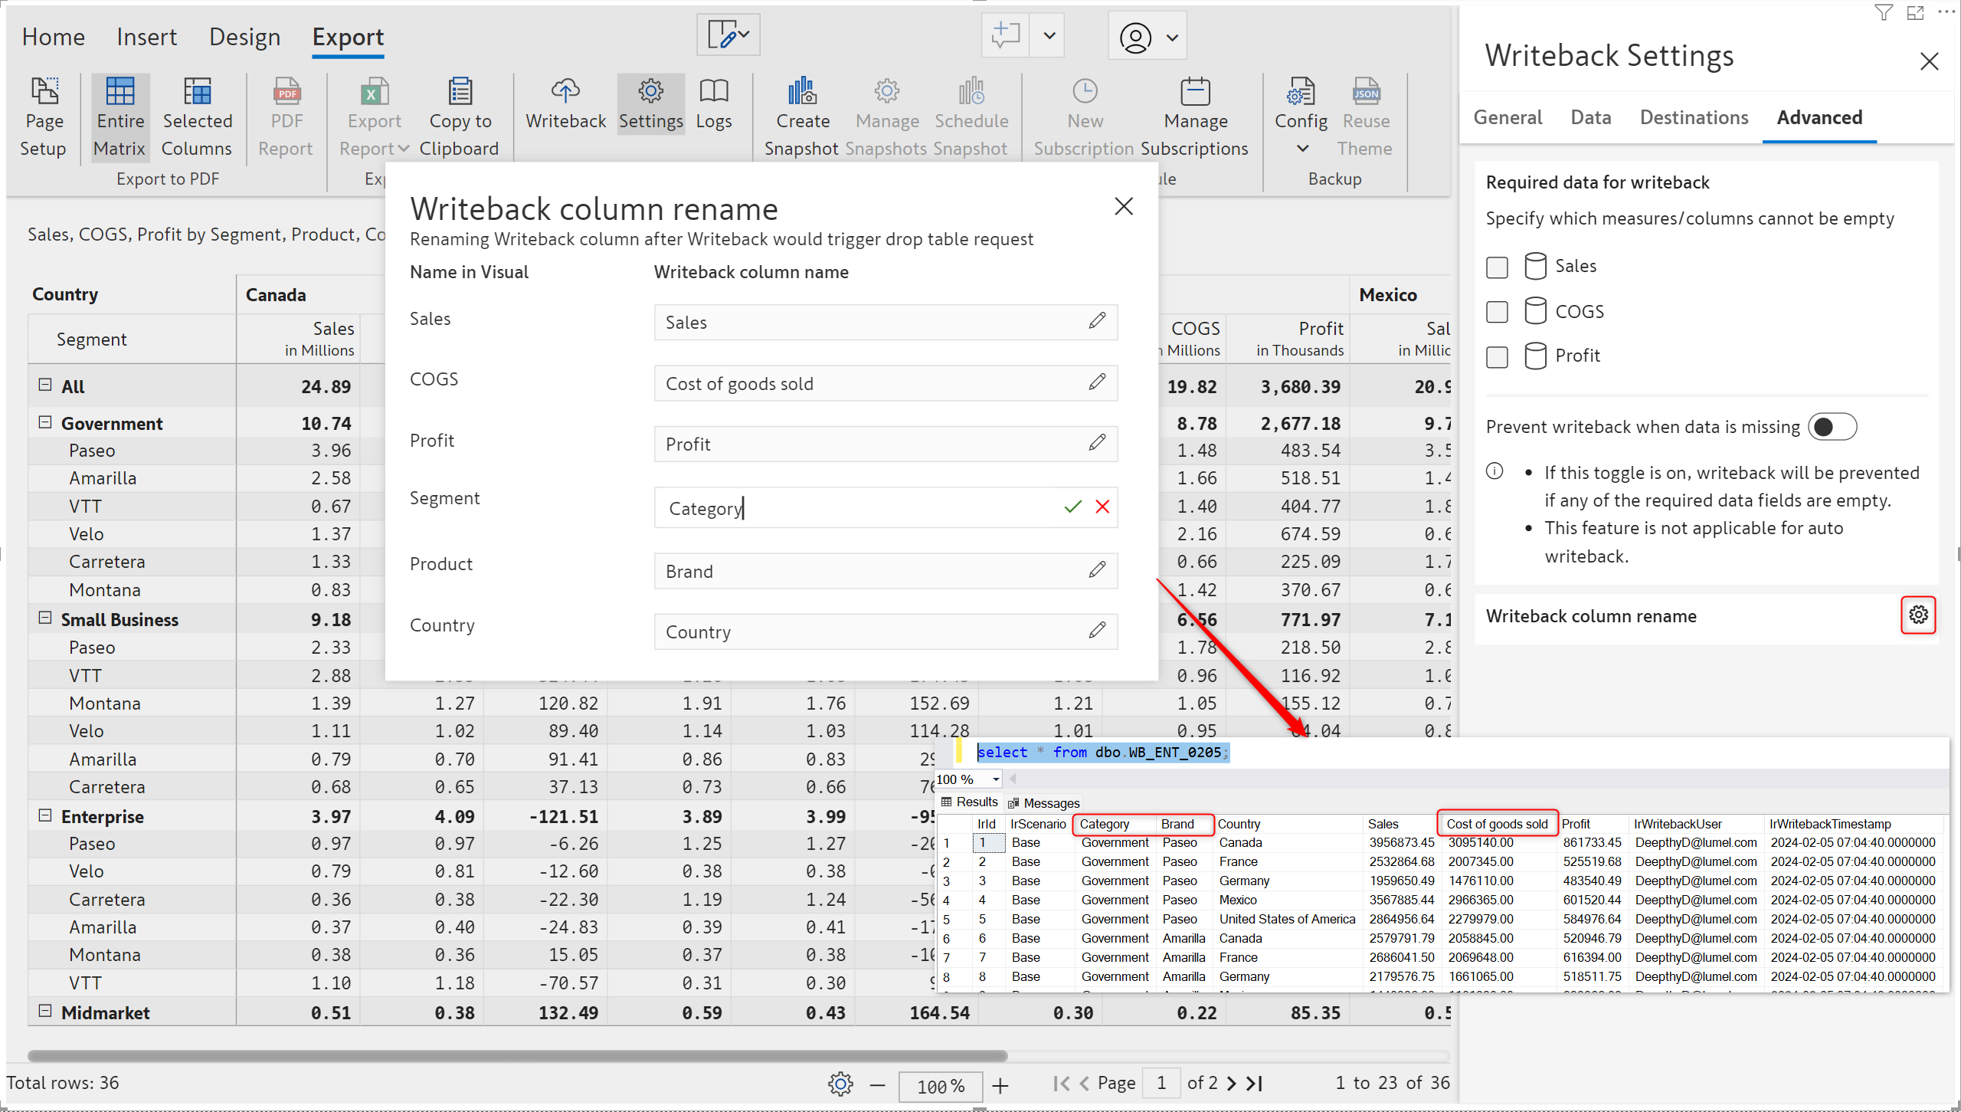
With the February release, you are not restricted to using the column names from the dataset while writing back, you can specify a custom column name if needed. For instance, if the column name in the data set is PY, you can rename it to PreviousYear for writeback. To rename columns, navigate to Writeback settings > Advanced tab > Writeback column rename.
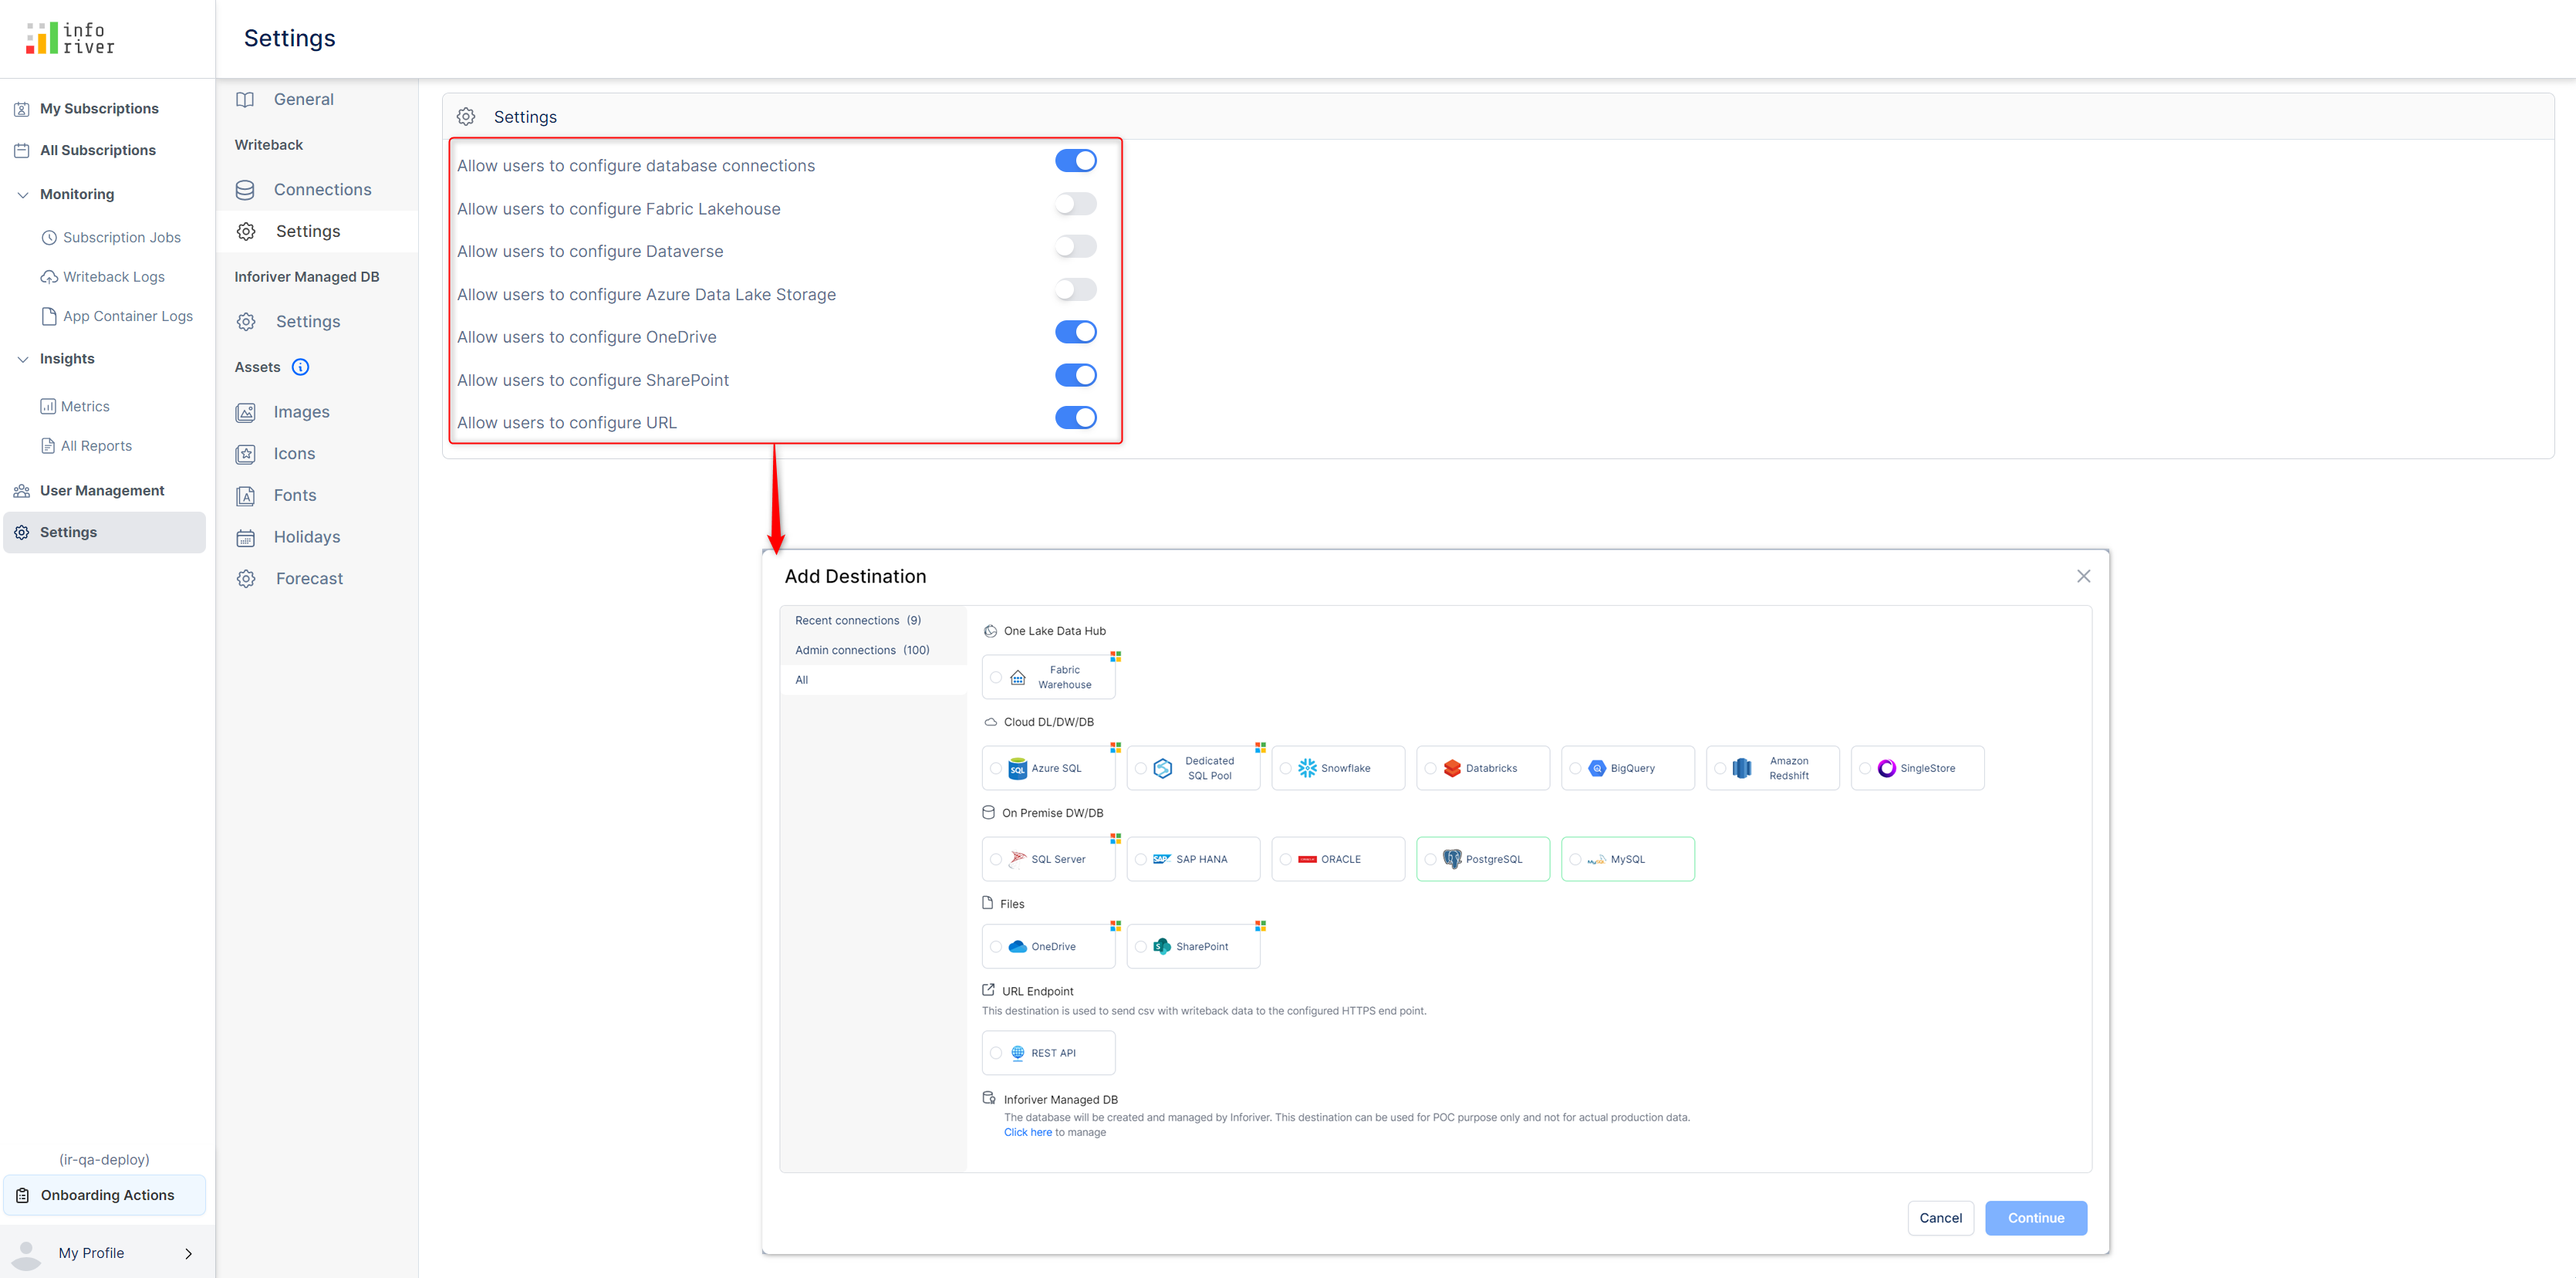
We have been expanding Inforiver’s writeback capability with support for a wide range of destinations. The destination list page has been re-designed, with destinations now organized into appropriate categories.
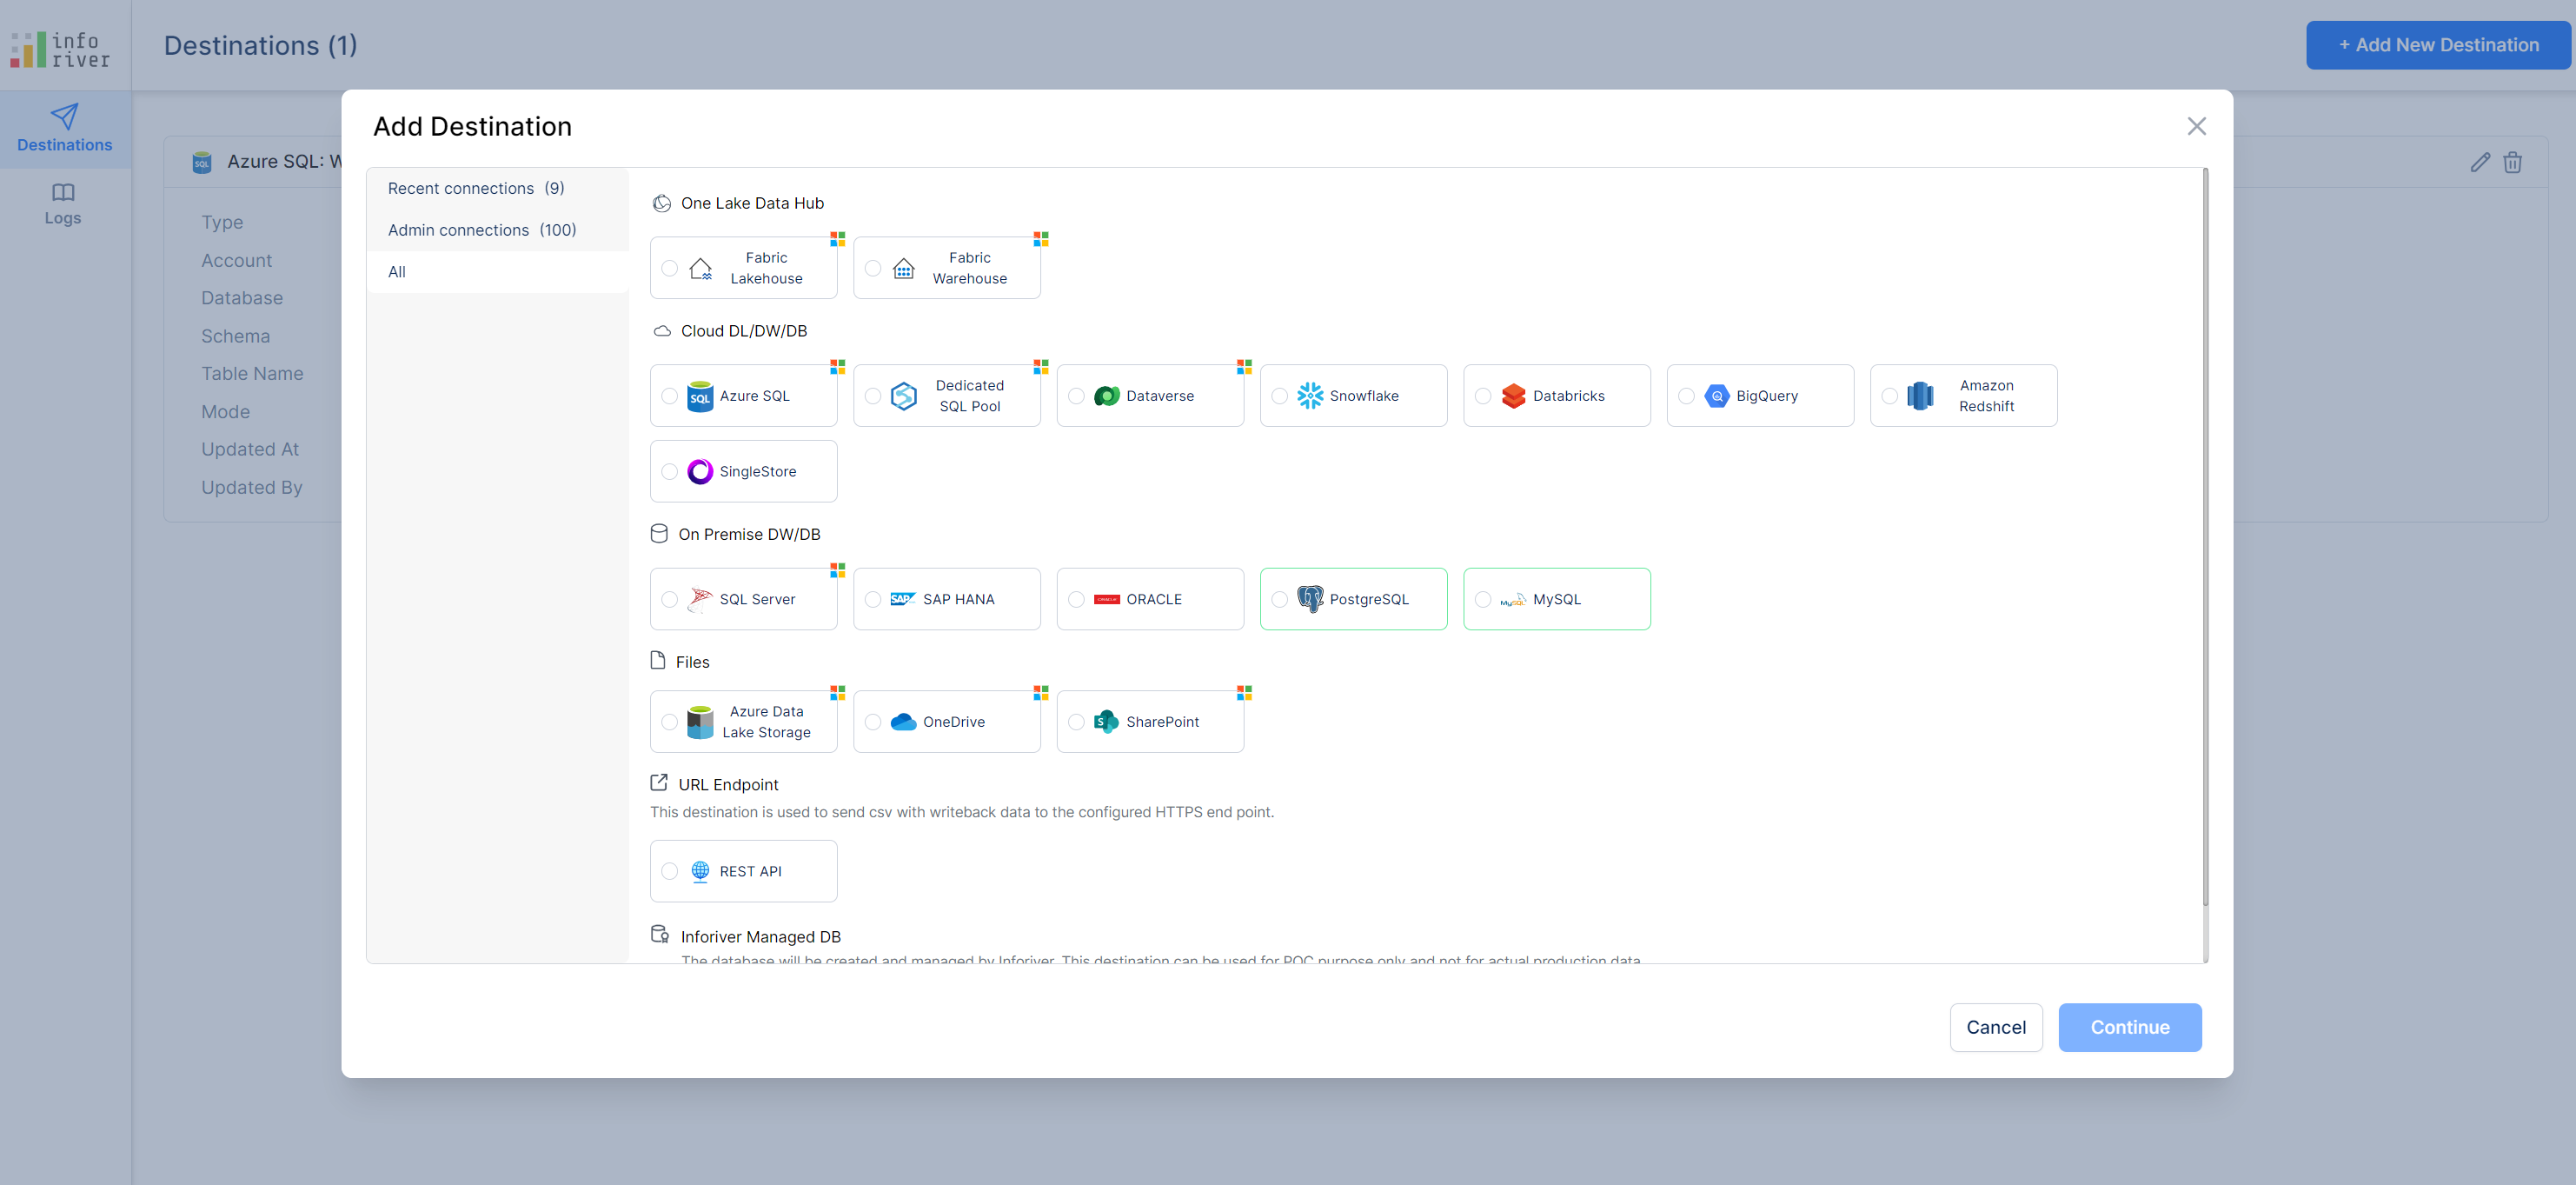
The Inforiver admin can restrict the type of destinations that can be created by report authors. These settings will be reflected in the Add Destination page as well.
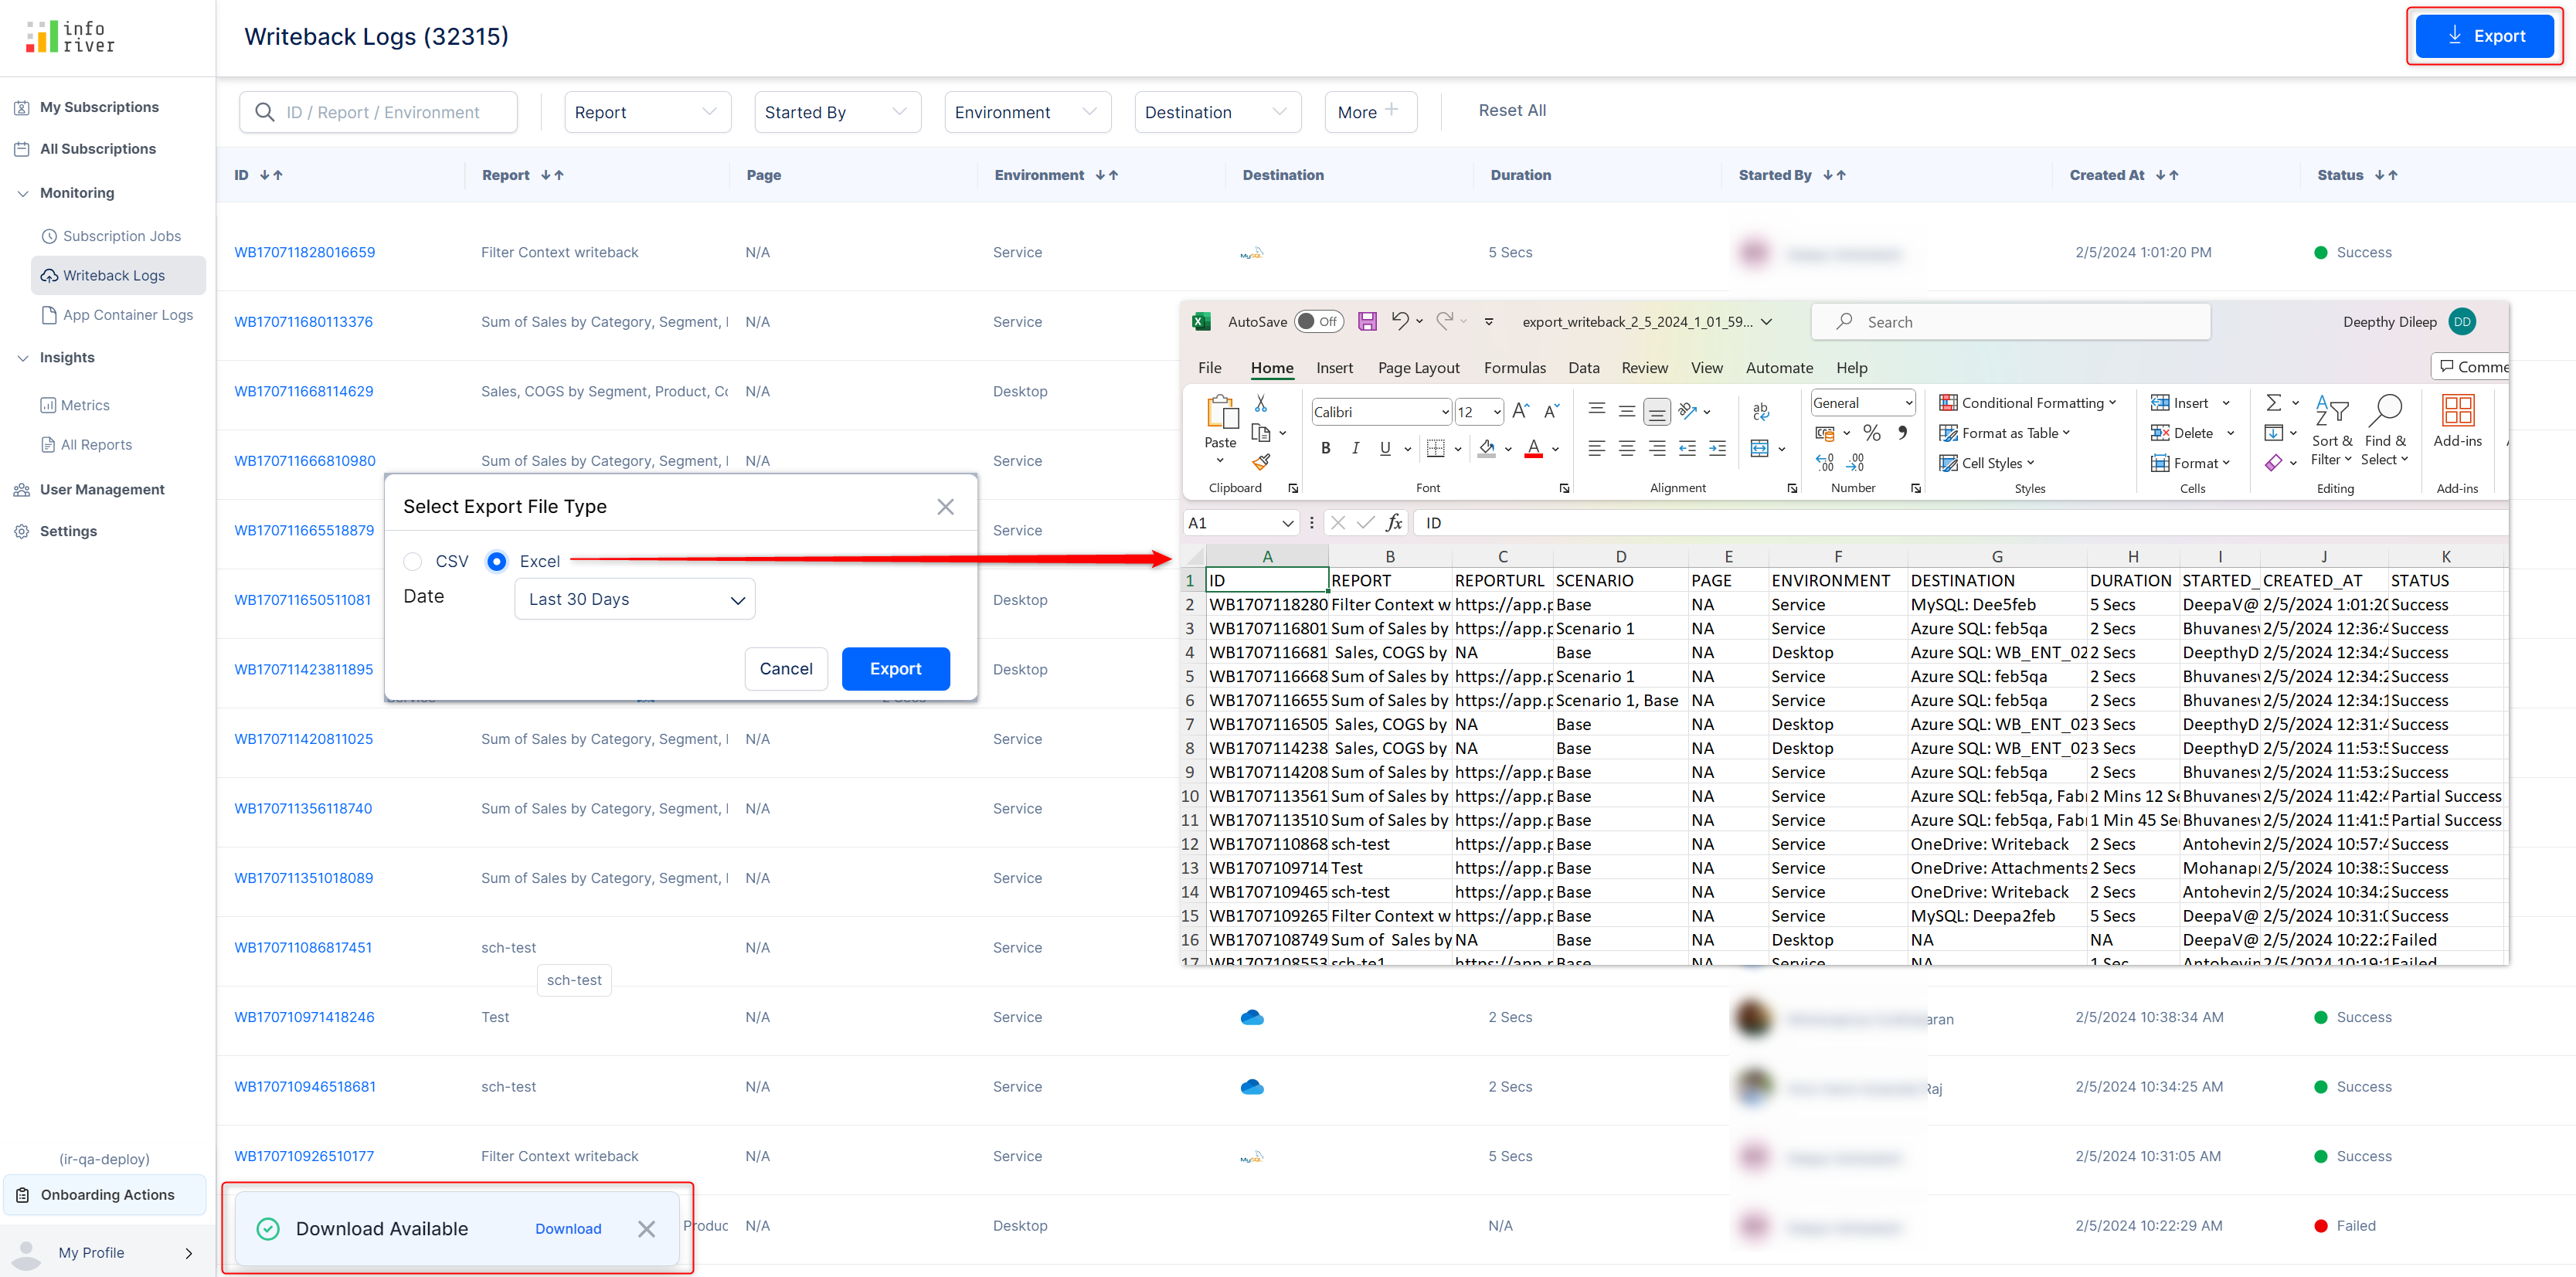
You can now export writeback logs to an Excel or CSV file. The export will retain any filters that have been applied on the logs page.
Inforiver allows you to source dropdown lists from a semantic model. You can do an on-demand refresh of the semantic model to reflect the latest changes in the source.
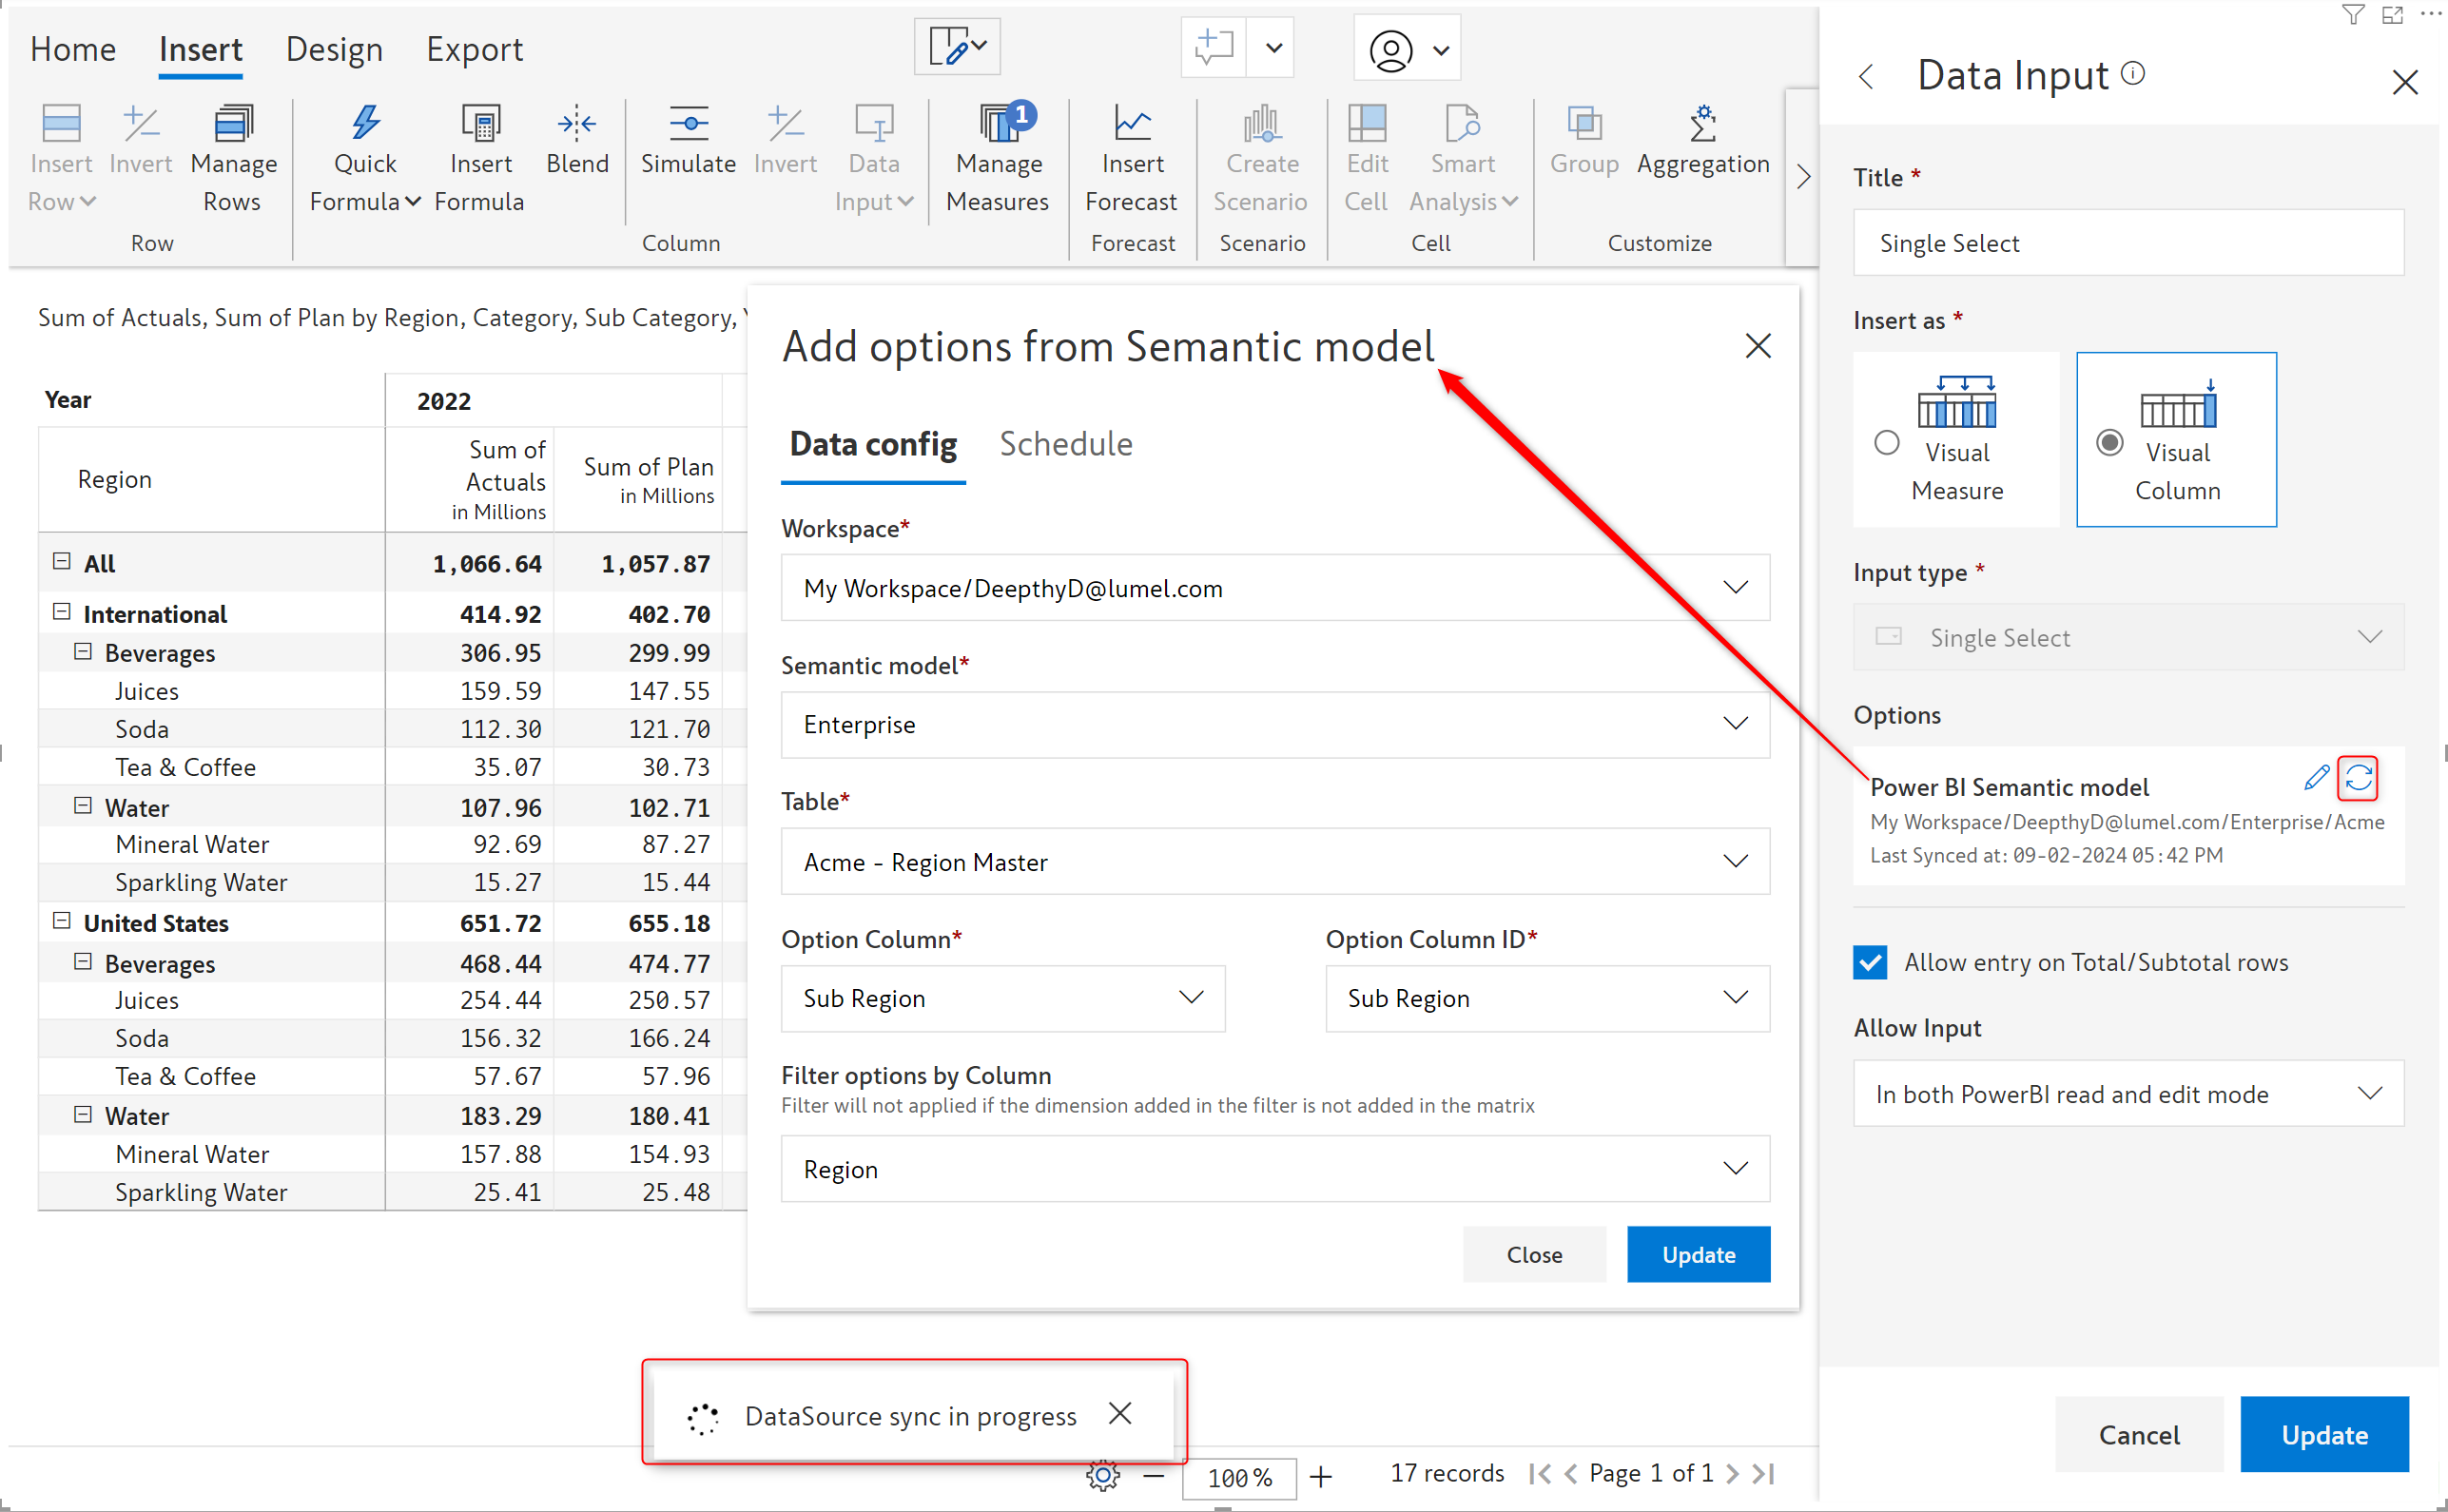
In the image above, notice there is a new ‘Filter options by Column’ option in the Semantic model settings. Inforiver’s data input allows you to create dependent dropdowns where the options available in the dropdown menu are dynamically updated based on a filter. For example, you can set a filter based on country, the cities dropdown dynamically updates to display only the cities associated with the selected country.
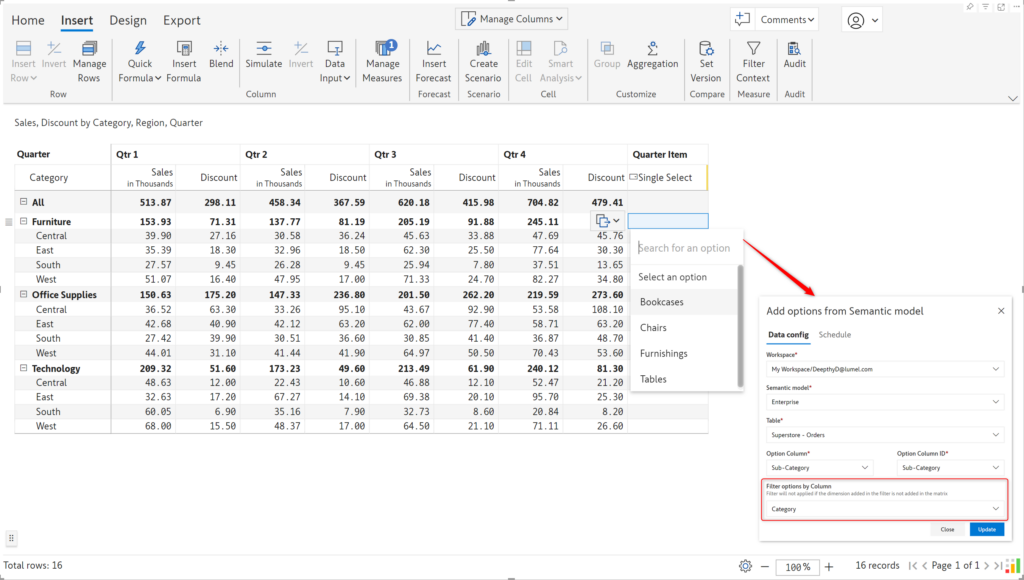
In the example, only the sub-categories that belong to a specific category (Furniture/Office Supplies/ Technology) are displayed in the dropdown.
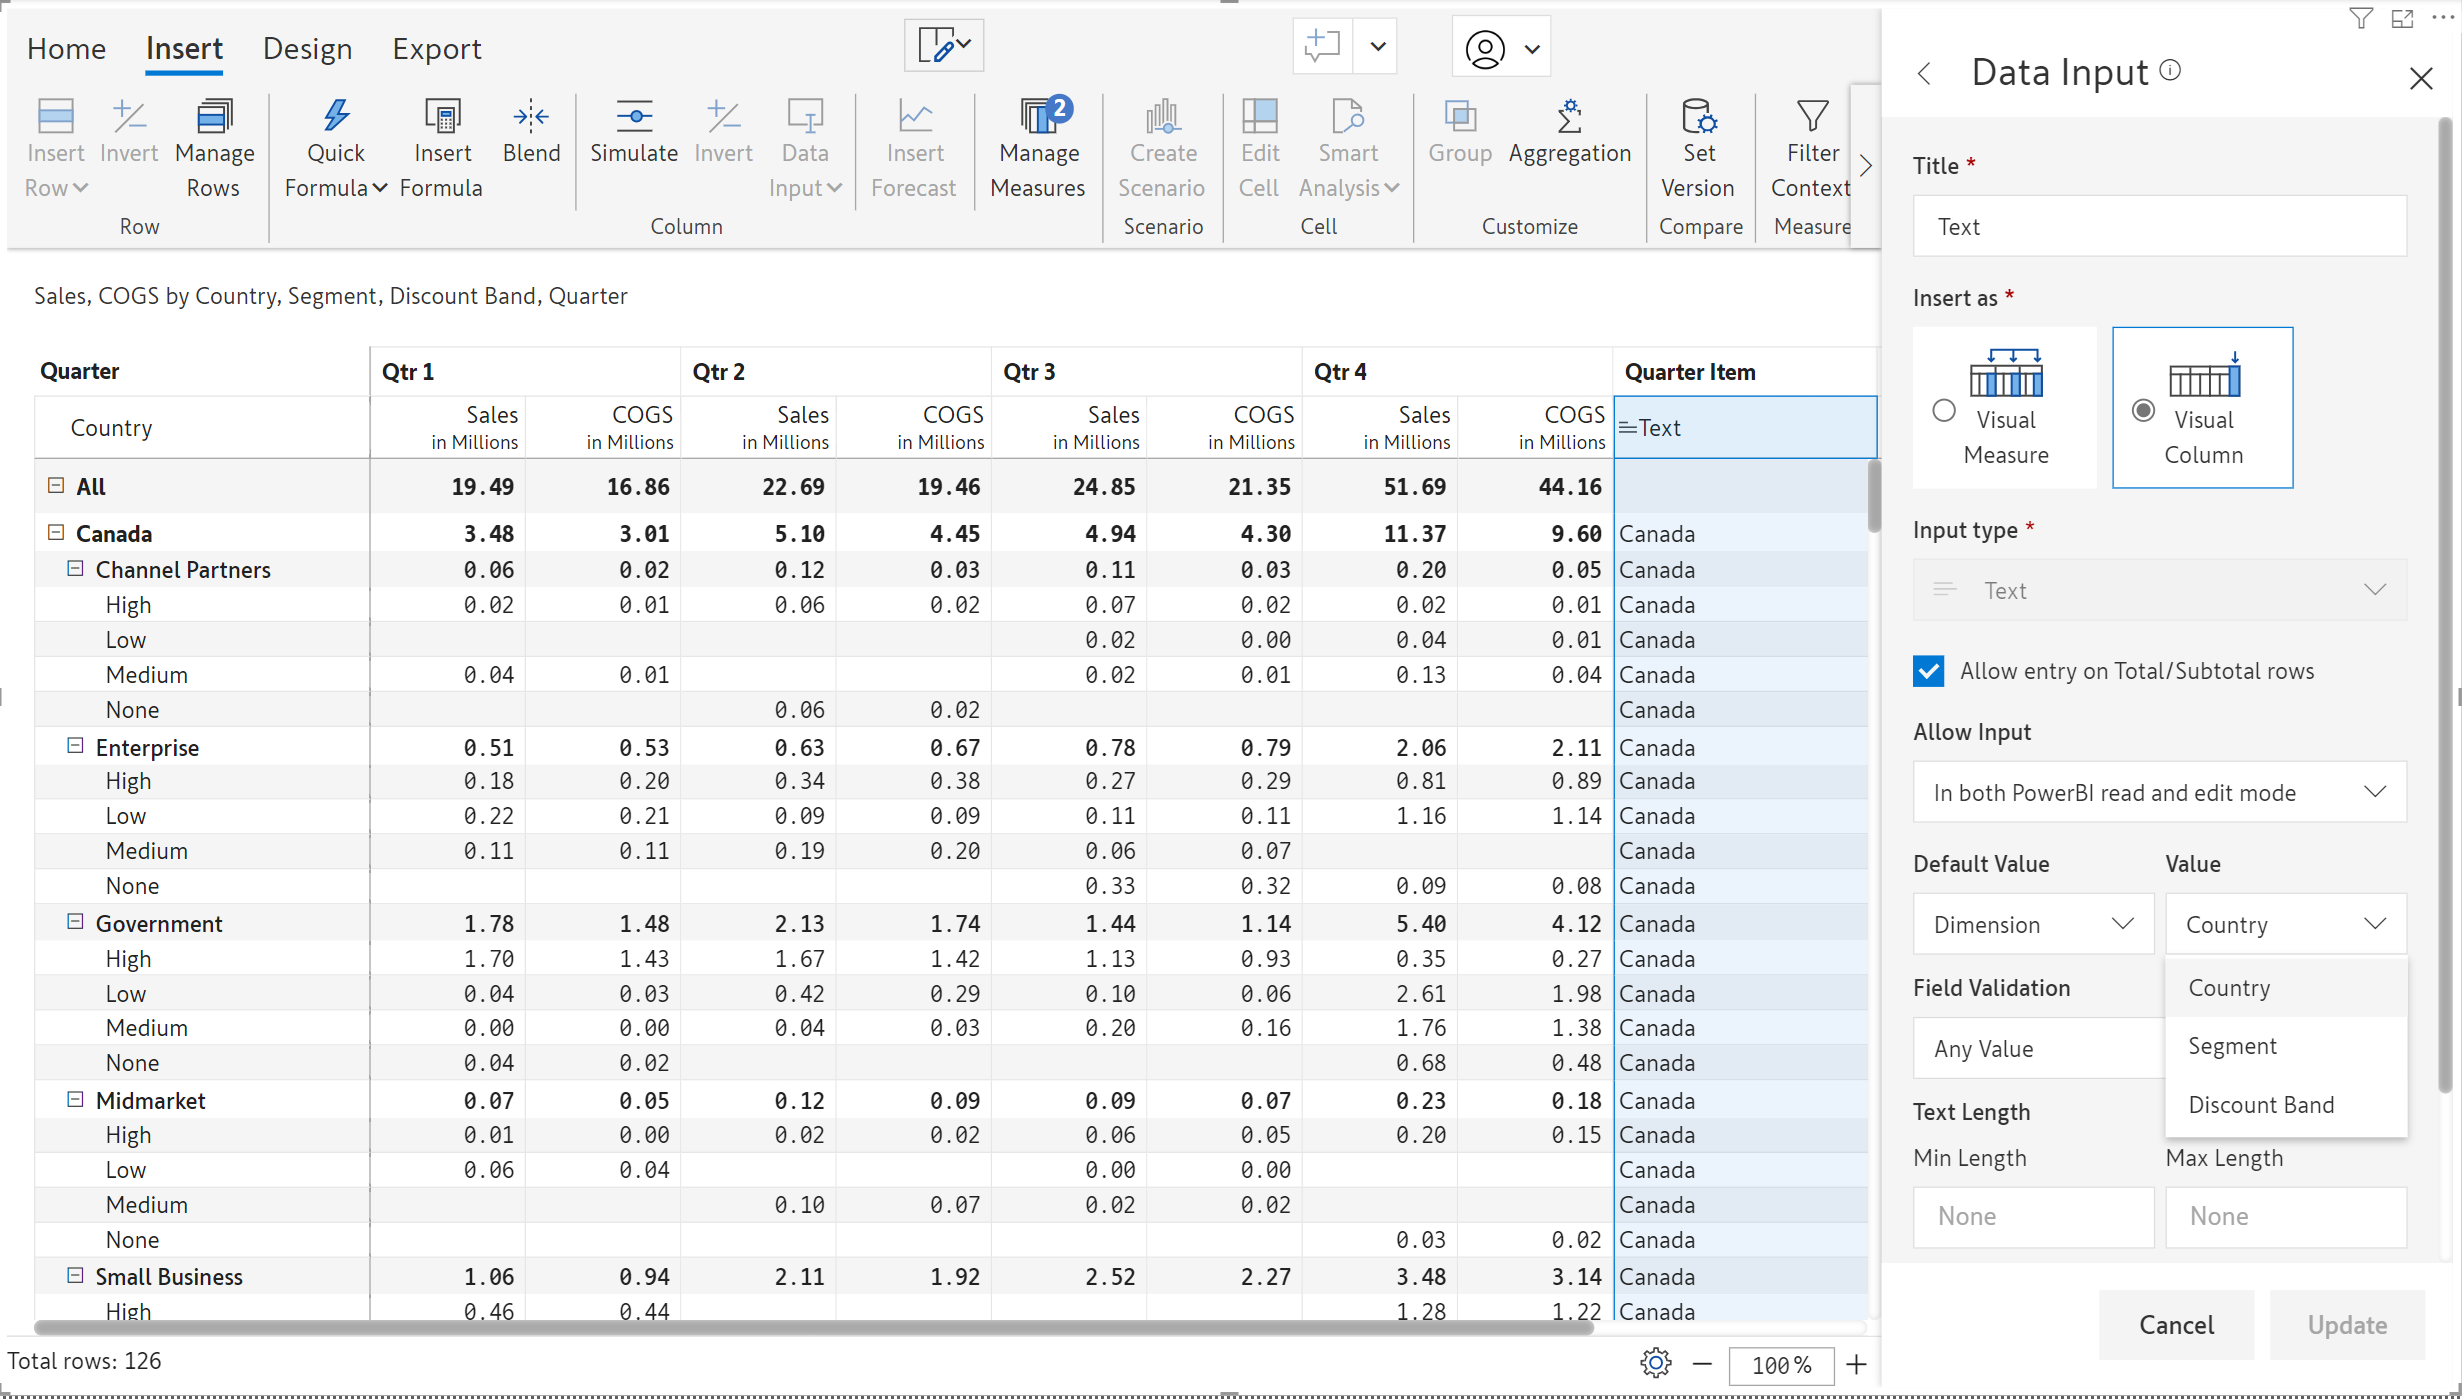
You can now populate dimension values for text data input fields. For example, if you have a Country dimension, you can refer to the country names (Canada/Germany/France, etc) in text data inputs. To manually enter values, select the ‘Static’ option from the Default Value dropdown. To use dimension values, select ‘Dimension’.
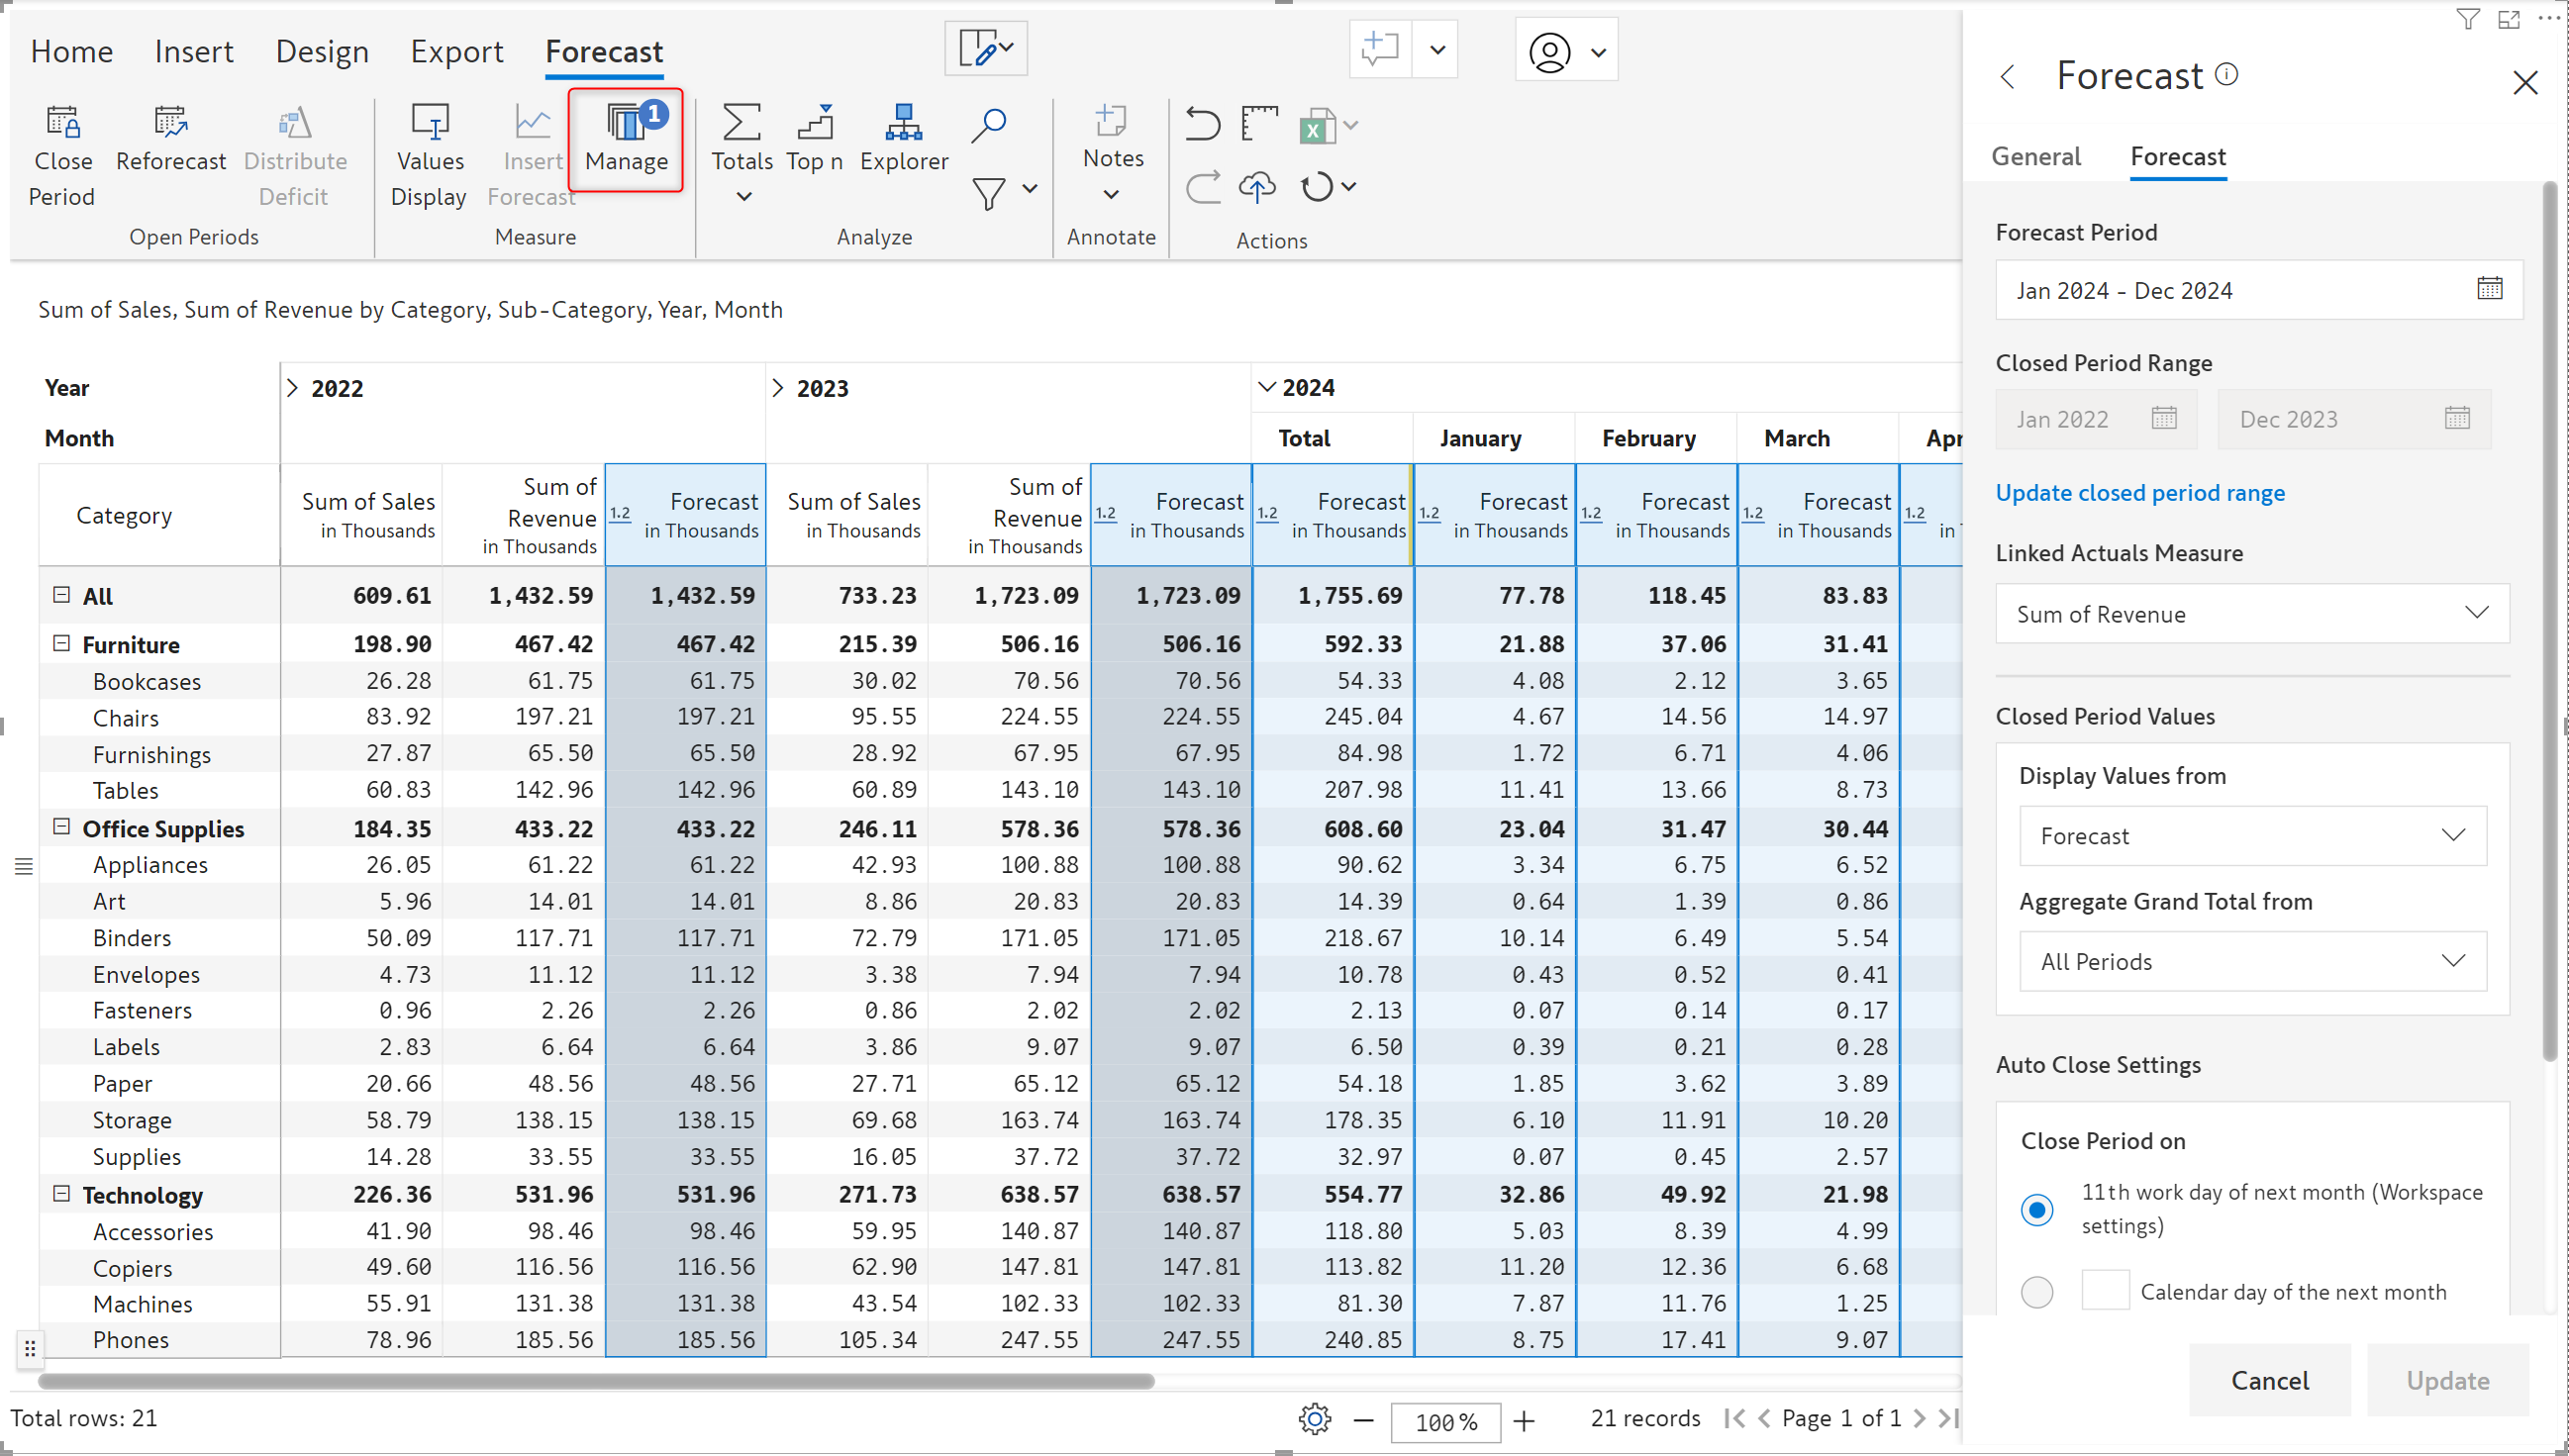
The forecasting UI has been fully re-designed with a more intuitive and navigable interface, streamlining your experience when creating rolling forecasts or performing reforecasting.
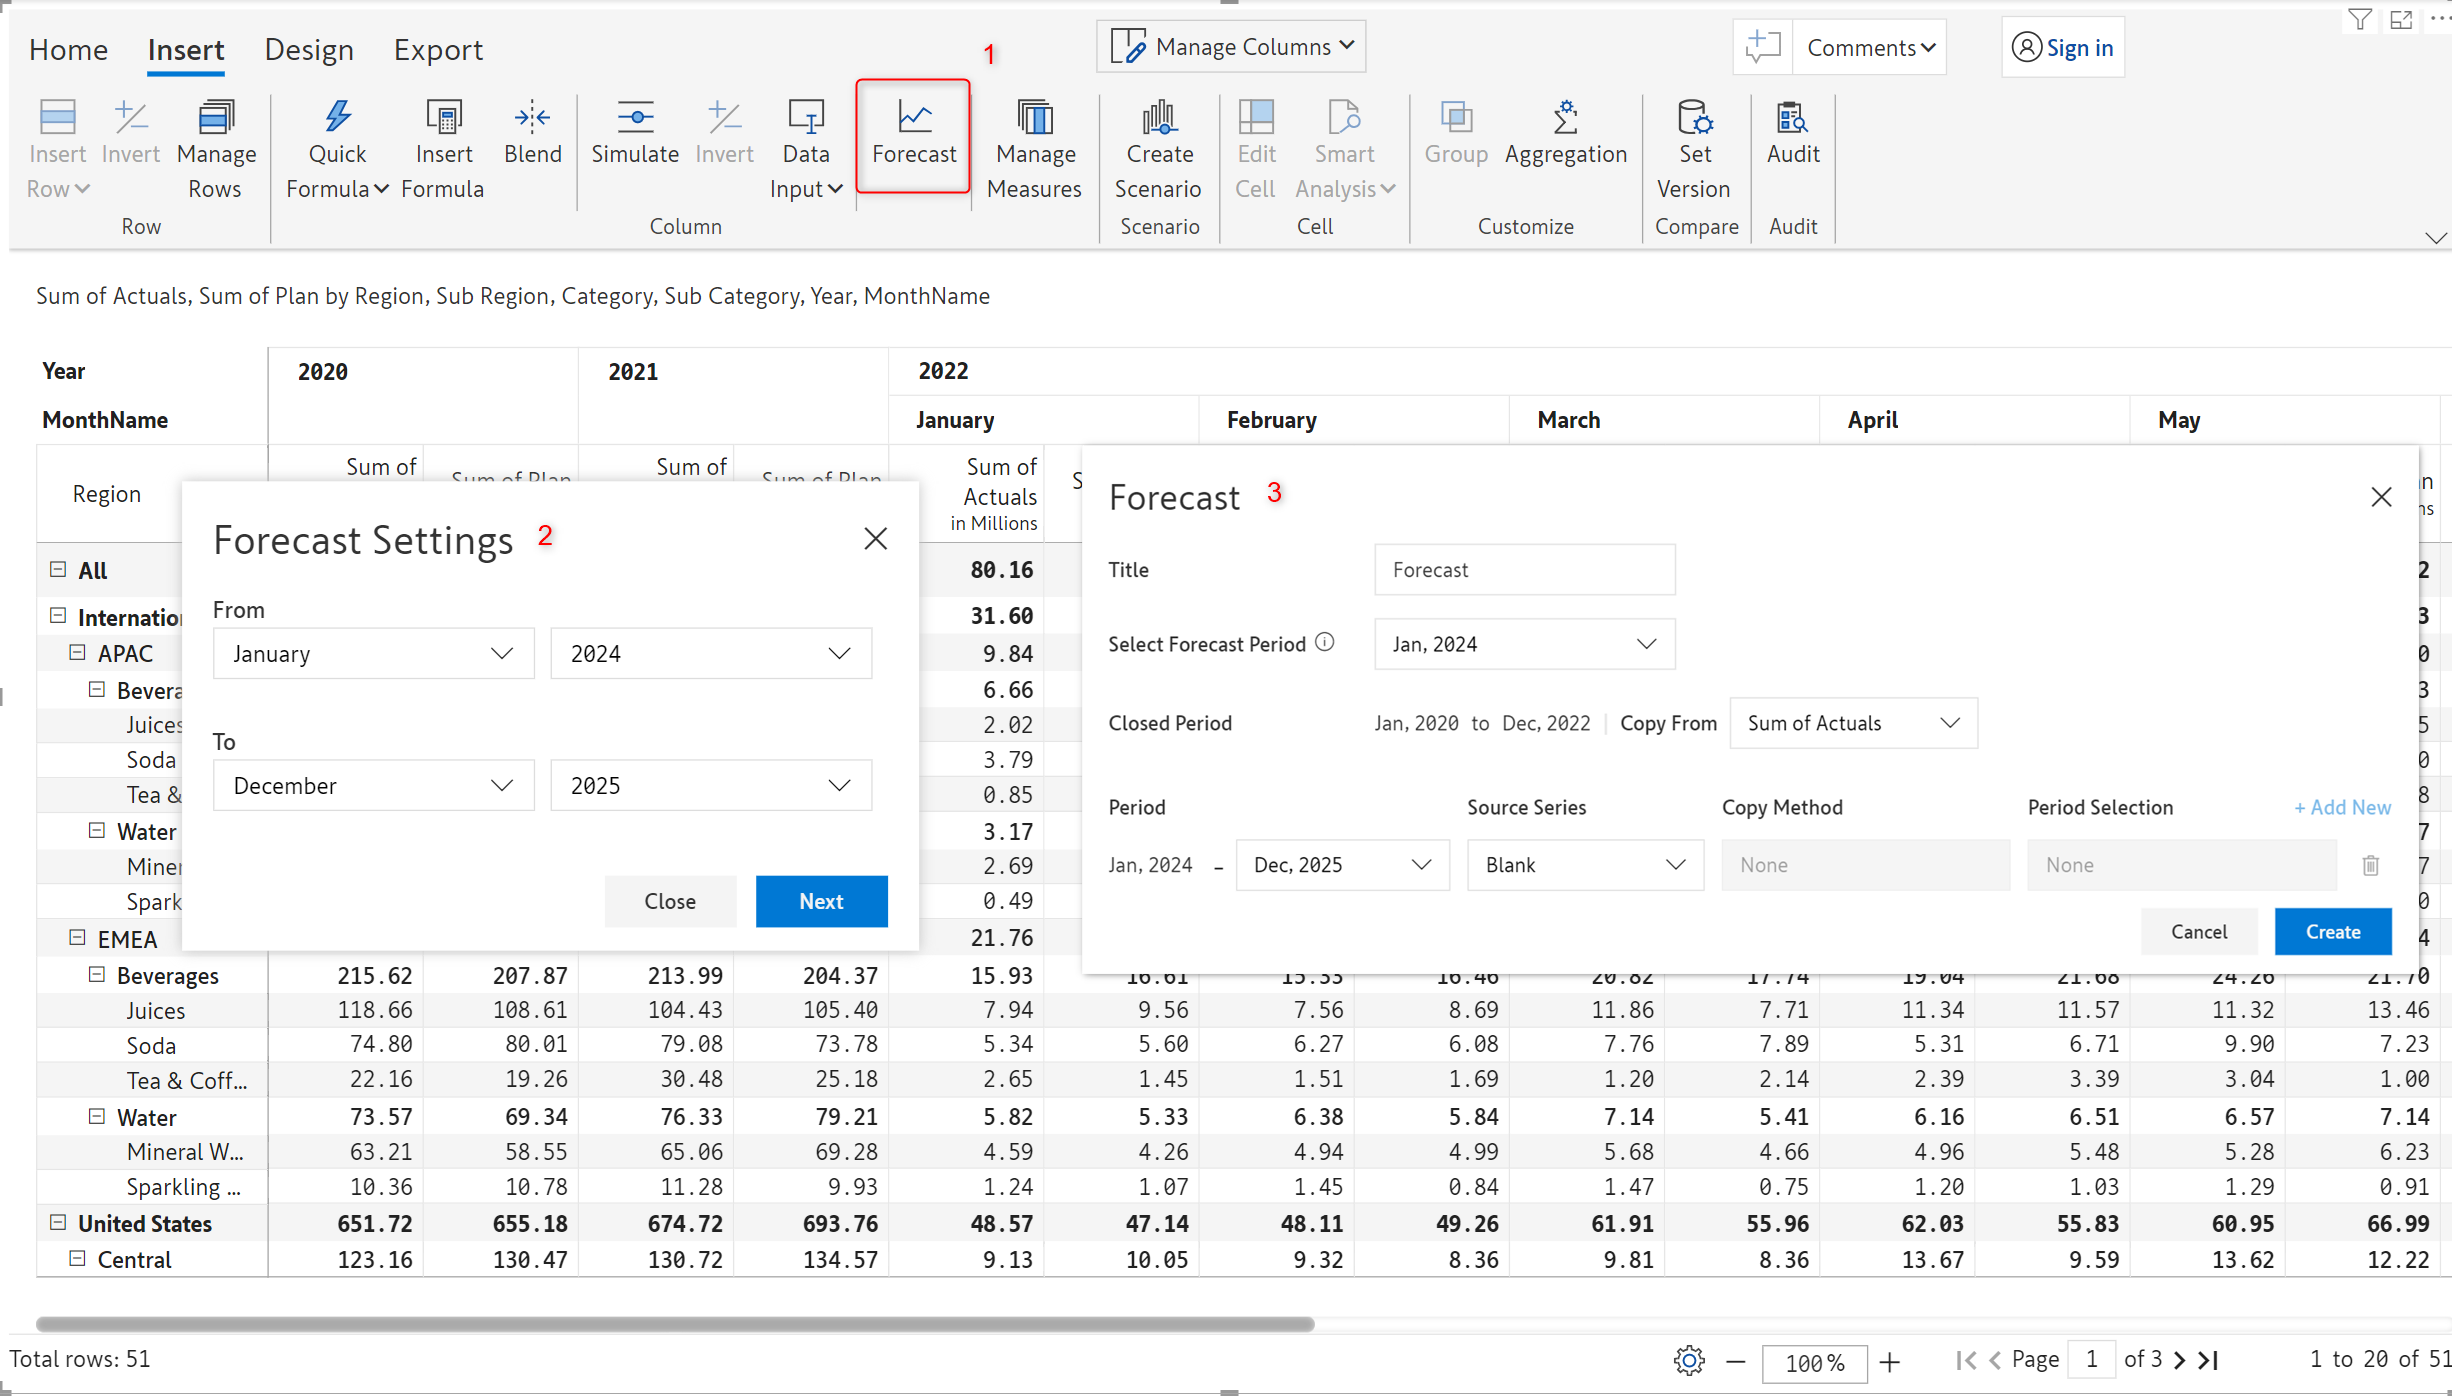
Forecast interface in earlier versions:
After creating a forecast, a dedicated forecast ribbon is enabled from where you can manage forecasts, insert additional forecast periods, close forecasts, and distribute deficits.
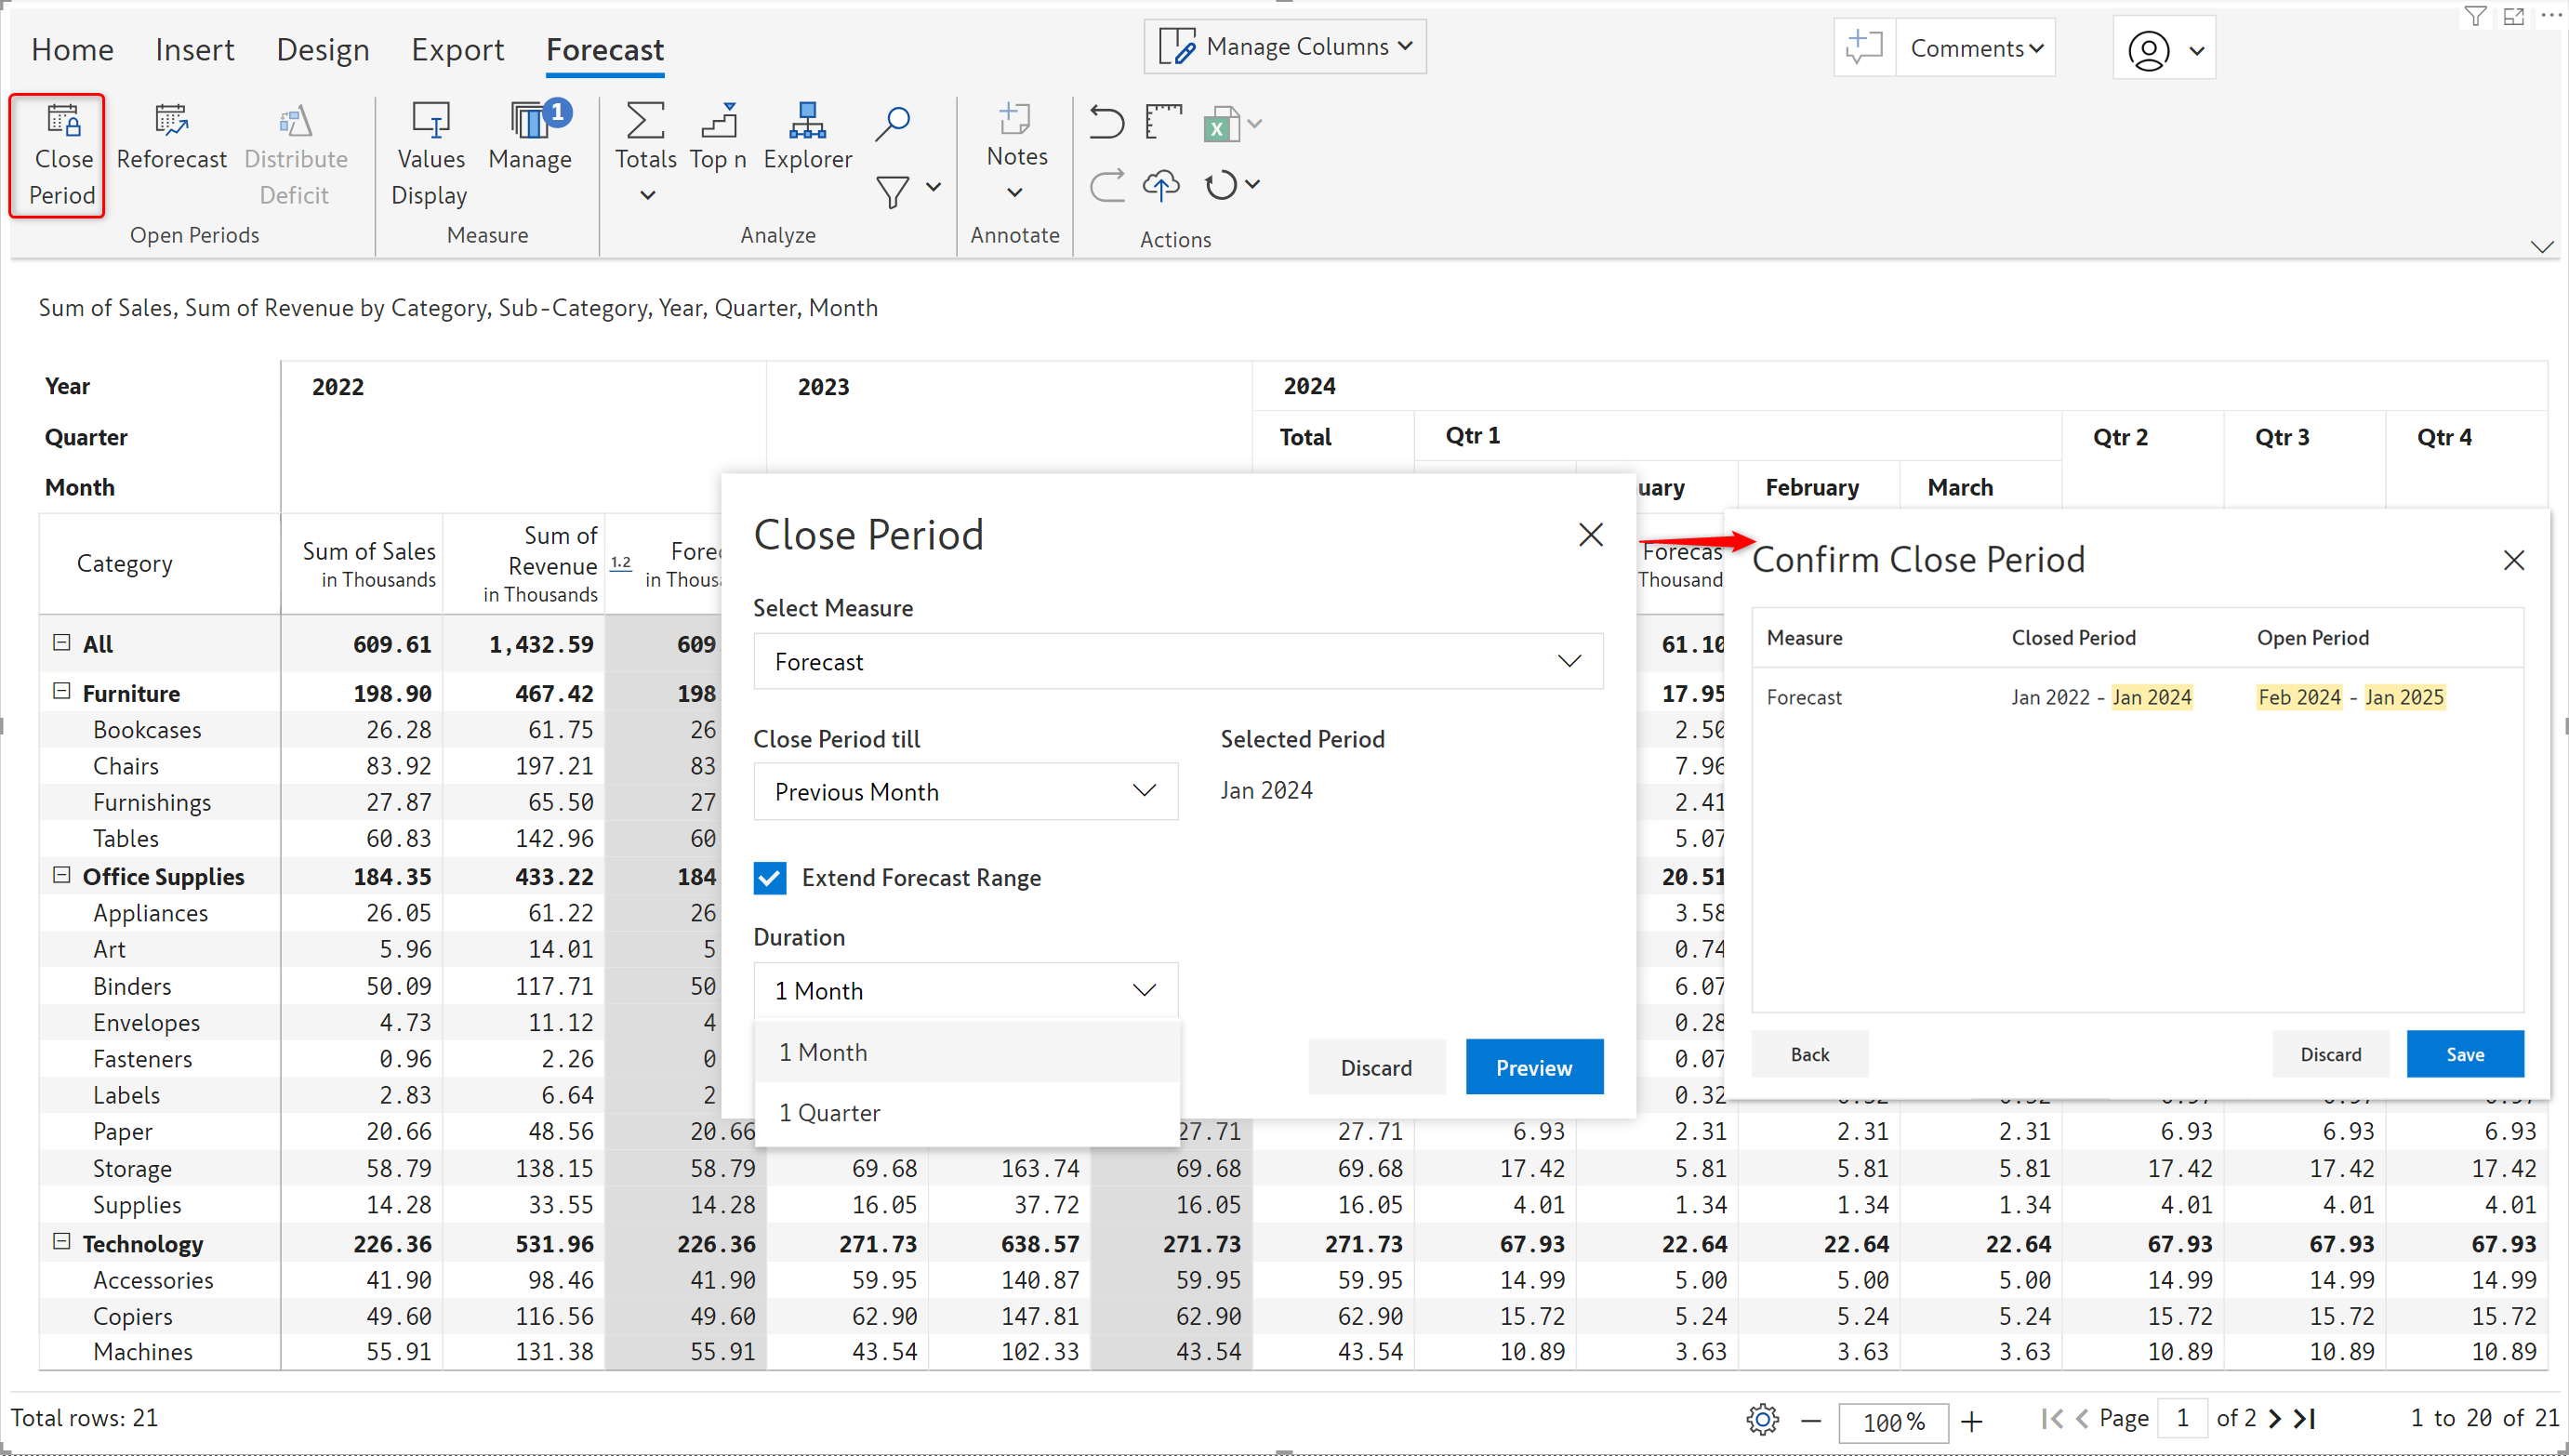
After the actuals are available for a particular period, you can close the forecast with the new Close Period UI. When you close a forecast period, you can also extend the forecast – for instance, if you are forecasting for Jan to Dec 2024, when you close the January forecast, you can extend the forecast time frame by a month or a quarter.
Inforiver can automatically close forecasts. This simplifies forecast management when multiple reports with multiple forecast measures are involved. The auto-close can be set up at the report level or workspace level.
The Inforiver admin console has a forecast tab from where admins can specify when to close forecast measures for that tenant.
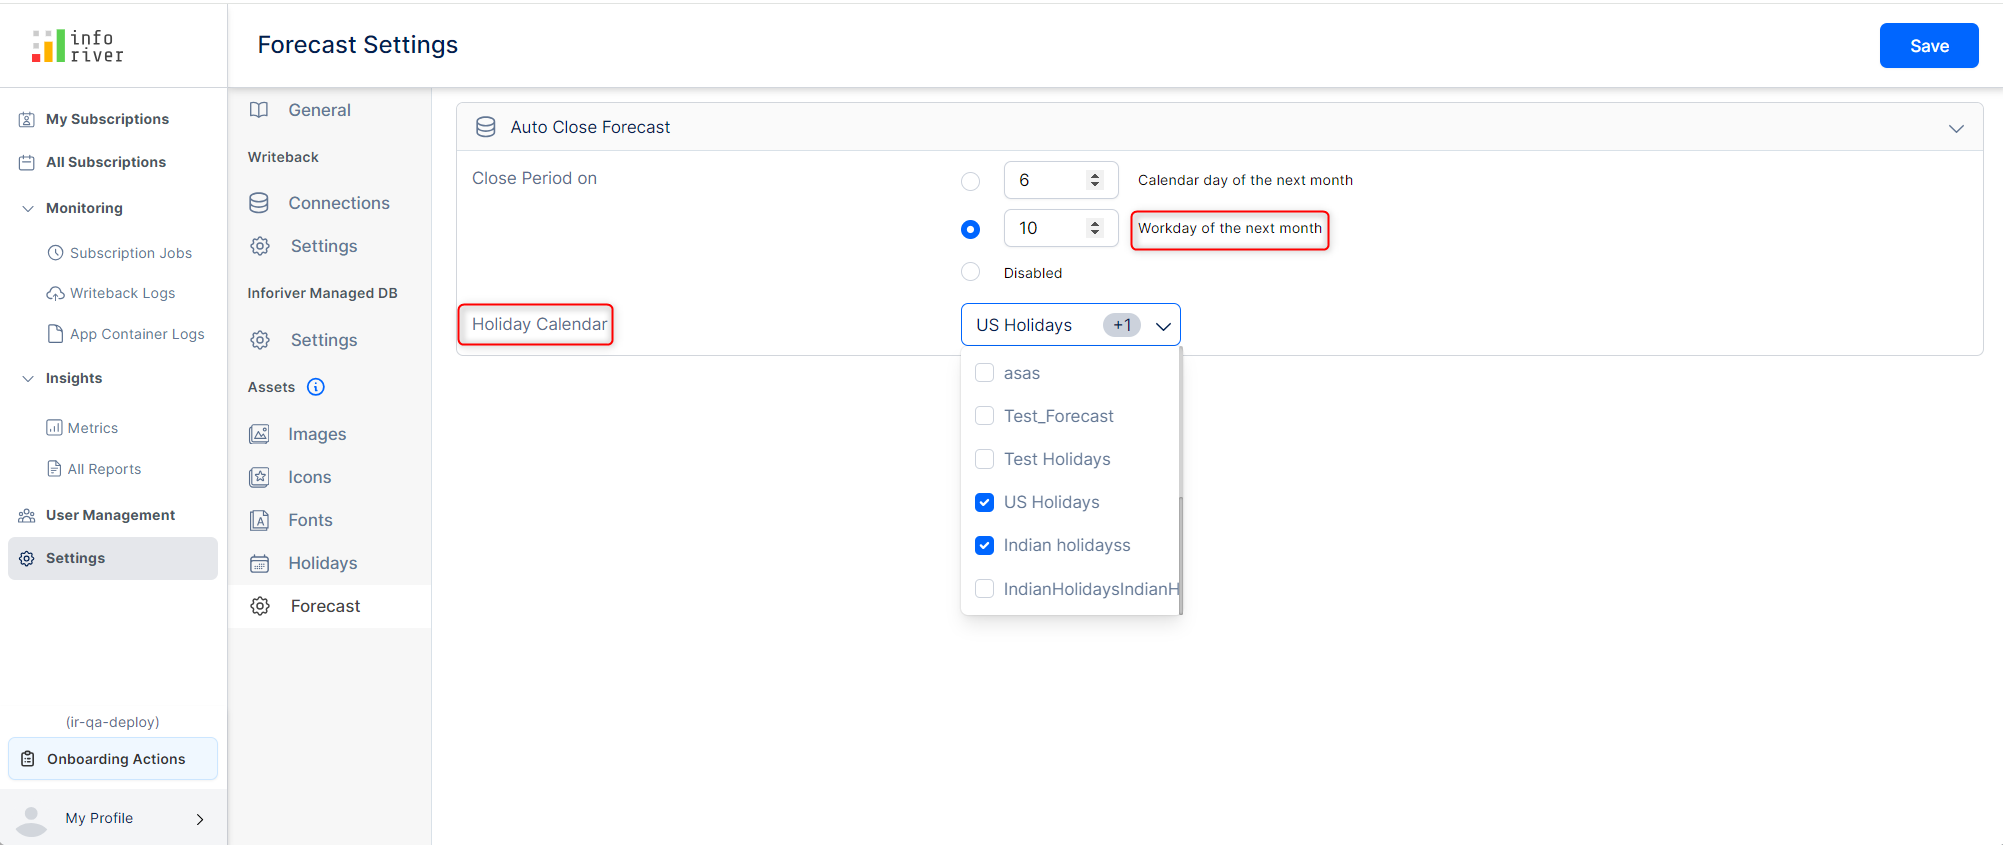
The settings specified in the Inforiver admin console are reflected in the manage forecast settings of the visual.

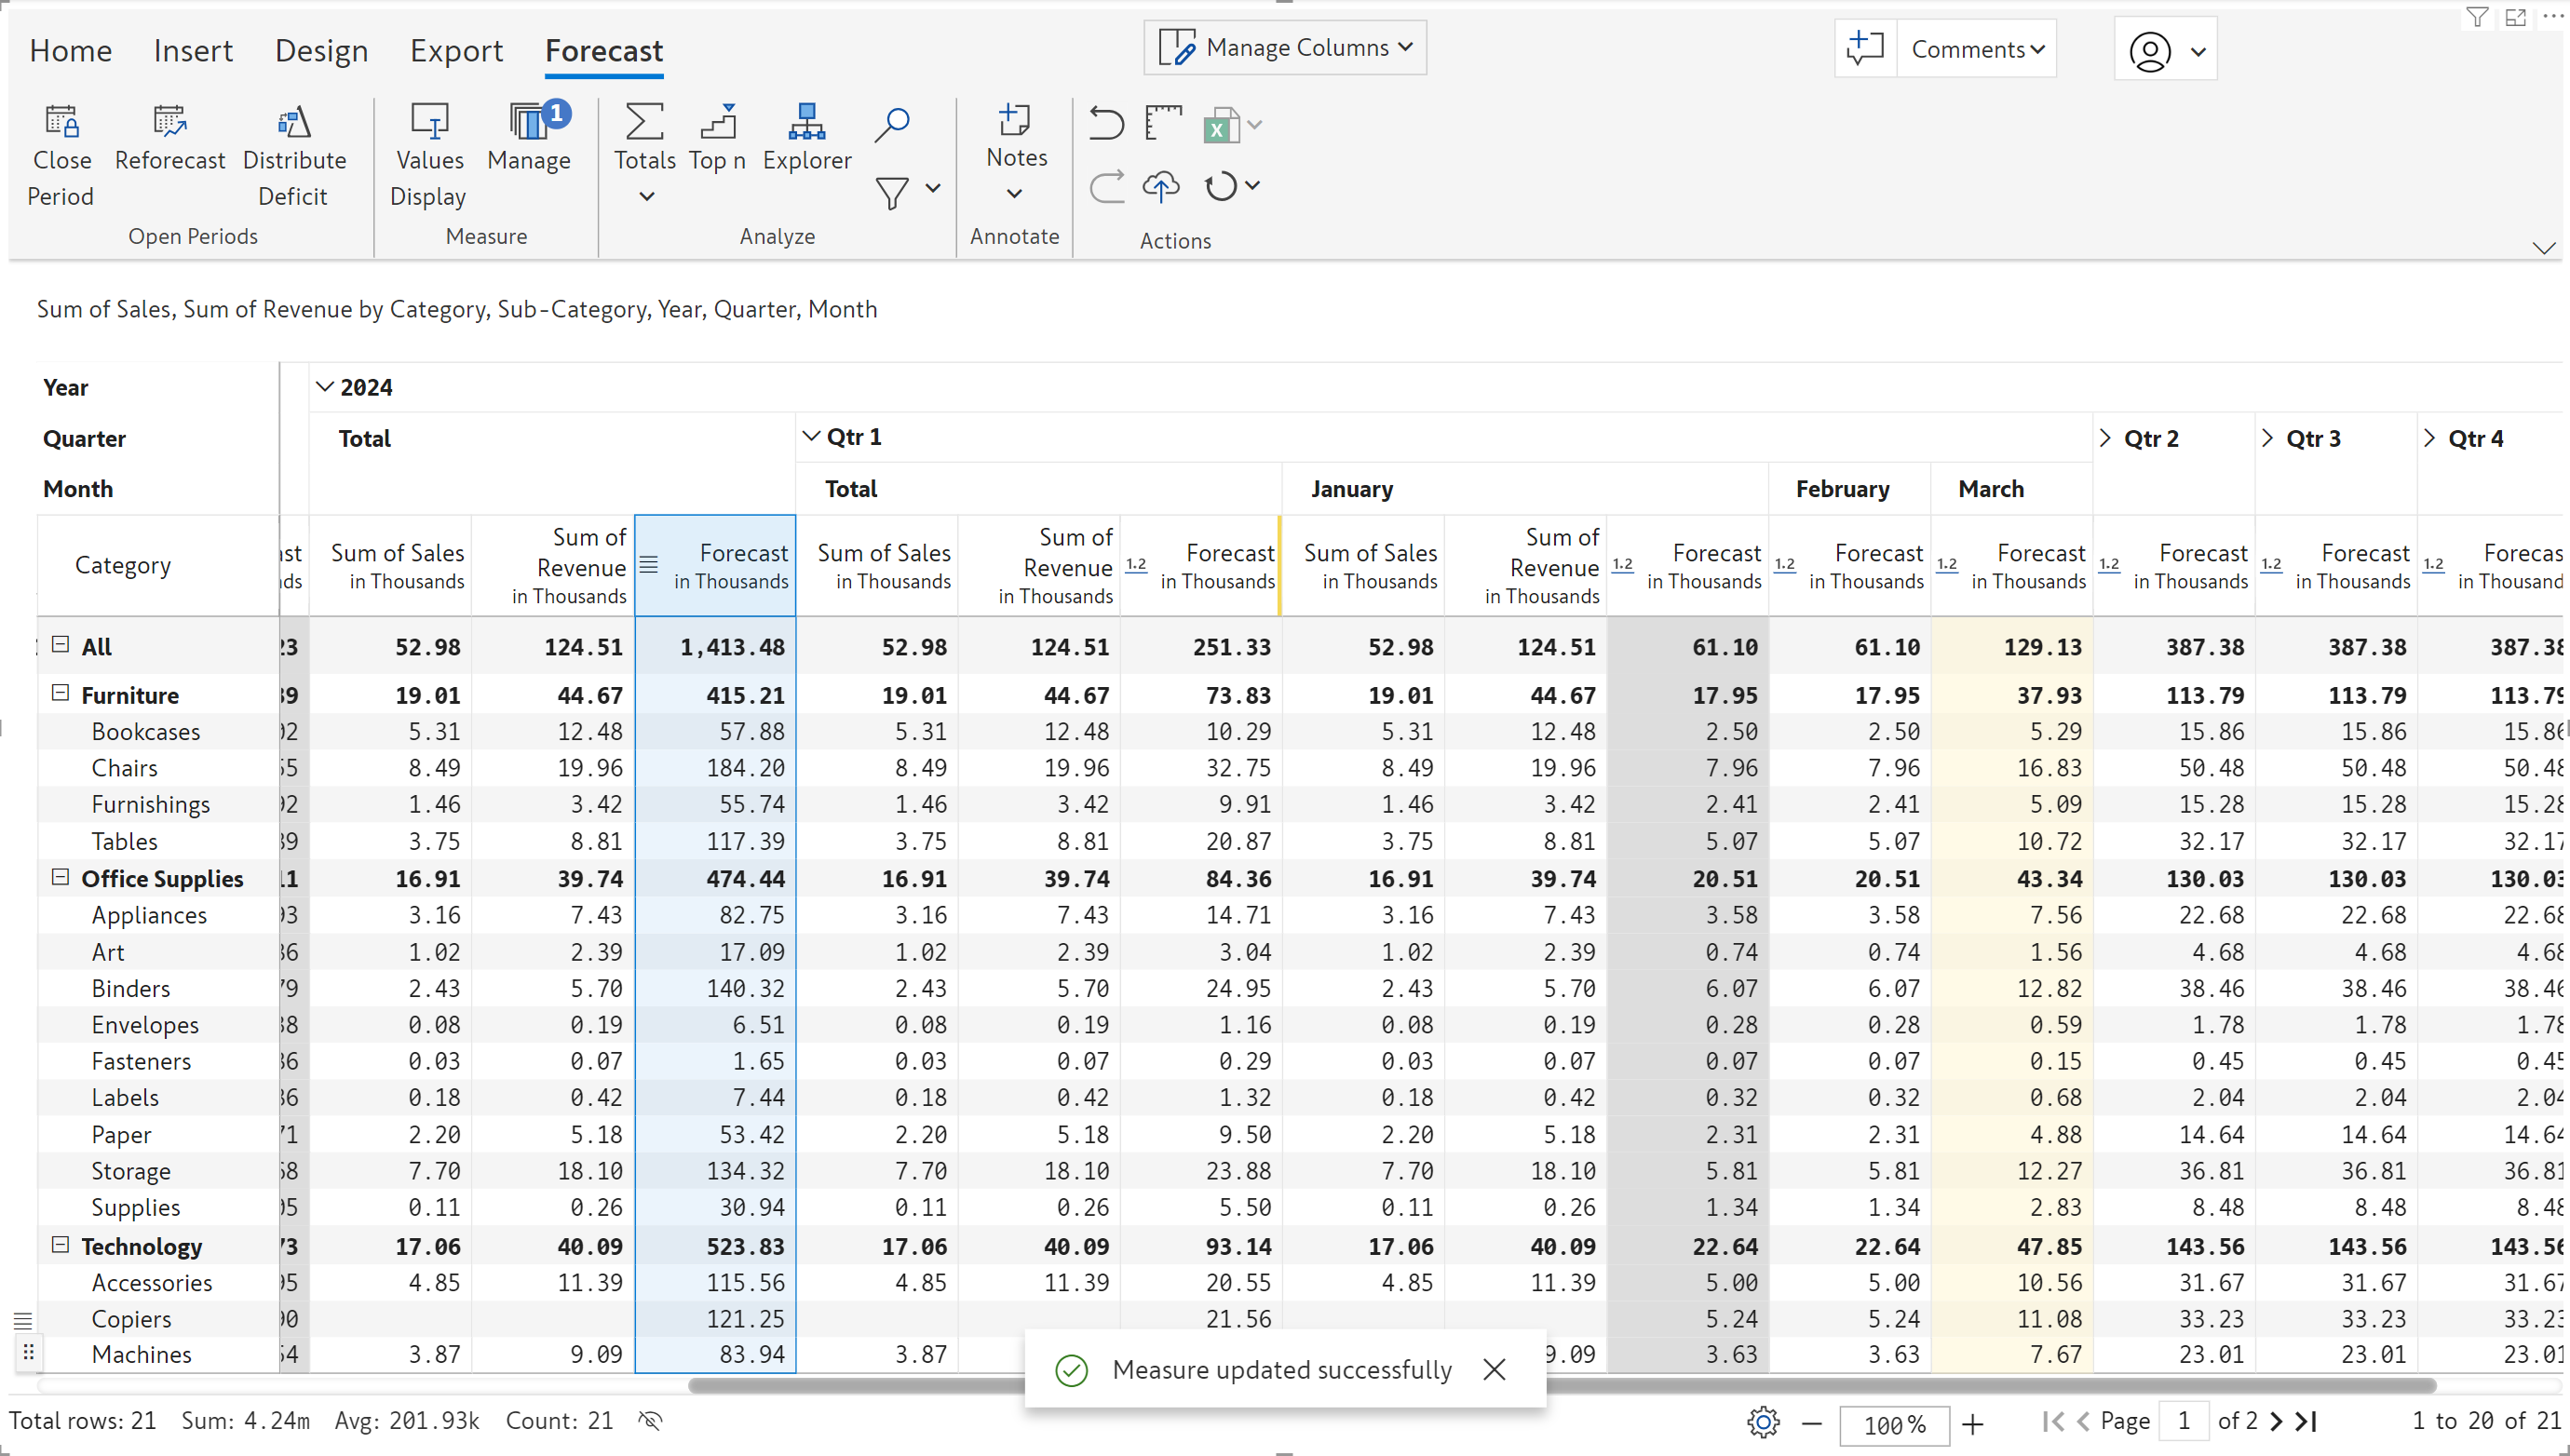
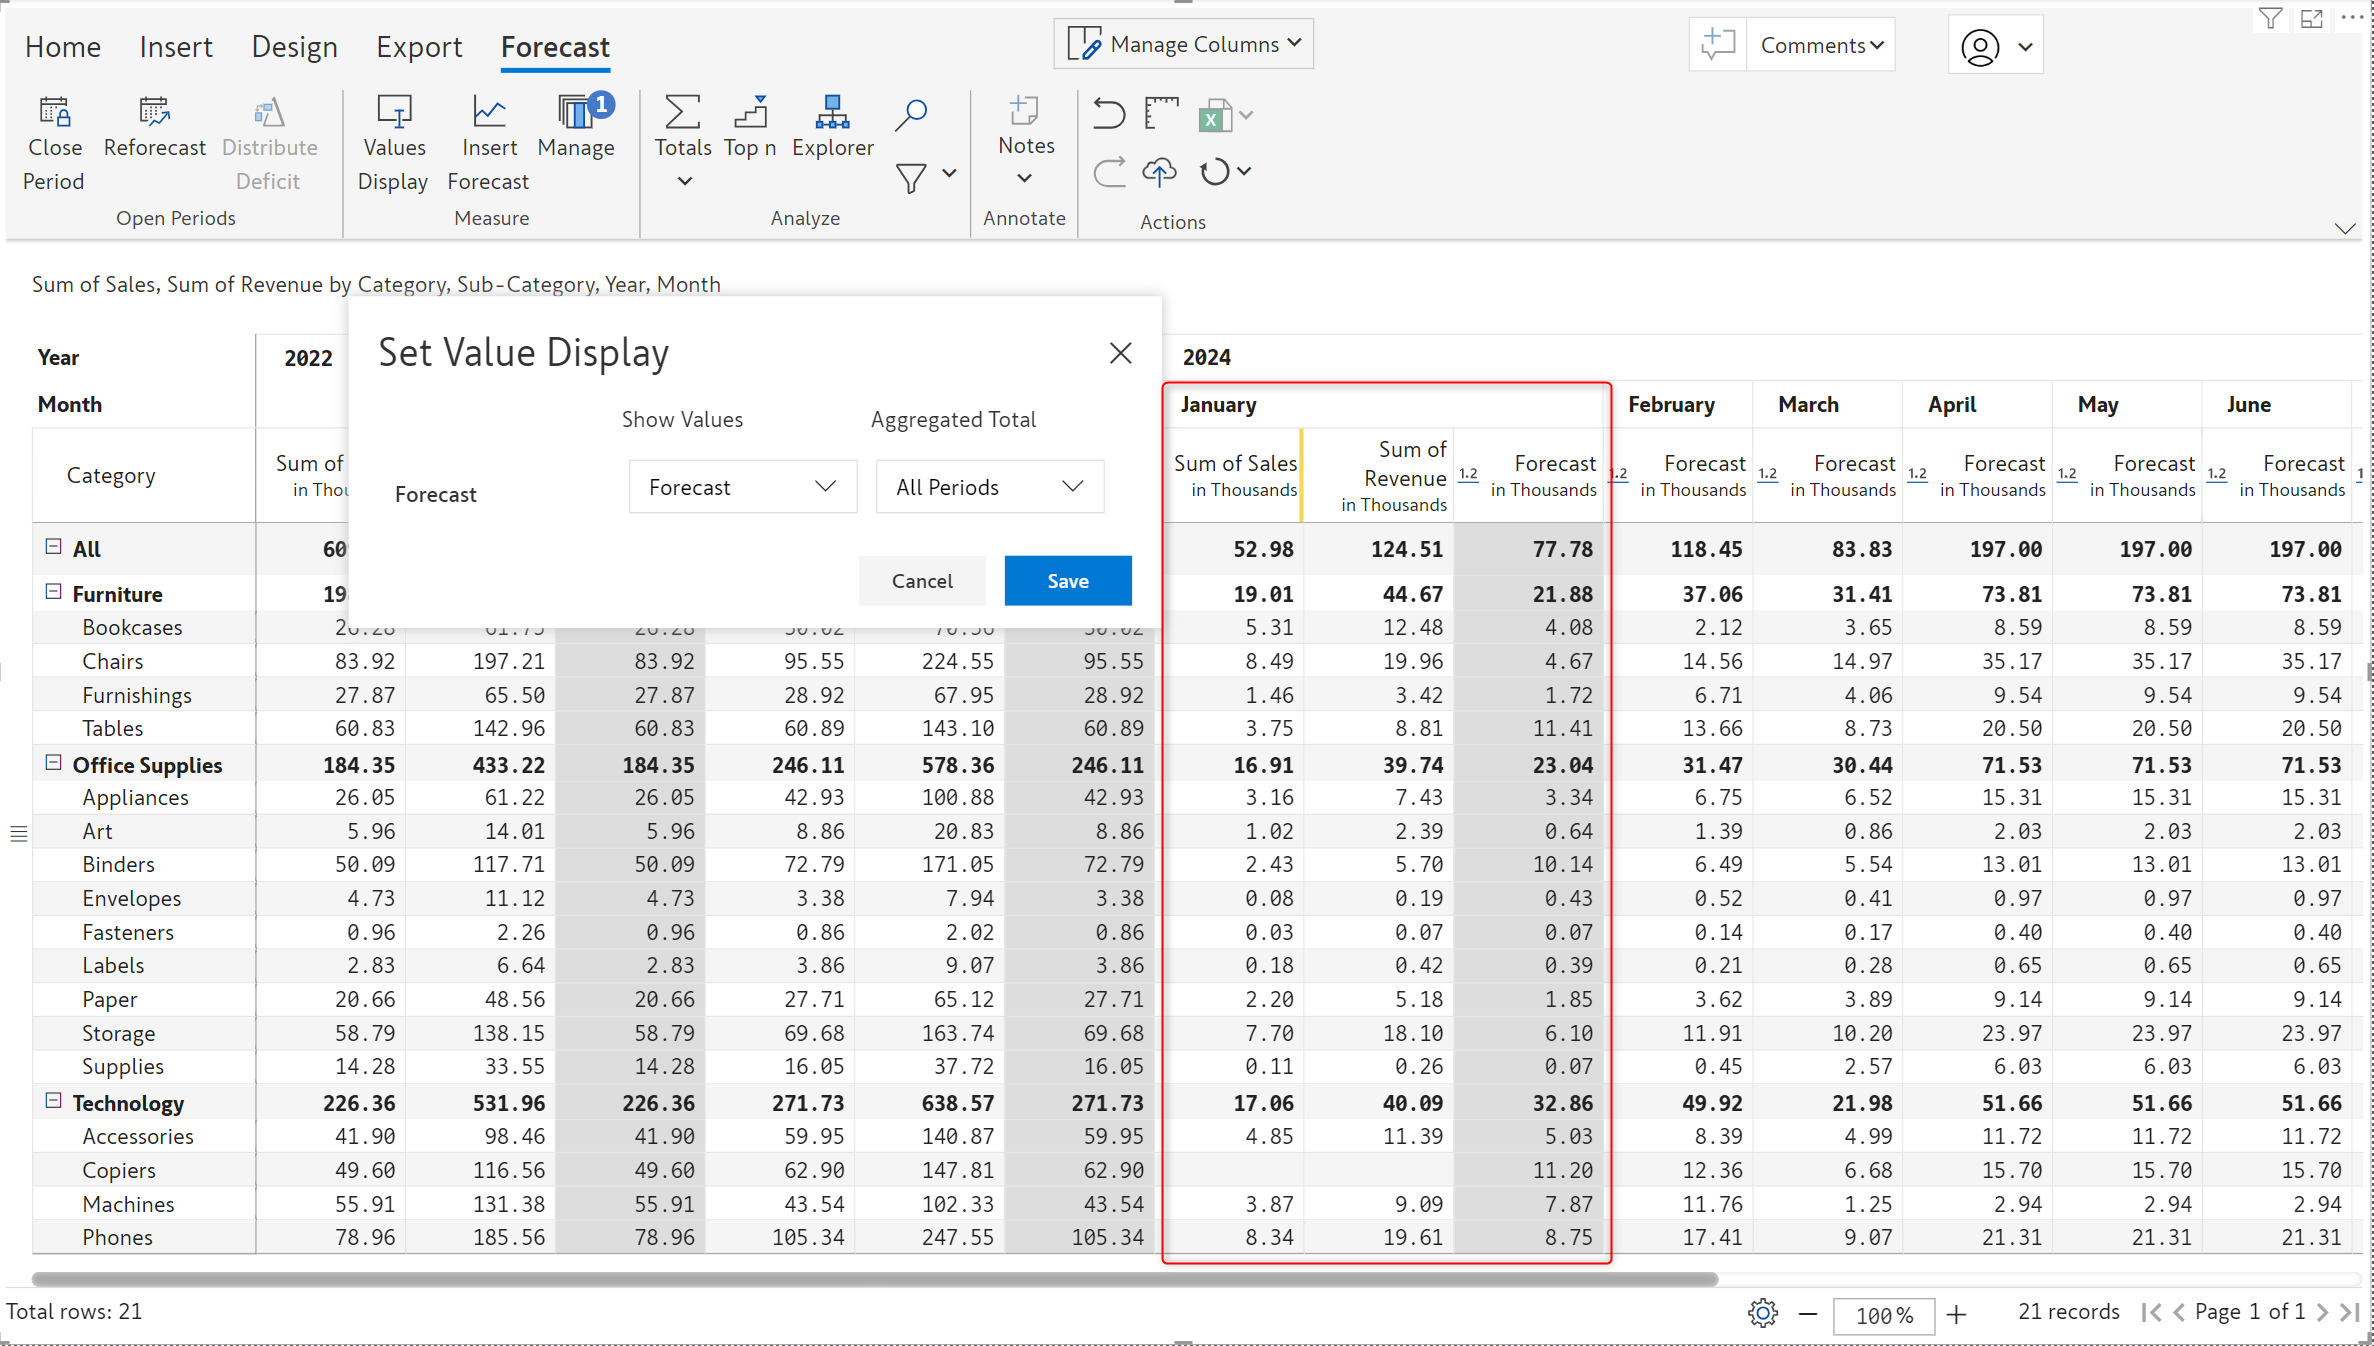
The latest release comes packaged with a Distribute deficit feature for forecasts. If the actuals fall short of the forecast, you can distribute the difference between open forecast periods. For example, consider that we have forecasted a revenue of 12m for Q1 – 4m for each month. If the actual revenue for January is 3m, we can distribute the deficit of 1m between the February and March (or any custom time period) forecasts.
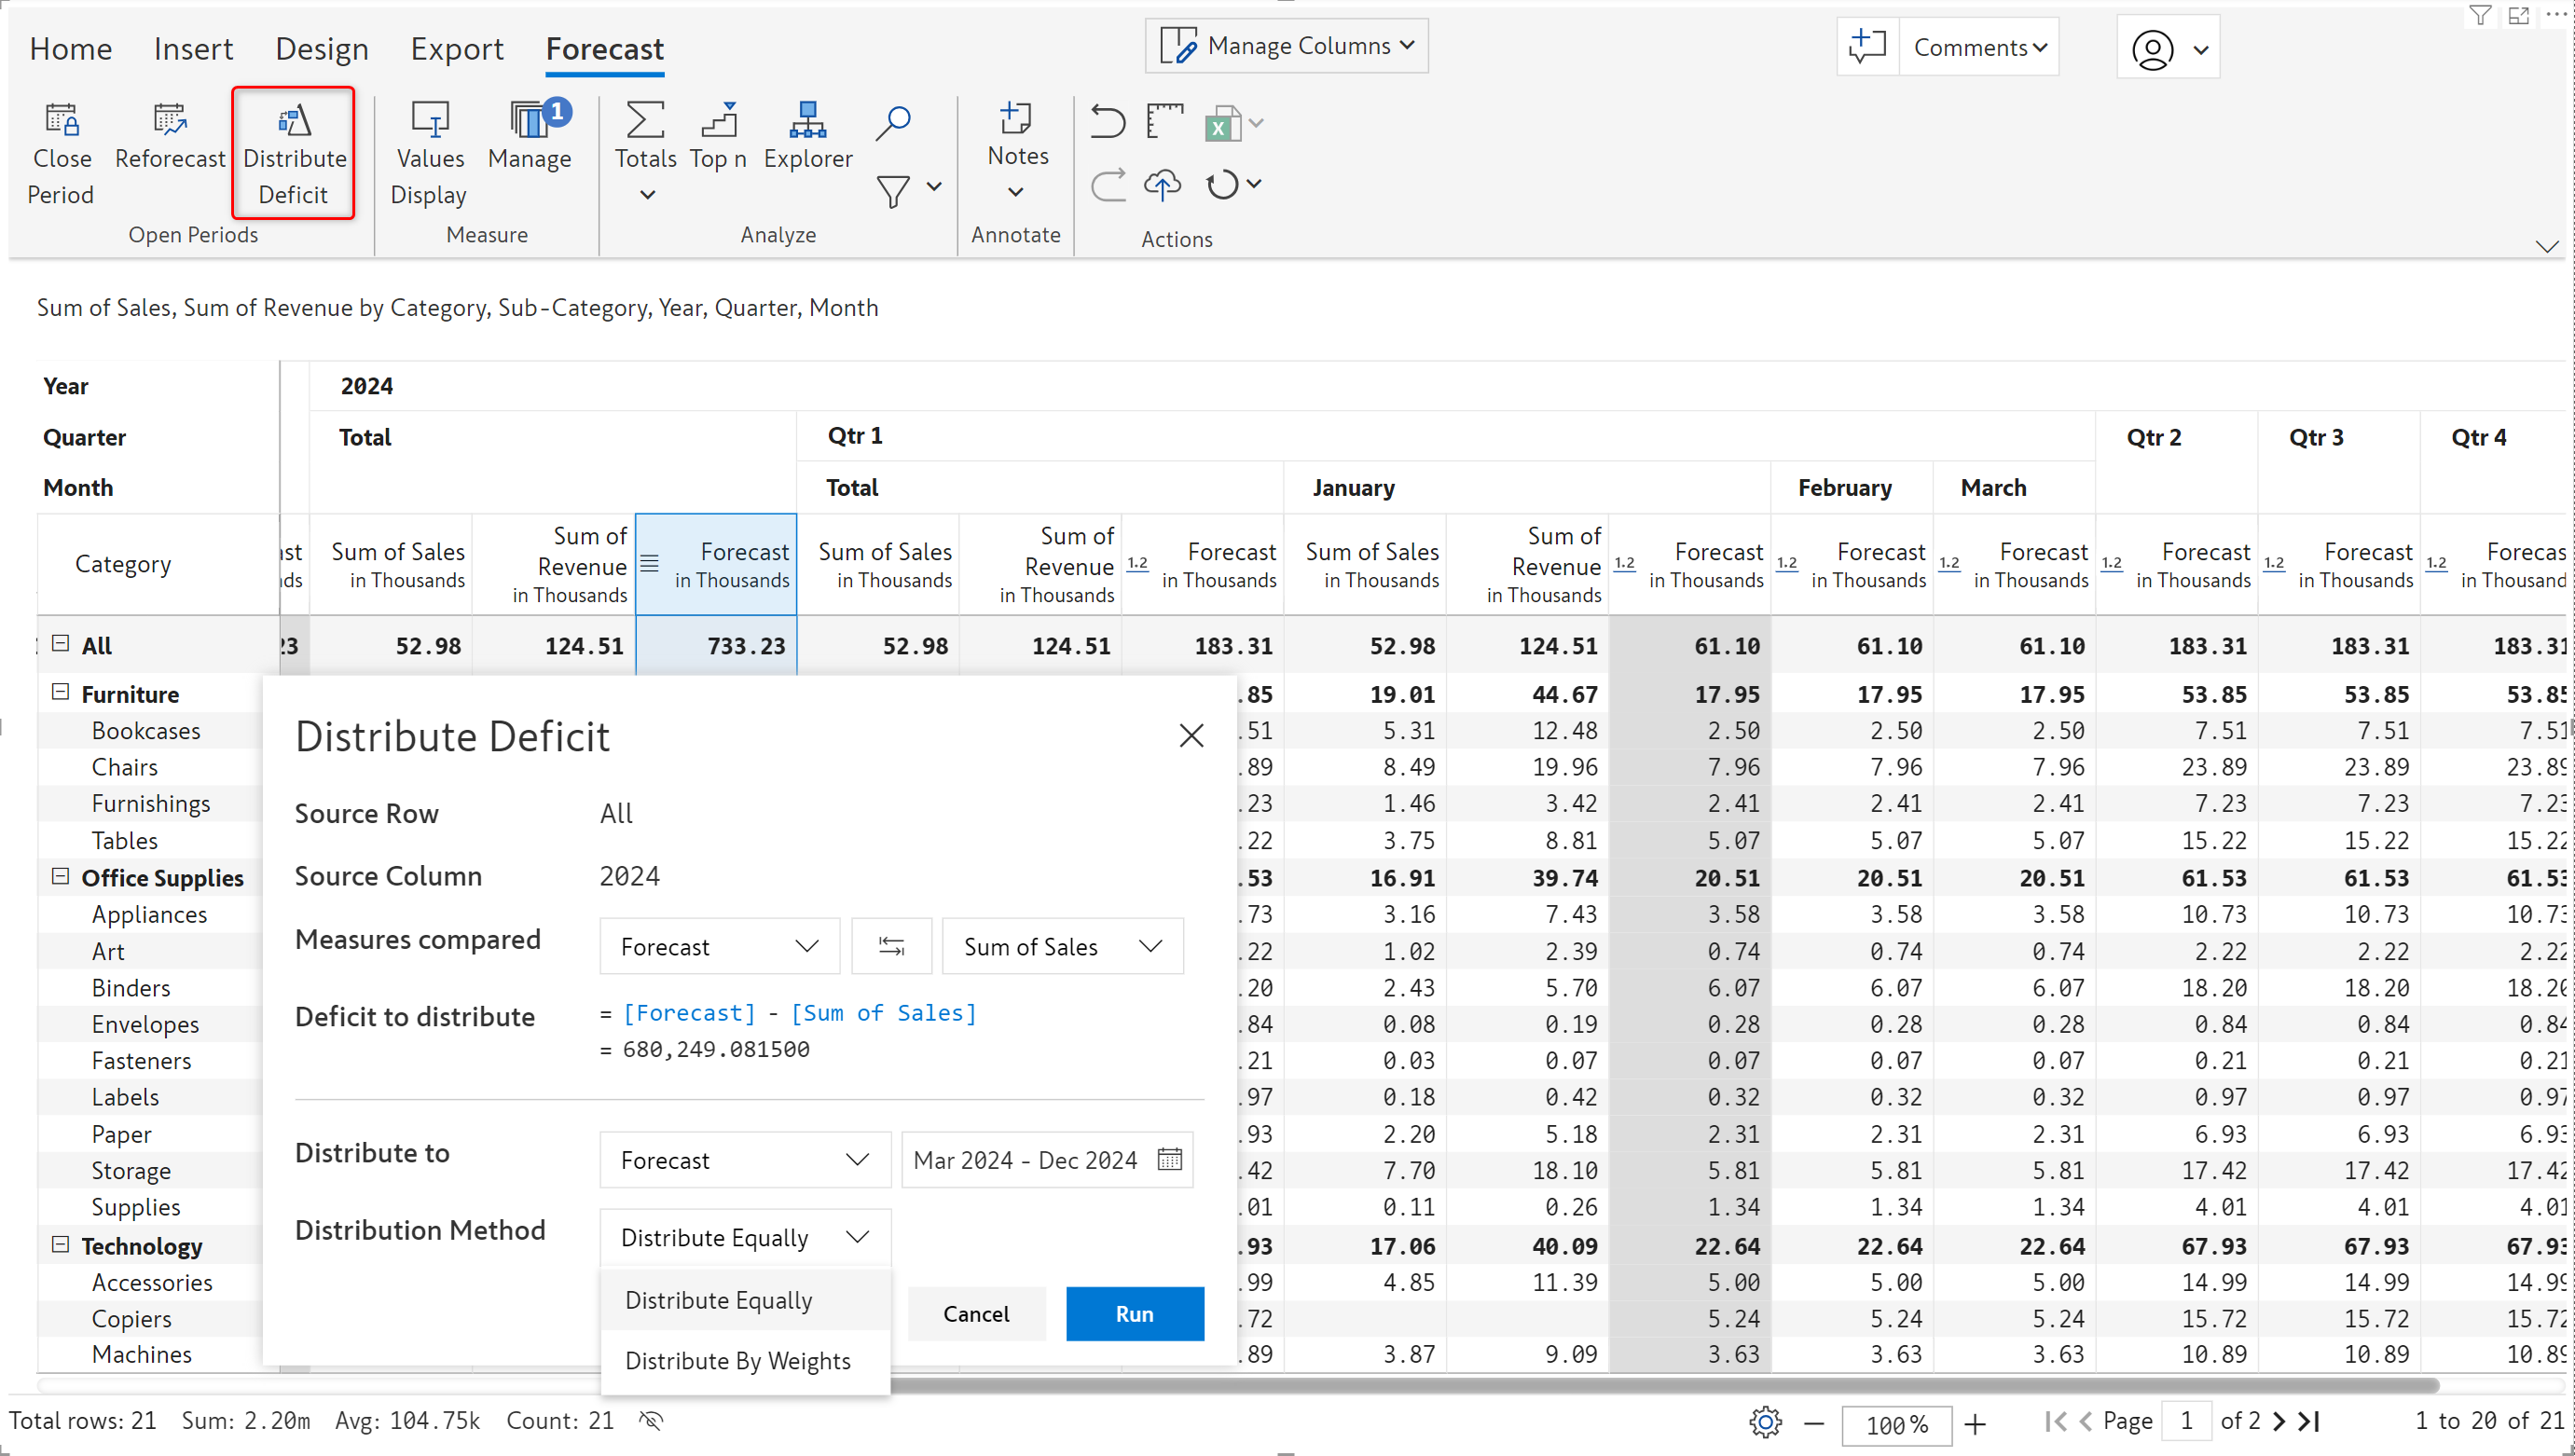
In the image below, after closing the forecast for January, notice how the forecasts for the rest of the year have been updated to reflect the deficit amount.
You can update the forecast for a specific period using the reforecast option. For instance, if you need to change the forecast for Q2 to the average sales of previous years, you can reforecast for that period alone, without affecting the other forecasts.
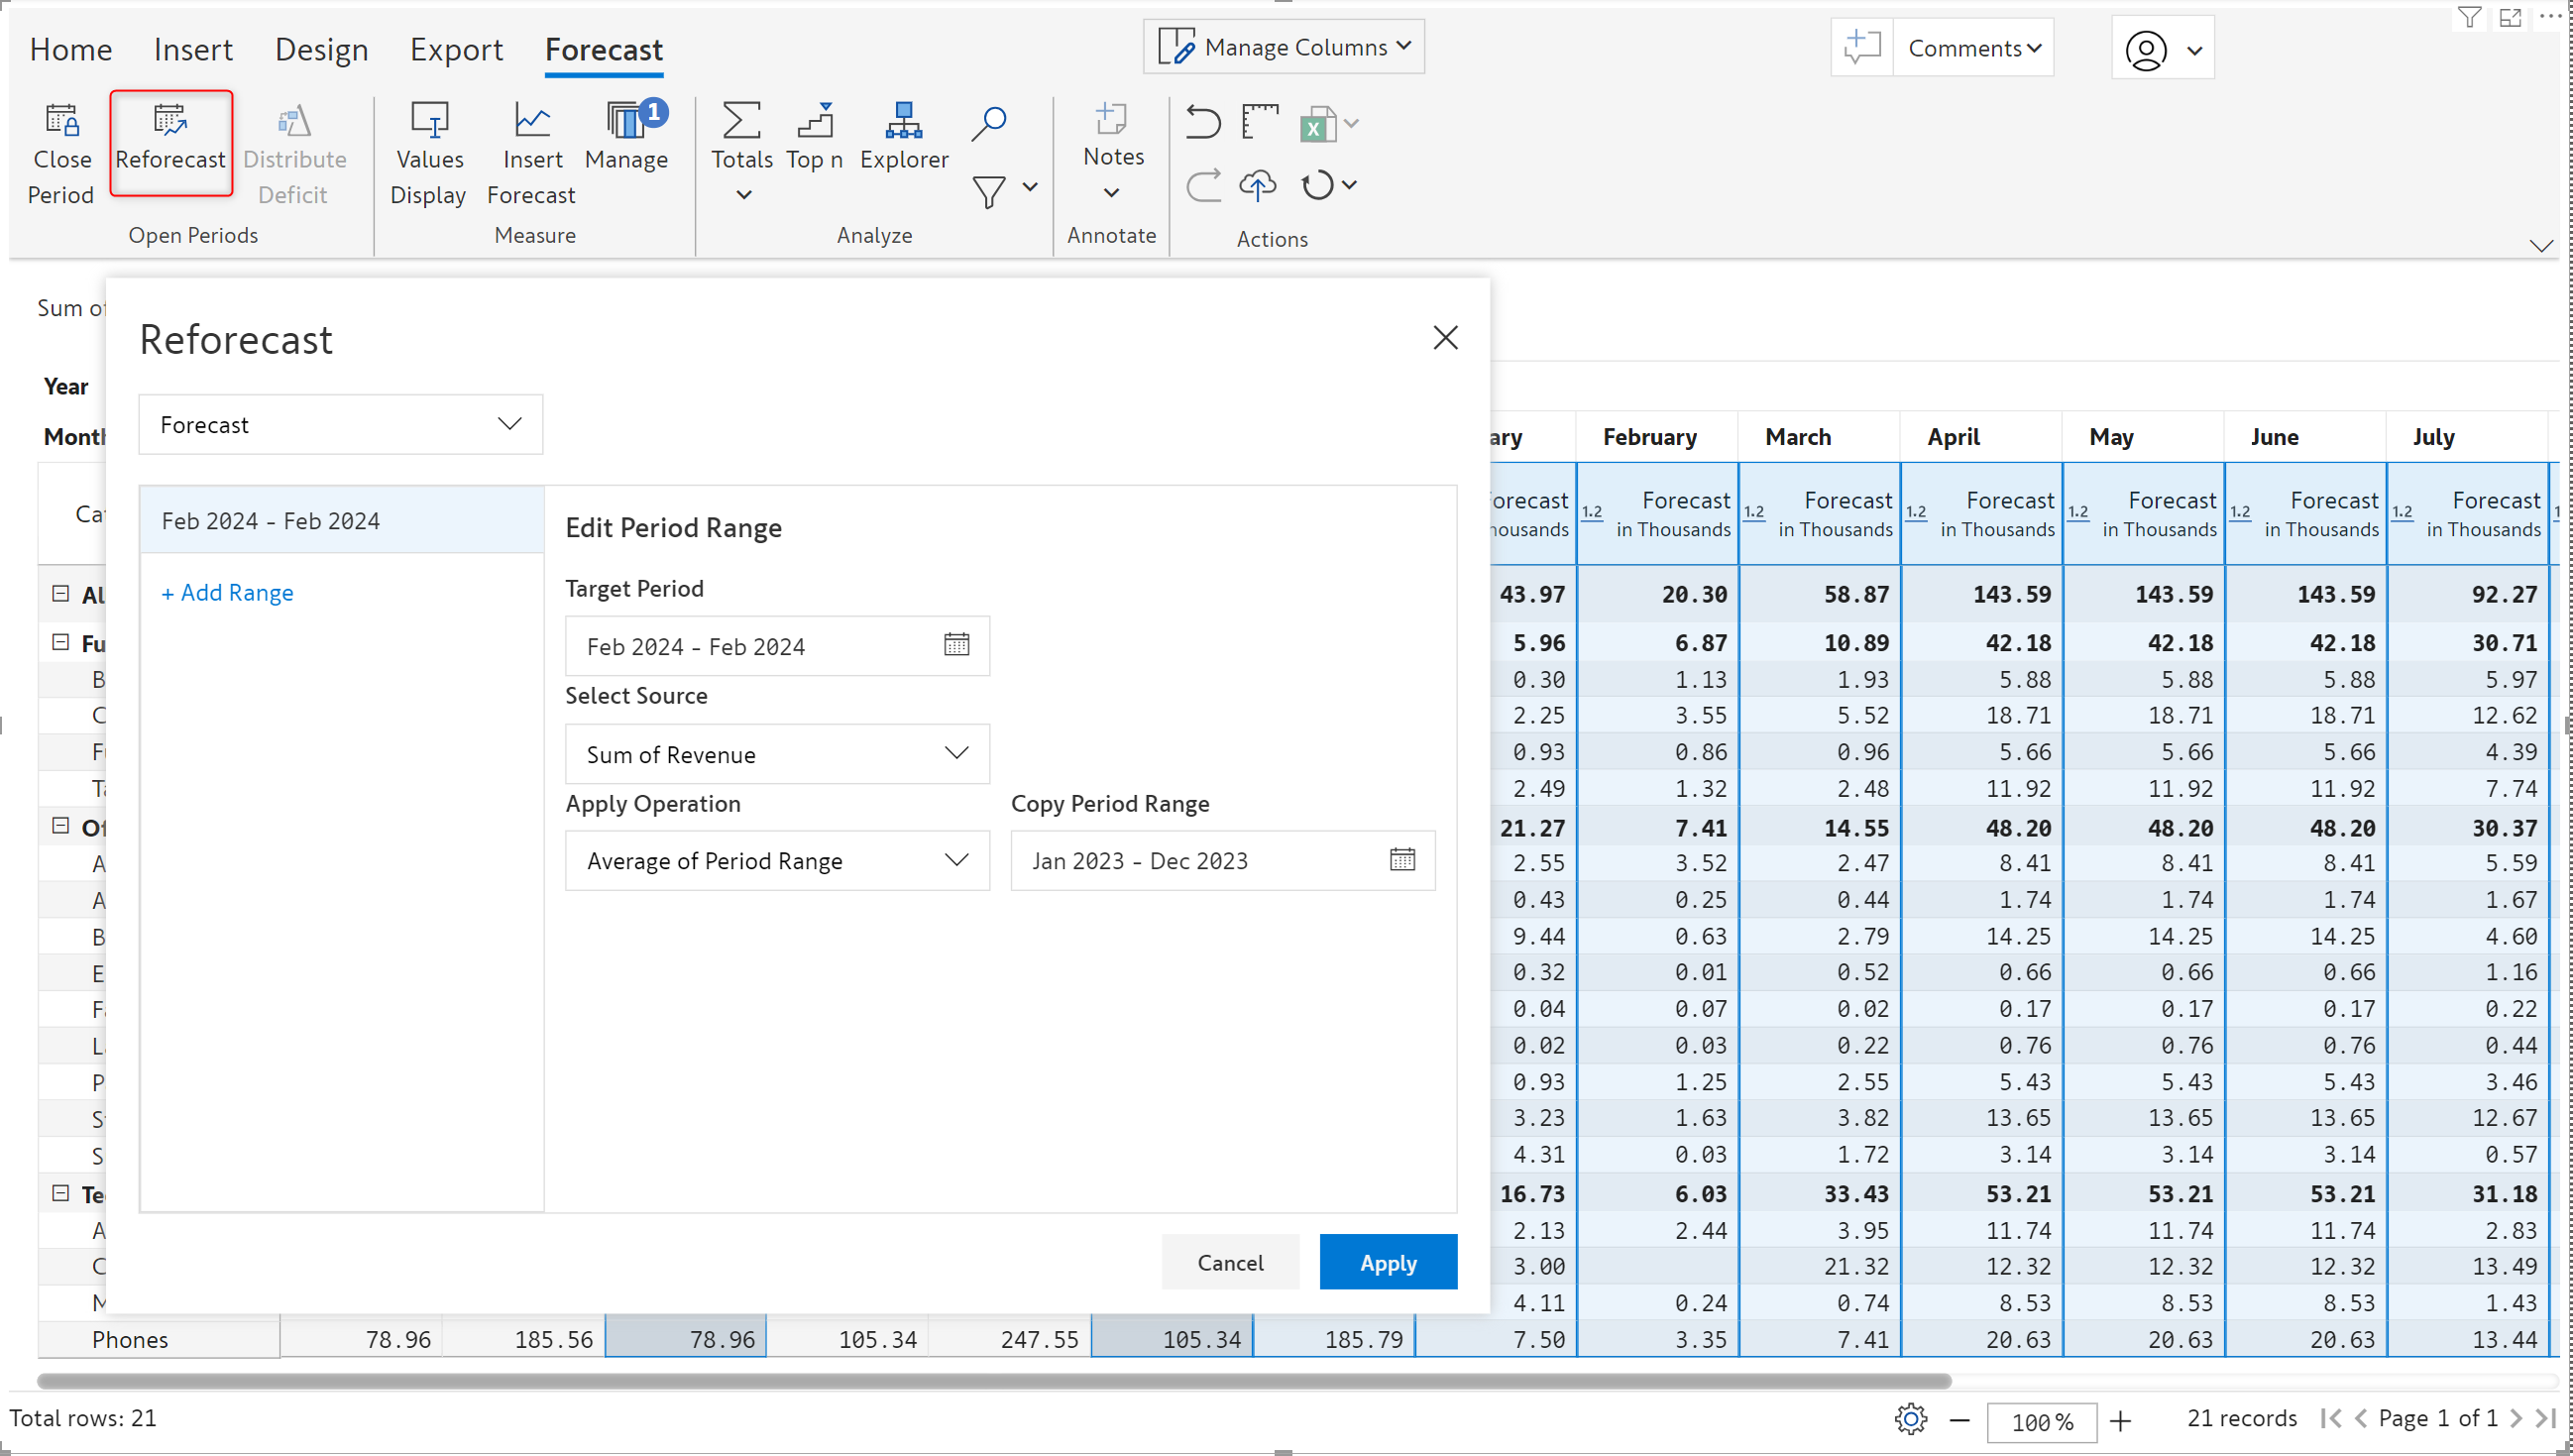
Forecasts can be modified by clicking on the Manage button from the forecast toolbar and selecting the forecast to be changed. You can update the configured forecast period, change the measure used to populate forecasts for closed periods, and update auto-close settings, to name a few.
In the latest release, you have the flexibility to retain the forecasted values or use the actuals after closing a forecast. In earlier versions, the actuals would automatically overwrite the forecasted values when the period was closed. You can now compare the forecast against the actuals and evaluate the forecast.
When the Actuals option is chosen for Show Values, the forecasted values are overwritten by actuals when a period is closed.
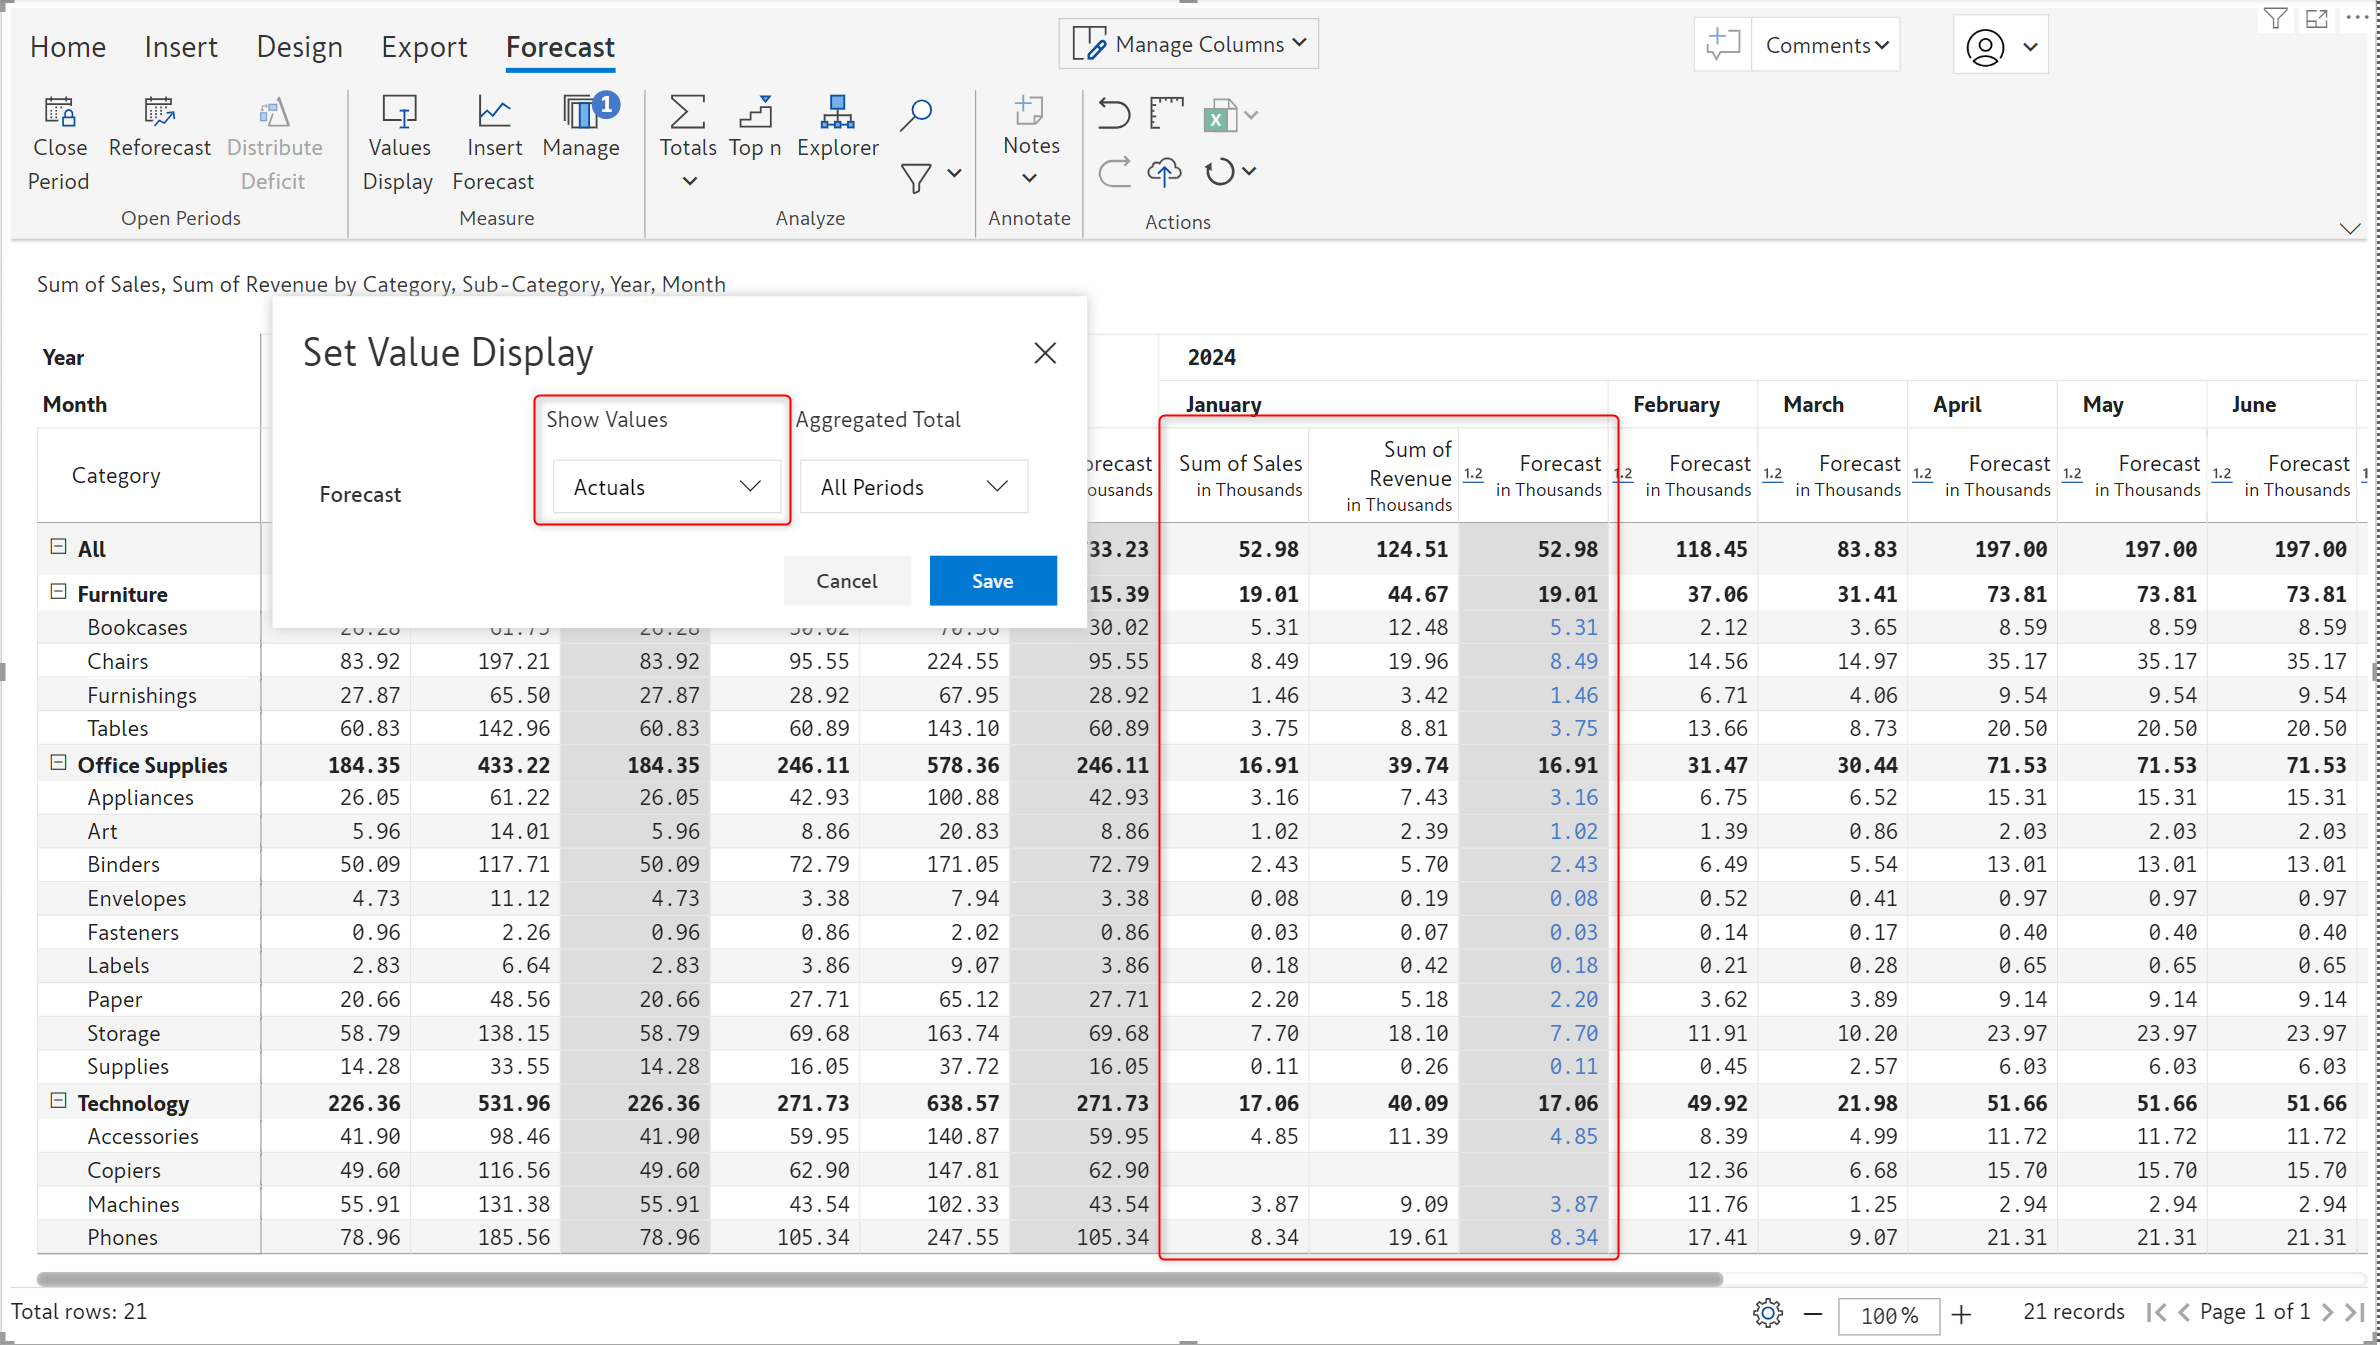
By default, the Forecast option is chosen, and forecasted values are retained when the actuals become available.
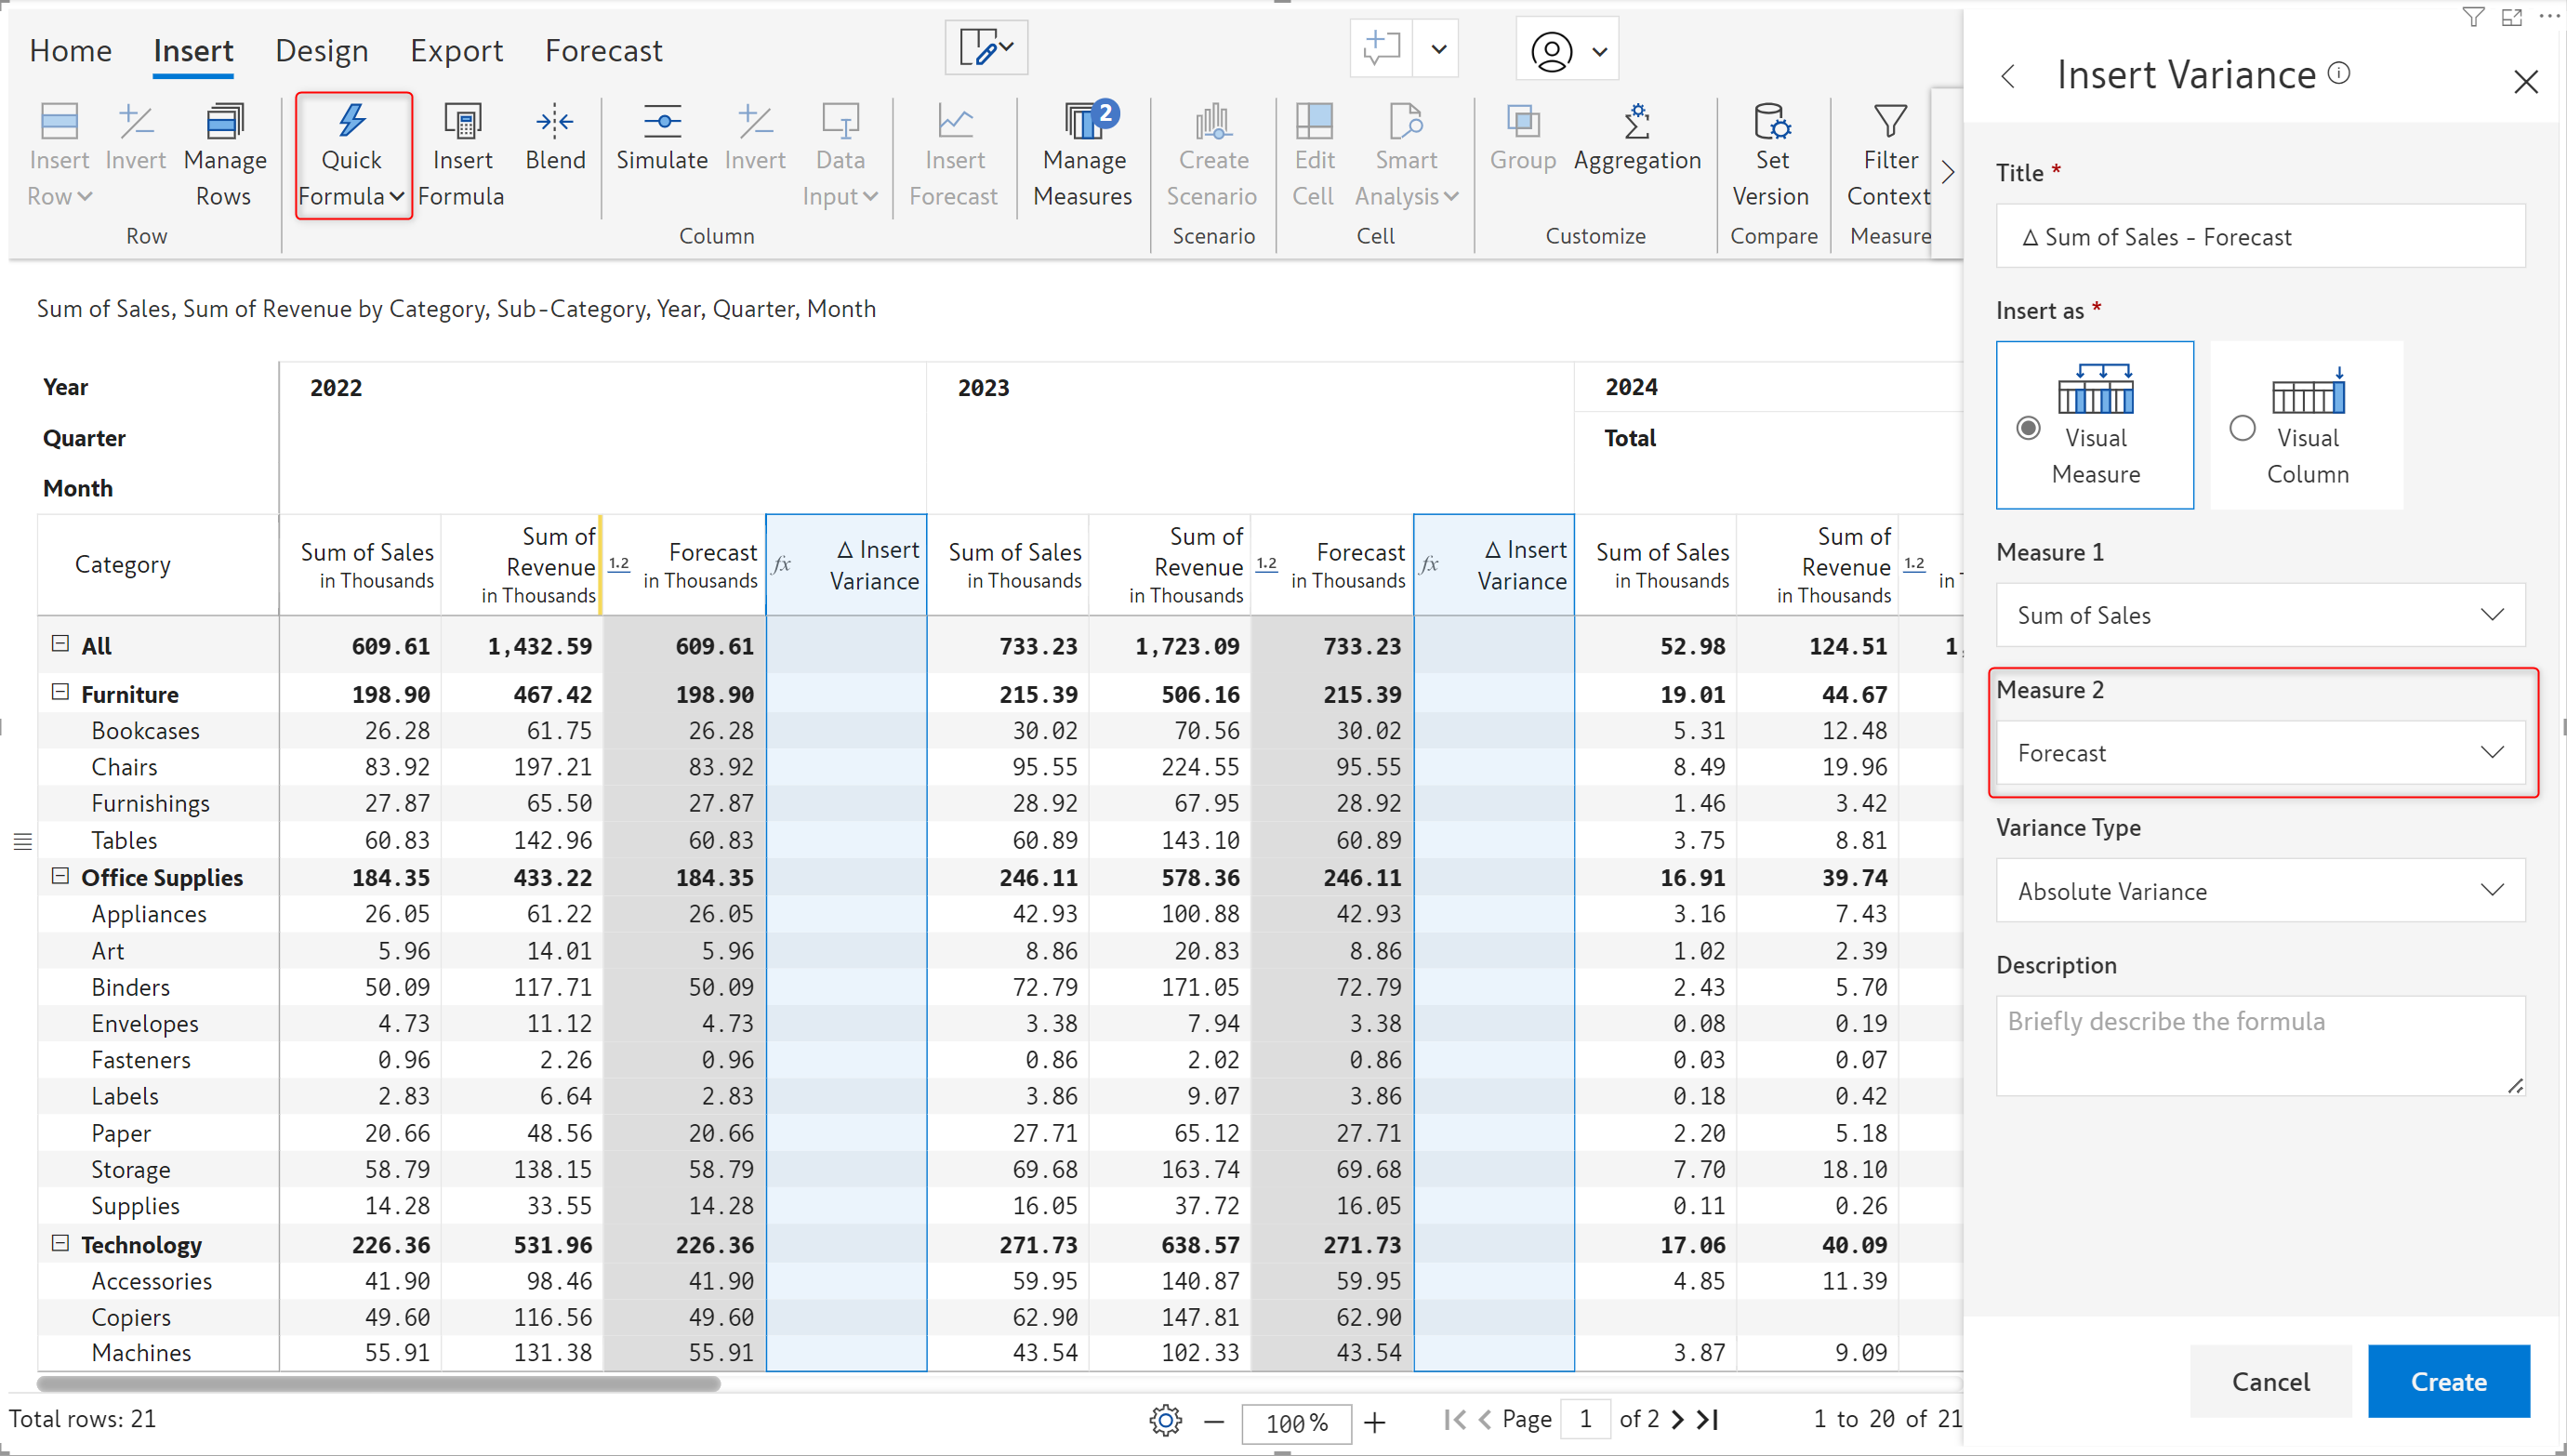
Once you have created a forecast, you can even use the quick formula (variance) to create variances based on forecasts – enabling you to identify shortfalls in the actuals quickly.
Learn more about forecasting in Inforiver.
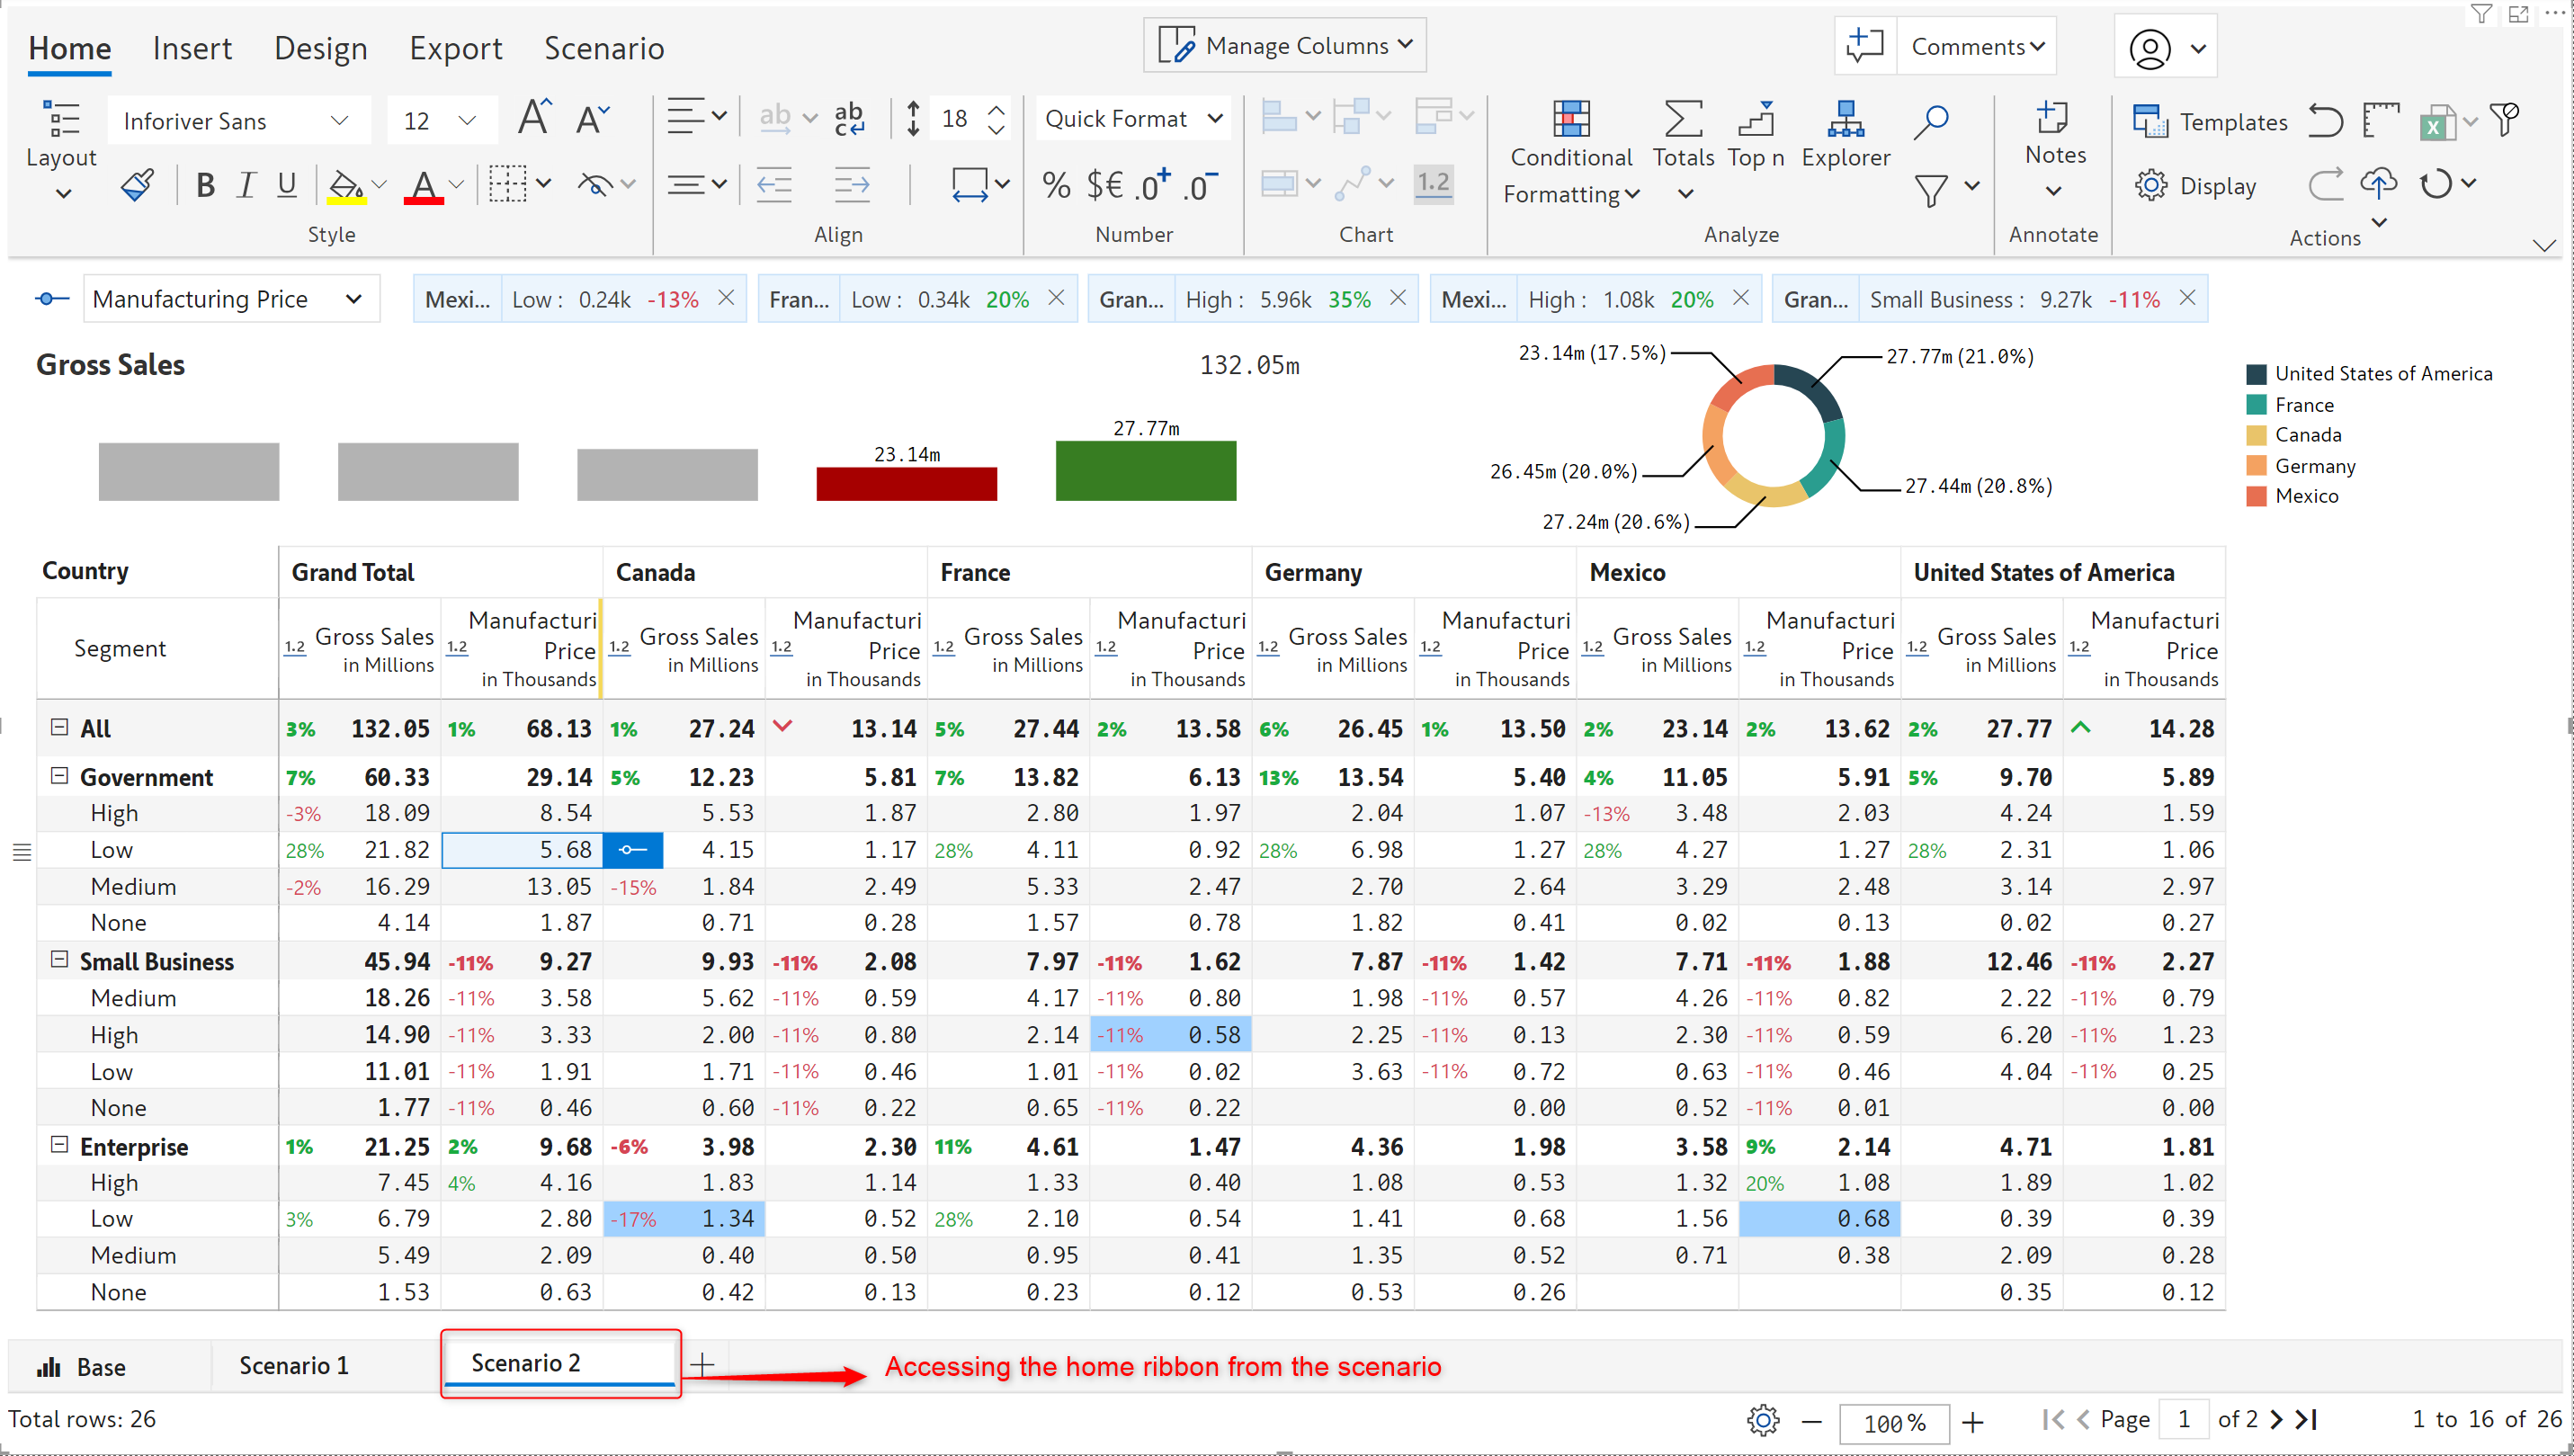
You can now access the other ribbons – Home, Insert, Design, and Export while working on a Scenario. Data input is restricted, but you can access all the other options like applying formatting or ranking - right from the scenario.
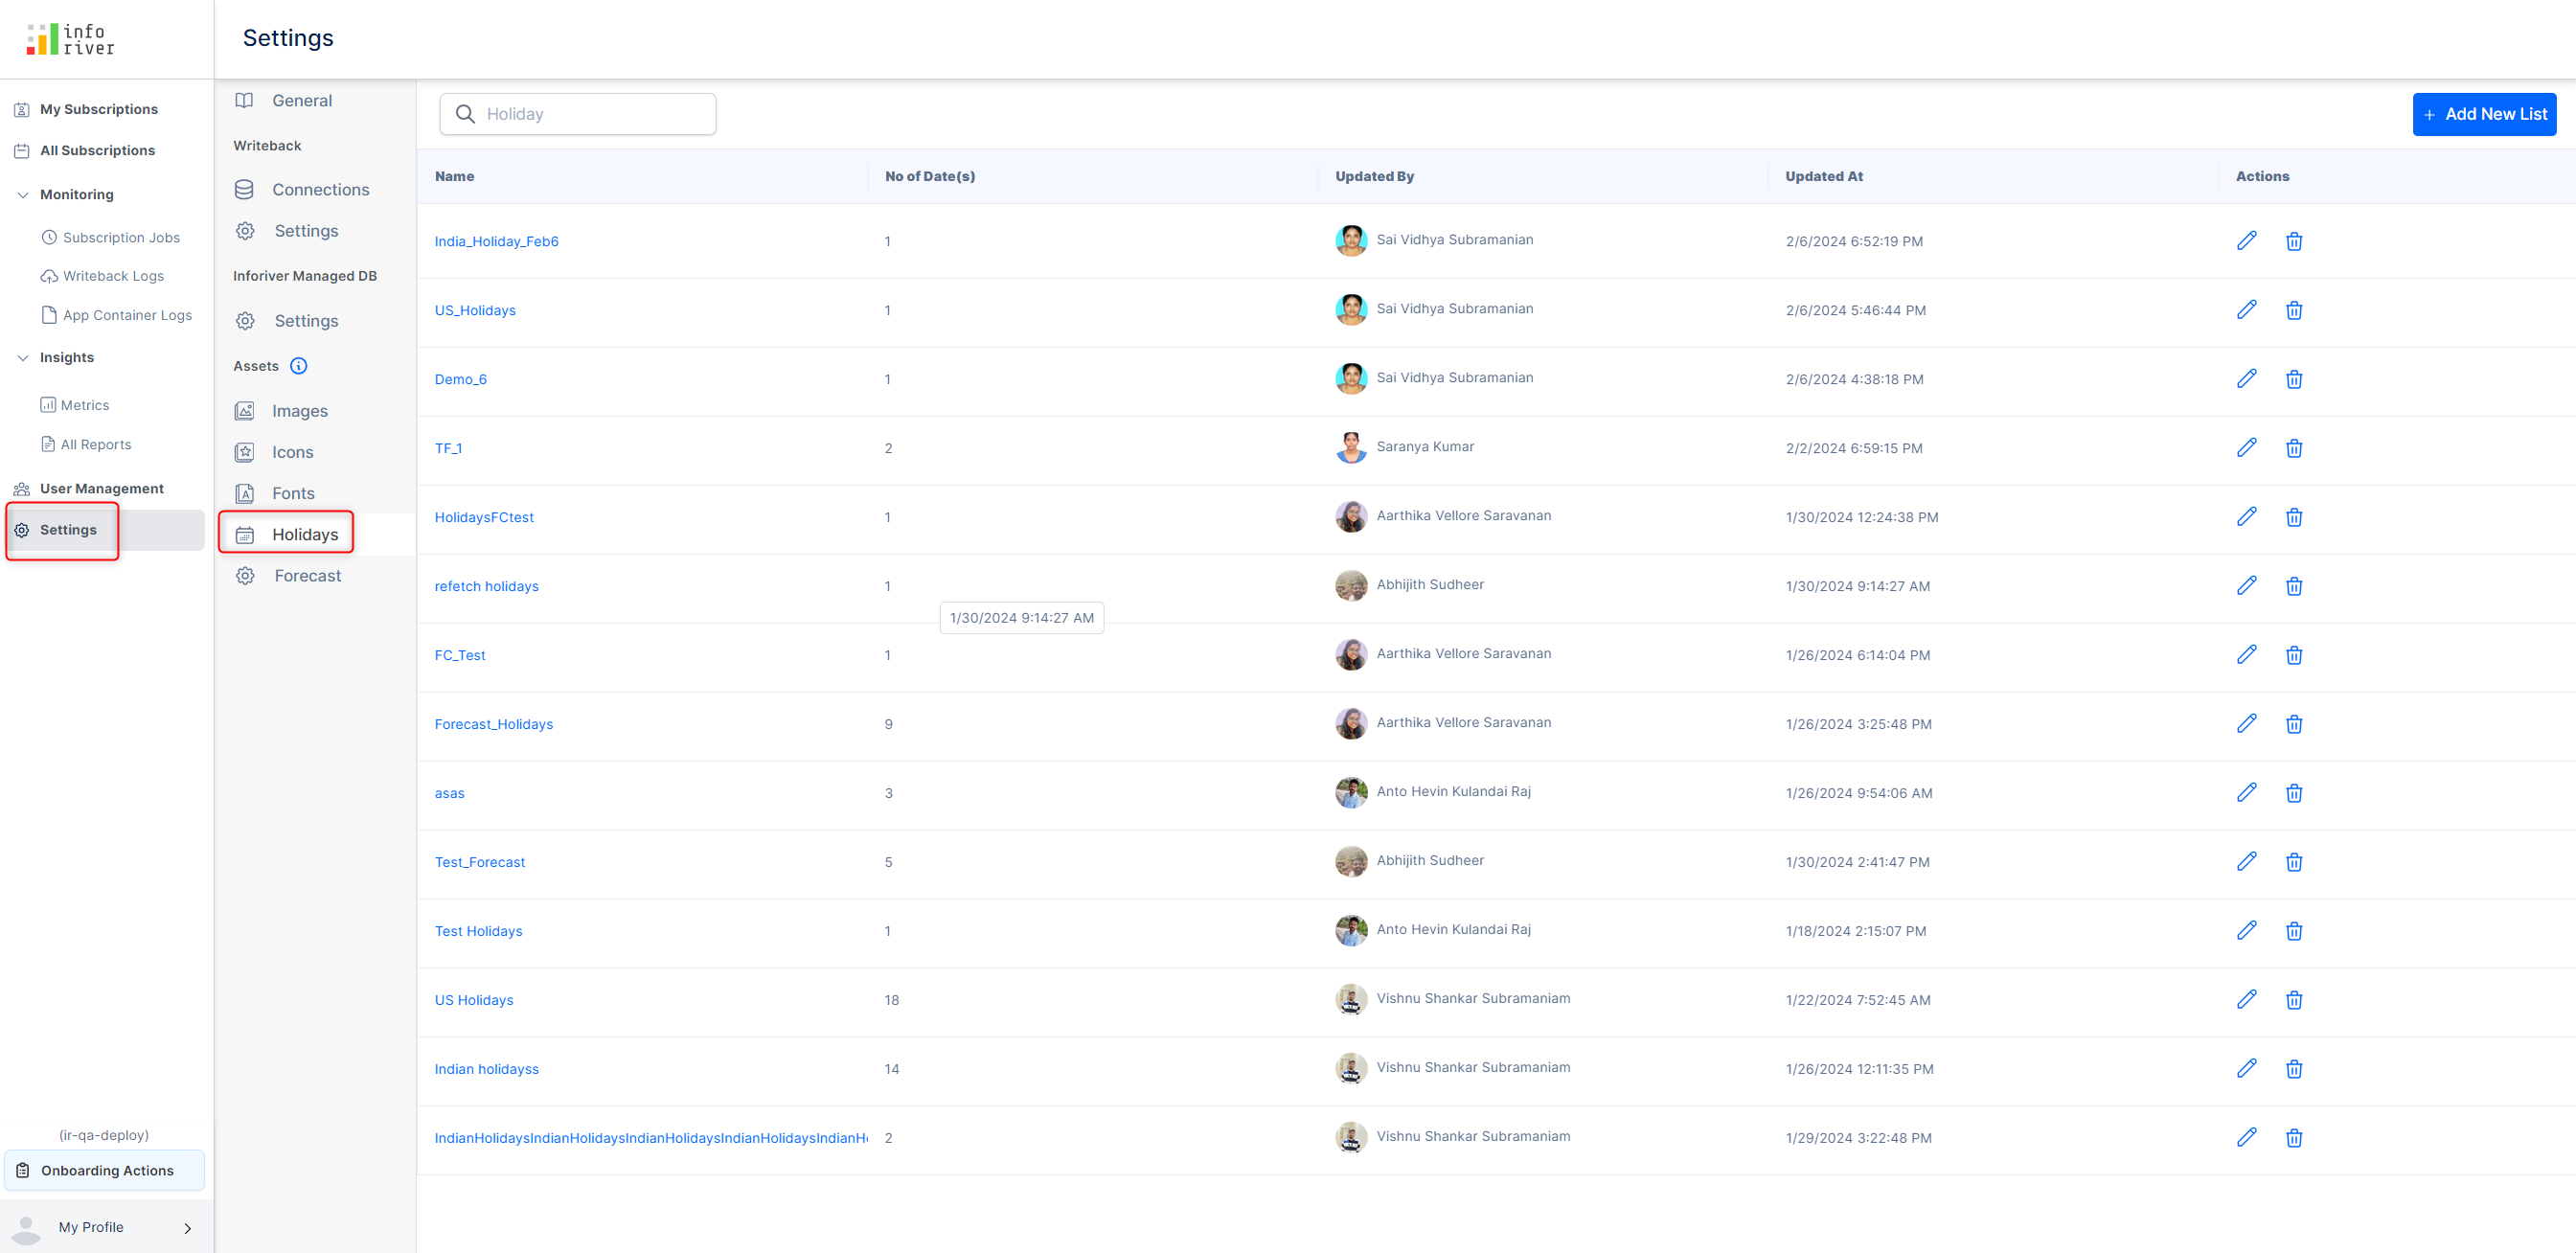
Inforiver admins have the ability to create a custom holiday calendar. The calendar can be used to ensure that subscription jobs are kept on hold during holidays and forecasts are not automatically closed on holidays. In the Inforiver console, navigate to Settings > Holidays to view the list of holiday calendars.
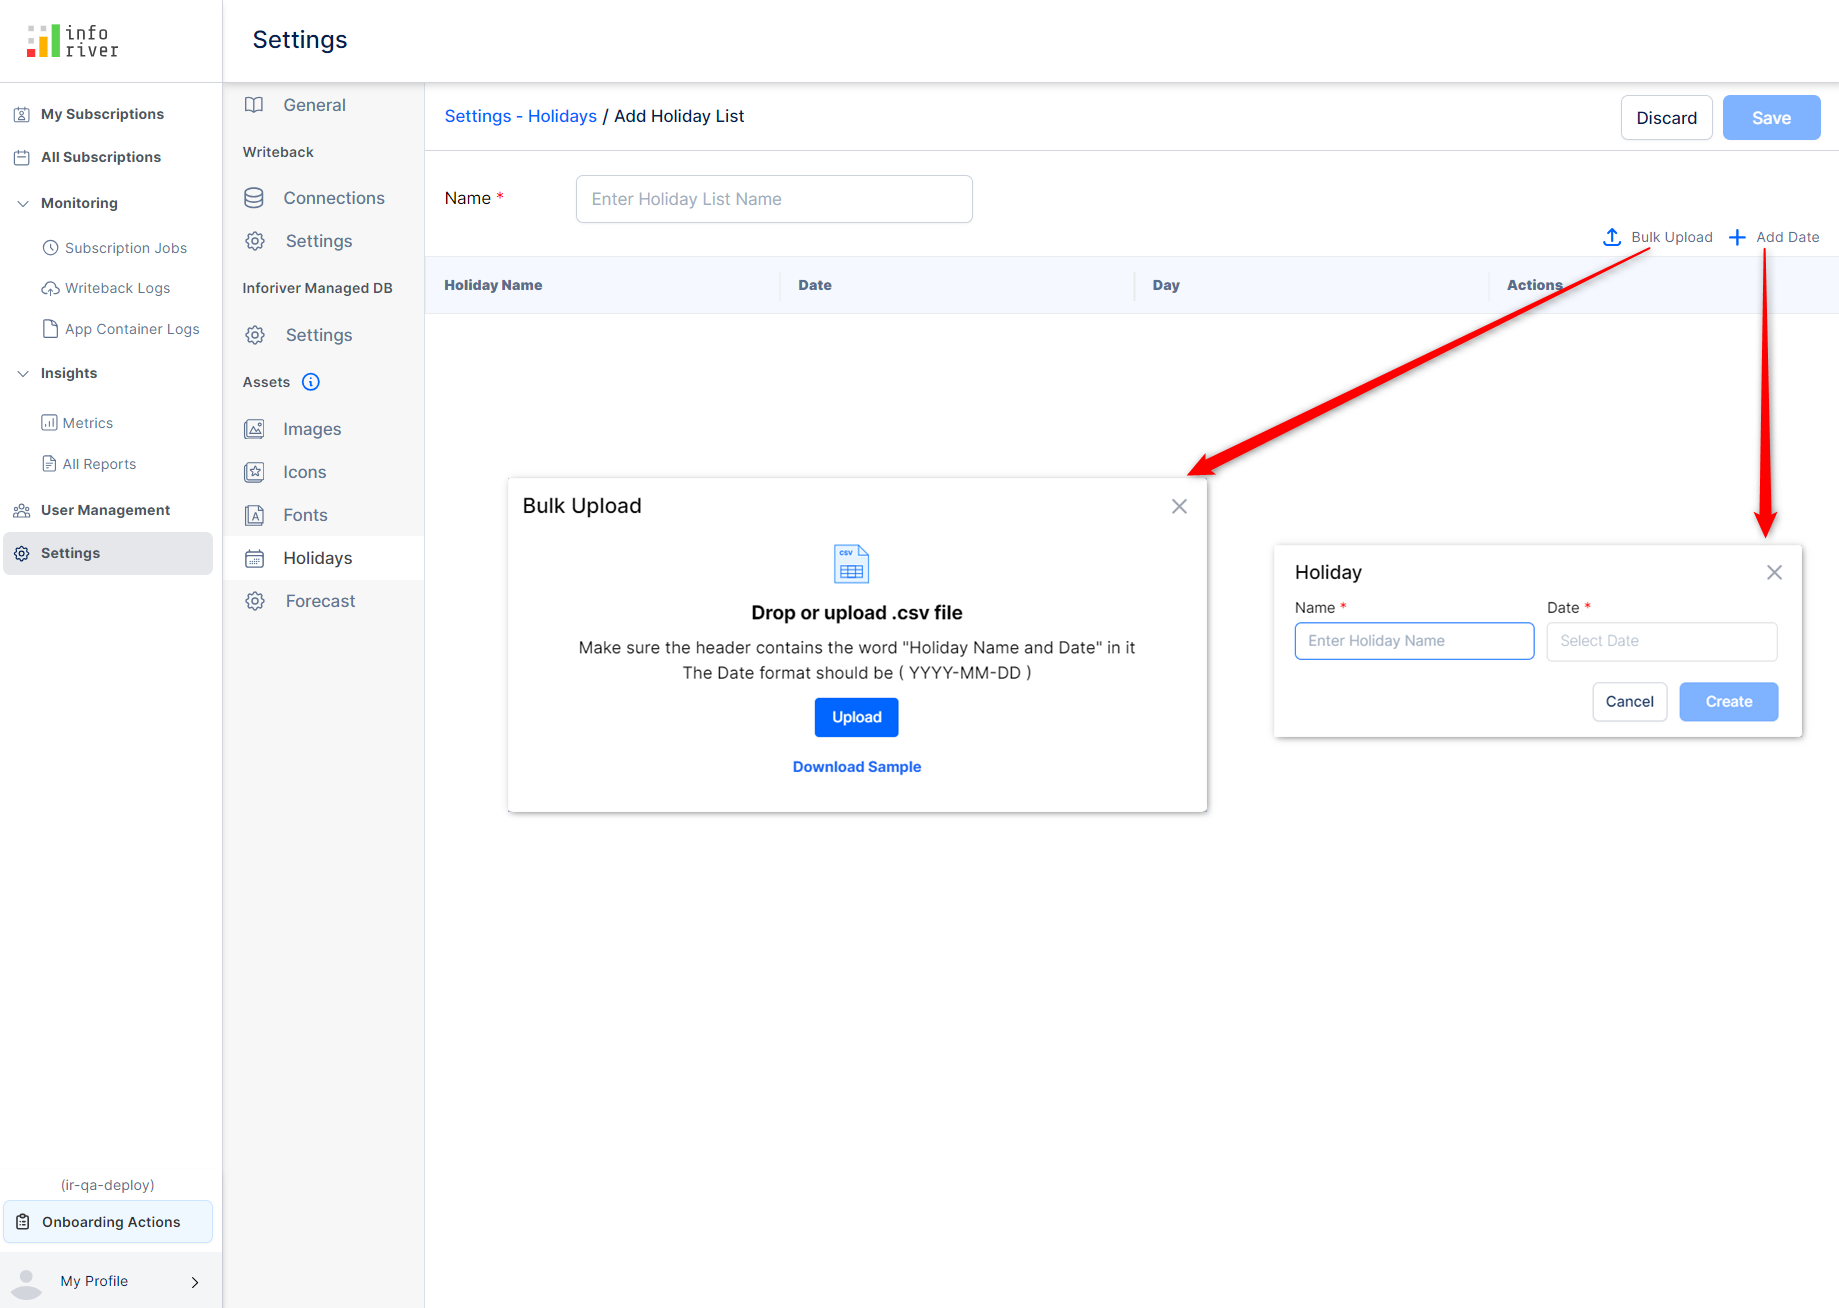
You can create a custom calendar by clicking on the Add New List button. You have the option of bulk uploading a set of holidays or adding each holiday separately.
When you set up a new subscription, you will have the option to skip holidays i.e. the subscription job will not run on holidays. You can select the holiday calendar(s) to use from the list.
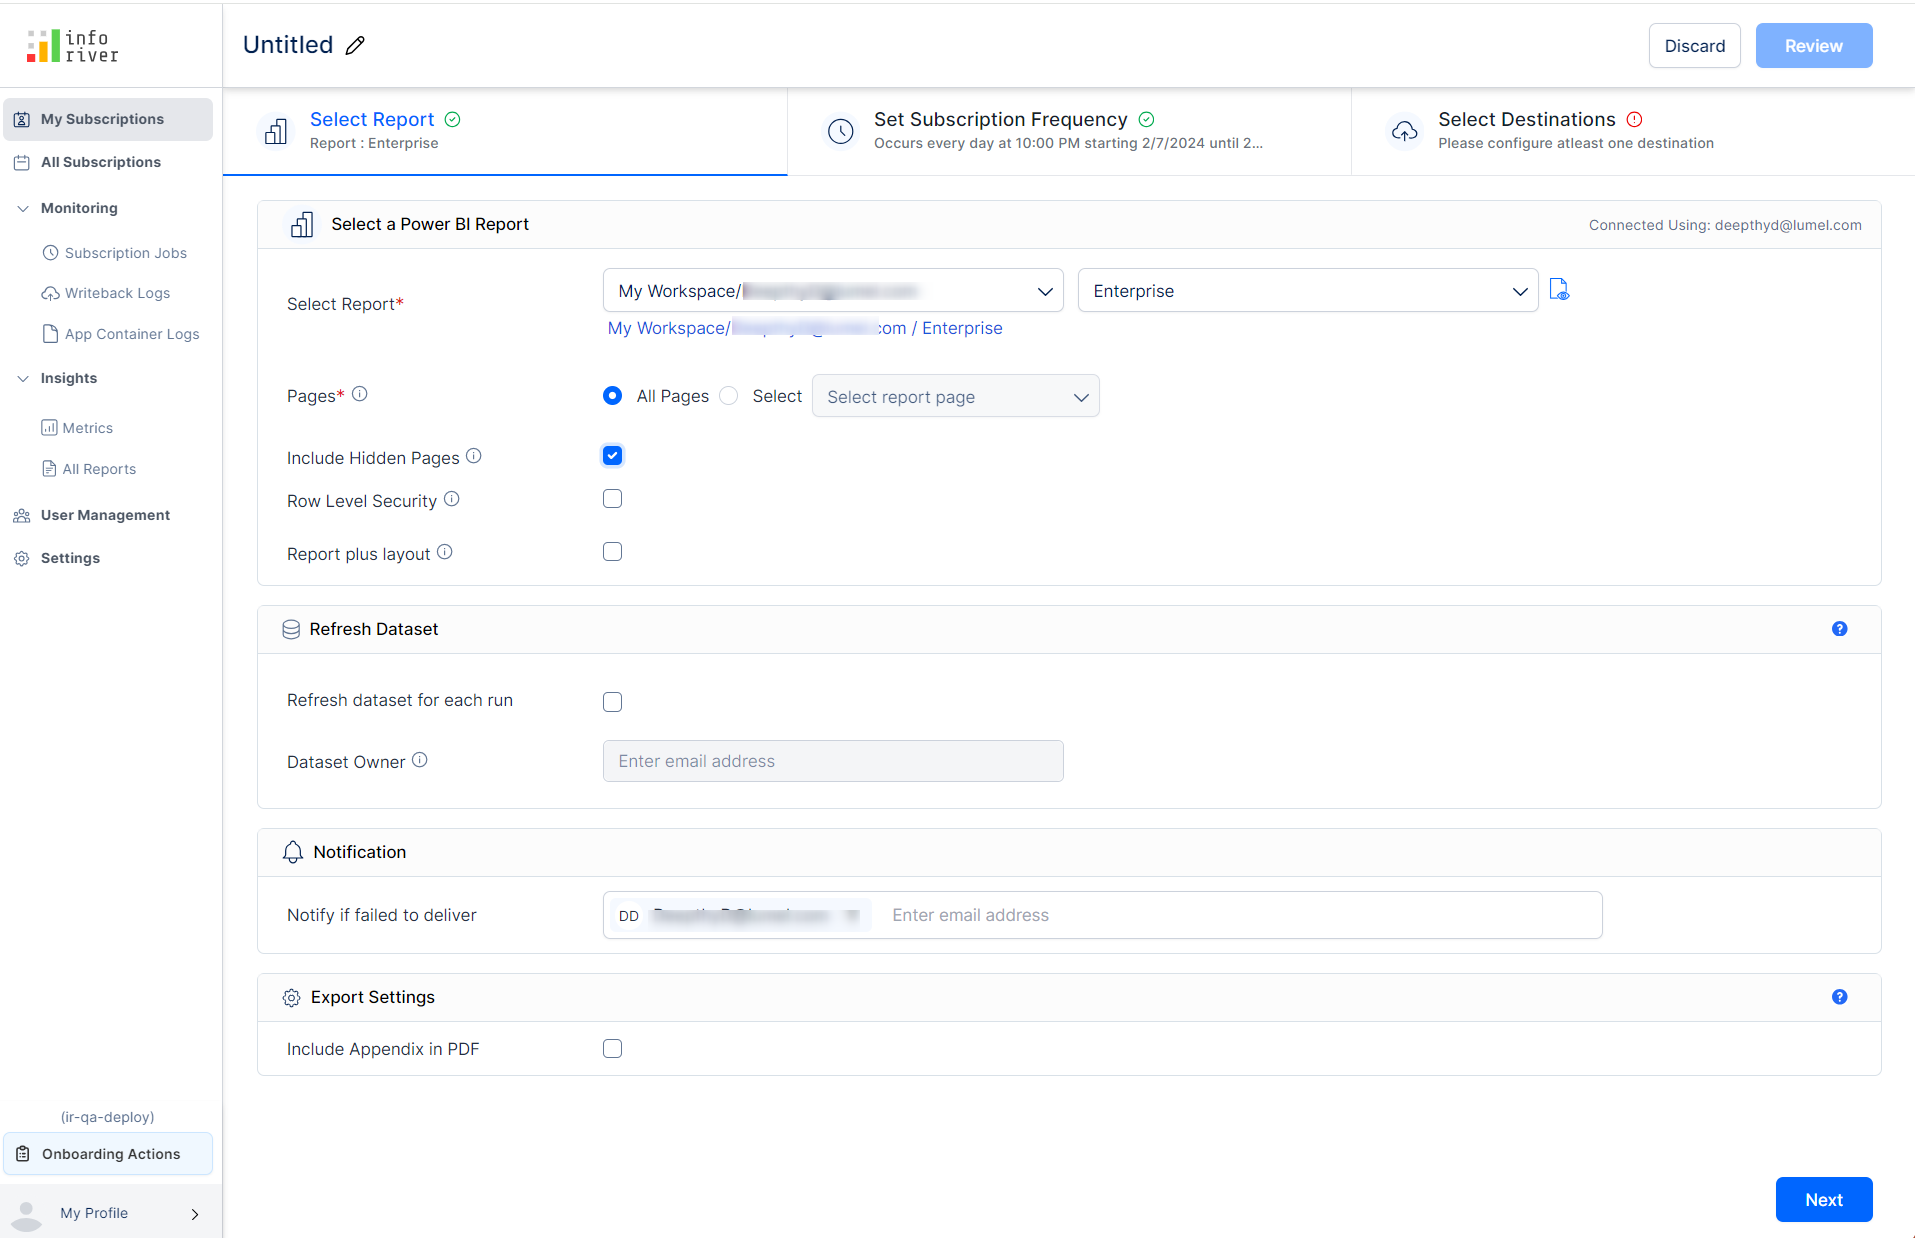
With the latest release, you can publish reports which contain hidden pages as well. While setting up the subscription, you will have an option to include hidden pages. In earlier versions, the subscription job would fail if the report had hidden or deleted pages.
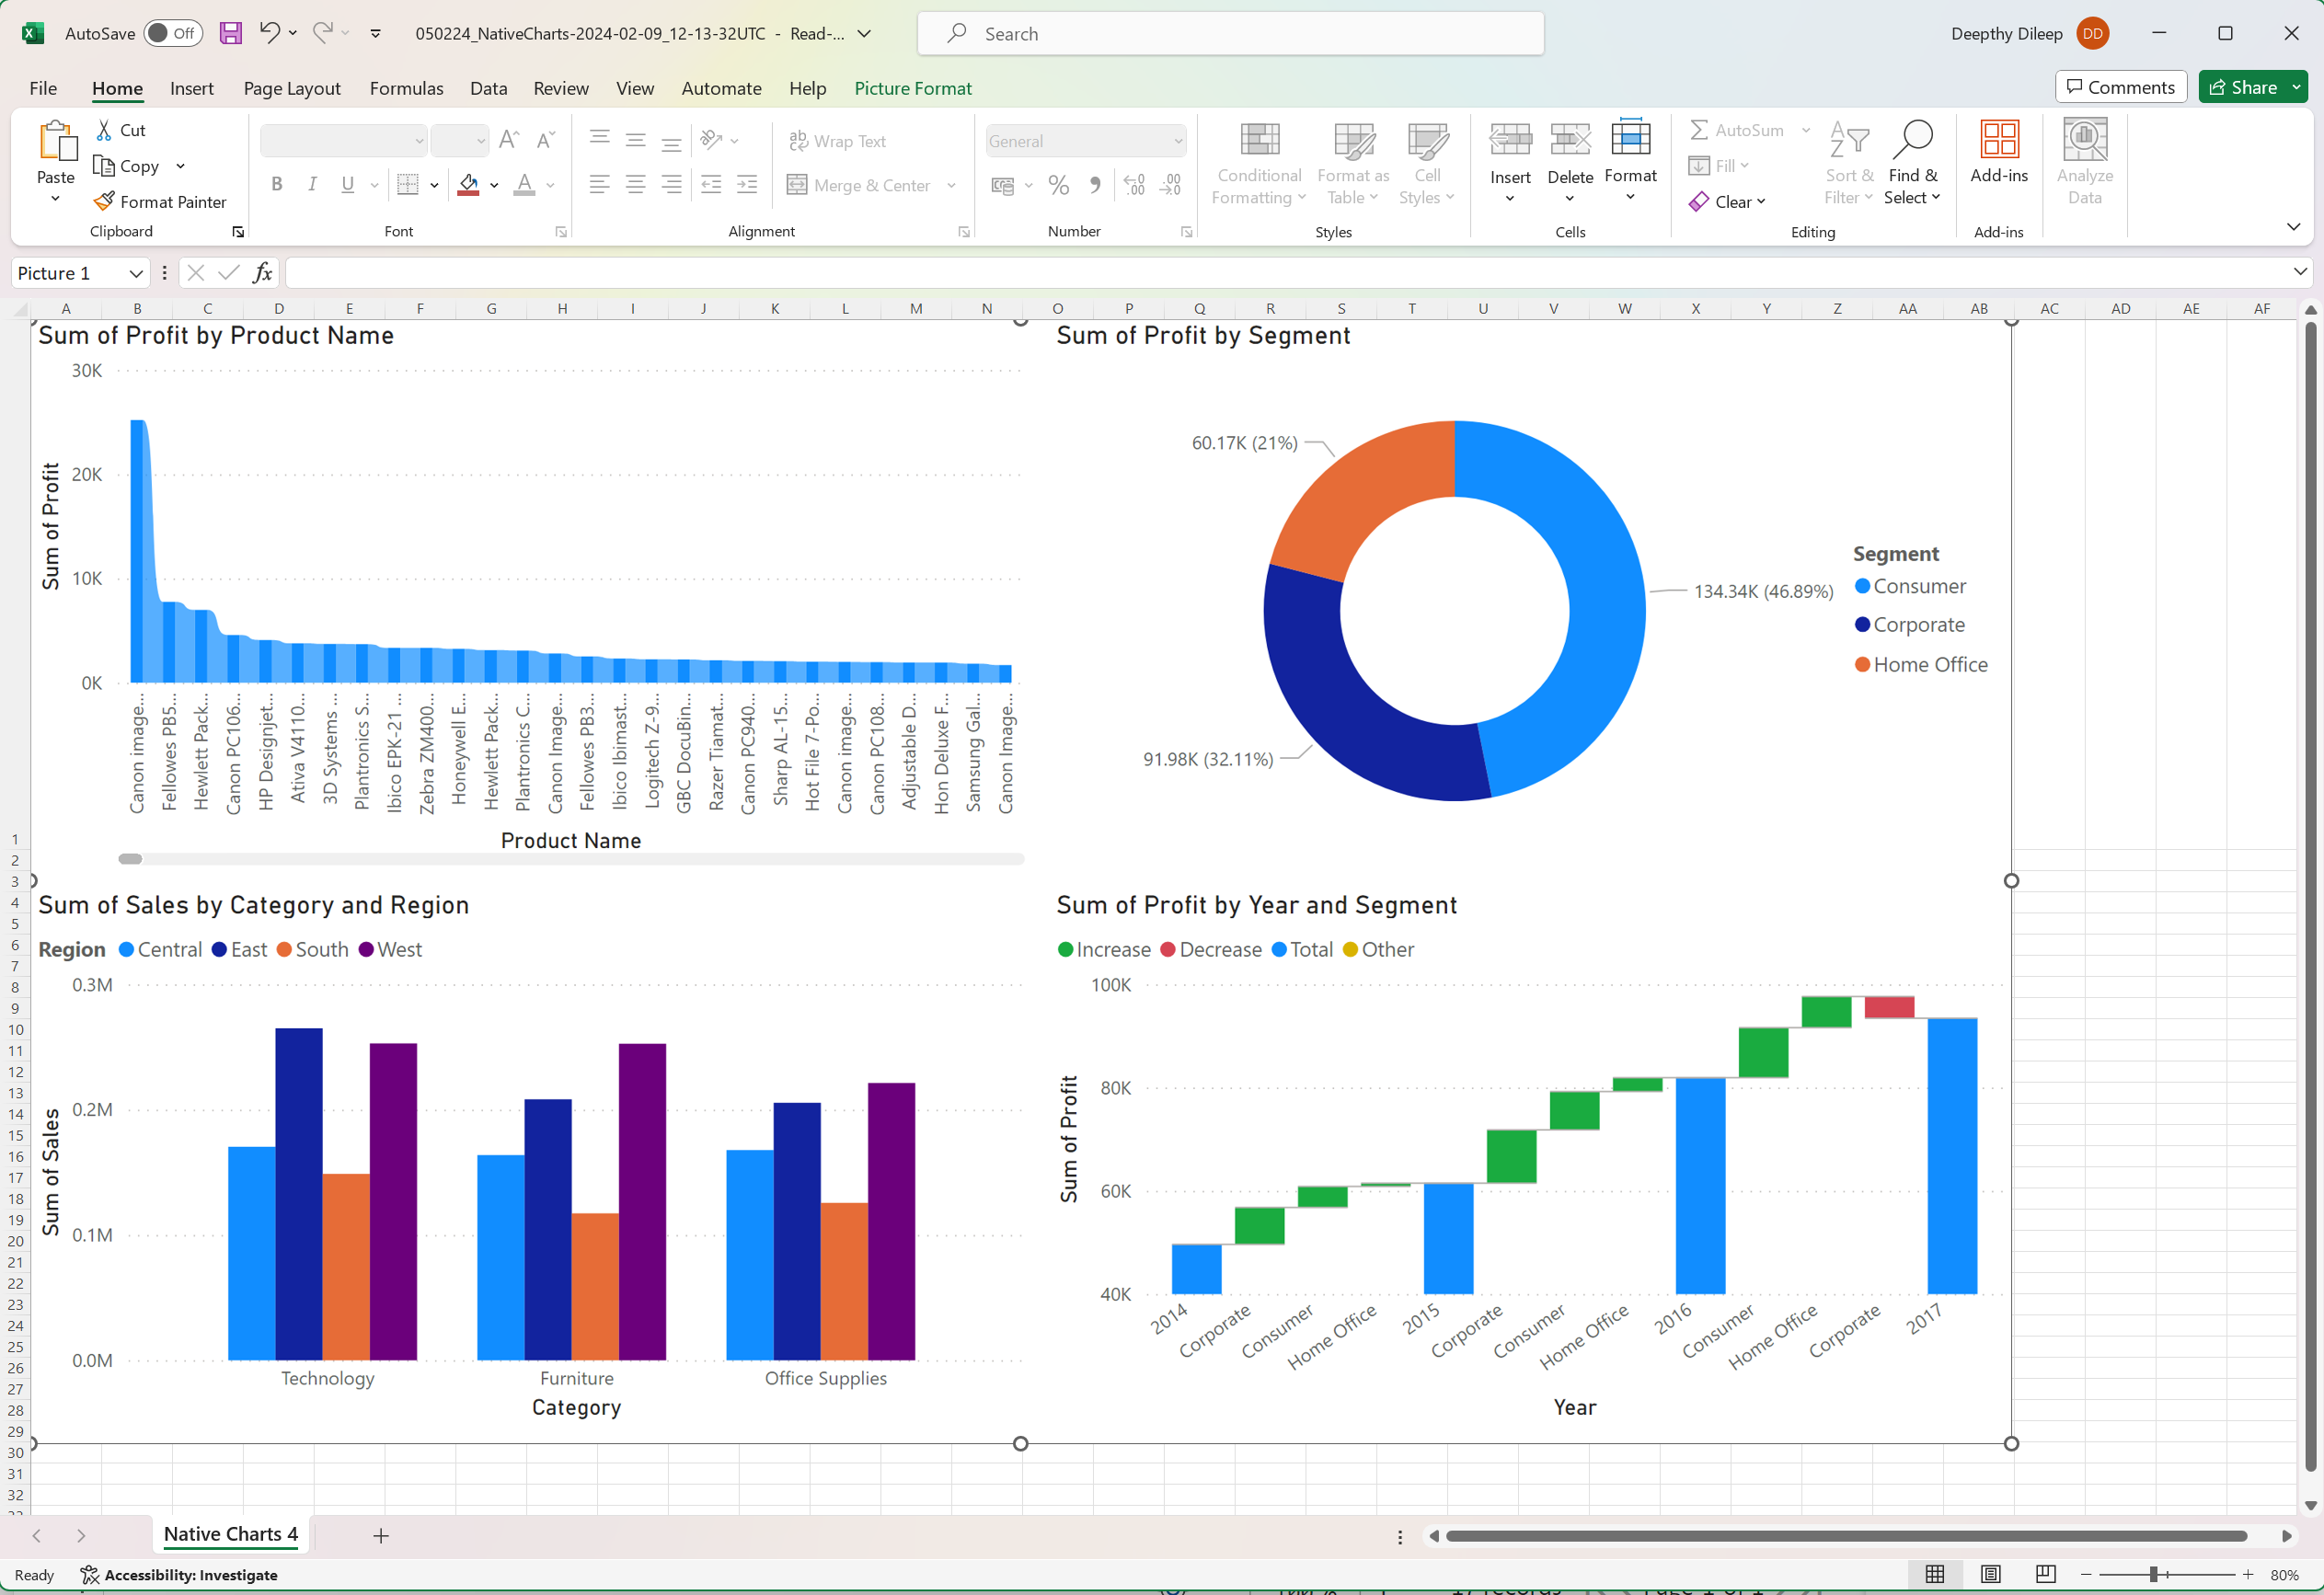
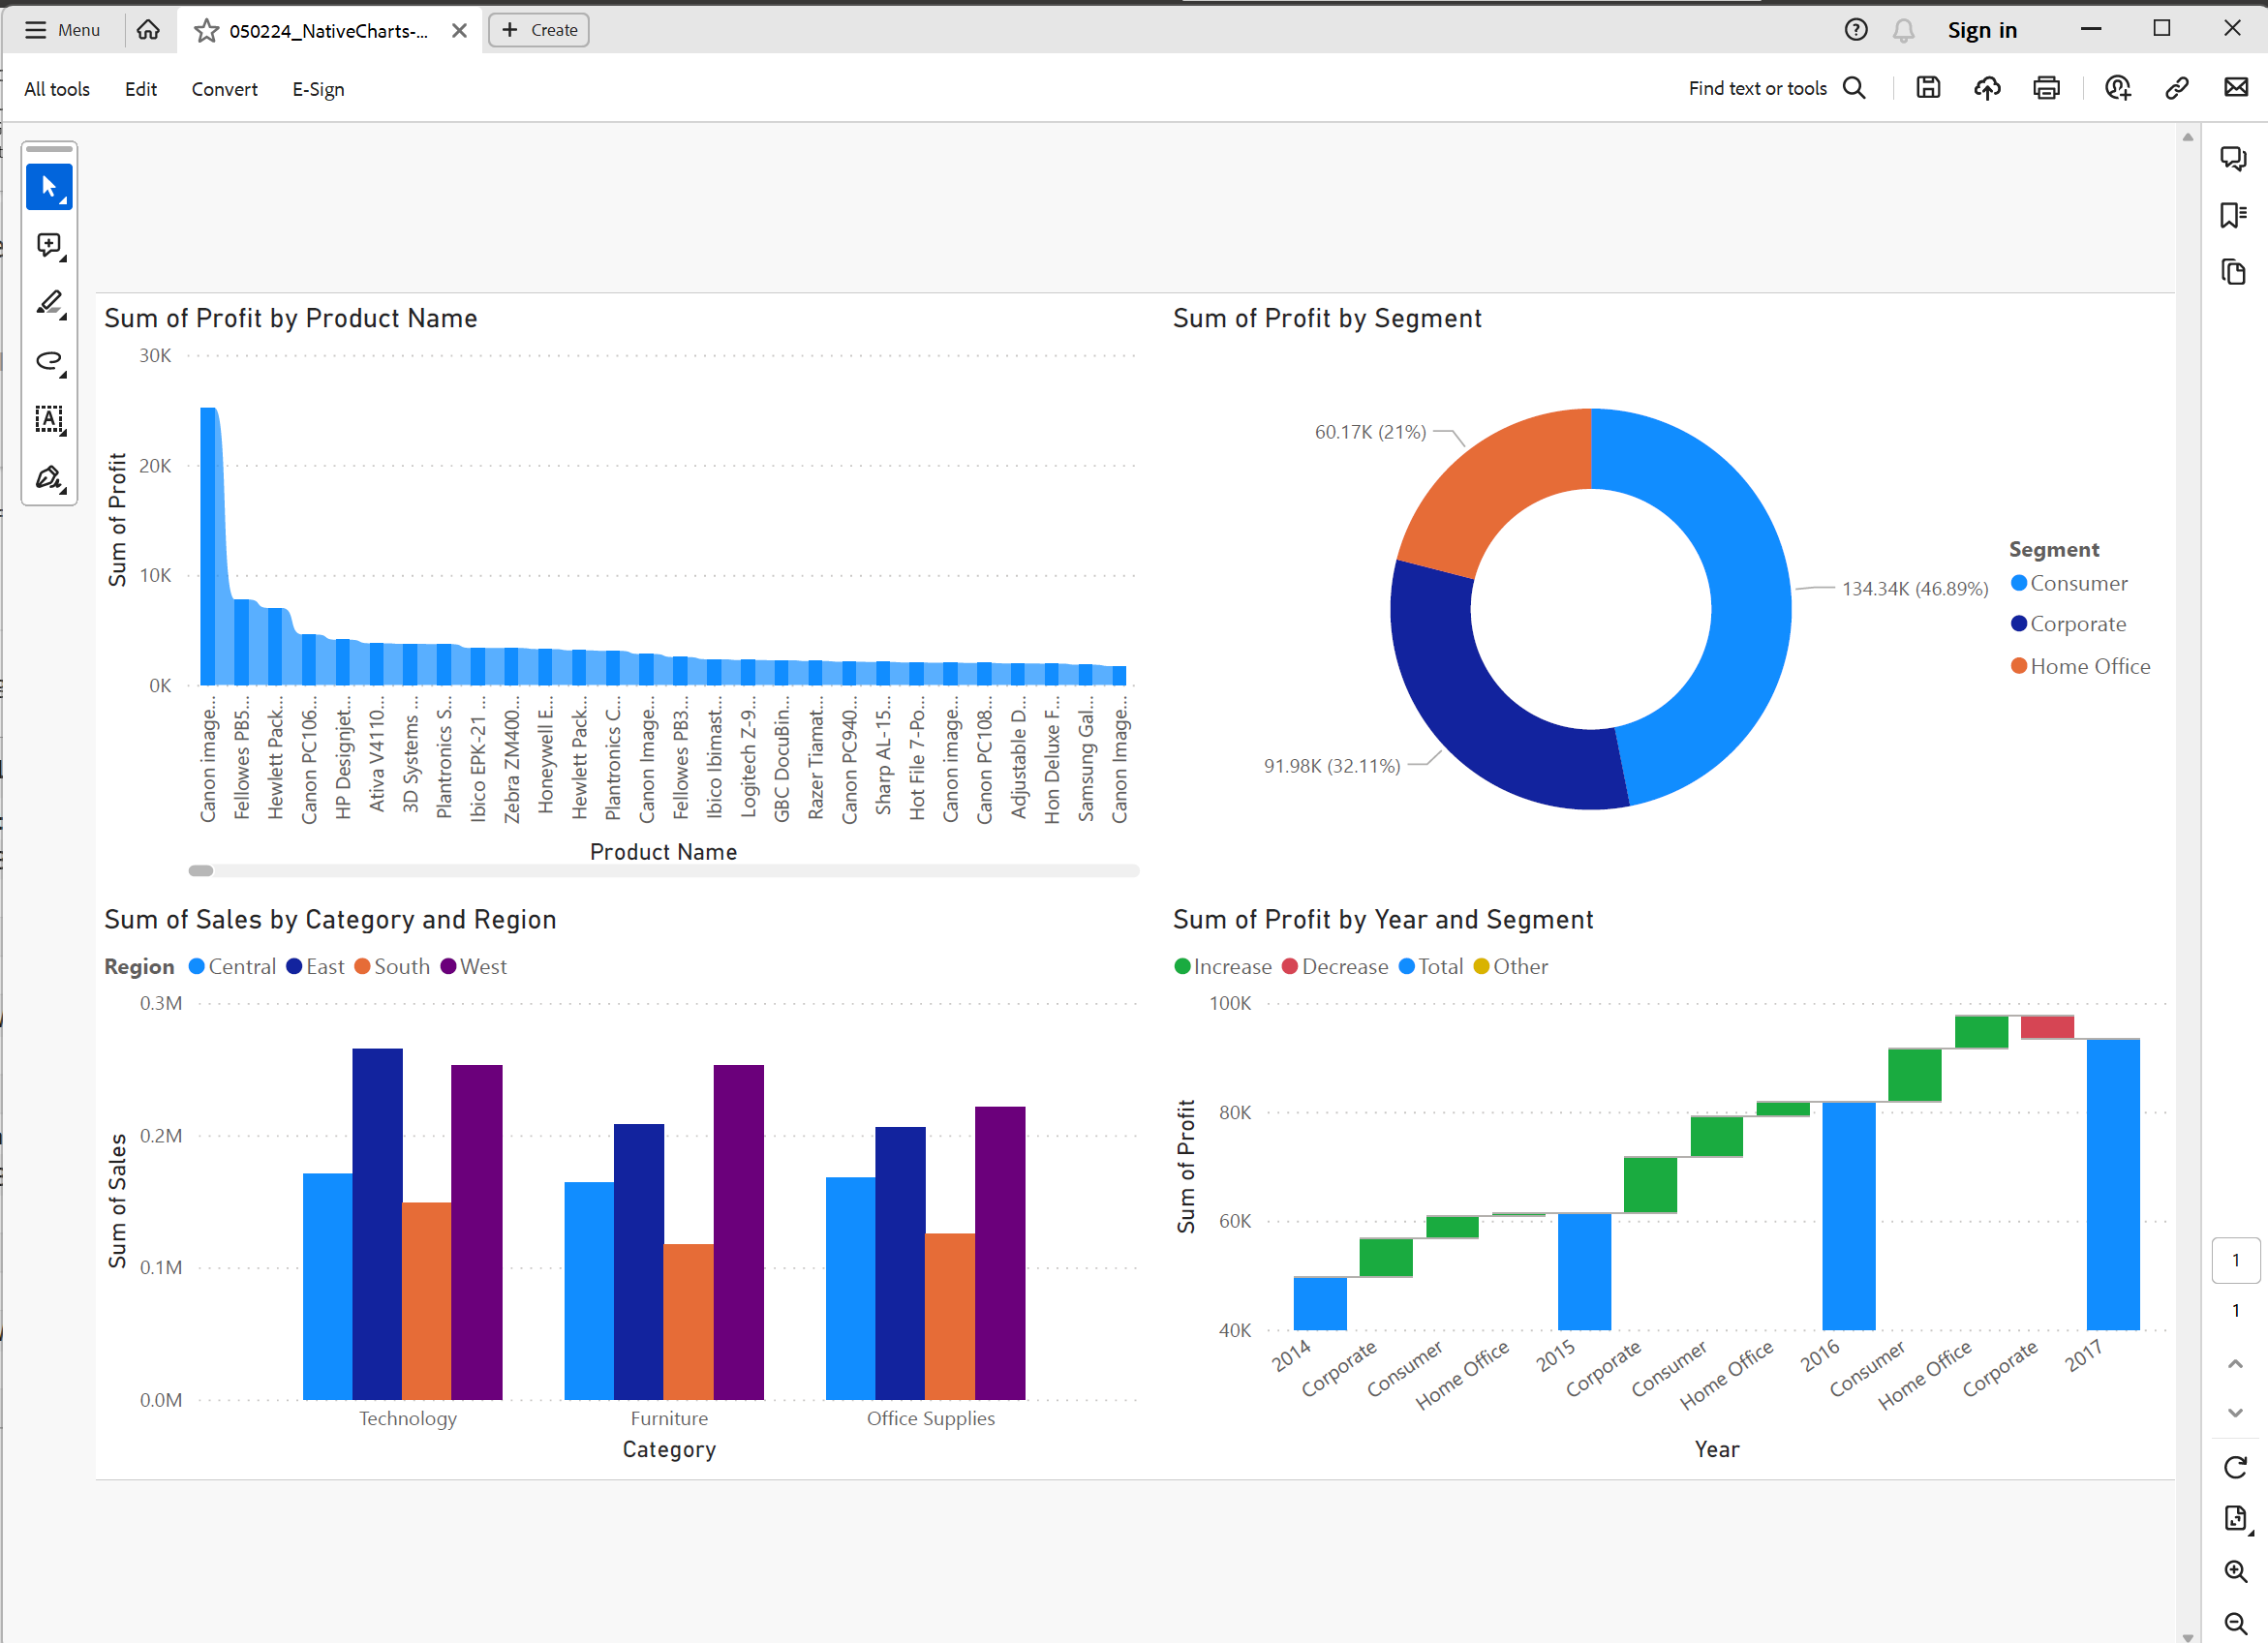
You can use the Inforiver scheduler to publish high resolution reports containing native charts. A combination of Reporting Matrix/Analytics+ with native charts is however not supported.
Sample excel export with native charts:
Sample PDF report with native charts:
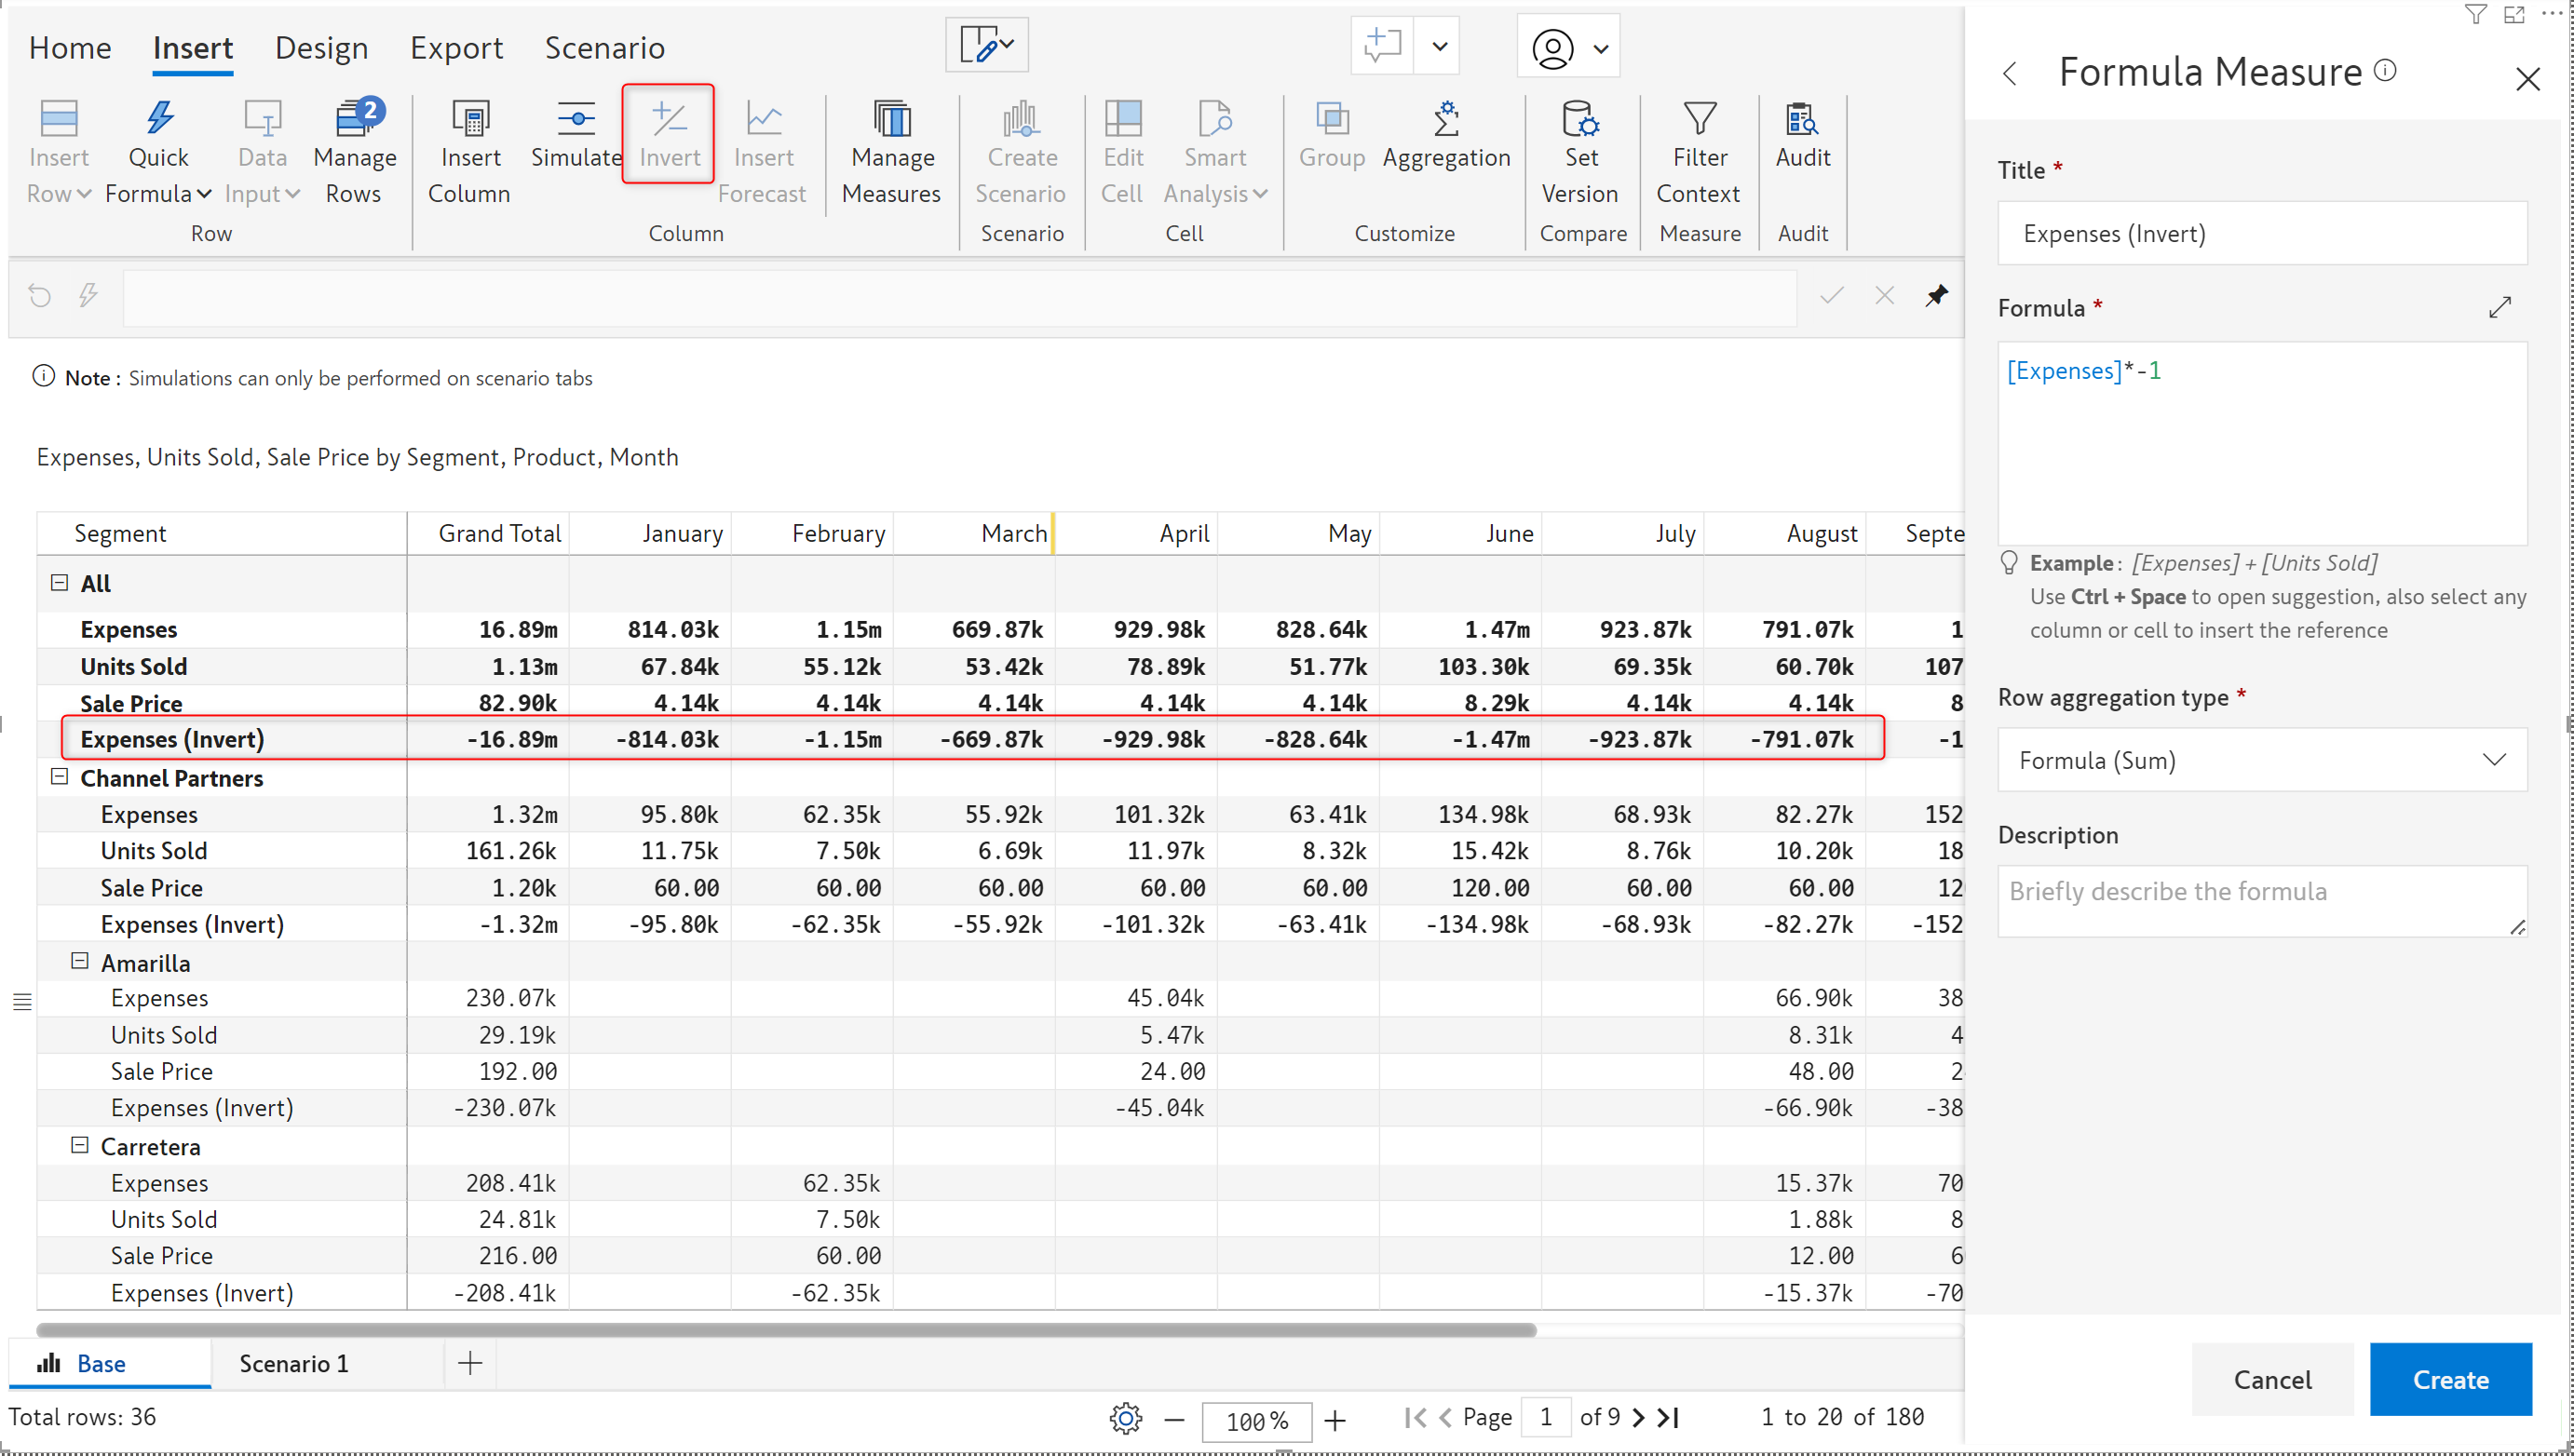
Your reports may have expenses or losses which need to be expressed as a negative value. You can now invert rows even in the ‘measure on rows’ layout. In the latest release, the invert feature can be applied to scenarios in the measure on rows layout. Please note that the invert option is available only for the base scenario.
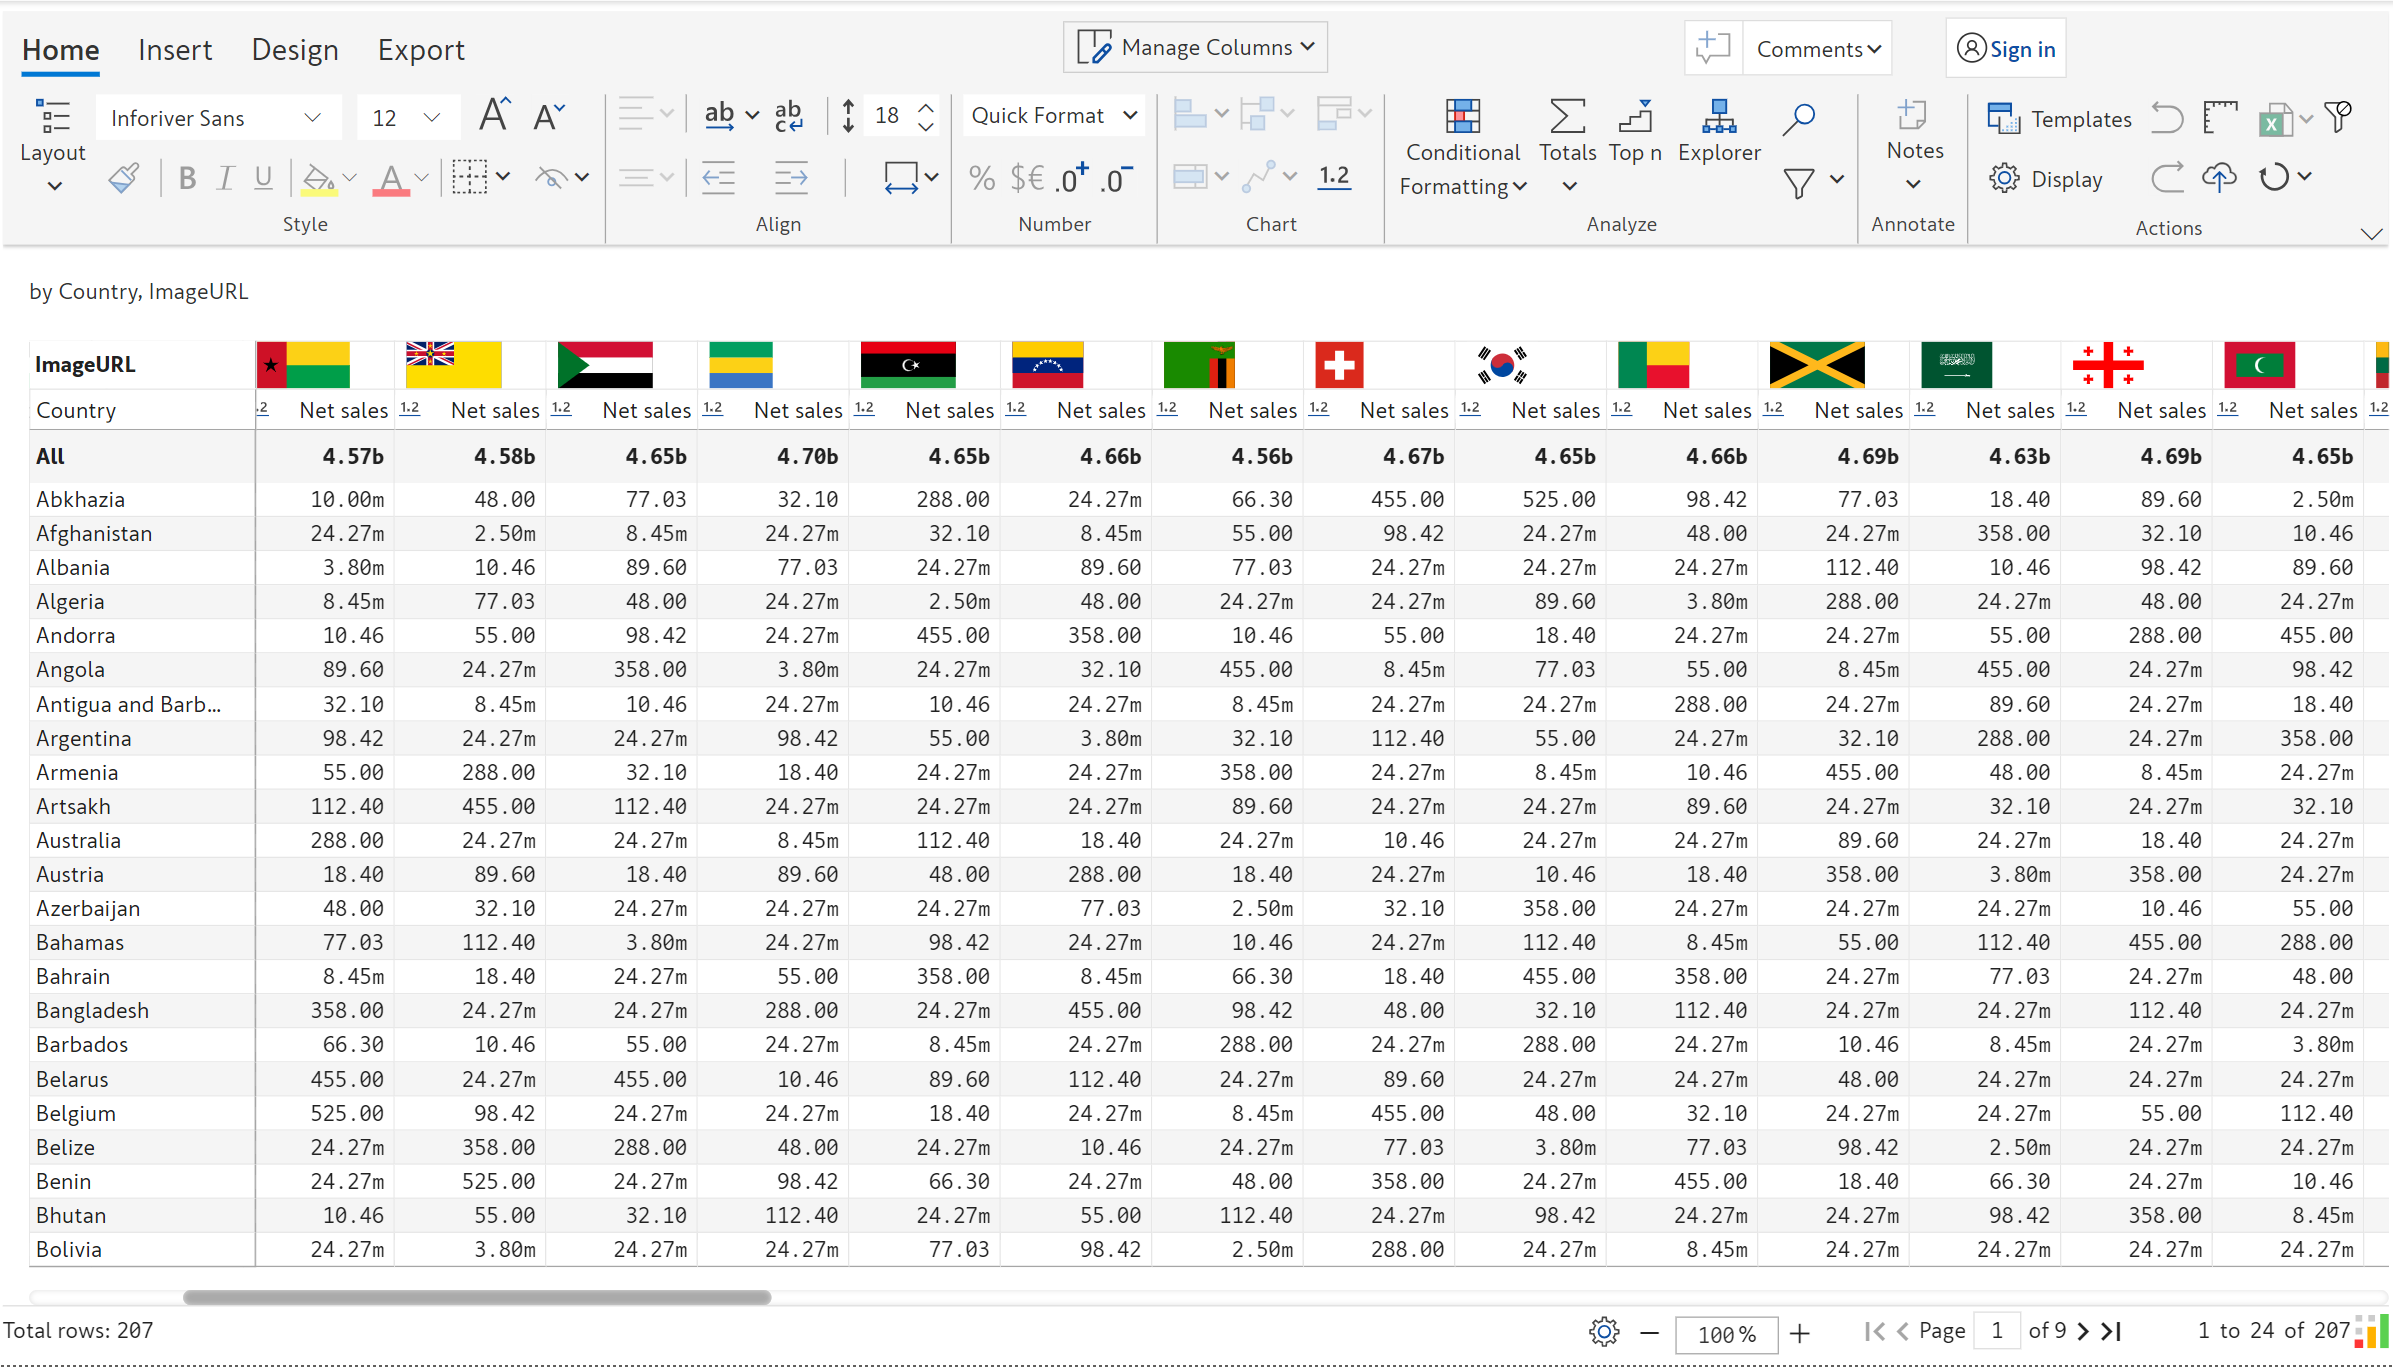
In the July release, we introduced support for embedding row-level images. The latest version of Inforiver provides extended support for images in row and column dimensions as well.
Enhancements for On-prem users
The refinements that we continuously make to Inforiver were made possible with your support and feedback. We look forward to receiving your suggestions and have many more exciting innovations lined up! Visit the Inforiver Community to share your ideas, vote on other submissions, and interact with other users.

Inforiver helps enterprises consolidate planning, reporting & analytics on a single platform (Power BI). The no-code, self-service award-winning platform has been recognized as the industry’s best and is adopted by many Fortune 100 firms.
Inforiver is a product of Lumel, the #1 Power BI AppSource Partner. The firm serves over 3,000 customers worldwide through its portfolio of products offered under the brands Inforiver, EDITable, ValQ, and xViz.