
Upcoming webinar on 'Inforiver Charts : The fastest way to deliver stories in Power BI', Aug 29th , Monday, 10.30 AM CST. Register Now
Upcoming webinar on 'Inforiver Charts : The fastest way to deliver stories in Power BI', Aug 29th , Monday, 10.30 AM CST. Register Now
Power BI provides a good foundation for data visualization and reporting. However, when organizations aim to deliver reports that align with International Business Communication Standards (IBCS), native capabilities often fall short. Even when developers resort to workarounds and hacks such as custom SVG measures, it falls short in terms of clarity, structure, and consistency. To […]
I’m proud to share the progress our organization has made so far in 2024—and into 2025—in delivering on our original vision and roadmap. Recently Delivered with Inforiver Analytics+ A One Stop Shop for All Custom Visual Needs: Our team has been hard at work expanding our chart library from 50+ to over 100 chart types. […]
Power BI is a powerful business intelligence platform, offering users the ability to build visually engaging, interactive dashboards and reports. While it comes equipped with a range of native visuals, complex reporting requirements often demand more specialized capabilities. This is where custom visuals step in—third-party visuals developed to address advanced use cases across industries. However, […]
Enterprise reporting plays a pivotal role in regular operations, enabling organizations to track performance metrics and communicate effectively with both internal teams and external stakeholders. Accurate and timely reporting is critical for driving decisions that positively impact business outcomes.
Throughout this eBook, we will explore how to leverage these capabilities with real-world examples. You will learn how to create recurring schedules with flexible frequency options, broadcast reports to different user groups, and apply custom filters and bookmarks to tailor content for each recipient. Additionally, you will learn how to export high-resolution PDFs, include executive scorecards within emails, and schedule reports with complex datasets containing hundreds of charts and tables.
Understanding trends, patterns, and performance over time within an organization’s data is a vital component of data analysis. Whether you’re analyzing sales, website traffic, or user behaviour, mastering time-related calculations can significantly enhance insights. In this blog post, we’ll explore how time intelligence functions in Power BI can be a powerful tool in gaining meaningful […]

Inforiver helps enterprises consolidate planning, reporting & analytics on a single platform (Power BI). The no-code, self-service award-winning platform has been recognized as the industry’s best and is adopted by many Fortune 100 firms.
Inforiver is a product of Lumel, the #1 Power BI AppSource Partner. The firm serves over 3,000 customers worldwide through its portfolio of products offered under the brands Inforiver, EDITable, ValQ, and xViz.
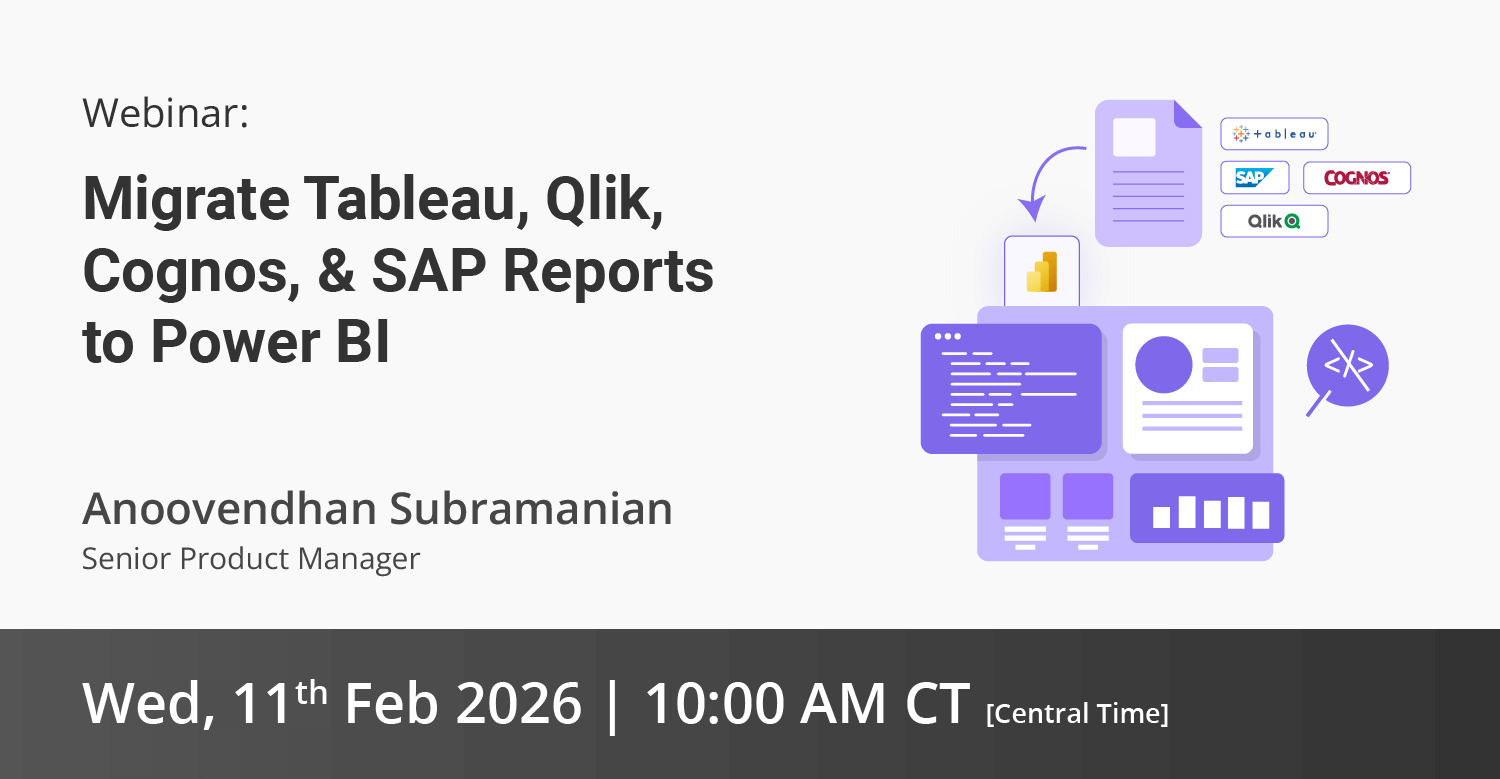
Learn how to accelerate your migration from Tableau, Qlik, Cognos, Spotfire, and SAP to Power BI using Inforiver - featuring faster development, advanced visuals, and a live demo.