Upcoming webinar on 'Inforiver Charts : The fastest way to deliver stories in Power BI', Aug 29th , Monday, 10.30 AM CST. Register Now
Upcoming webinar on 'Inforiver Charts : The fastest way to deliver stories in Power BI', Aug 29th , Monday, 10.30 AM CST. Register Now
Upcoming webinar on 'Inforiver Charts : The fastest way to deliver stories in Power BI', Aug 29th , Monday, 10.30 AM CST. Register Now


Here is a sample of what you can do without writing any code
Utilize First-Previous-Next-Last navigation to navigate through your reports
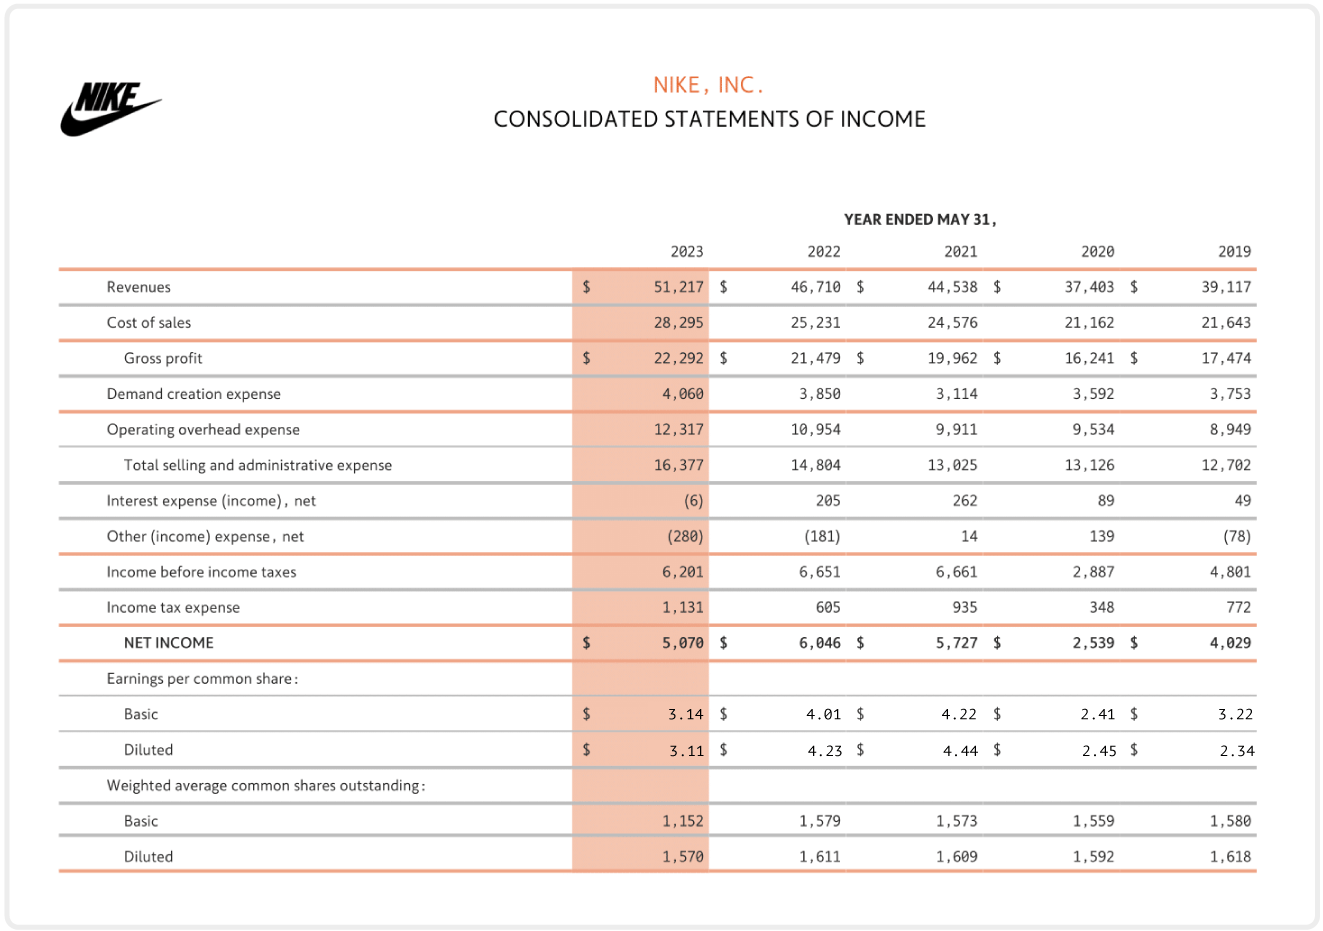
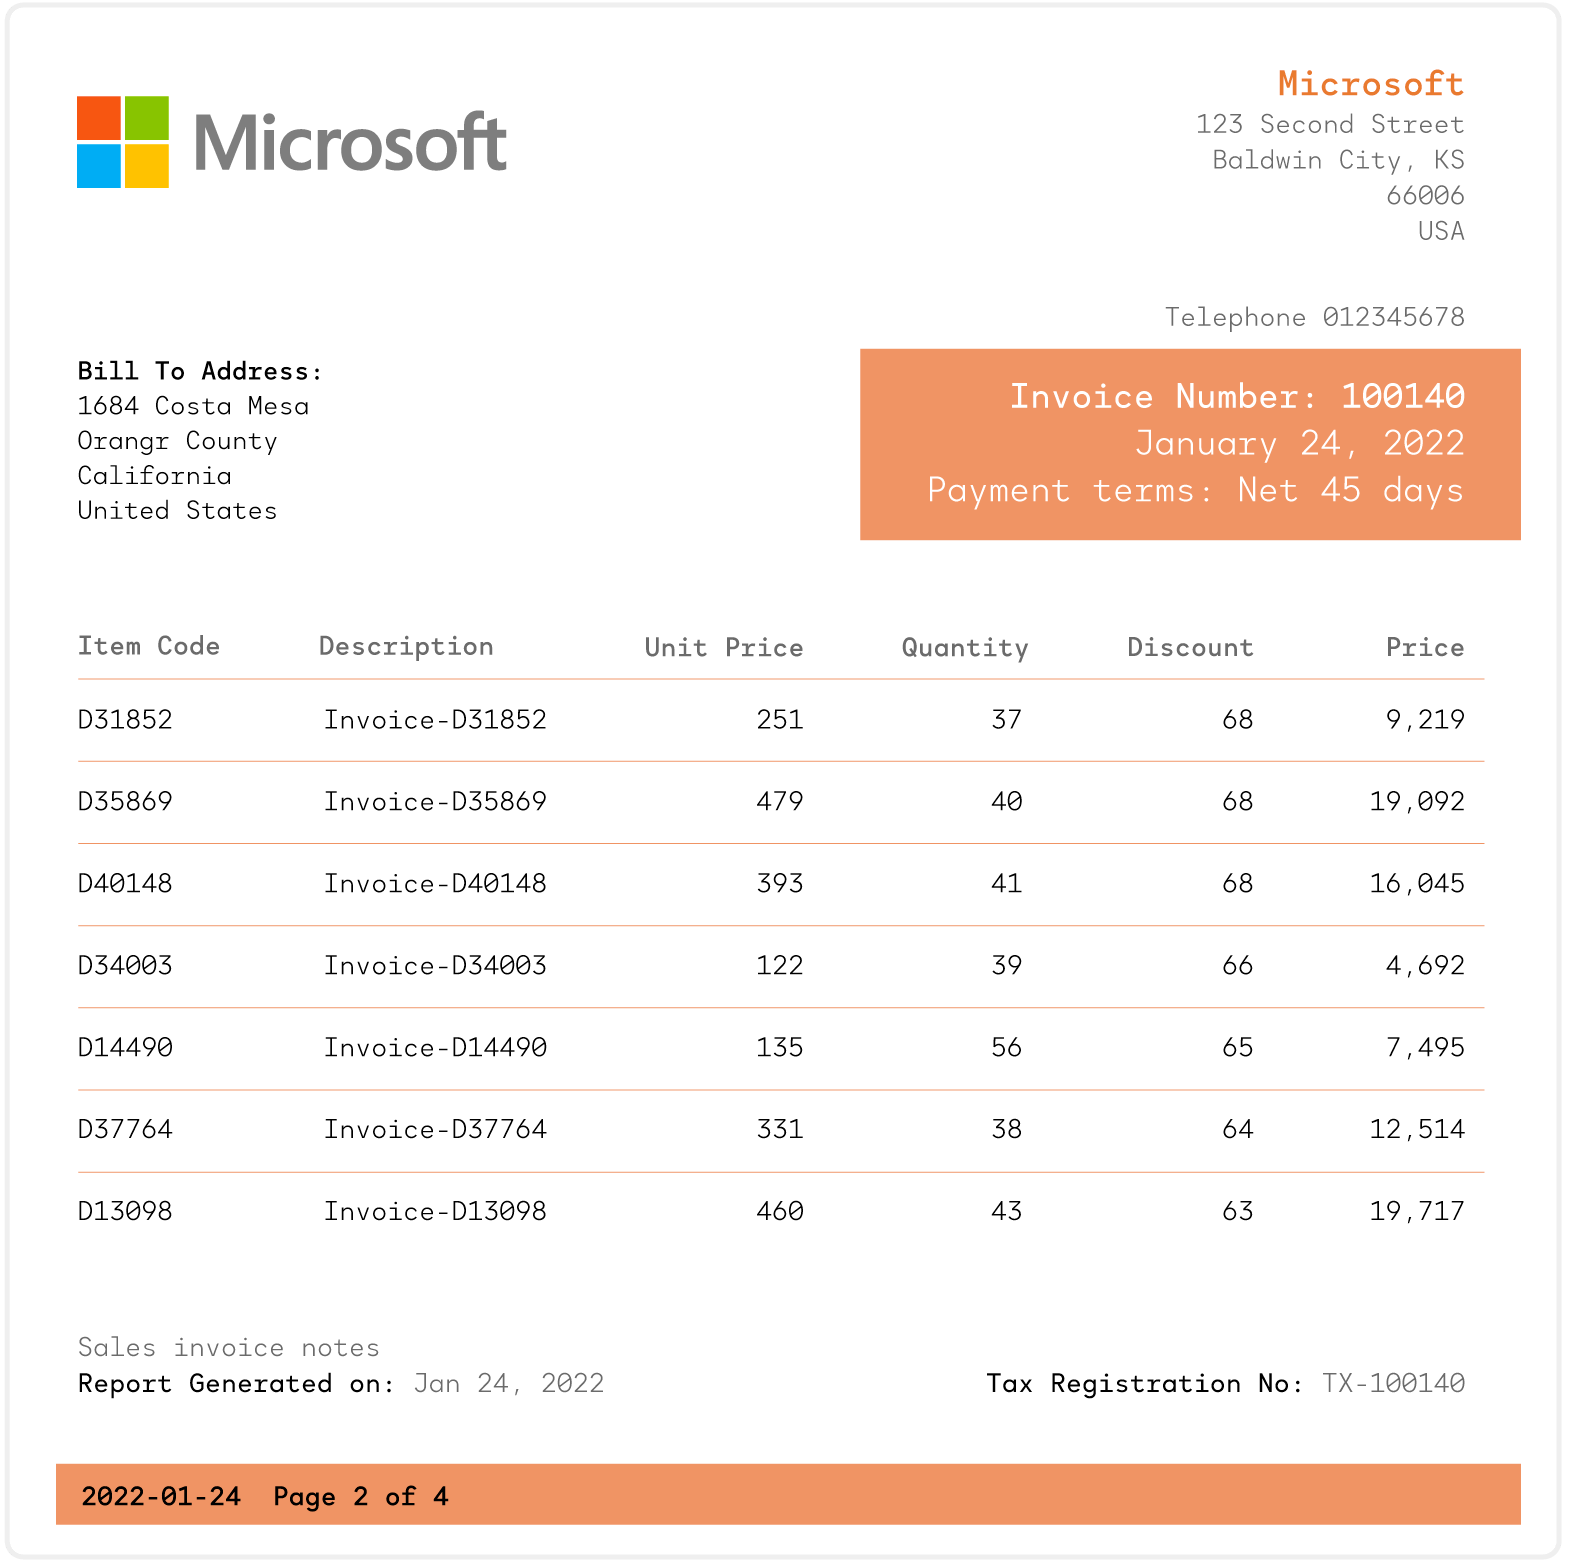
Configure report header and footer using customizable preset layouts
Have each new category in rows (e.g., Business Unit) start on a new page or remain on the same page after a section break
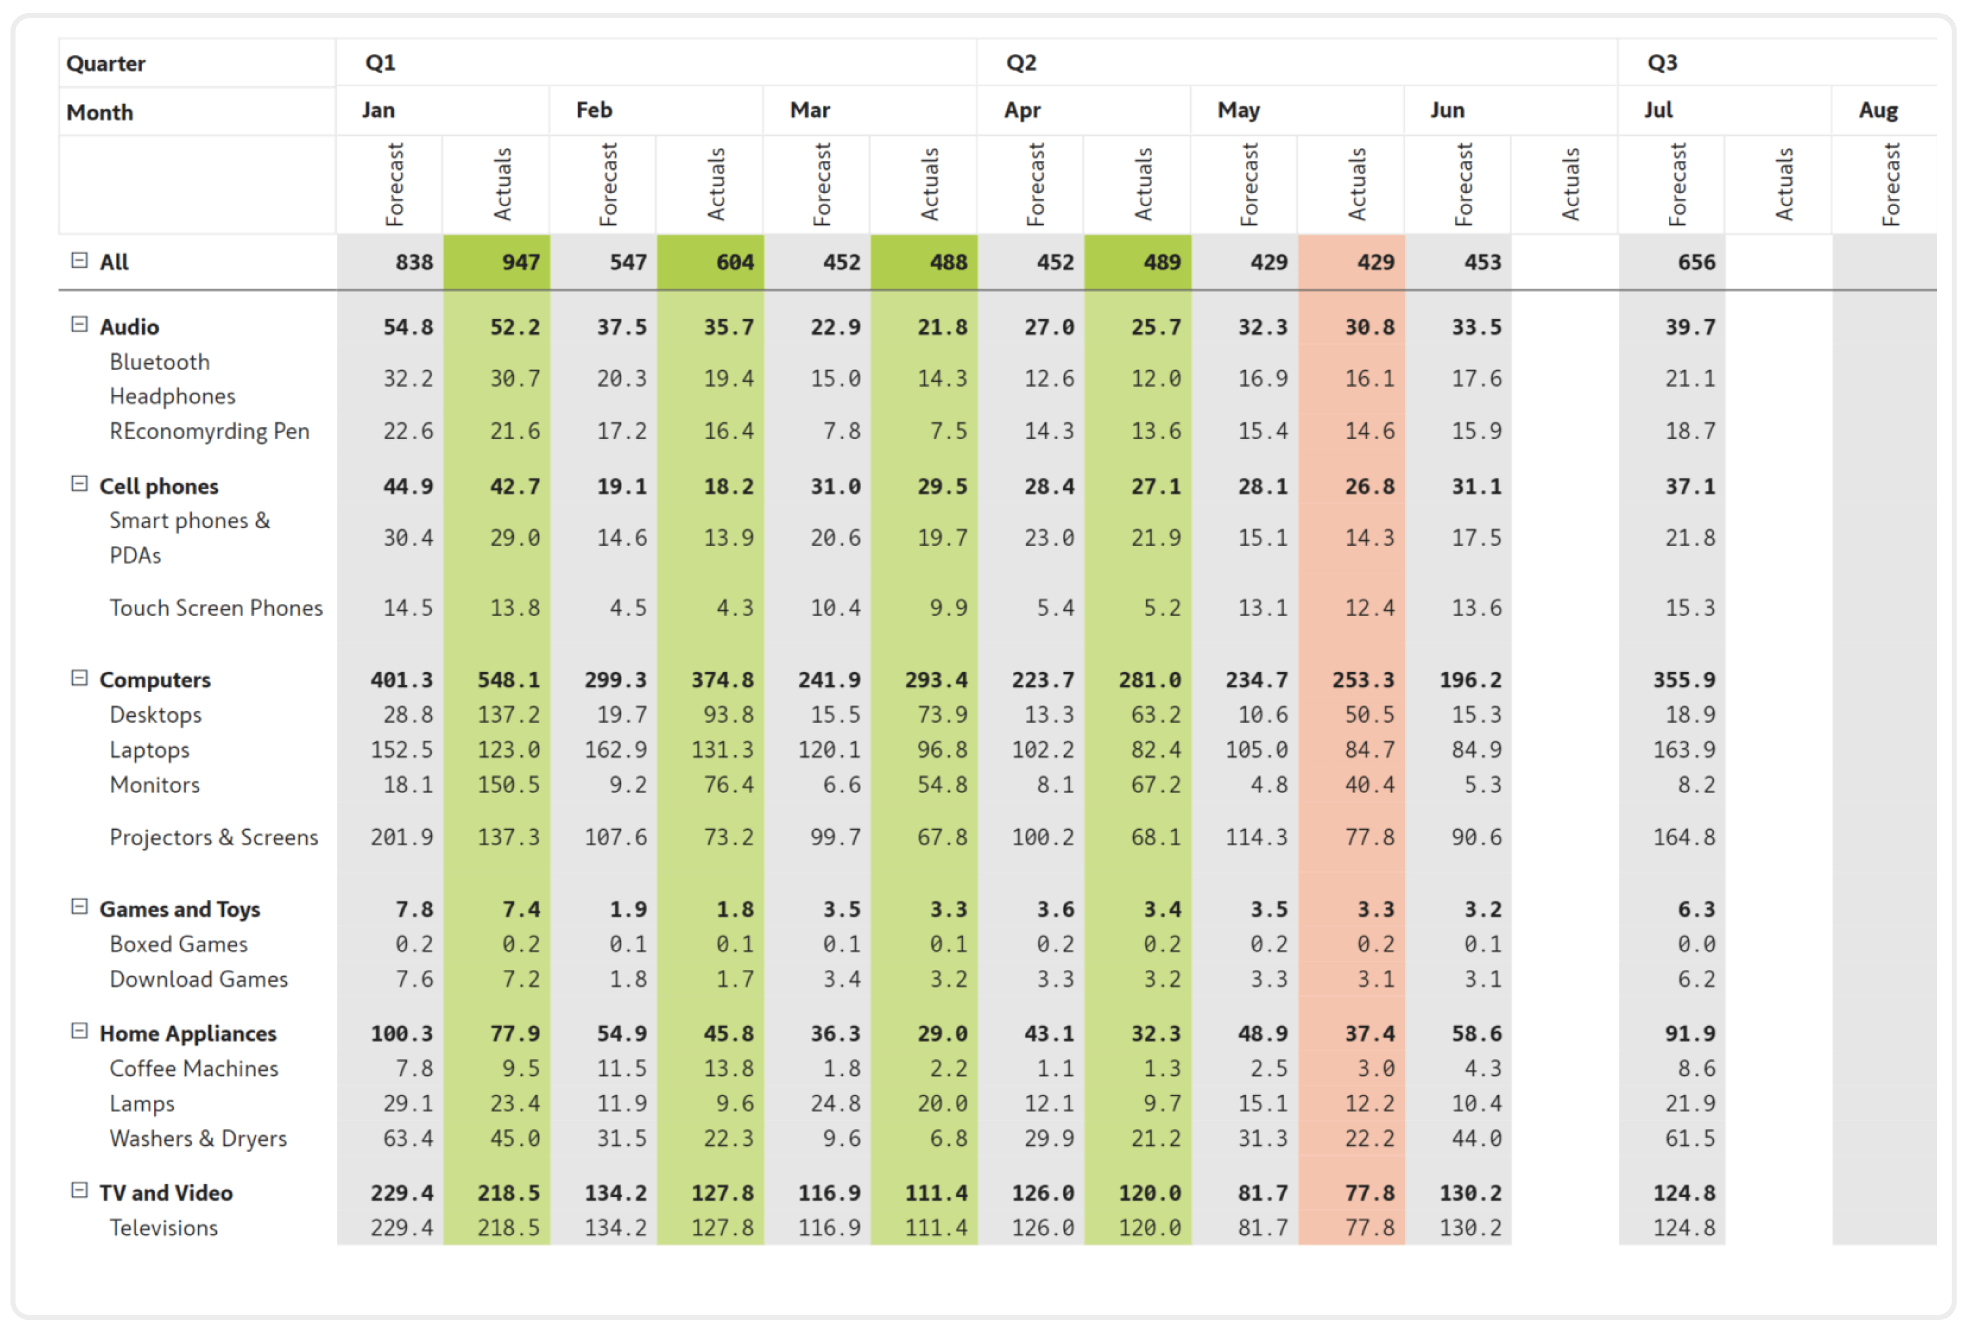
Use KPI card templates with integrated trend and variance visuals
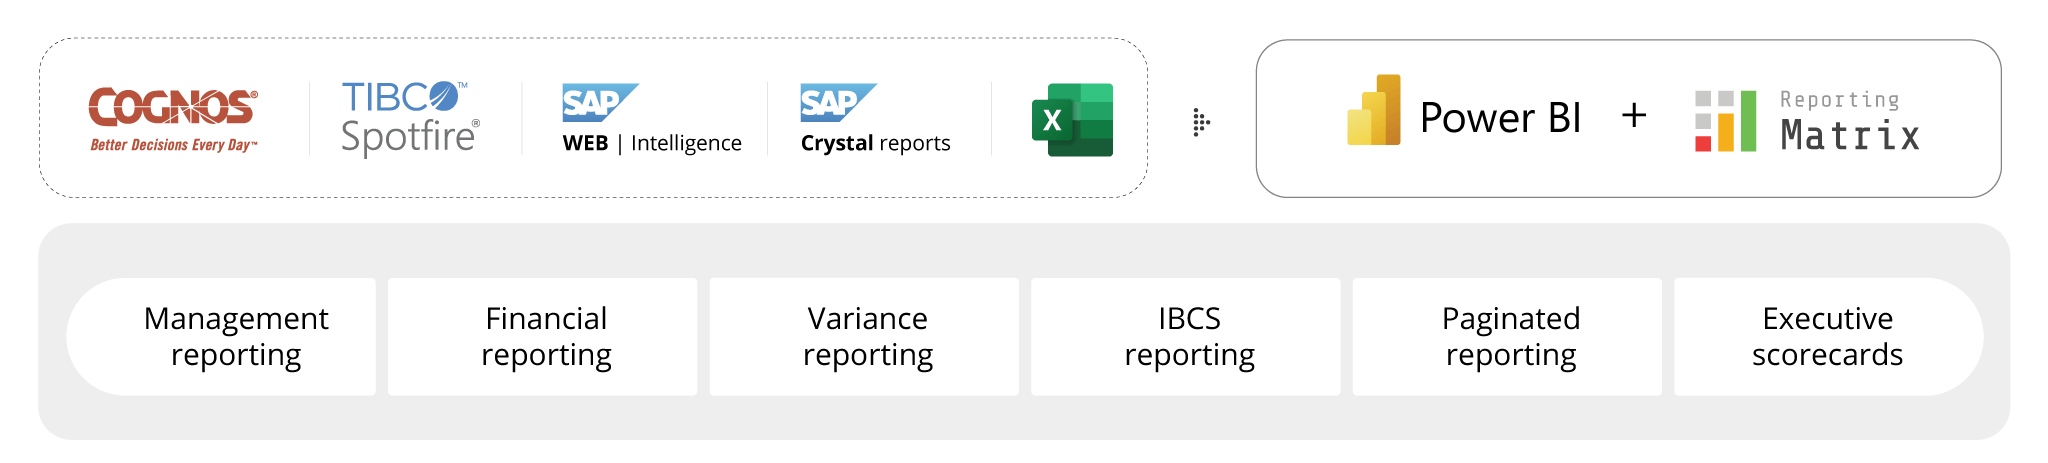
Better reporting; Better decisions
Flexible layouts
Report automation


Register here for a FREE 6-month exclusive access to Reporting Matrix

Inforiver helps enterprises consolidate planning, reporting & analytics on a single platform (Power BI). The no-code, self-service award-winning platform has been recognized as the industry’s best and is adopted by many Fortune 100 firms.
Inforiver is a product of Lumel, the #1 Power BI AppSource Partner. The firm serves over 3,000 customers worldwide through its portfolio of products offered under the brands Inforiver, EDITable, ValQ, and xViz.