
Upcoming webinar on 'Inforiver Charts : The fastest way to deliver stories in Power BI', Aug 29th , Monday, 10.30 AM CST. Register Now
Upcoming webinar on 'Inforiver Charts : The fastest way to deliver stories in Power BI', Aug 29th , Monday, 10.30 AM CST. Register Now
Upcoming webinar on 'Inforiver Charts : The fastest way to deliver stories in Power BI', Aug 29th , Monday, 10.30 AM CST. Register Now
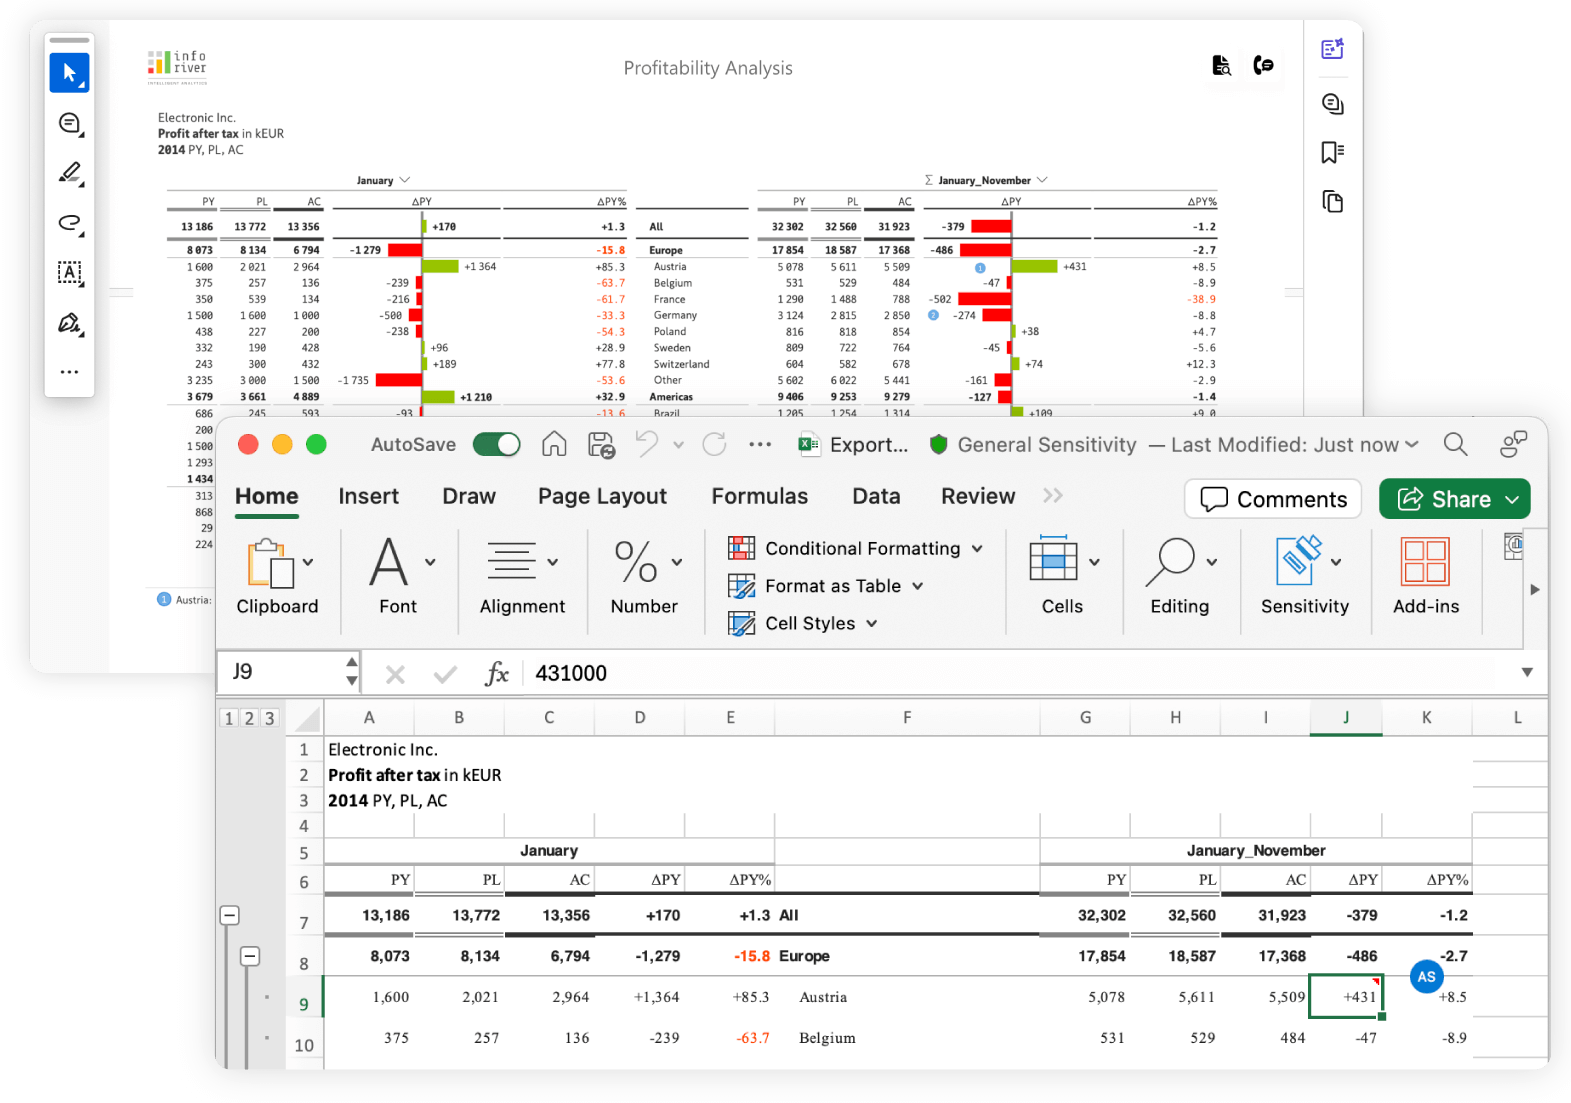
Here is a sample of what you can do without writing any code
Utilize First-Previous-Next-Last navigation to navigate through your reports
Configure report header and footer using customizable preset layouts
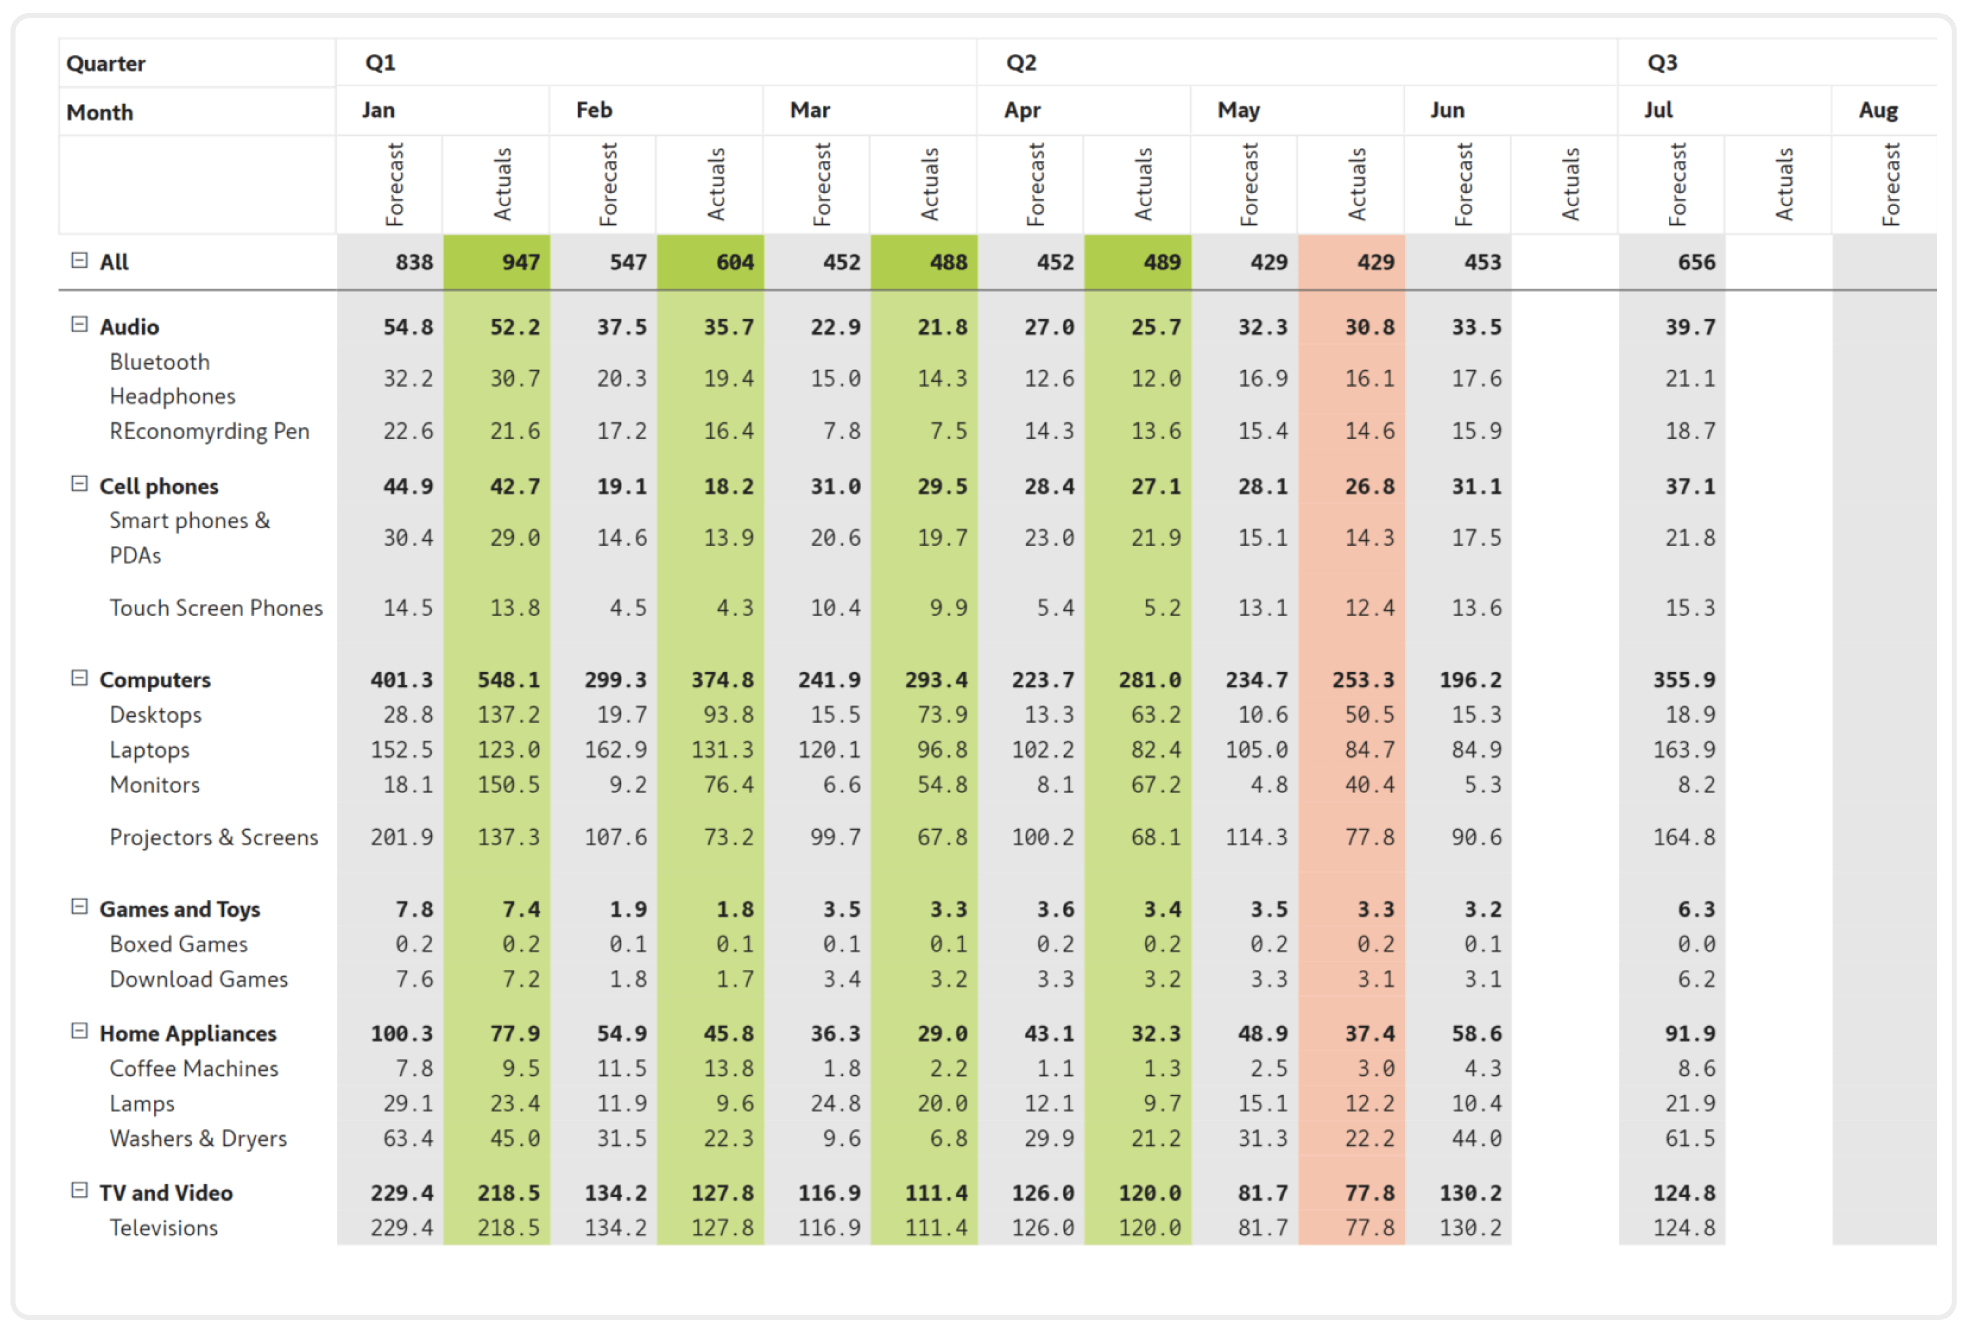
Have each new category in rows (e.g., Business Unit) start on a new page or remain on the same page after a section break
Use KPI card templates with integrated trend and variance visuals
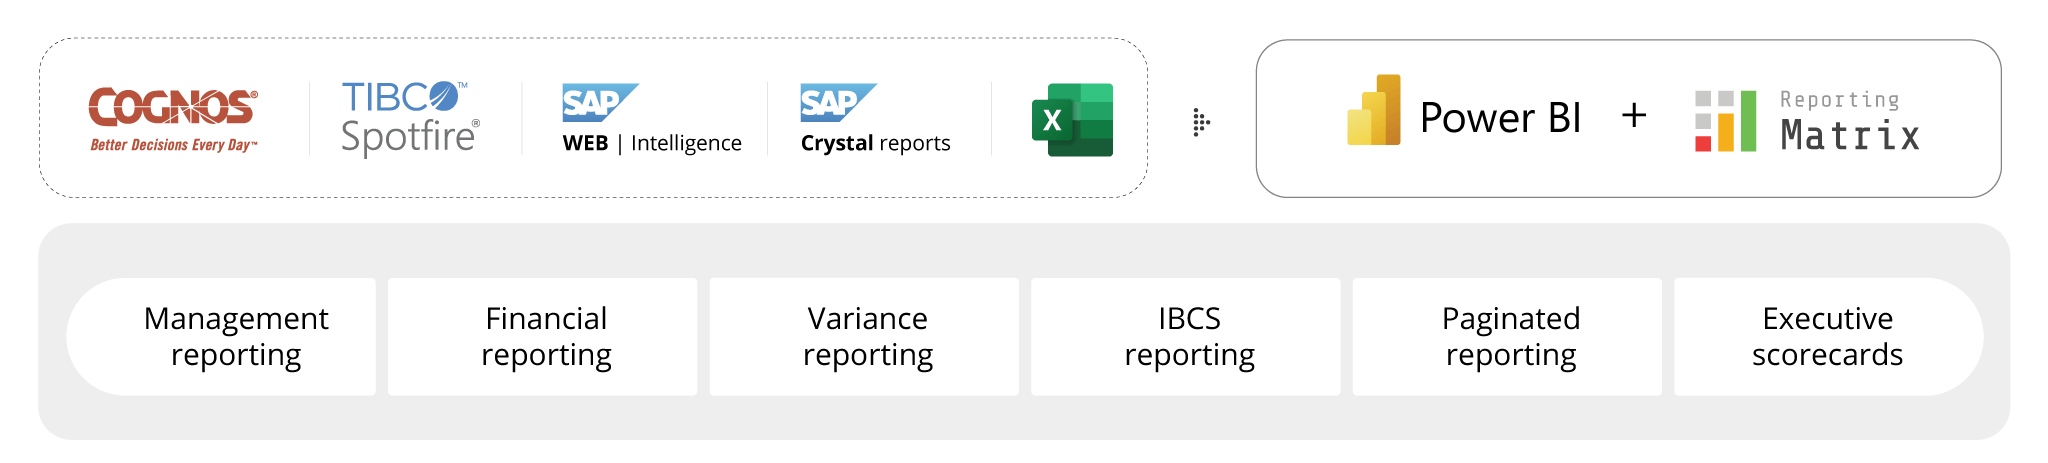
Better reporting; Better decisions
Flexible layouts
Report automation


Register here for a FREE 6-month exclusive access to Reporting Matrix

Inforiver helps enterprises consolidate planning, reporting & analytics on a single platform (Power BI). The no-code, self-service award-winning platform has been recognized as the industry’s best and is adopted by many Fortune 100 firms.
Inforiver is a product of Lumel, the #1 Power BI AppSource Partner. The firm serves over 3,000 customers worldwide through its portfolio of products offered under the brands Inforiver, EDITable, ValQ, and xViz.


 Transform Power BI dashboards into decision-driving tools. Discover data visualization best practices tailored for Power BI users.