Upcoming webinar on 'Inforiver Charts : The fastest way to deliver stories in Power BI', Aug 29th , Monday, 10.30 AM CST. Register Now
Upcoming webinar on 'Inforiver Charts : The fastest way to deliver stories in Power BI', Aug 29th , Monday, 10.30 AM CST. Register Now
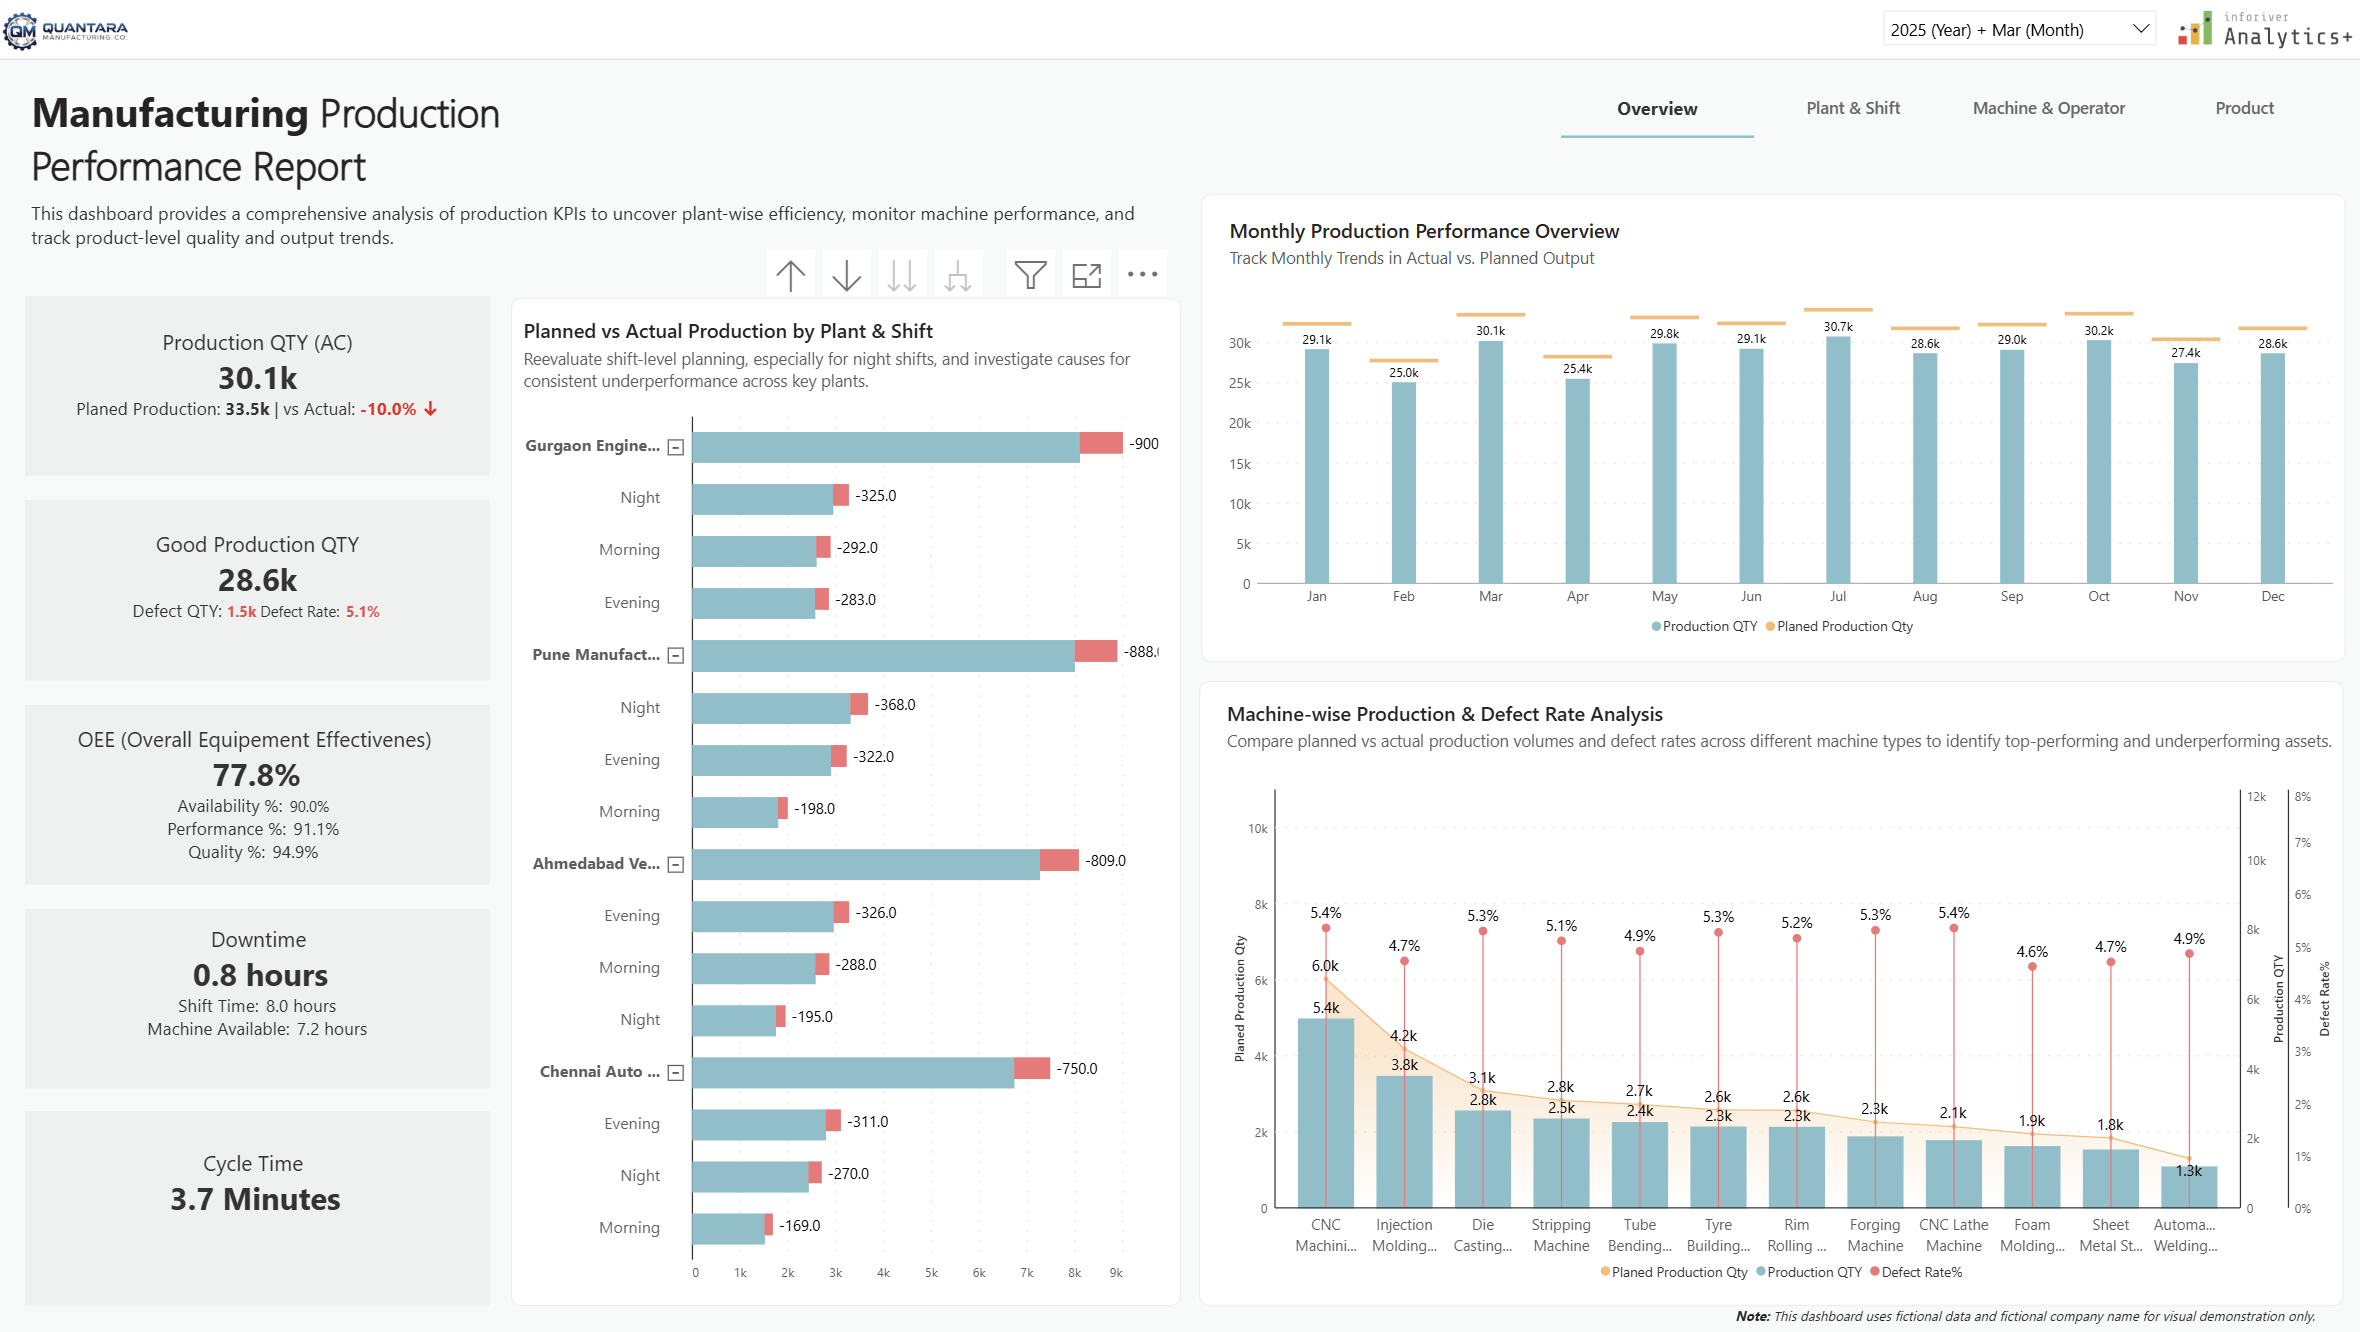
Boost automotive manufacturing performance with this IBCS-driven dashboard in Power BI. Designed for production engineers and plant managers, this powerful solution provides unified, real-time analysis to optimize multi-plant operations. We use IBCS standards and Inforiver Analytics+ to deliver clean, consistent, and executive-ready insights based on real-world manufacturing data.
It’s designed for production engineers, plant managers, and operations leaders to make smarter decisions based on cycle times, OEE, defect rates, and root causes of downtime across every layer of manufacturing.
What You'll Learn and Discover with This Dashboard:
Visual Highlights & Interactive Features:
About the Data & Dashboard
This dashboard is based on fictional automotive data and built to showcase how Inforiver Analytics+ and IBCS design standards can simplify complex production reporting with clean, structured, and actionable visuals.
Download the dashboard today
Experience how IBCS design and smart analytics can boost your plant’s performance from shop floor to boardroom.

to try advance features
[demo_download_modal title="IBCS Power BI Dashboard for Automotive Manufacturing — Real-Time Plant Performance Analysis" link="https://inforiver.com/wp-content/uploads/IBCS-Driven-Dashboard-for-Automotive-Manufacturing-Performance.zip"]
Inforiver helps enterprises consolidate planning, reporting & analytics on a single platform (Power BI). The no-code, self-service award-winning platform has been recognized as the industry’s best and is adopted by many Fortune 100 firms.
Inforiver is a product of Lumel, the #1 Power BI AppSource Partner. The firm serves over 3,000 customers worldwide through its portfolio of products offered under the brands Inforiver, EDITable, ValQ, and xViz.