
Upcoming webinar on 'Inforiver Charts : The fastest way to deliver stories in Power BI', Aug 29th , Monday, 10.30 AM CST. Register Now
Upcoming webinar on 'Inforiver Charts : The fastest way to deliver stories in Power BI', Aug 29th , Monday, 10.30 AM CST. Register Now
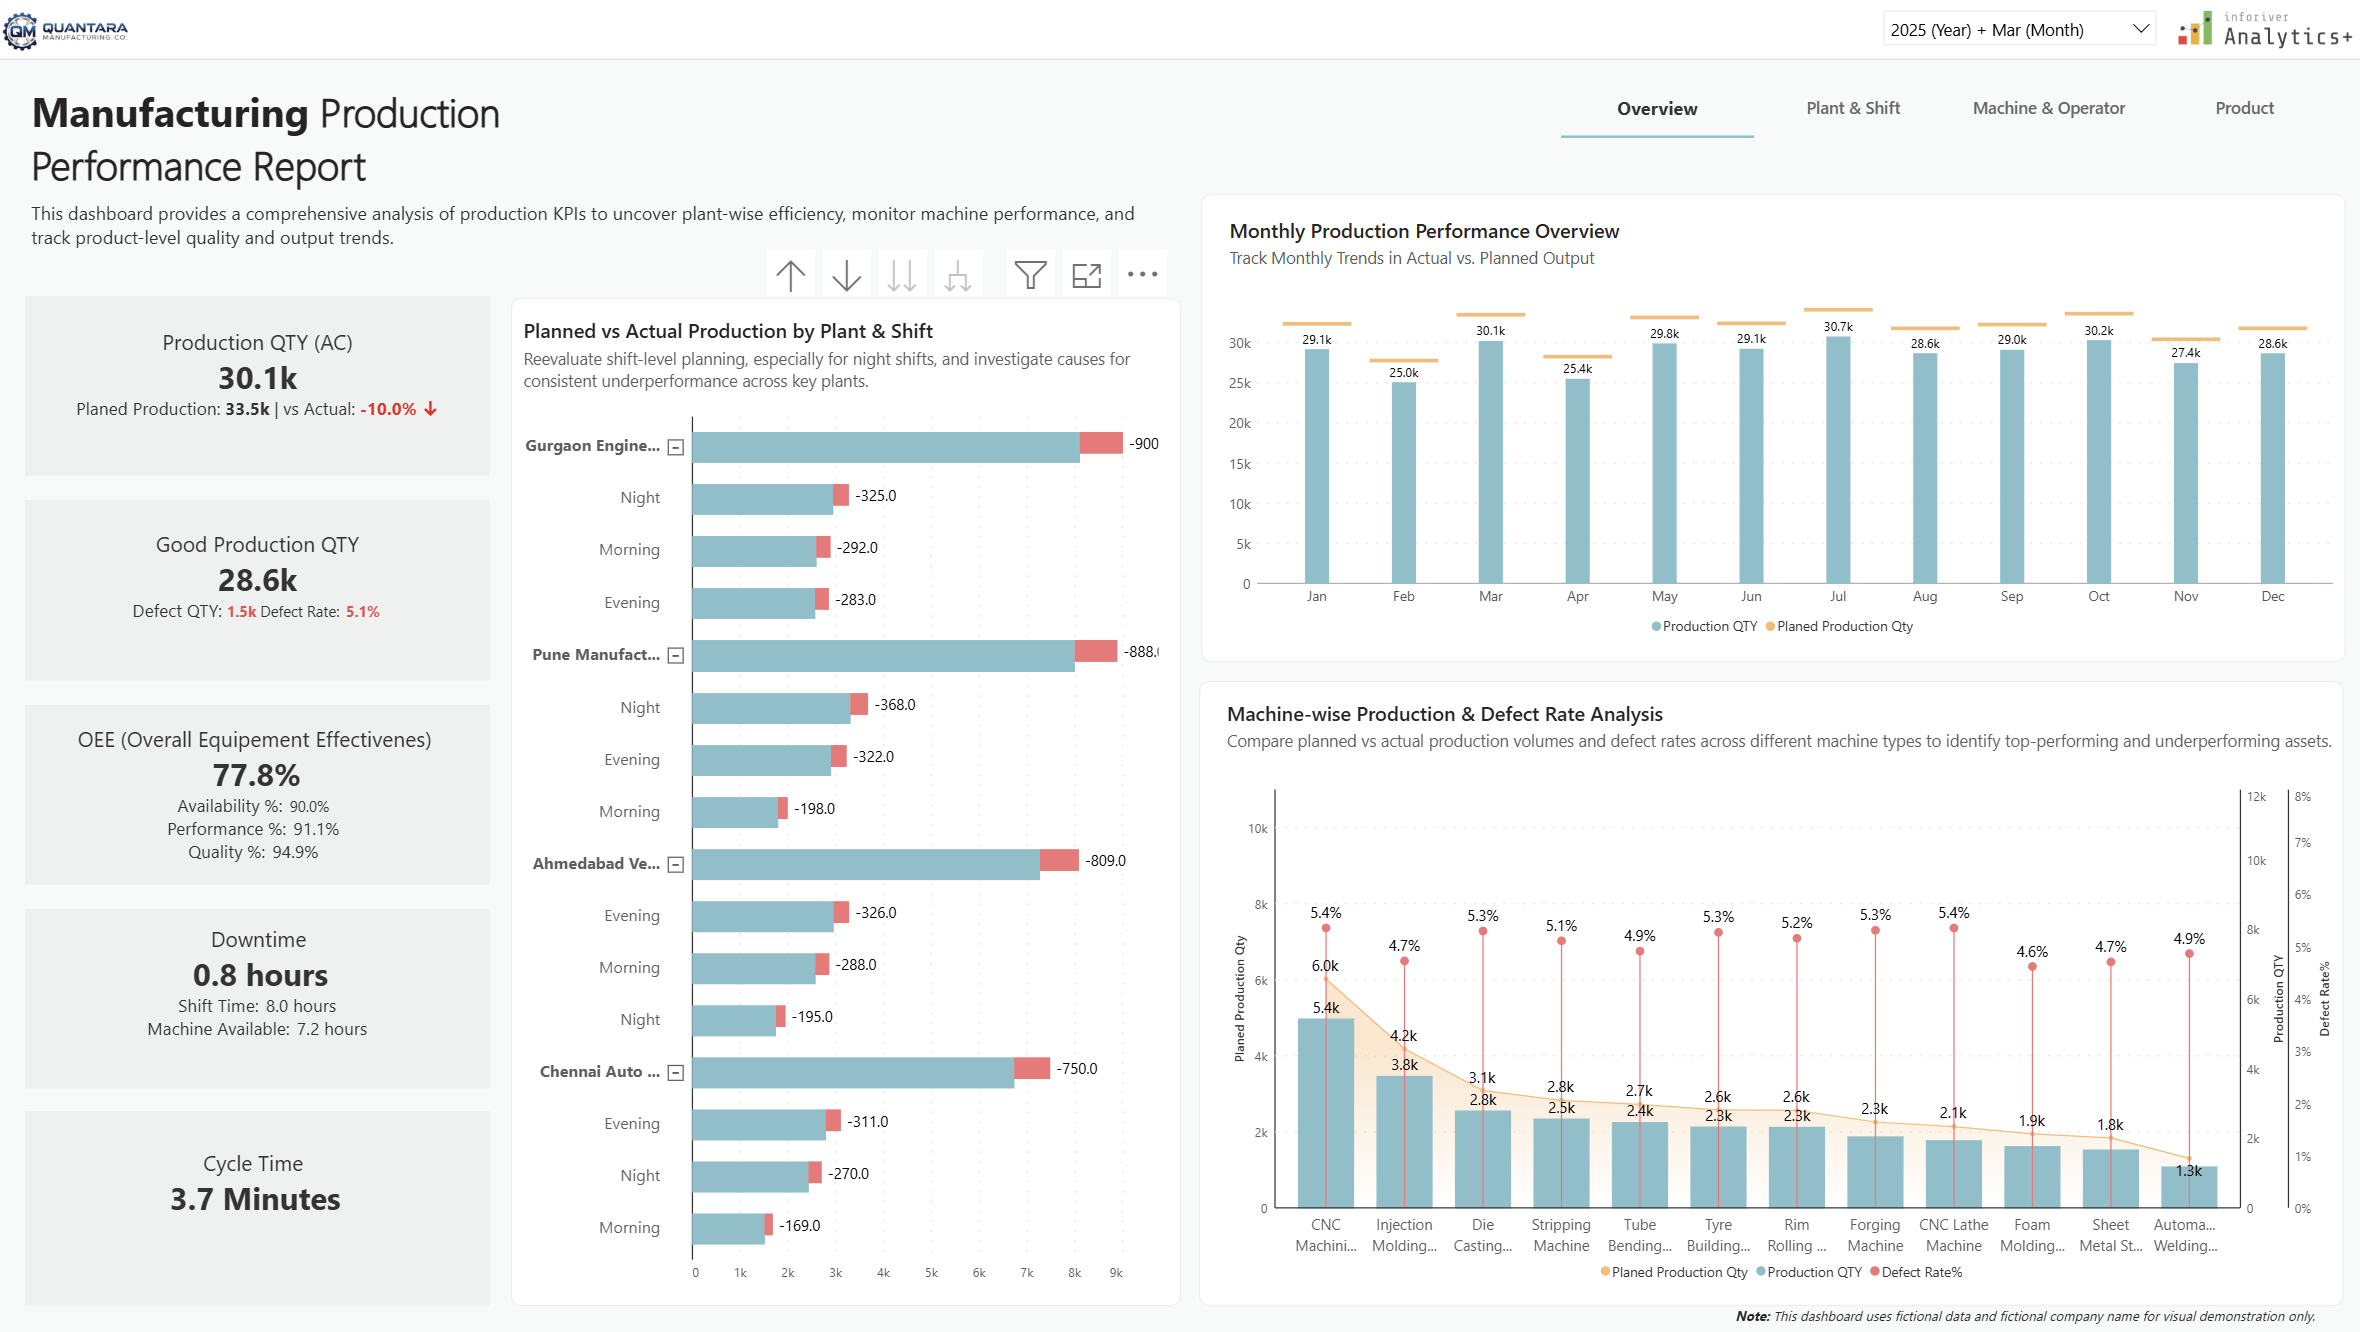
Struggling to hit production targets and manage waste? Explore this Automotive Production Performance Dashboard built in Power BI using Inforiver Analytics+, designed to deliver real-time insights into plant efficiency, machine utilization, and operator performance.
Track output, defects, and performance gaps across plants, shifts, and time periods to quickly identify inefficiencies. Analyze OEE (Overall Equipment Effectiveness) including availability, performance, and quality to optimize machines and processes. Compare cycle time and downtime to detect underperforming operations and take corrective action.
The report also enables product-level analysis of output, defects, costs, and cycle times, helping teams uncover improvement opportunities across the production line. Advanced visuals support clear comparison of actual vs planned output, trend analysis, and performance tracking.
Built on simulated automotive manufacturing data, this dashboard demonstrates how Inforiver Analytics+ in Power BI enables structured, interactive, and decision-ready production reporting.
Download the report and explore manufacturing performance analytics in Power BI.
to try advance features
[demo_download_modal title="Manufacturing Production Performance Dashboard" link="https://inforiver.com/wp-content/uploads/Automotive-Parts-Manufacturing-Report.zip"]
Inforiver helps enterprises consolidate planning, reporting & analytics on a single platform (Power BI). The no-code, self-service award-winning platform has been recognized as the industry’s best and is adopted by many Fortune 100 firms.
Inforiver is a product of Lumel, the #1 Power BI AppSource Partner. The firm serves over 3,000 customers worldwide through its portfolio of products offered under the brands Inforiver, EDITable, ValQ, and xViz.


