
Upcoming webinar on 'Inforiver Charts : The fastest way to deliver stories in Power BI', Aug 29th , Monday, 10.30 AM CST. Register Now
Upcoming webinar on 'Inforiver Charts : The fastest way to deliver stories in Power BI', Aug 29th , Monday, 10.30 AM CST. Register Now
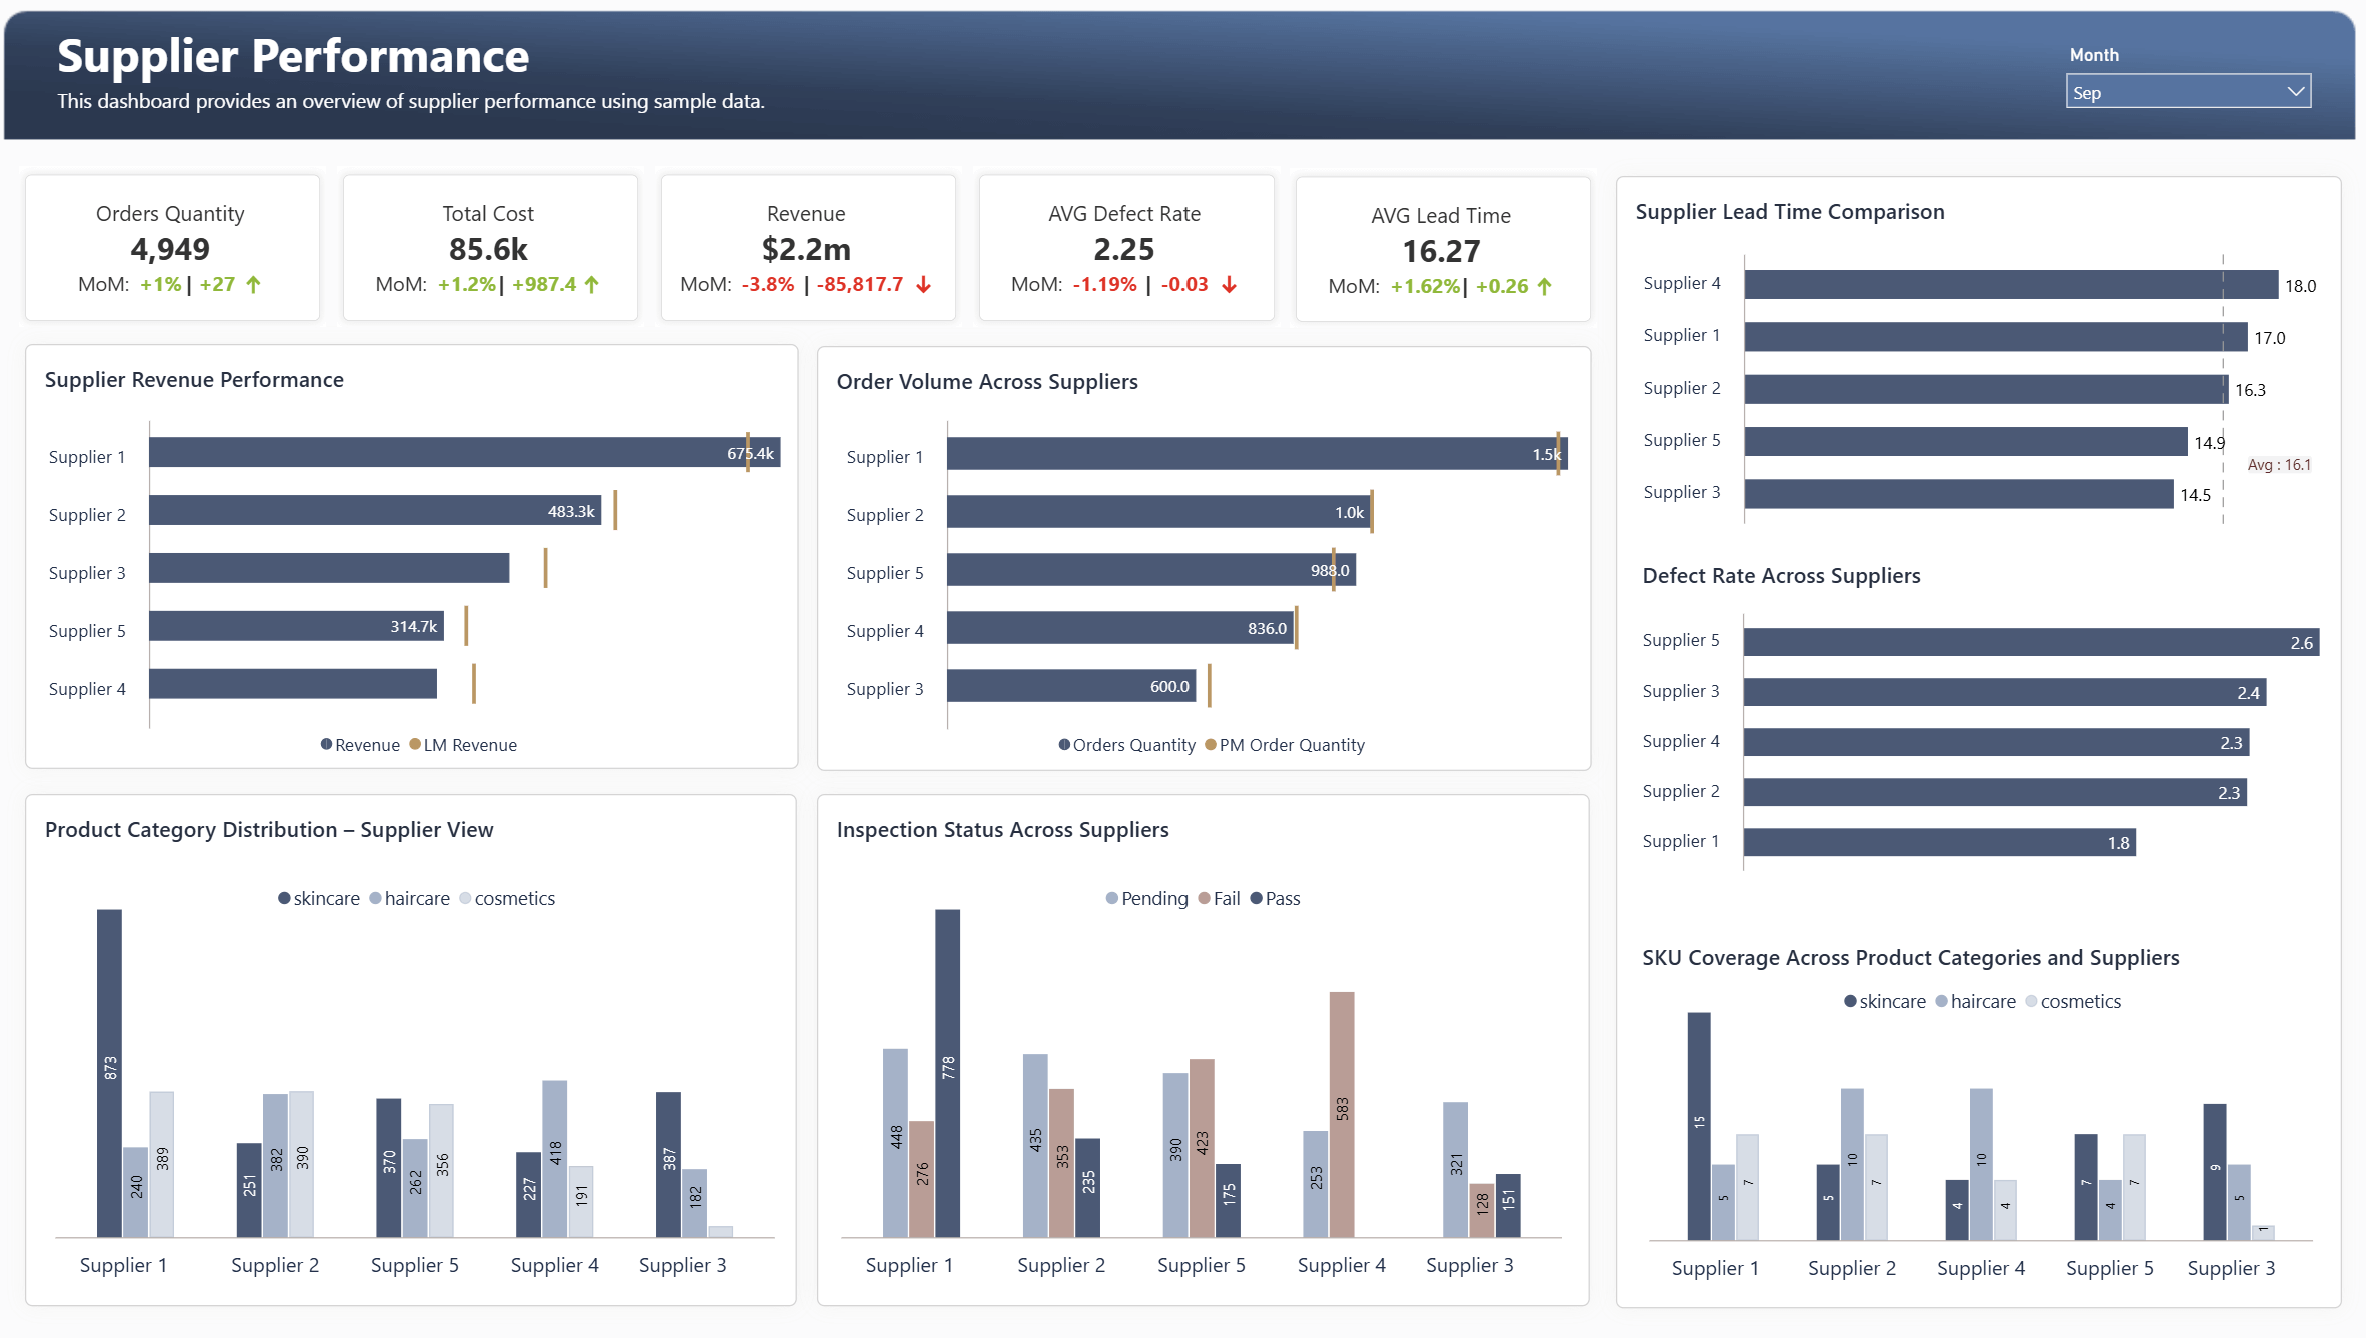
Track supplier performance like never before.
This simple, clean Supplier Performance Dashboard, built with Power BI and Inforiver Analytics+, gives you real-time insights to track cost, quality, and delivery metrics in a clean, easy-to-use visual format — perfect for supply chain teams and procurement leaders. It's the ultimate tool to quickly identify high-performing partners and address issues before they impact your business.
What you'll discover inside this dashboard:
Download the full case study now to see how easy it is to build clean and useful dashboards with Inforiver Analytics+.
to try advance features
[demo_download_modal title="Supplier Performance Dashboard | Built with Inforiver Analytics+ " link="https://inforiver.com/wp-content/uploads/Supplier-Performance-Dashboard.zip"]
Inforiver helps enterprises consolidate planning, reporting & analytics on a single platform (Power BI). The no-code, self-service award-winning platform has been recognized as the industry’s best and is adopted by many Fortune 100 firms.
Inforiver is a product of Lumel, the #1 Power BI AppSource Partner. The firm serves over 3,000 customers worldwide through its portfolio of products offered under the brands Inforiver, EDITable, ValQ, and xViz.


