
Upcoming webinar on 'Inforiver Charts : The fastest way to deliver stories in Power BI', Aug 29th , Monday, 10.30 AM CST. Register Now
Upcoming webinar on 'Inforiver Charts : The fastest way to deliver stories in Power BI', Aug 29th , Monday, 10.30 AM CST. Register Now
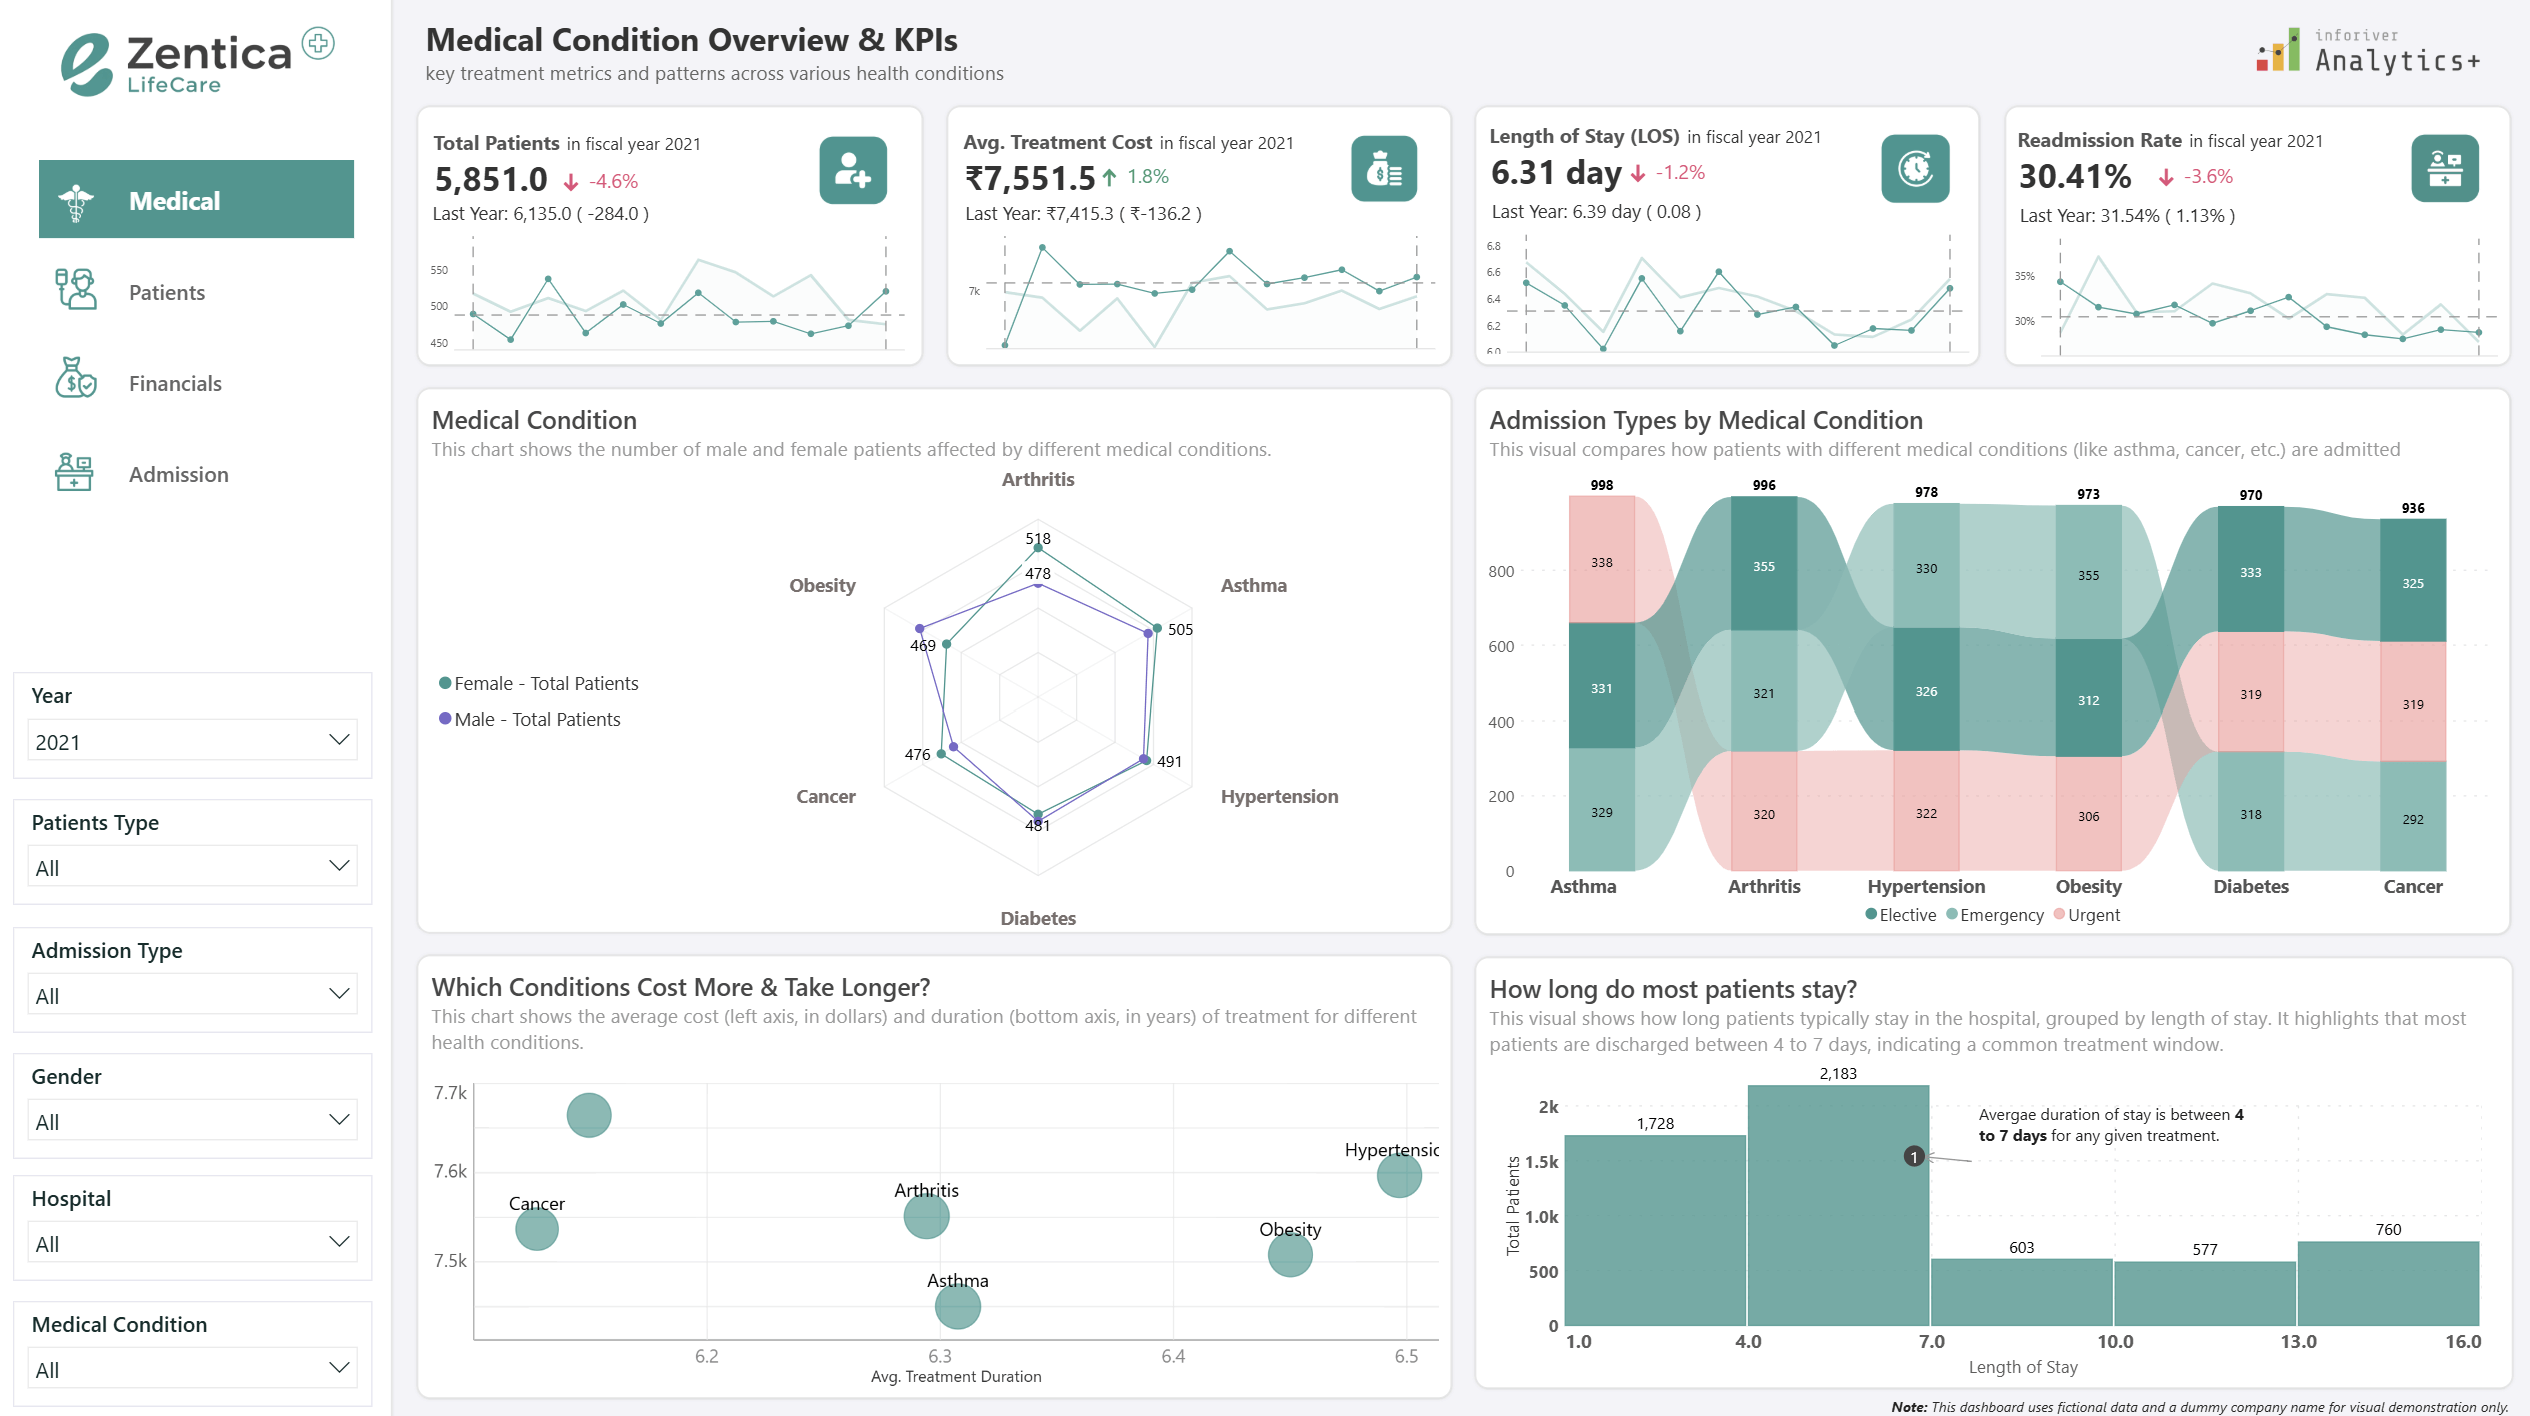
Transform how you make healthcare decisions with advanced analytics in Power BI using Inforiver Analytics+. Get fast, actionable insights into patient care, hospital operations, and financial performance, helping you move from raw data to smarter outcomes.
Explore key healthcare metrics including patient volumes, treatment costs, length of stay, readmissions, and monthly trends. Understand patient demographics such as age, gender, admission types, and top medical conditions to identify shifts in care demand.
Track physician and department performance alongside revenue, insurance coverage, and recovery trends to assess overall hospital performance. With detailed patient-level data and interactive exploration, users can analyze patterns across treatments, outcomes, and operational efficiency.
Advanced visuals including distribution charts, flow analysis, and trend comparisons make it easy to identify changes and compare performance over time.
Built on simulated data to showcase Inforiver Analytics+ storytelling in Power BI, this report delivers clear, structured, and decision-ready healthcare insights.
Download the report and explore smarter healthcare analytics.
to try advance features
[demo_download_modal title="Healthcare Intellience Dashboard in Power BI — Patient Care, Performance & Revenue Insights" link="https://inforiver.com/wp-content/uploads/Healthcare-Intelligence-Insights-from-Advanced-Analytics.zip"]
Inforiver helps enterprises consolidate planning, reporting & analytics on a single platform (Power BI). The no-code, self-service award-winning platform has been recognized as the industry’s best and is adopted by many Fortune 100 firms.
Inforiver is a product of Lumel, the #1 Power BI AppSource Partner. The firm serves over 3,000 customers worldwide through its portfolio of products offered under the brands Inforiver, EDITable, ValQ, and xViz.


