Inforiver

Upcoming webinar on 'Inforiver Charts : The fastest way to deliver stories in Power BI', Aug 29th , Monday, 10.30 AM CST.    Register Now
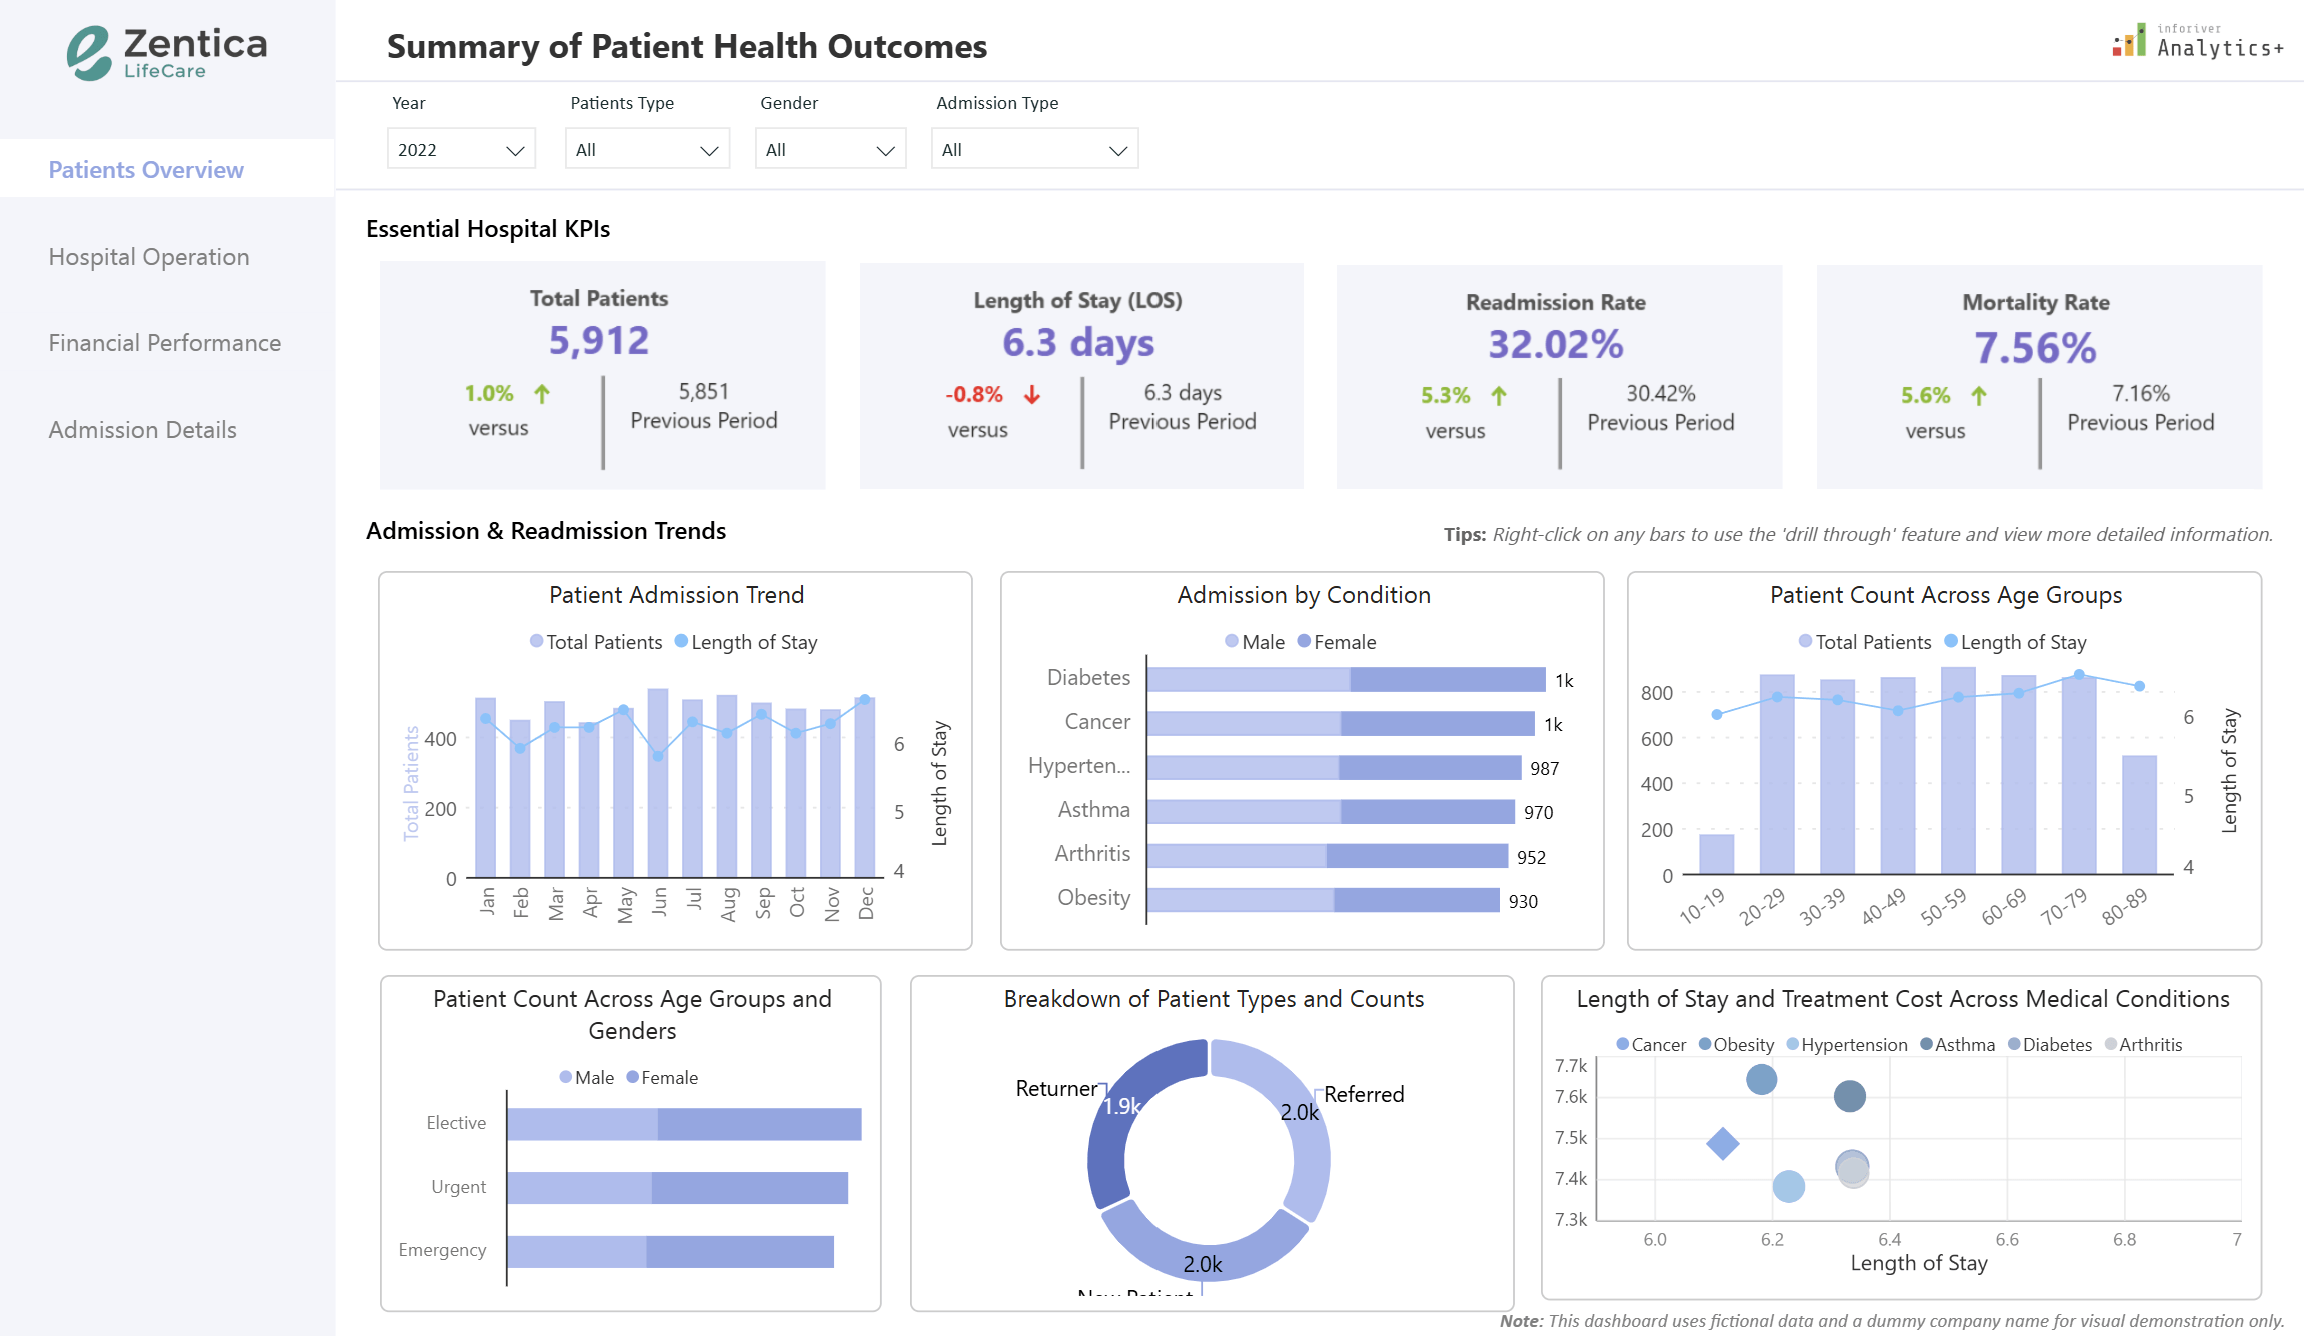
Healthcare Analytics Dashboard with Power BI & Inforiver 

Download PBIX File

Transform healthcare analytics with this powerful dashboard built in Power BI and enhanced with Inforiver Analytics+. This case study reveals how to get fast, actionable insights into patient care, hospital operations, and financial performance. Designed for clinical teams, administrators, and executives, this solution consolidates key healthcare KPIs for smarter decision-making. 

Designed for clarity and decision-making, the dashboard consolidates key healthcare KPIs into an intuitive visual experience that helps clinical teams, administrators, and executives stay informed and aligned.  

Key Insights & Analytics You'll Discover: 

  • Patient Flow & Clinical Performance Analytics: Analyze patient volumes, admissions, discharges, and length of stay (LOS). Track readmission rates and recovery trends by diagnosis, age, and treatment type to improve patient outcomes. 
  • Hospital Operations & Efficiency Overview: Track bed utilization, physician efficiency, and treatment success rates to identify operational strengths and areas for improvement. 
  • Healthcare Financial Performance Snapshot: Monitor average treatment costs, insurance coverage, claim status, and revenue trends across departments to assess the hospital's financial health. 

Whether managing a single department or an entire hospital network, this dashboard provides a reliable view into performance gaps and opportunities. Interactive visuals and smart filters allow users to explore data by condition, gender, treatment plan, and more without needing advanced tools or coding.  

About the Data 

This dashboard structured around interconnected tables, the dataset captures mimic of a real-world healthcare dimensions patient details, admission types, provider info, diagnoses, medicines, and outcomes. Each record supports a broader view of hospital performance and care quality.    

Download the full case study and explore how smarter analytics can lead to better outcomes.


iframe preview
View interactive content

Healthcare Analytics Dashboard with Power BI & Inforiver 

Transform healthcare analytics with this powerful dashboard built in Power BI and enhanced with Inforiver Analytics+. This case study reveals how to get fast, actionable insights into patient care, hospital operations, and financial performance. Designed for clinical teams, administrators, and executives, this solution consolidates key healthcare KPIs for smarter decision-making.  Designed for clarity and decision-making, the dashboard consolidates key healthcare KPIs into an intuitive visual experience that helps clinical teams, administrators, and executives stay informed and aligned.   Key Insights & Analytics You'll Discover: 
  • Patient Flow & Clinical Performance Analytics: Analyze patient volumes, admissions, discharges, and length of stay (LOS). Track readmission rates and recovery trends by diagnosis, age, and treatment type to improve patient outcomes. 
  • Hospital Operations & Efficiency Overview: Track bed utilization, physician efficiency, and treatment success rates to identify operational strengths and areas for improvement. 
  • Healthcare Financial Performance Snapshot: Monitor average treatment costs, insurance coverage, claim status, and revenue trends across departments to assess the hospital's financial health. 
Whether managing a single department or an entire hospital network, this dashboard provides a reliable view into performance gaps and opportunities. Interactive visuals and smart filters allow users to explore data by condition, gender, treatment plan, and more without needing advanced tools or coding.   About the Data  This dashboard structured around interconnected tables, the dataset captures mimic of a real-world healthcare dimensions patient details, admission types, provider info, diagnoses, medicines, and outcomes. Each record supports a broader view of hospital performance and care quality.     Download the full case study and explore how smarter analytics can lead to better outcomes.
iframe preview
View interactive content

Download Report for Free

to try advance features

[demo_download_modal title="Healthcare Analytics Dashboard with Power BI & Inforiver " link="https://inforiver.com/wp-content/uploads/Healthcare-Performance-Unlocked-with-Inforiver-Analytics.zip"]

Related Demos

Waterfall Chart

Track step-by-step value changes for clear profit, revenue, or cost analysis. Supports totals, breakdowns, and flexible formatting.

Histogram Chart

Show how numerical values are distributed by grouping them into bins. Useful for spotting patterns, trends, and frequency shifts.

Radar / Polar Chart

Visualize multi-dimensional data in a circular view to compare categories and reveal clear performance patterns.

Marimekko chart

Compare proportions and totals across two dimensions with variable column widths for clear market and category insights.

Gantt Chart

Plan and track projects with clear timelines, milestones, and dependencies. Includes resource views and flexible formatting options.

Multi Axis Chart

Compare multiple measures on separate axes for clear insight. Supports up to five Y-axes with flexible layout and formatting.

Download Healthcare Analytics Dashboard with Power BI & Inforiver 

By clicking on Download PBIX File you agree to our terms and conditions and you acknowledge having read our EULAThe PBIX file is available only for limited duration

Get Inforiver brochure

Maximize your business potential with Inforiver's paginated reporting, data entry, planning & budgeting capabilities
Download now
Inforiver

Inforiver helps enterprises consolidate planning, reporting & analytics on a single platform (Power BI). The no-code, self-service award-winning platform has been recognized as the industry’s best and is adopted by many Fortune 100 firms.

Inforiver is a product of Lumel, the #1 Power BI AppSource Partner. The firm serves over 3,000 customers worldwide through its portfolio of products offered under the brands Inforiver, EDITable, ValQ, and xViz.

homemagnifiercross linkedin facebook pinterest youtube rss twitter instagram facebook-blank rss-blank linkedin-blank pinterest youtube twitter instagram