Upcoming webinar on 'Inforiver Charts : The fastest way to deliver stories in Power BI', Aug 29th , Monday, 10.30 AM CST. Register Now
Upcoming webinar on 'Inforiver Charts : The fastest way to deliver stories in Power BI', Aug 29th , Monday, 10.30 AM CST. Register Now
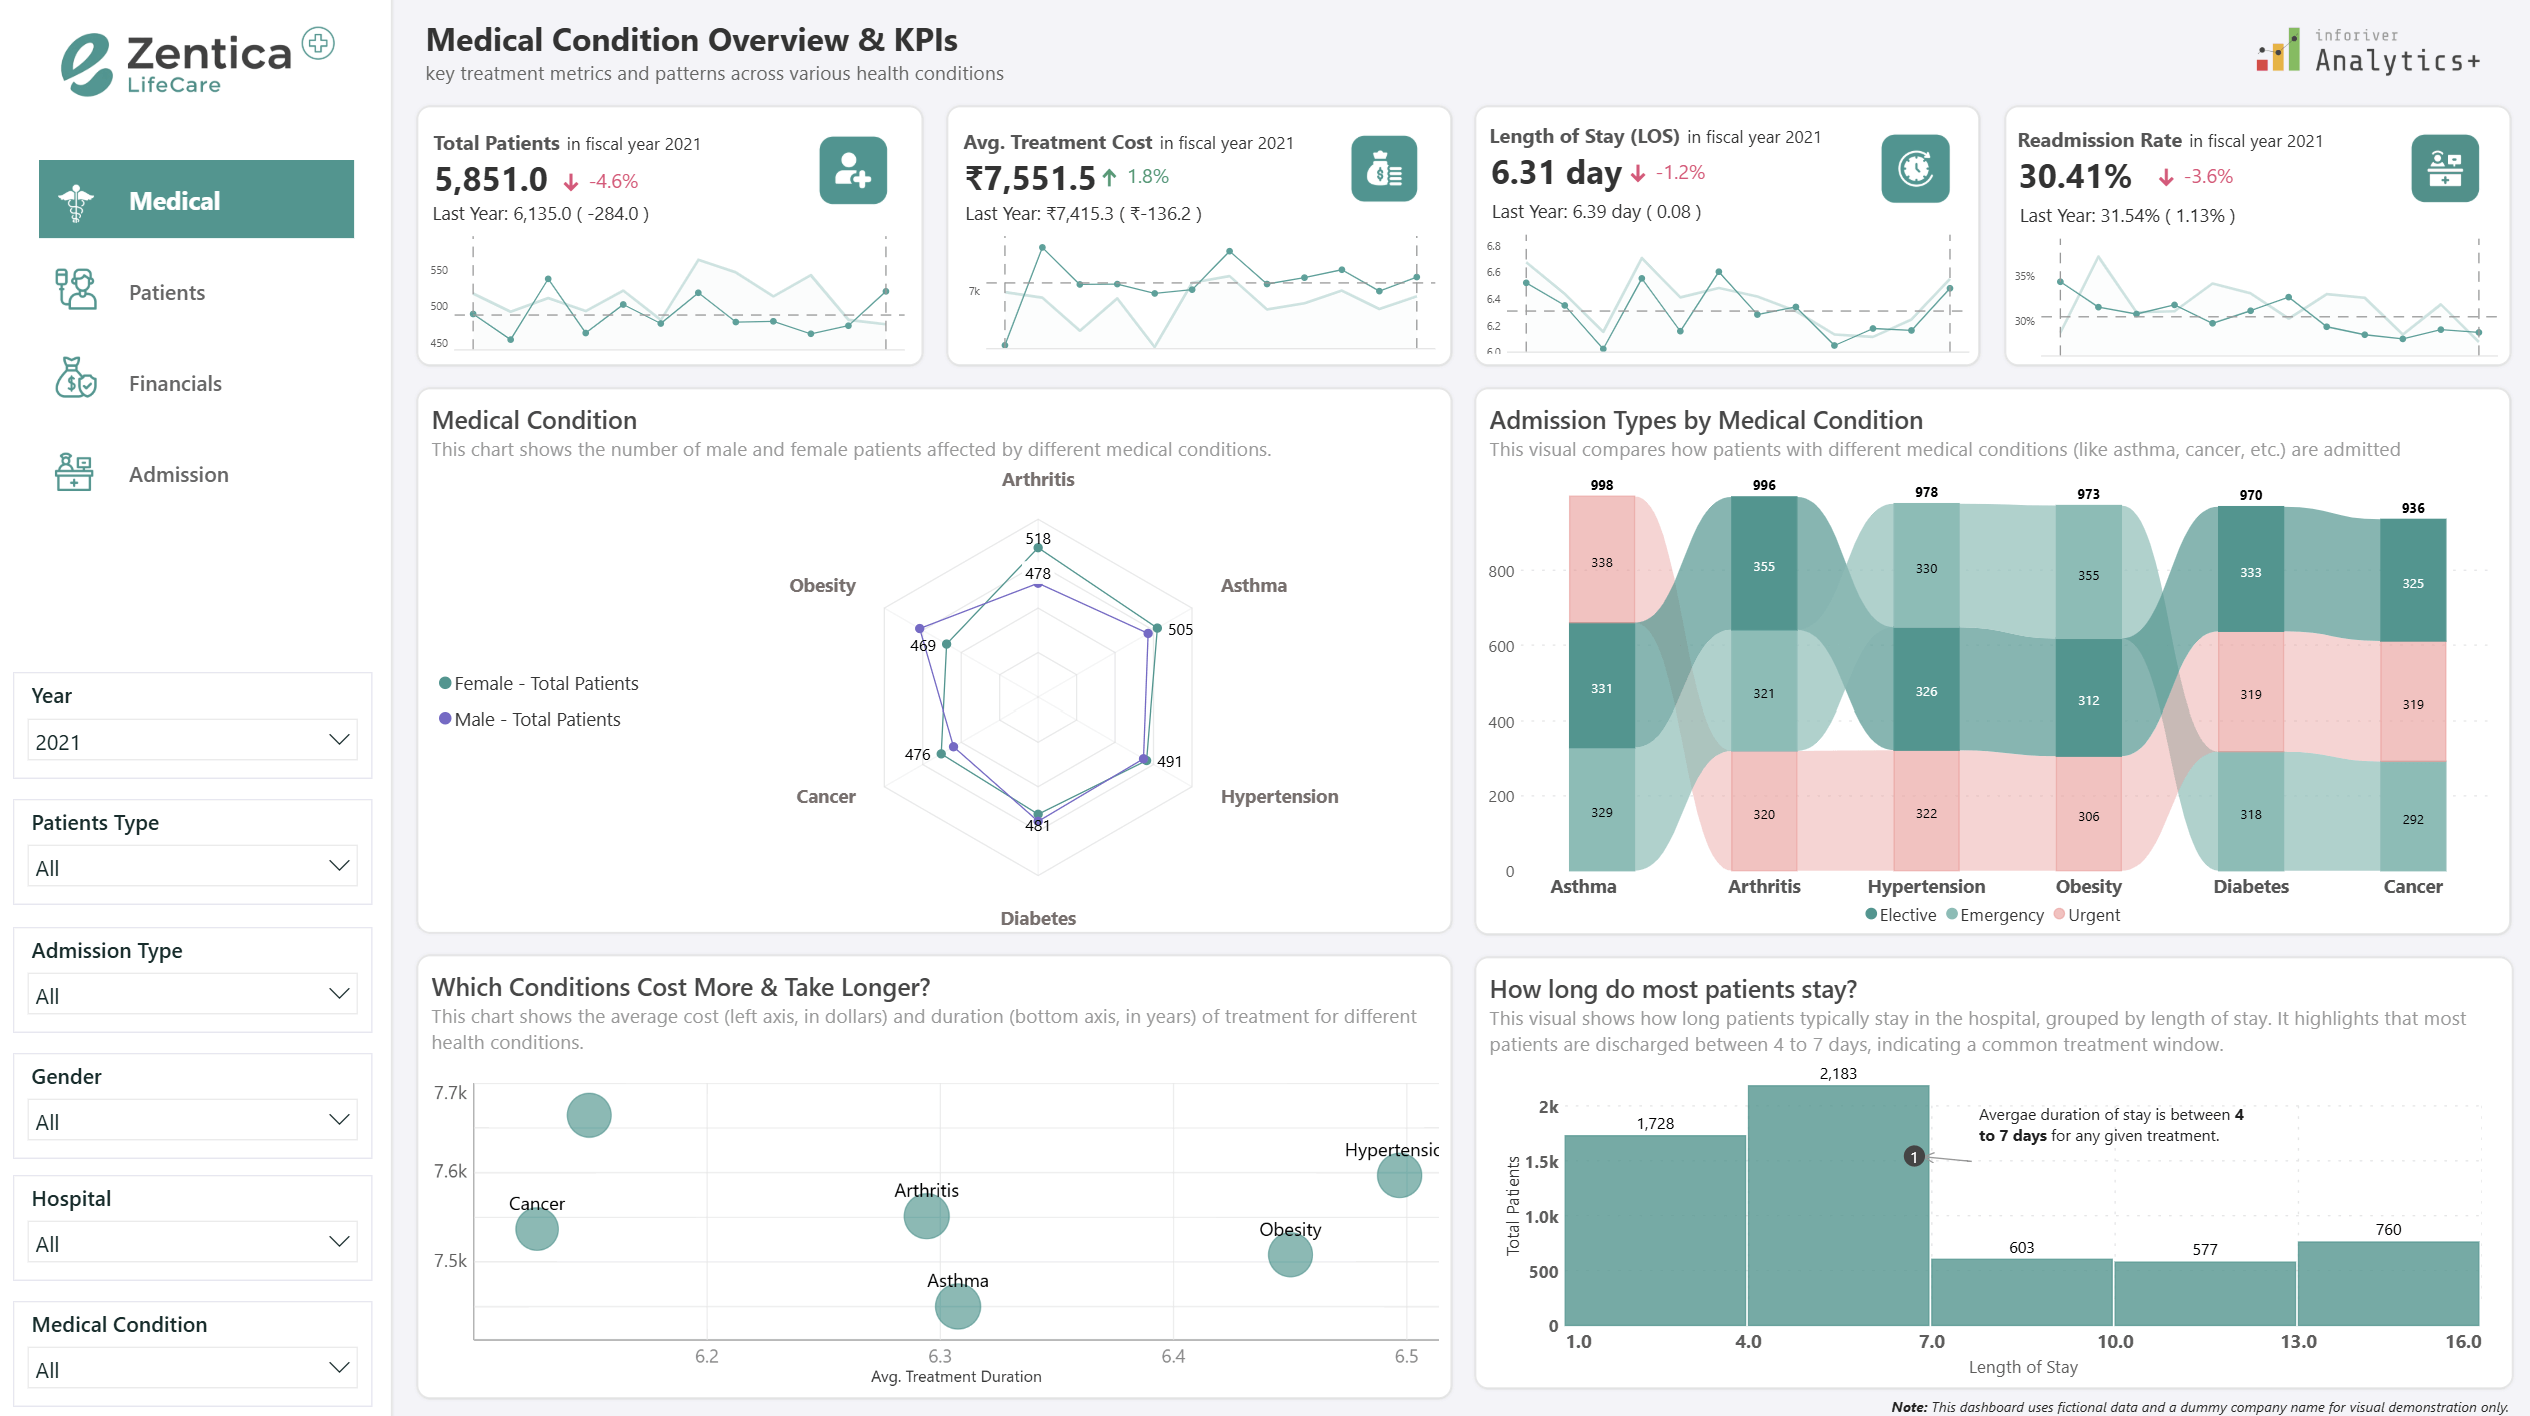
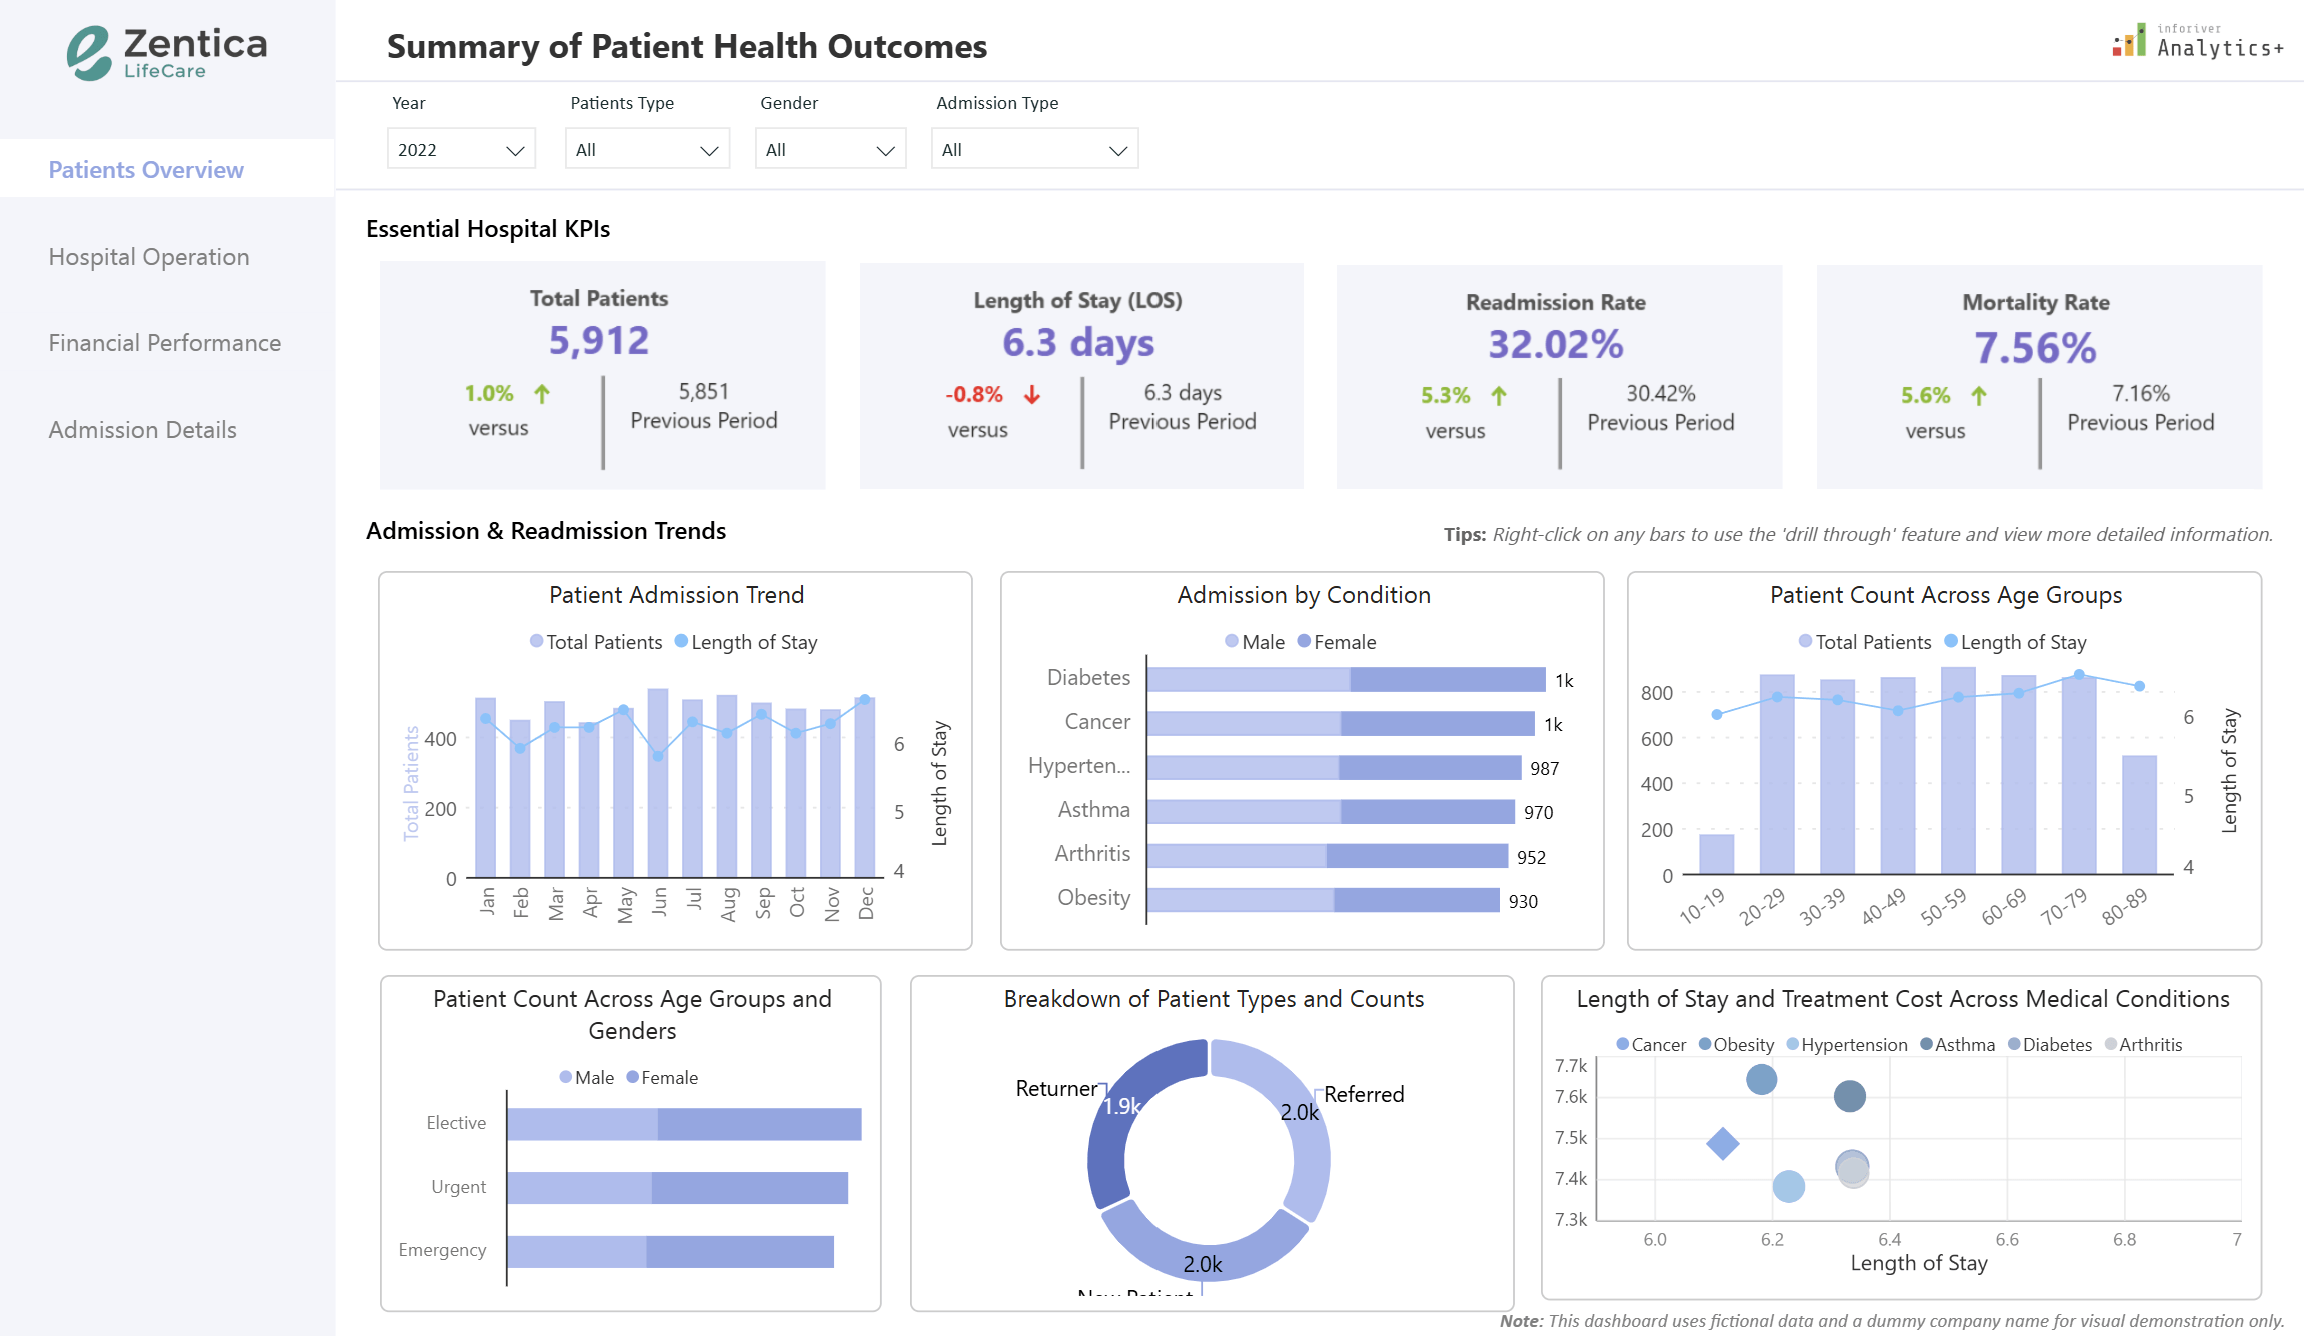
Transform healthcare analytics with this powerful dashboard built in Power BI and enhanced with Inforiver Analytics+. This case study reveals how to get fast, actionable insights into patient care, hospital operations, and financial performance. Designed for clinical teams, administrators, and executives, this solution consolidates key healthcare KPIs for smarter decision-making.
Designed for clarity and decision-making, the dashboard consolidates key healthcare KPIs into an intuitive visual experience that helps clinical teams, administrators, and executives stay informed and aligned.
Key Insights & Analytics You'll Discover:
Whether managing a single department or an entire hospital network, this dashboard provides a reliable view into performance gaps and opportunities. Interactive visuals and smart filters allow users to explore data by condition, gender, treatment plan, and more without needing advanced tools or coding.
About the Data
This dashboard structured around interconnected tables, the dataset captures mimic of a real-world healthcare dimensions patient details, admission types, provider info, diagnoses, medicines, and outcomes. Each record supports a broader view of hospital performance and care quality.
Download the full case study and explore how smarter analytics can lead to better outcomes.
to try advance features
[demo_download_modal title="Healthcare Analytics Dashboard with Power BI & Inforiver " link="https://inforiver.com/wp-content/uploads/Healthcare-Performance-Unlocked-with-Inforiver-Analytics.zip"]
Inforiver helps enterprises consolidate planning, reporting & analytics on a single platform (Power BI). The no-code, self-service award-winning platform has been recognized as the industry’s best and is adopted by many Fortune 100 firms.
Inforiver is a product of Lumel, the #1 Power BI AppSource Partner. The firm serves over 3,000 customers worldwide through its portfolio of products offered under the brands Inforiver, EDITable, ValQ, and xViz.