Upcoming webinar on 'Inforiver Charts : The fastest way to deliver stories in Power BI', Aug 29th , Monday, 10.30 AM CST. Register Now
Upcoming webinar on 'Inforiver Charts : The fastest way to deliver stories in Power BI', Aug 29th , Monday, 10.30 AM CST. Register Now
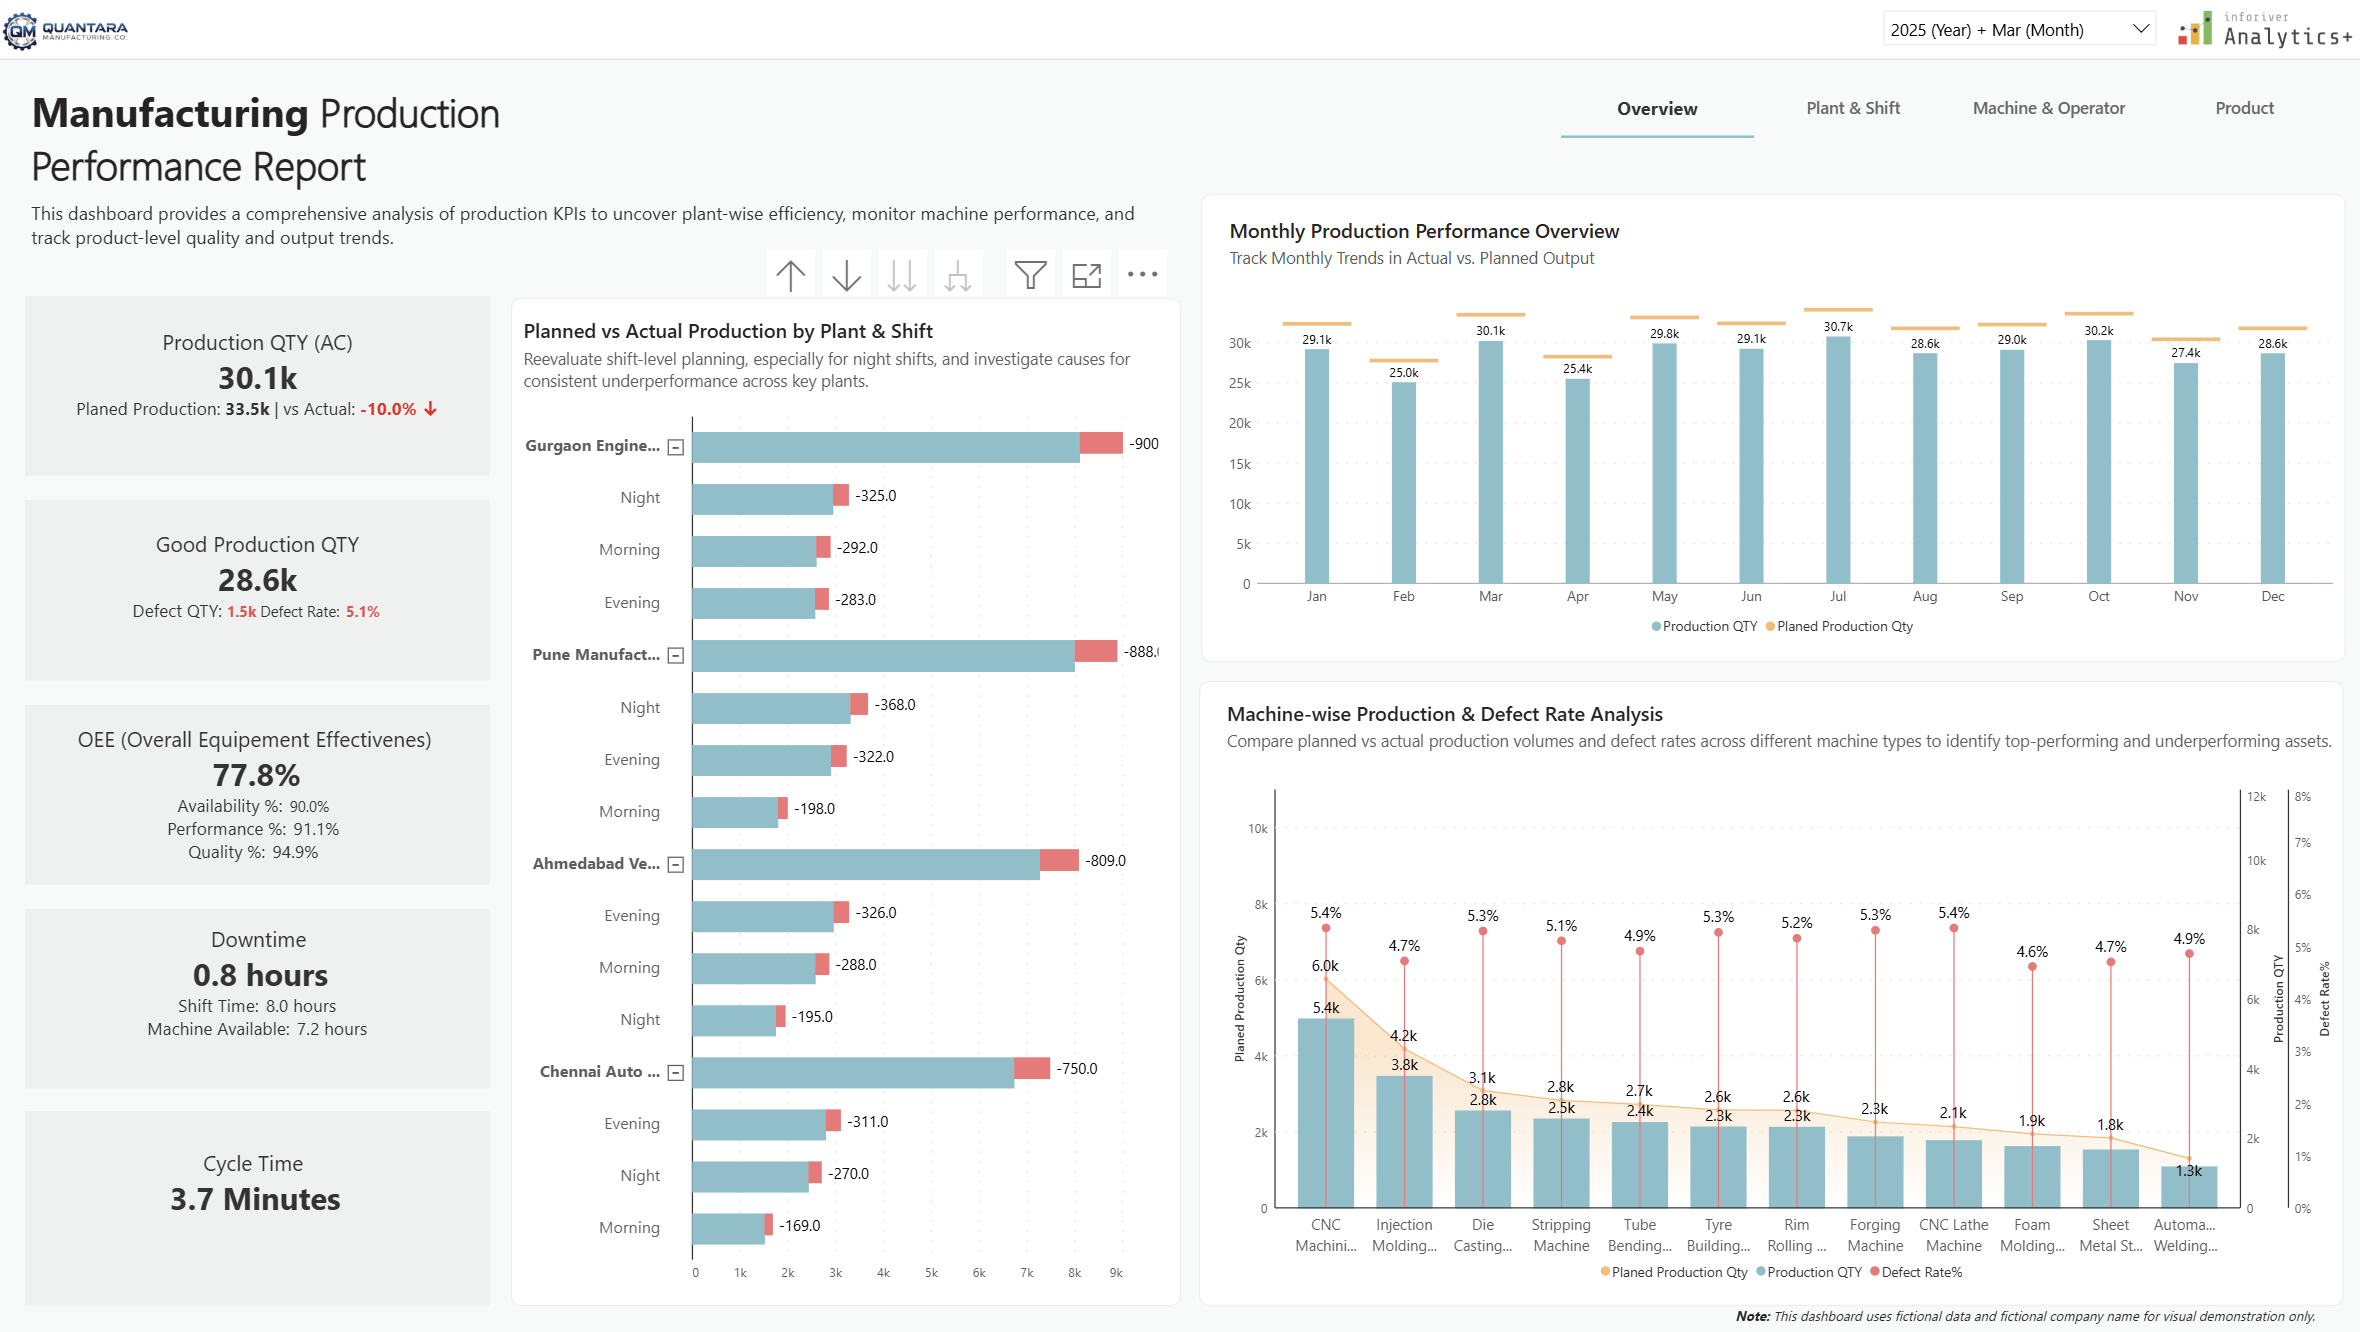
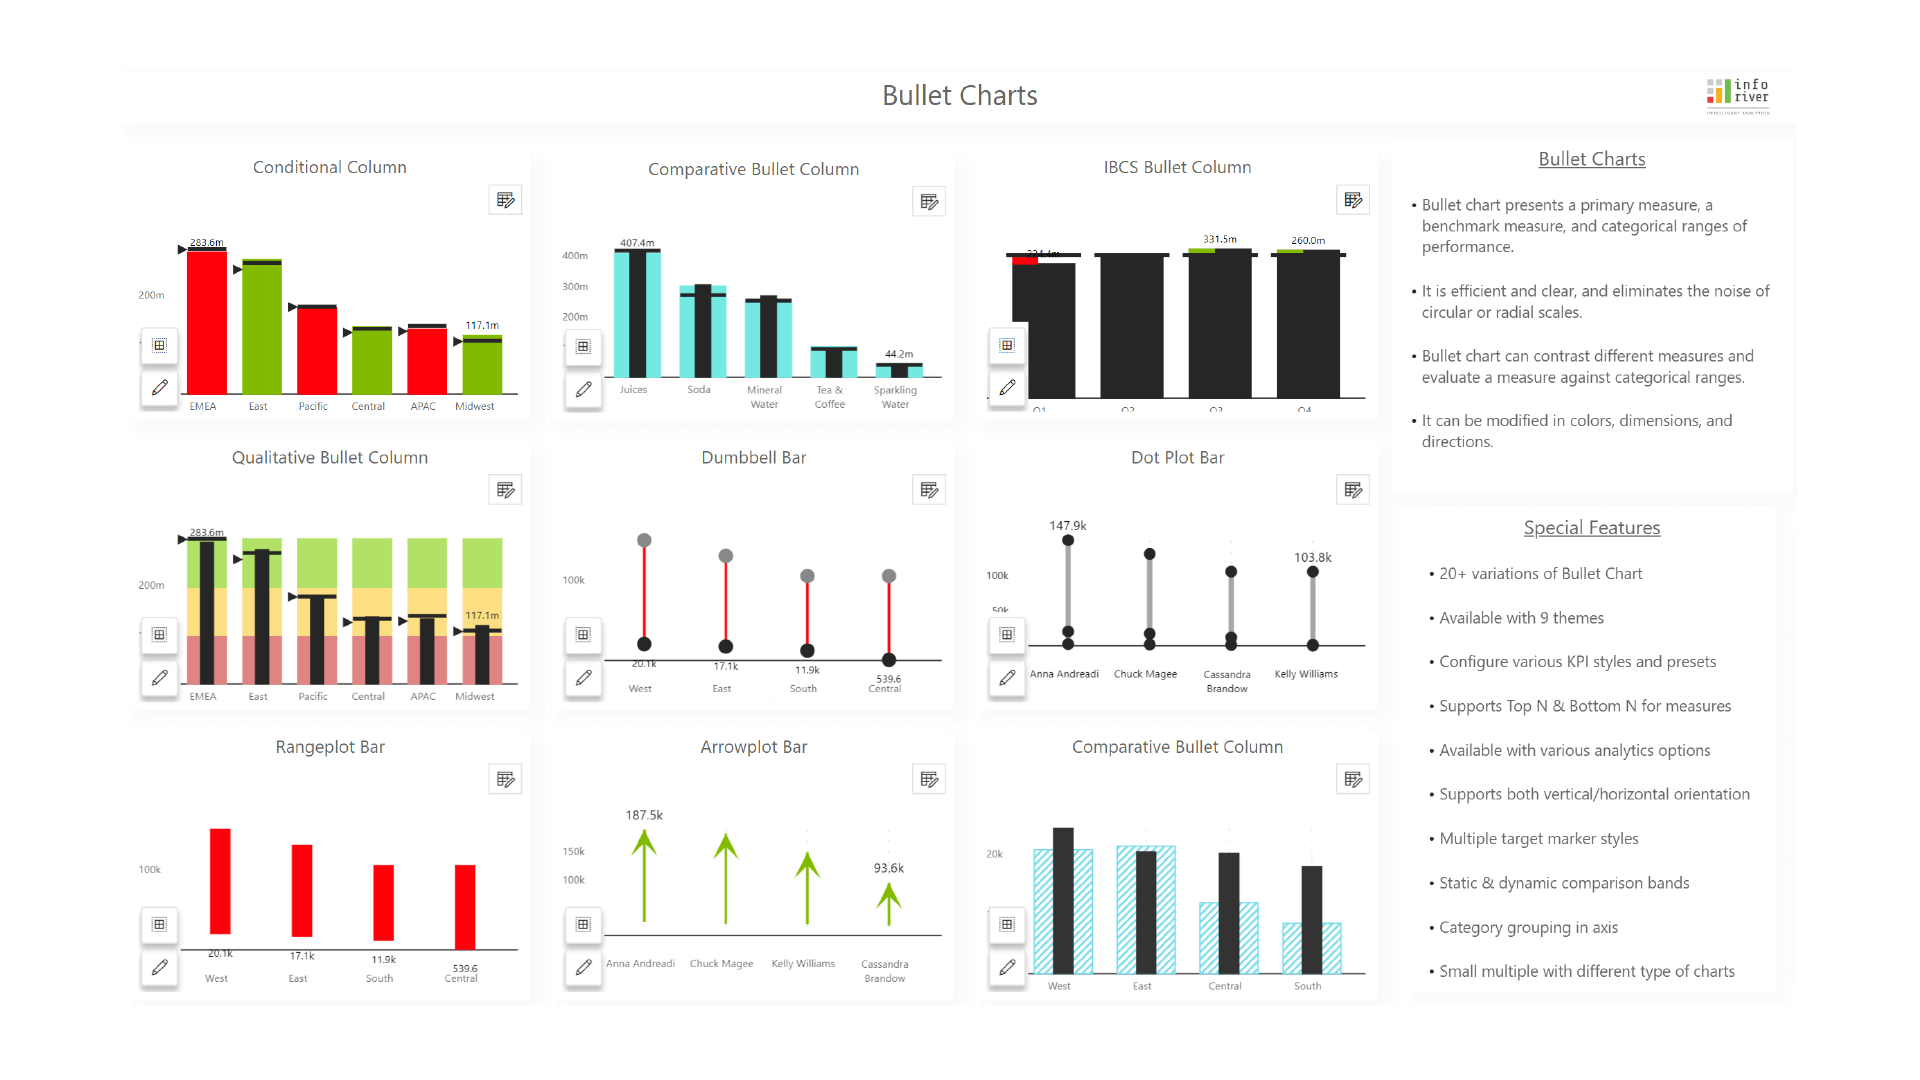
Bullet charts offer a compact, clear way to display data, facilitating quick comprehension of progress against set targets. Their efficient design aids in identifying performance gaps, making them invaluable for KPI tracking, goal setting, and business performance analysis. Harness Inforiver’s bullet charts for insightful, data-driven decision-making and impactful business reporting.
to try advance features
[demo_download_modal title="Bullet charts in Power BI" link="https://inforiver.com/wp-content/uploads/inforiver-bullet-chart-demo.zip"]
Inforiver helps enterprises consolidate planning, reporting & analytics on a single platform (Power BI). The no-code, self-service award-winning platform has been recognized as the industry’s best and is adopted by many Fortune 100 firms.
Inforiver is a product of Lumel, the #1 Power BI AppSource Partner. The firm serves over 3,000 customers worldwide through its portfolio of products offered under the brands Inforiver, EDITable, ValQ, and xViz.