Upcoming webinar on 'Inforiver Charts : The fastest way to deliver stories in Power BI', Aug 29th , Monday, 10.30 AM CST. Register Now
Upcoming webinar on 'Inforiver Charts : The fastest way to deliver stories in Power BI', Aug 29th , Monday, 10.30 AM CST. Register Now
In the preceding blog, we looked at why sales meetings in many organizations are inefficient.
Now let us explore how the combination of Inforiver & Power BI can transform your sales meetings using a sample scenario.
The sales manager at ACME Corp meets with the sales team every Monday to discuss and capture the latest projections. The manager goes through the following steps during the weekly meeting.
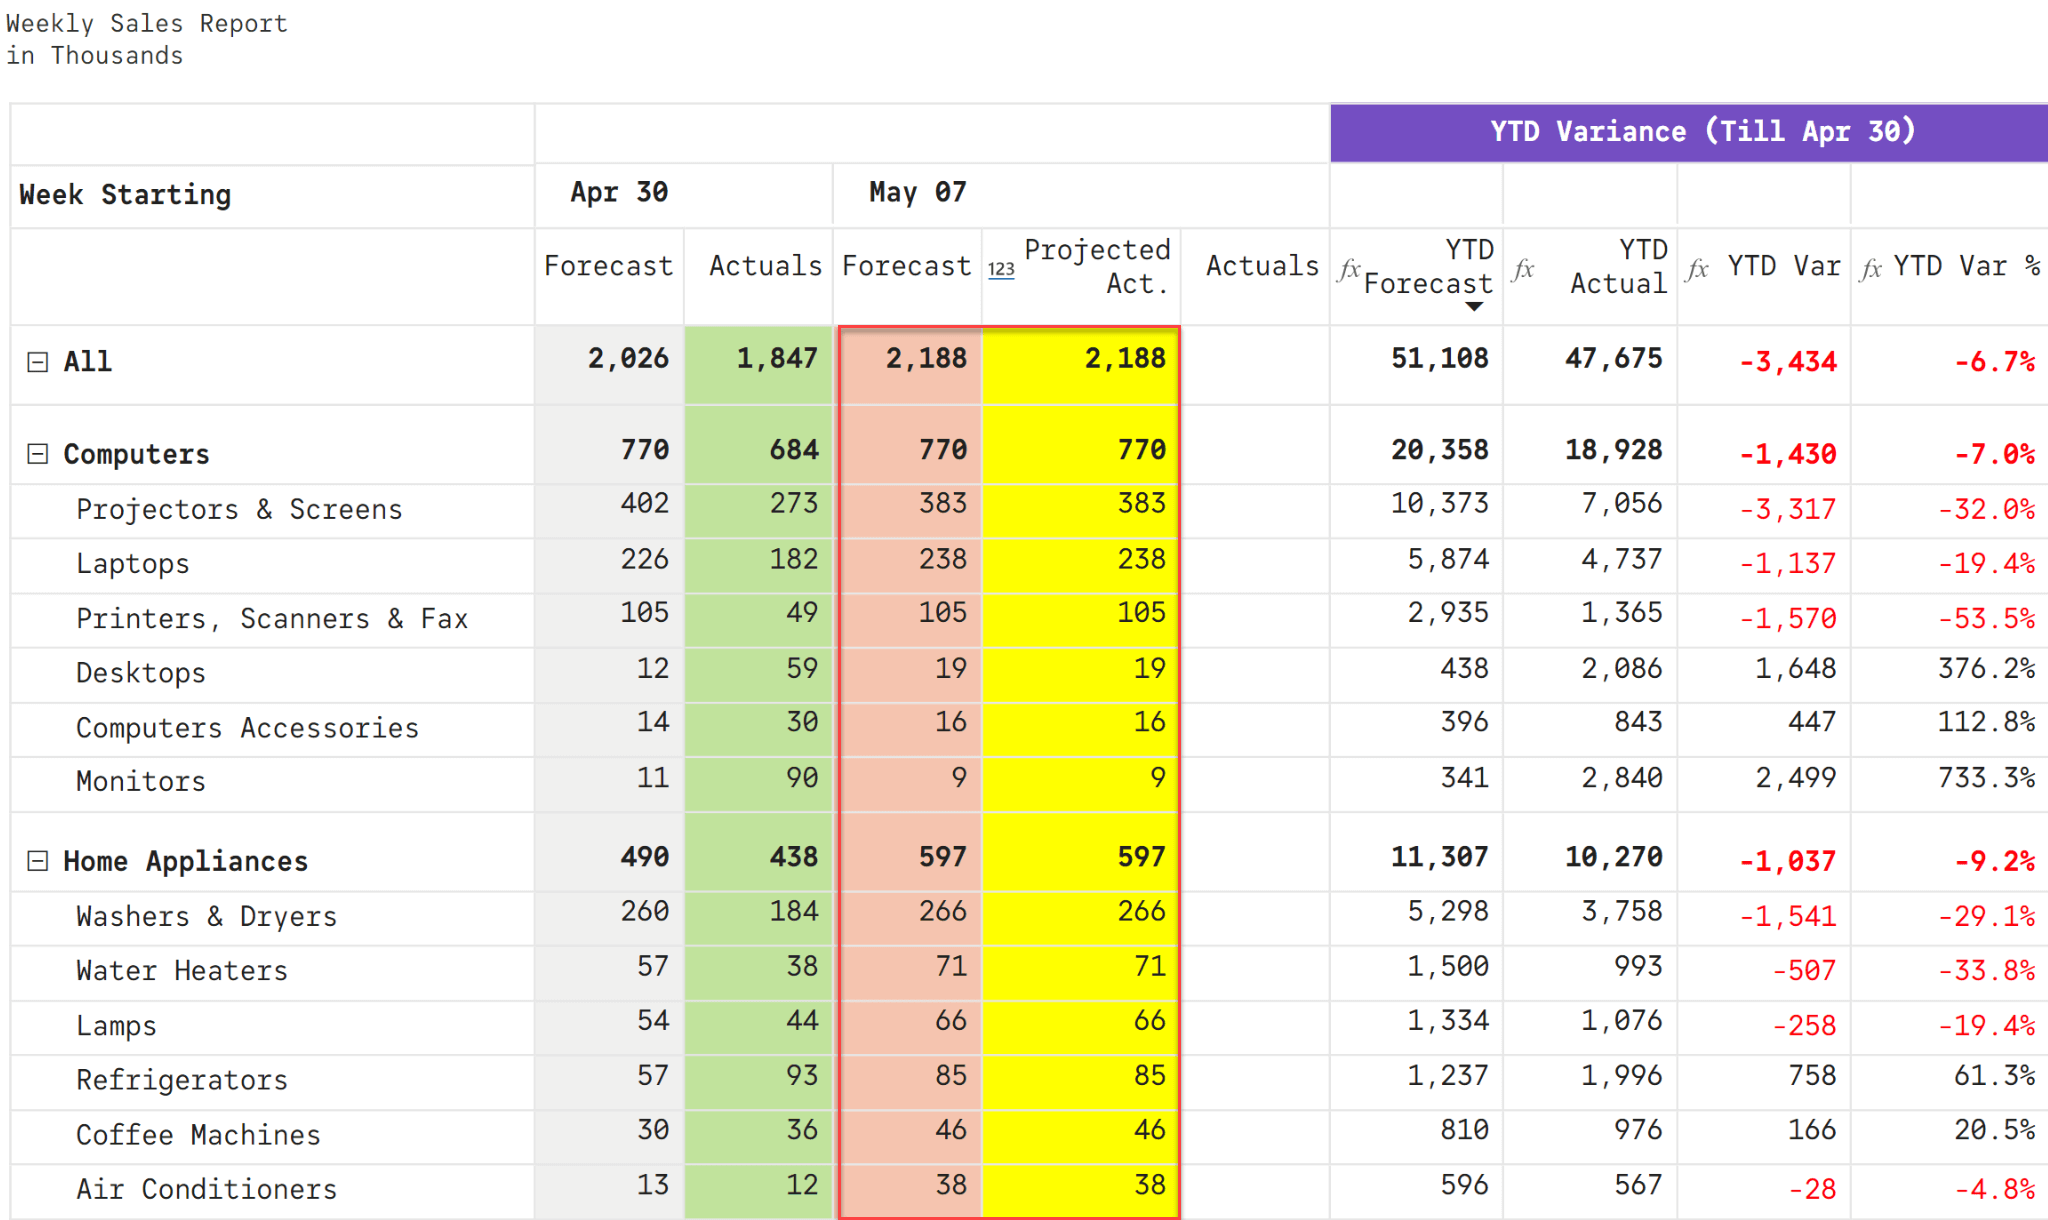
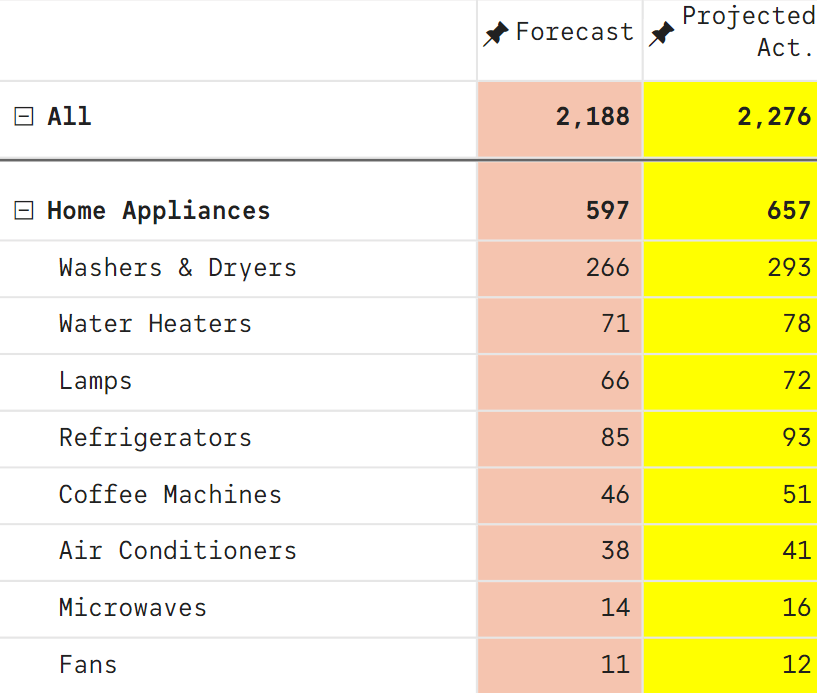
The manager first pulls out the weekly sales performance report (built using Inforiver). The report captures Forecast and Actuals by product category hierarchy for each week. All values are scaled to thousands.
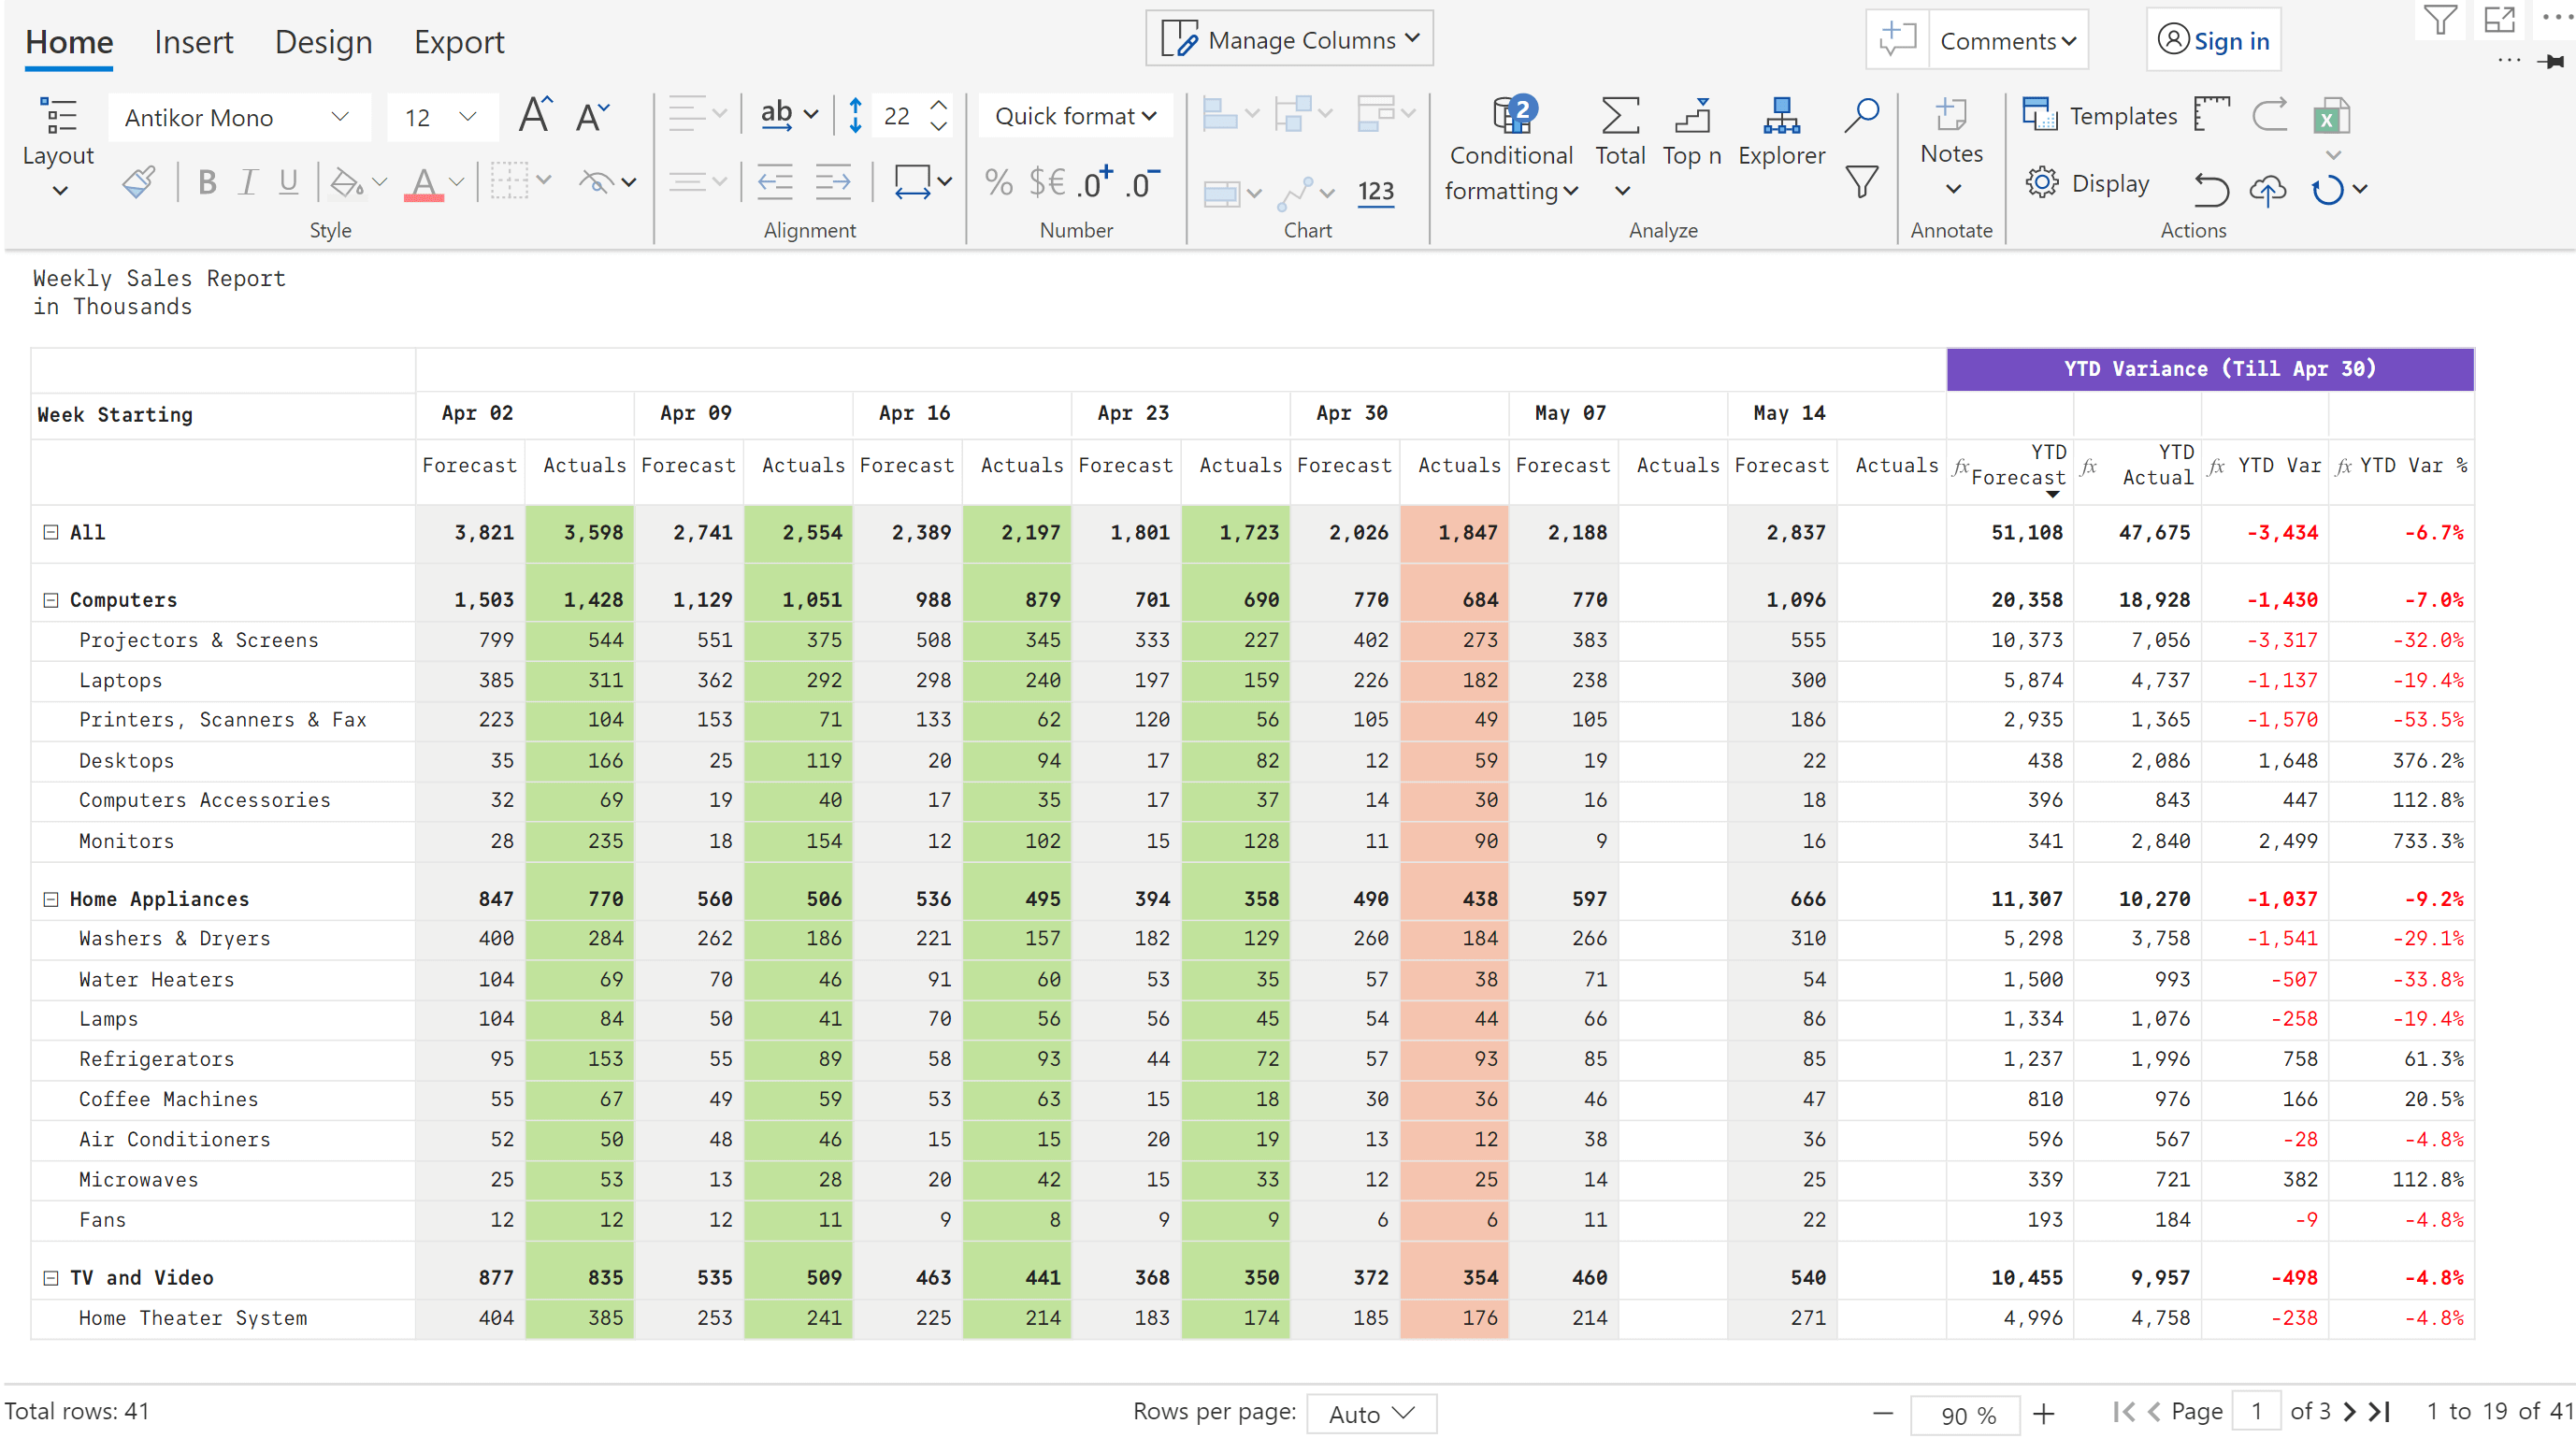
The Actuals for the preceding week (Apr 30) is highlighted in a distinct color (orange?). Forecasts for the current & upcoming weeks (May 07 and May 14) are also available.
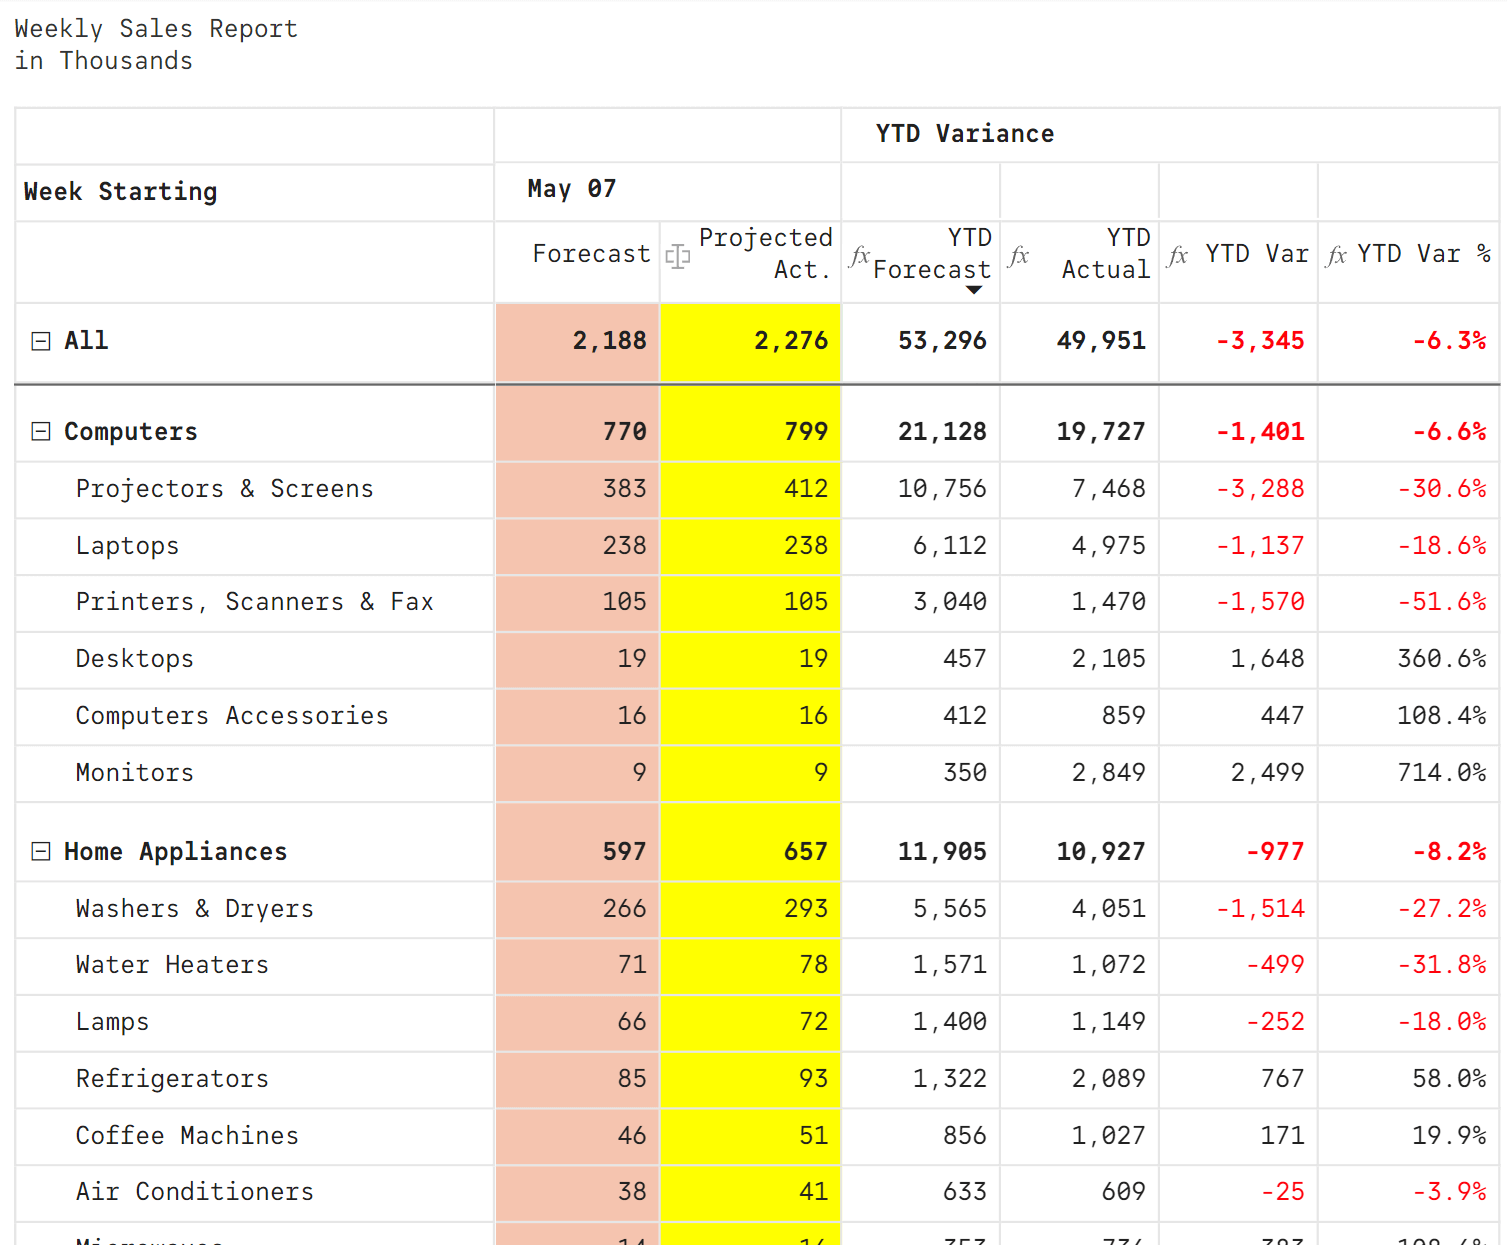
Year-till-date (YTD) performance with variances is also captured in the last few columns. You can notice that the YTD performance is not satisfactory, with the overall achievement down 6.7% when compared to the YTD Forecast.
The manager now proceeds to discuss prior week’s performance (week starting Apr 30) along with hits and misses with each sales rep on the call. Everyone validates that the preceding week numbers have been reported correctly. The attention soon shifts to the forecasts for the current week (starting May 7th).
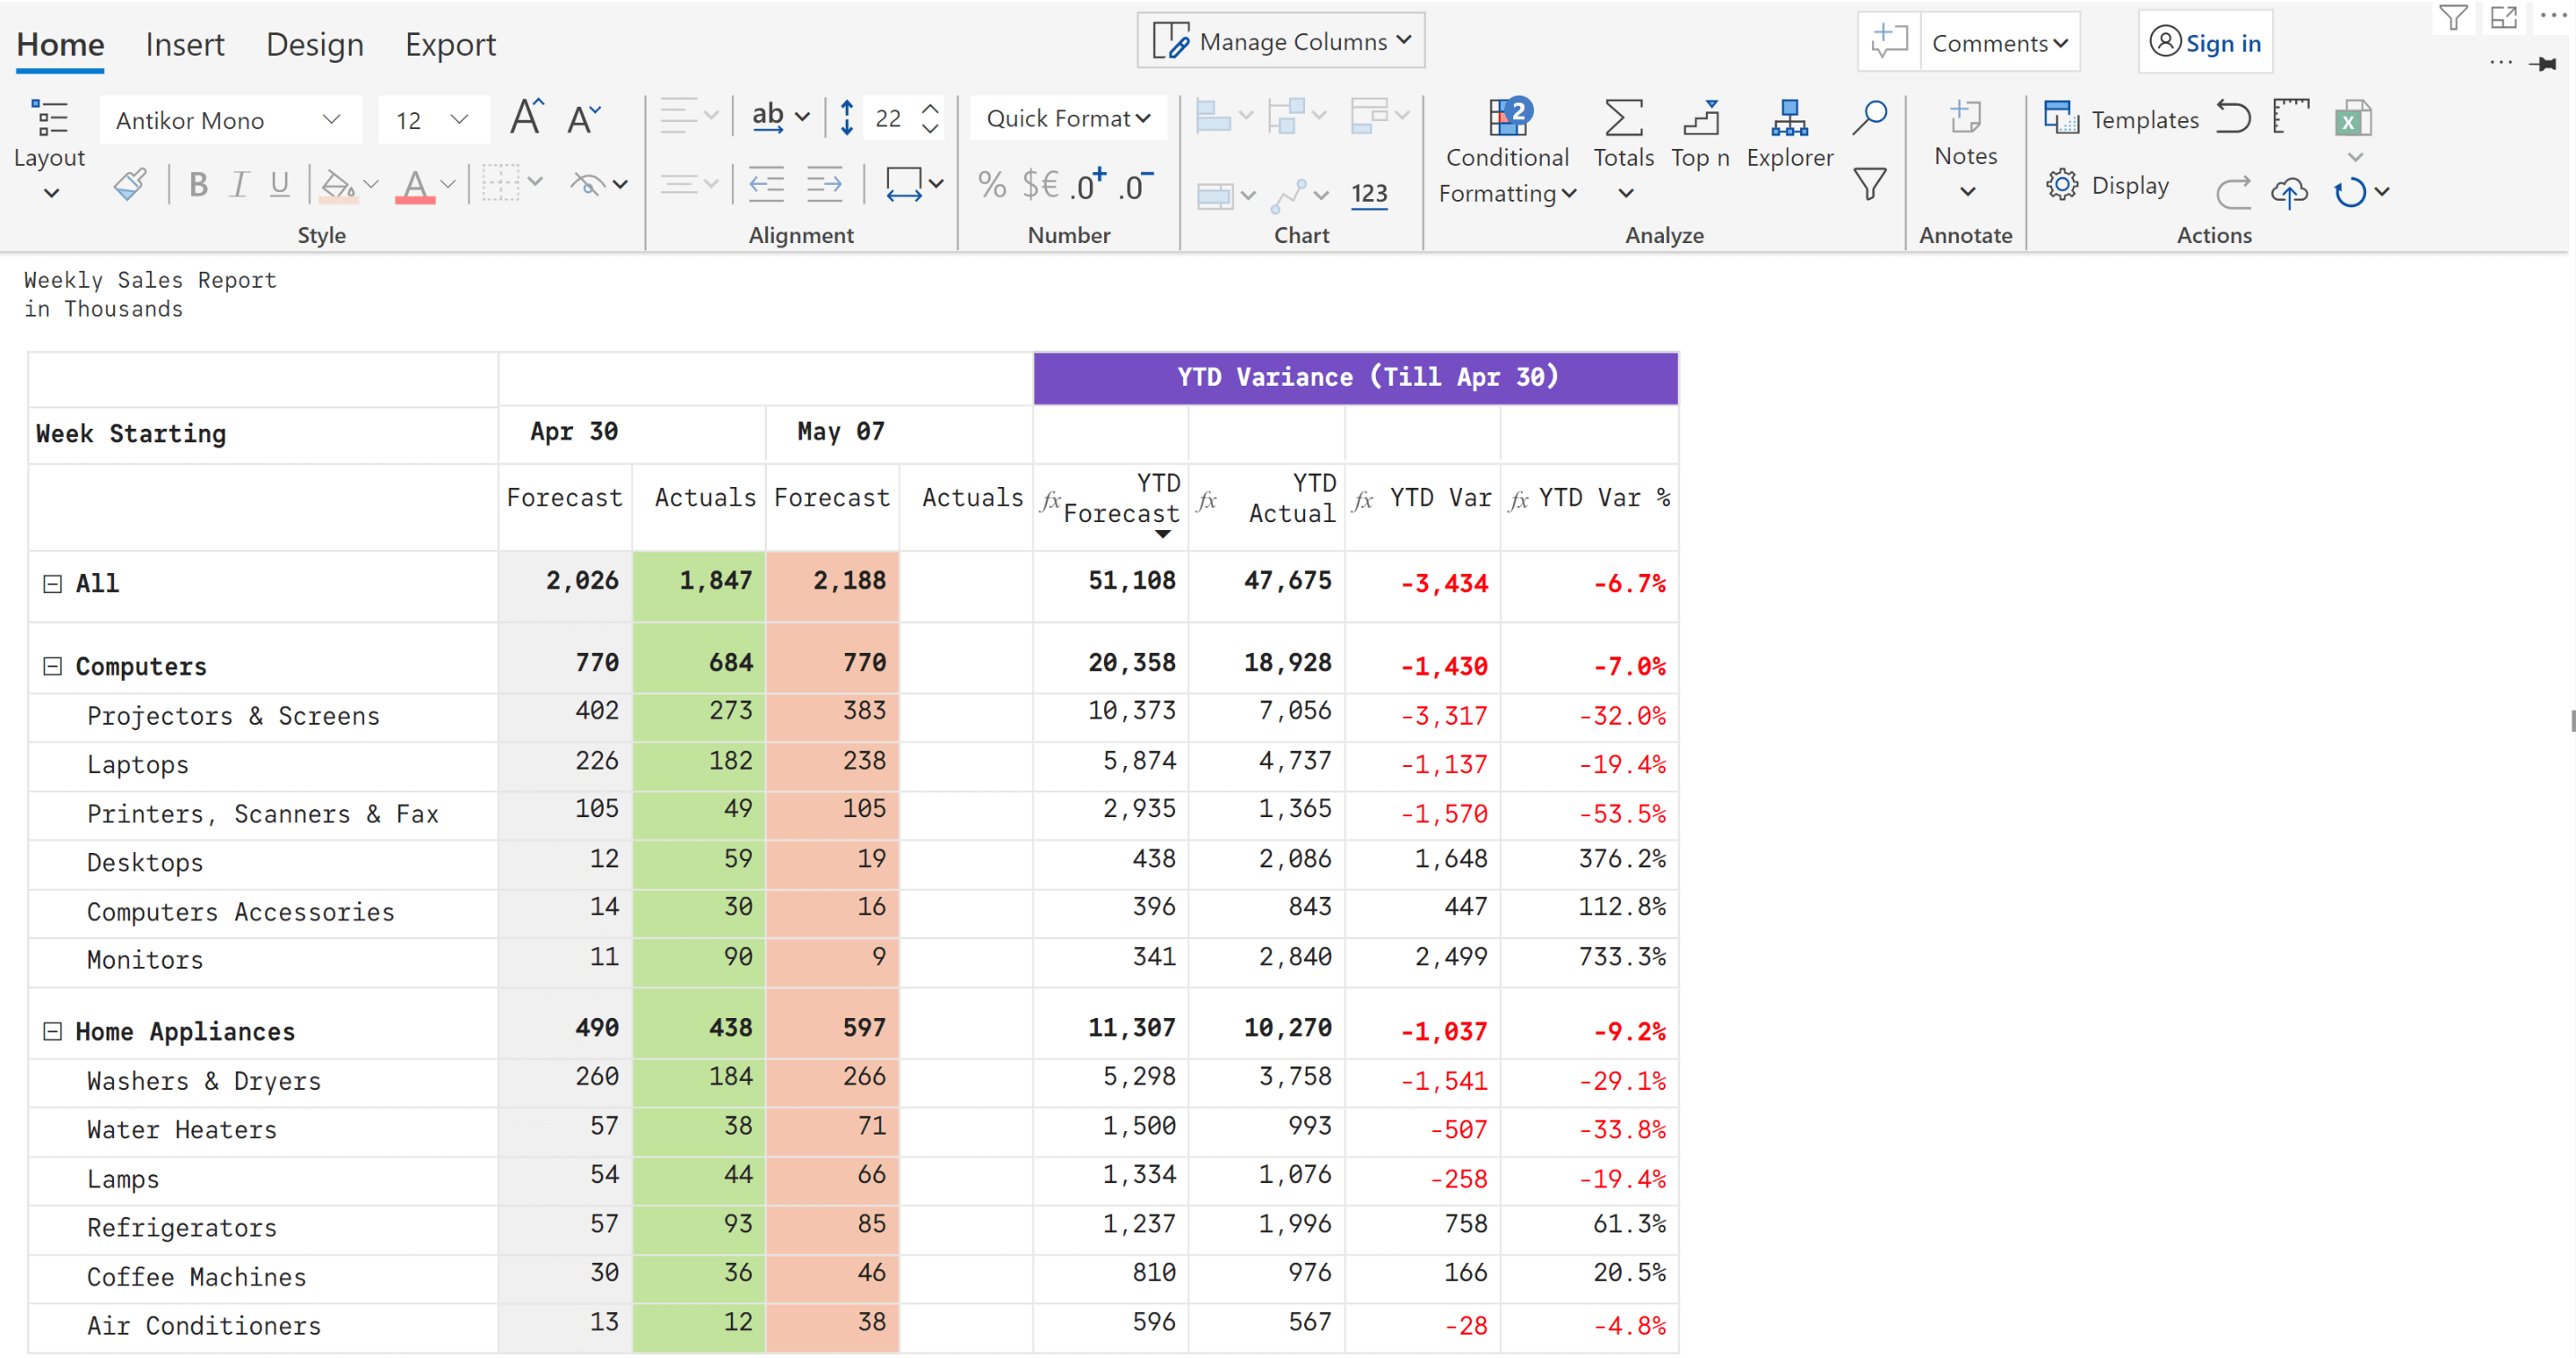
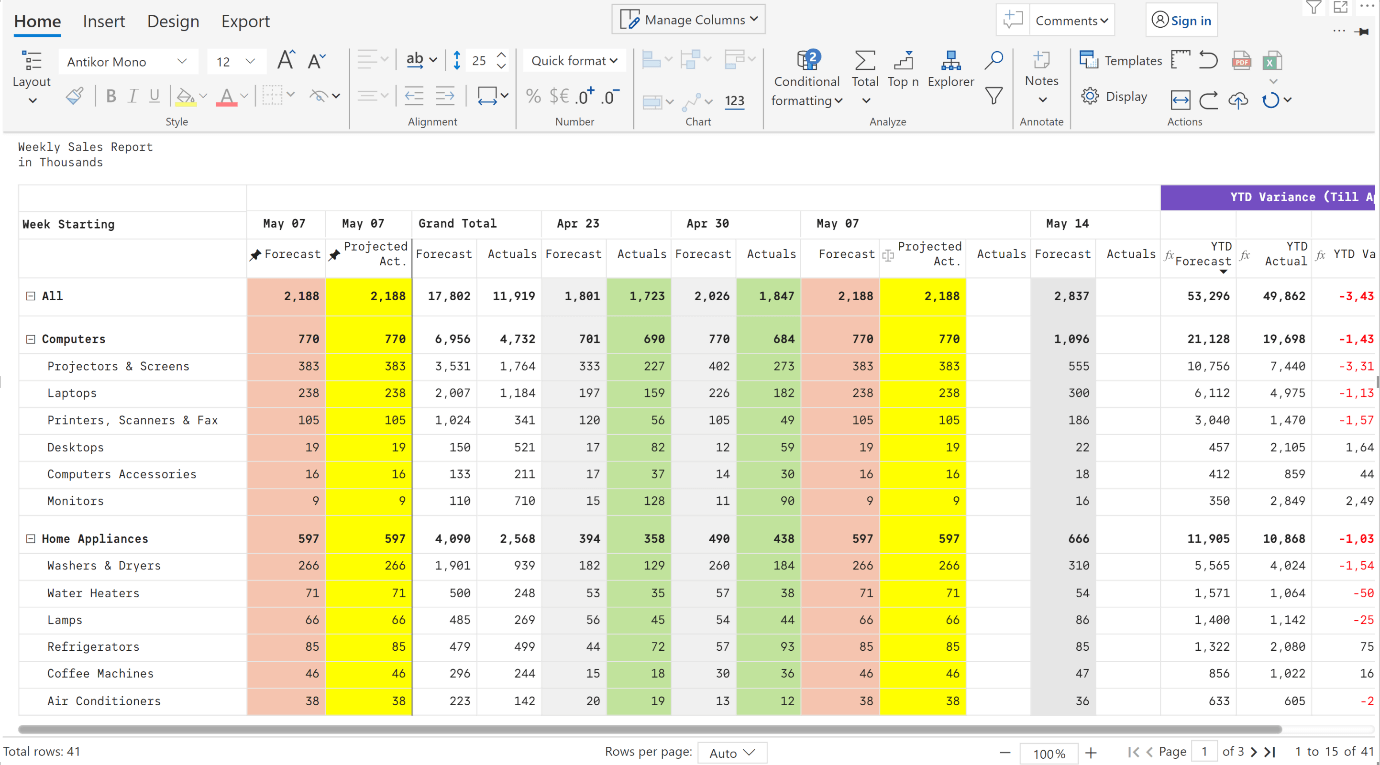
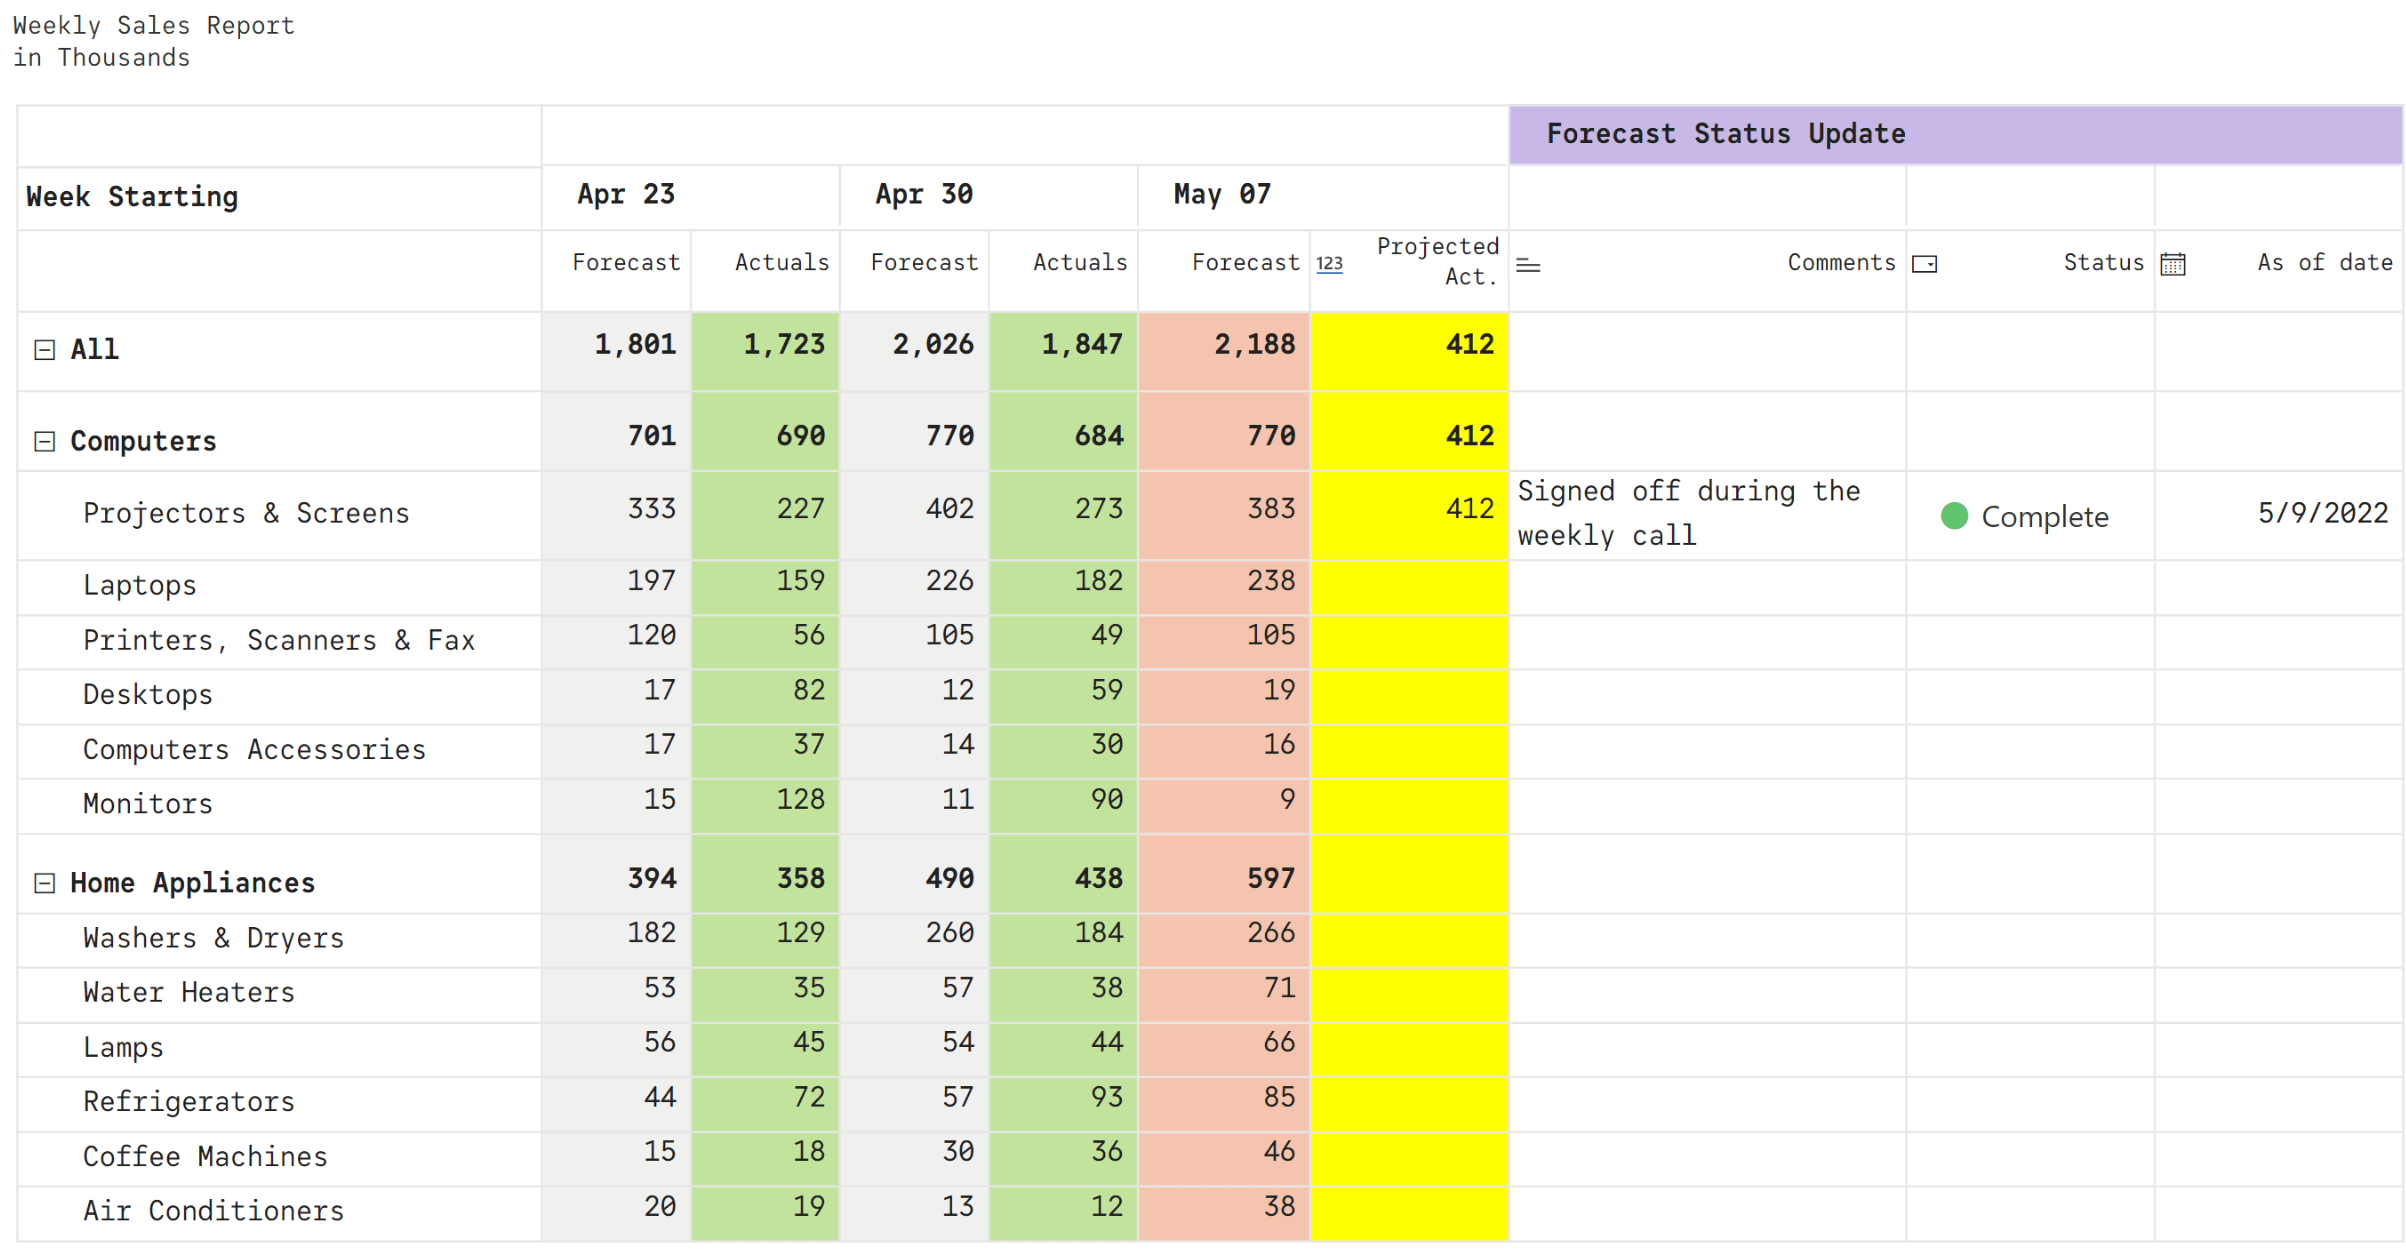
At this time, the manager decides to make quick changes to the report format & layout.
The manager first proceeds to make the following adjustments to the report:
(a) hide unwanted columns,
(b) update background colors for Apr 30 Actuals and May 07 Forecast (highlighting the latter in orange), and
(c) zooms in the report a bit so that everyone on the call can see the numbers better
The report now looks as shown below. (Note: This blog is not intended to be a step-by-step tutorial; Techniques used here are demonstrated in detail in our videos)
To help capture the projections temporarily, the manager now un-hides a pre-defined measure in the report (“Projected Act.”). He ensures that this measure is hidden for all weeks other than the week of May 07th. Note that in a typical report, this measure would show up under all weeks and not just under May 07th. This is one of several instances where Inforiver gives you the flexibility format your report and perform actions such has hiding specific columns just as you can do with Excel.
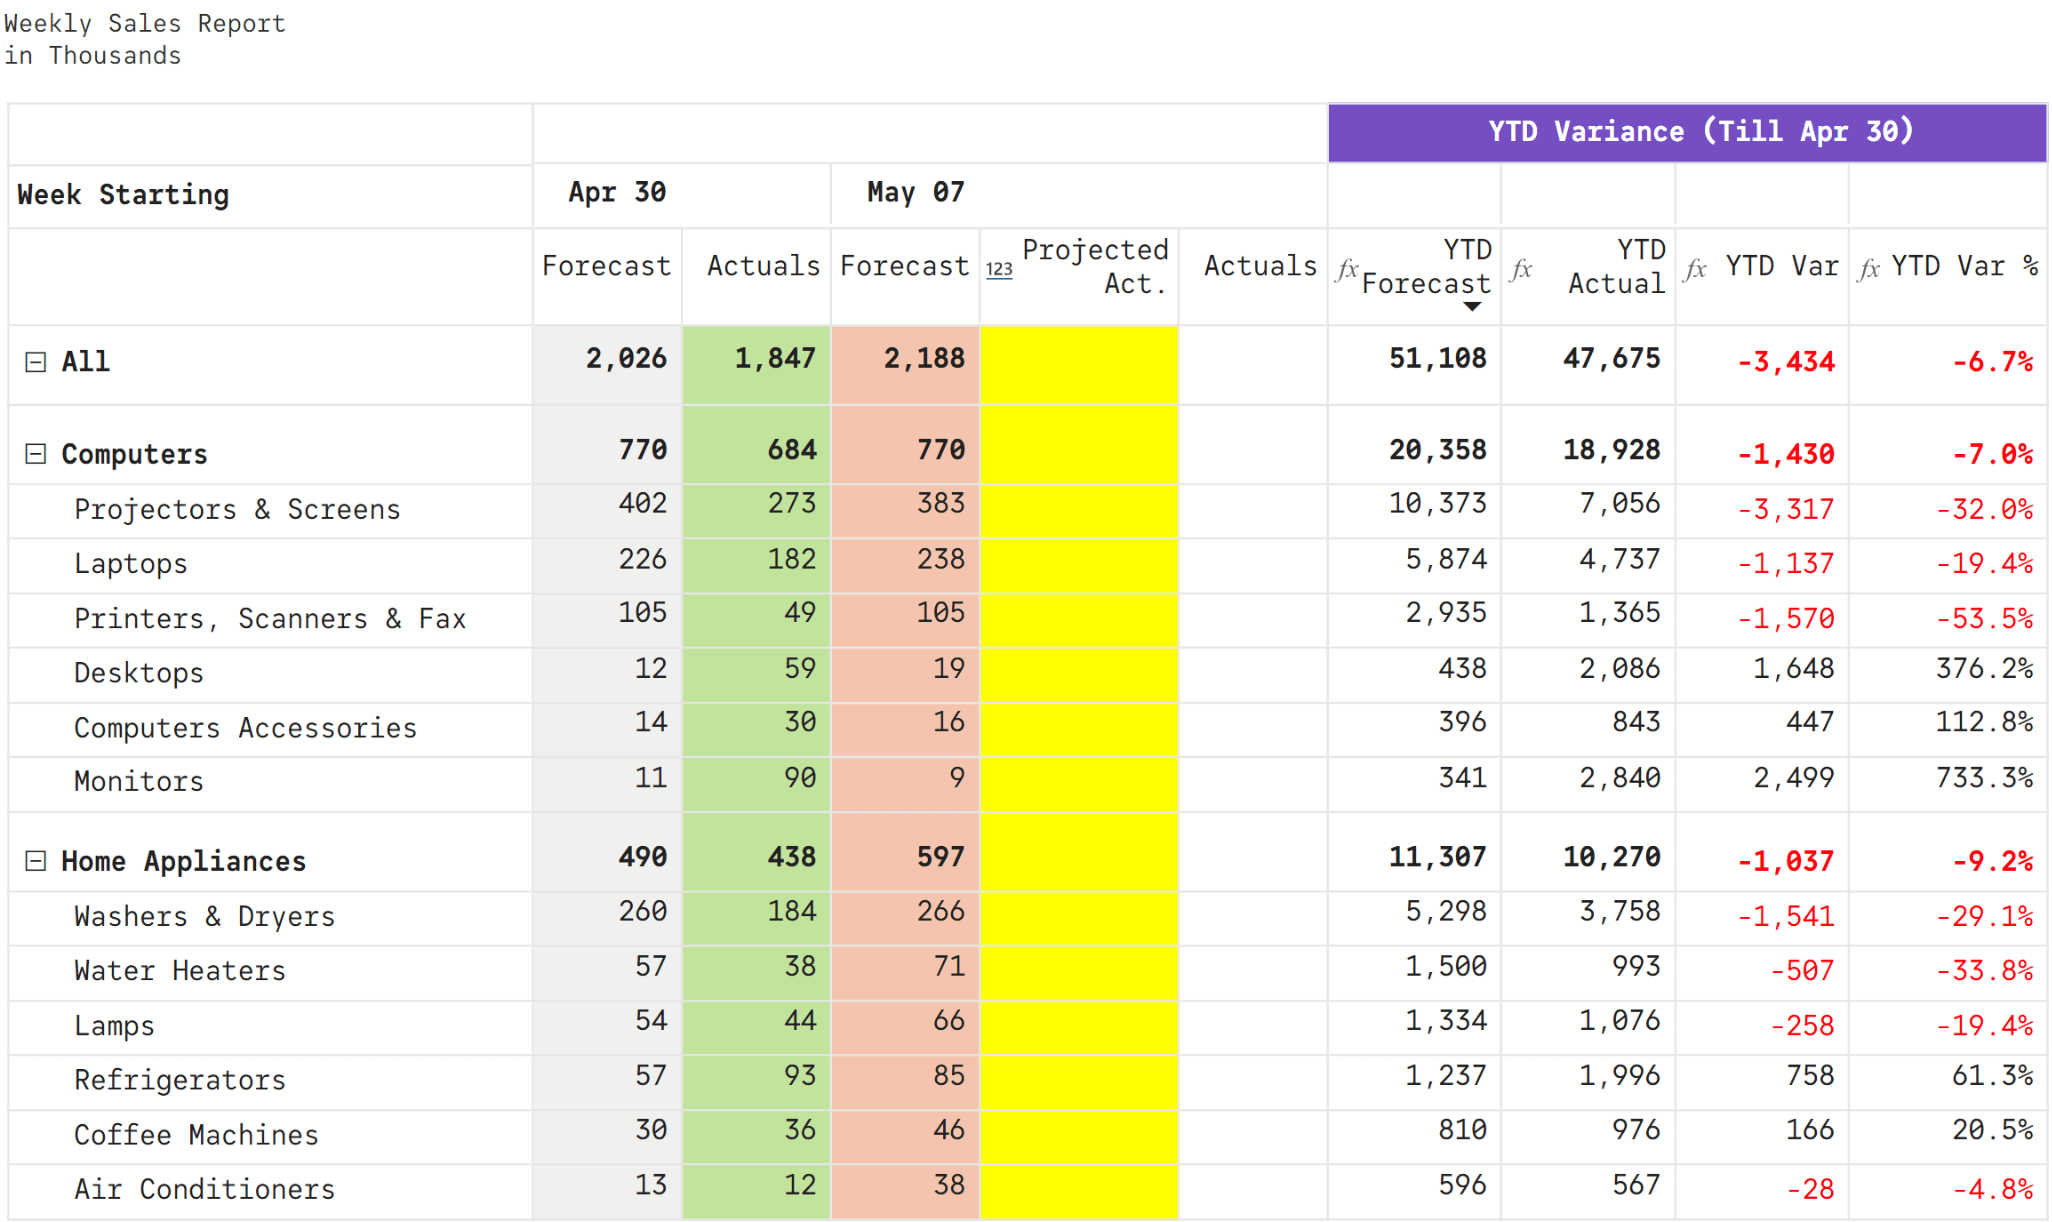
The manager can now start populating the “Projected Act.” field by keying in numbers directly.
He copies the total value “2188k” – in the row labeled “All” for Forecast for May 07 using CTRL+C and pastes it in the corresponding cell for Projected Act. in the highlighted cell below. Since this field is manual-input-enabled, Inforiver automatically allocates this total value equally across the most granular line items – e.g., Laptops, Desktops, Water Heaters etc., have a projection of 68k each.
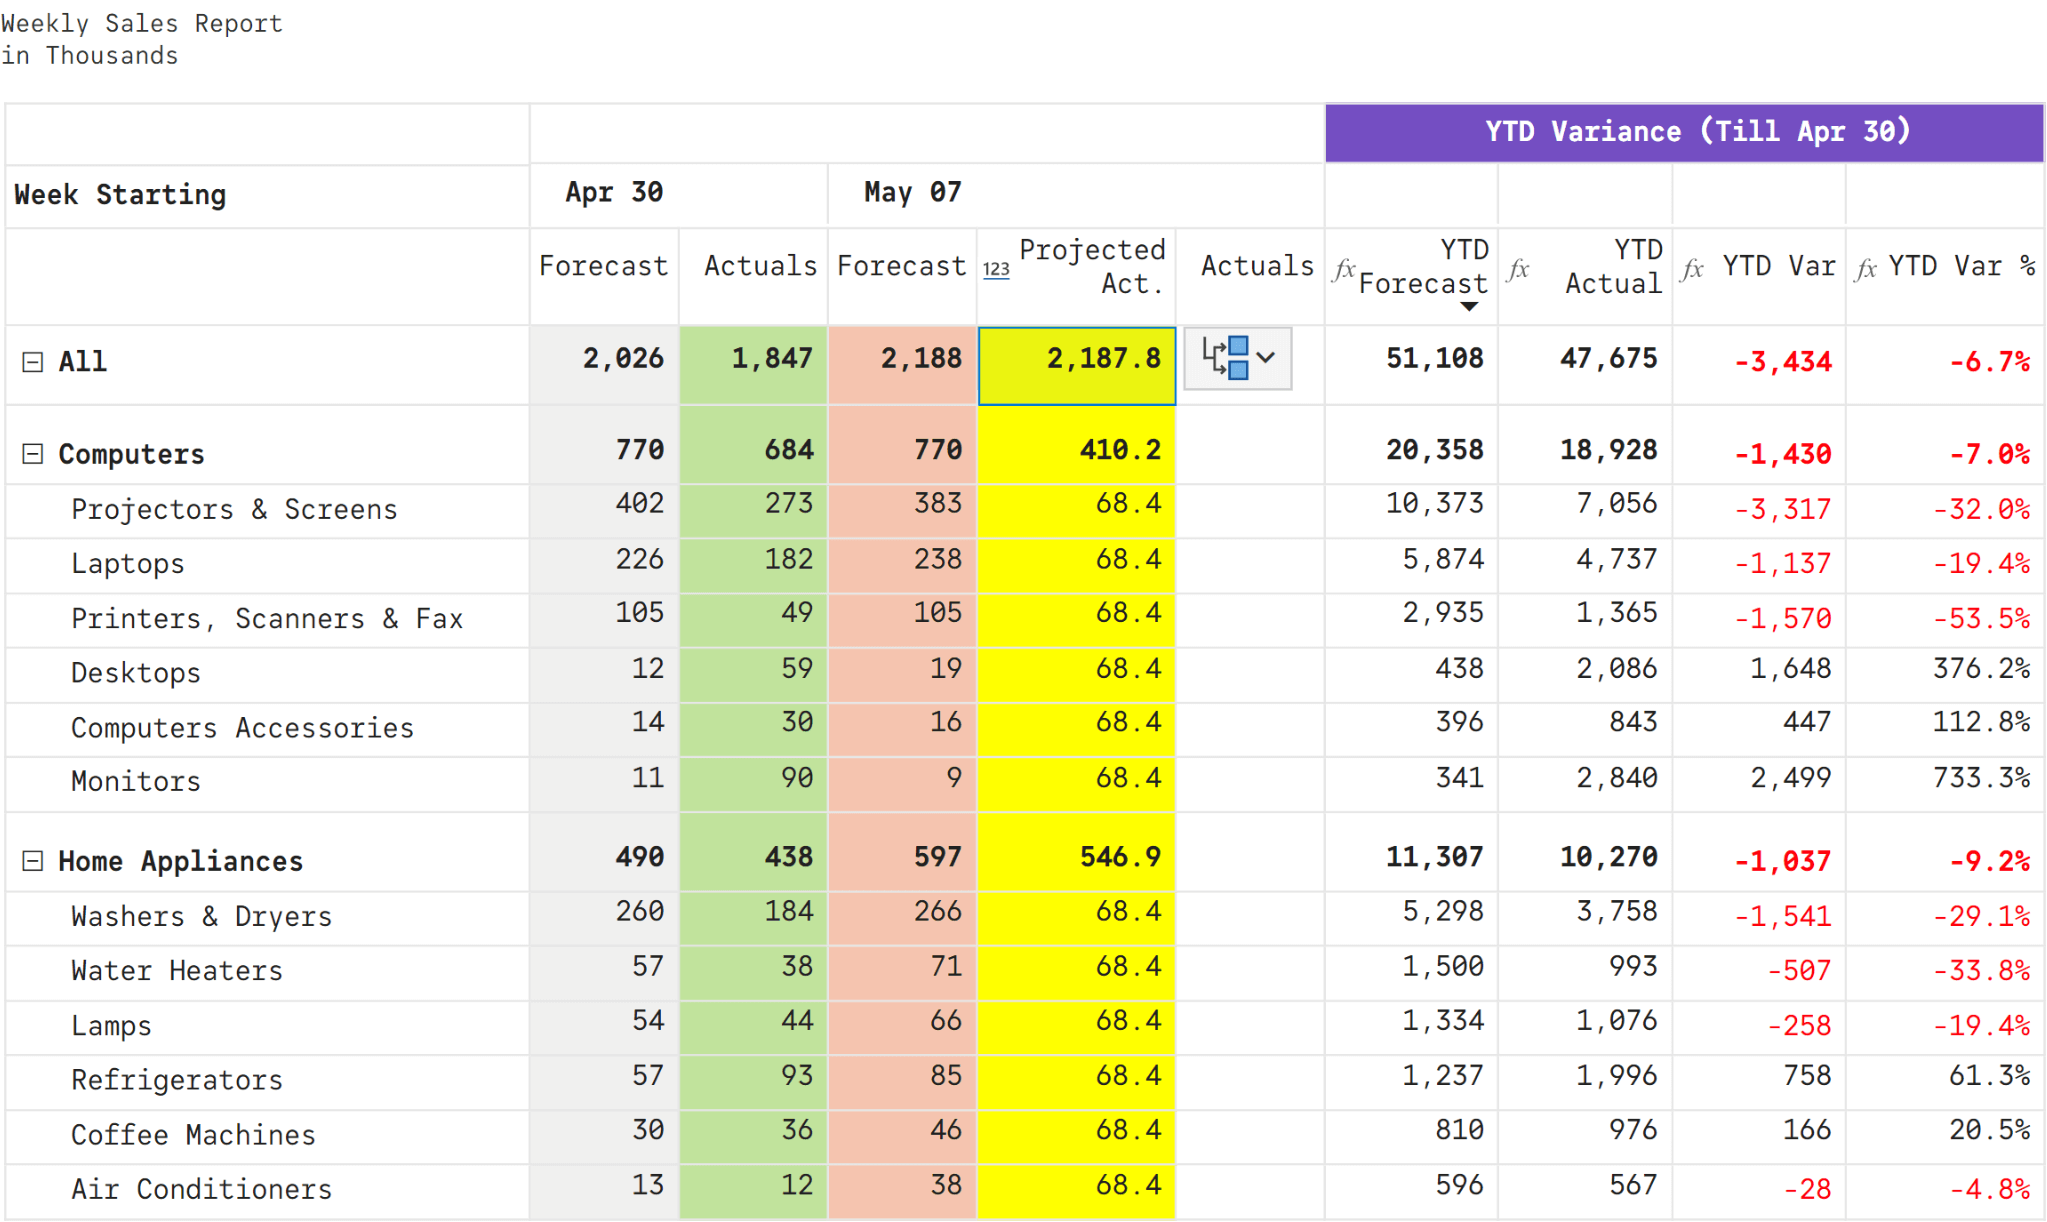
However, such default equal distribution is incorrect. Our distribution needs to happen in the same proportion as the original May 07 Forecast. To fix this, the manager now uses the context icon next to the total value in Projected Act. which opens up a menu. He chooses the option that distributes the value across rows based on the weights of May 07 Forecast (the full expanded list is not shown here as there are several weeks in the model).
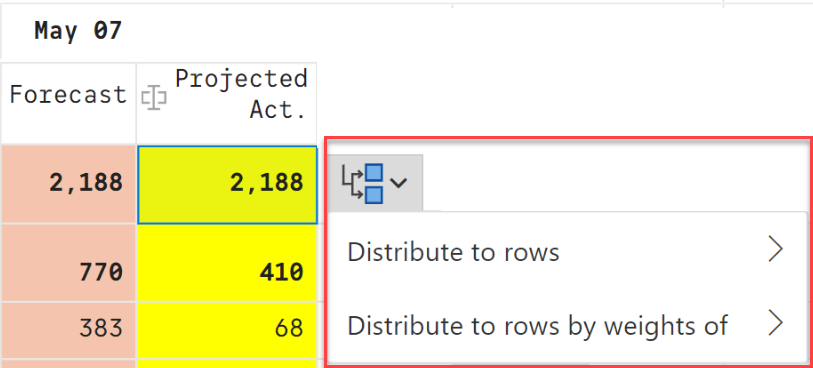
Doing this makes the Projected Act. values mirror the Forecast values.
Tip: Using the same approach, you can distribute support costs or overhead costs in the same proportion has headcount or revenue. This is a very common requirement in Profit & Loss (P&L) models and driver-based planning.
The manager now also verifies the formula & calculation for the YTD field to ensure that it considers the values for the current week (May 07). Inforiver’s formula builder helps you create and manage such calculated columns (and rows) just as you can do with Excel.


Finally, the Manager pins the forecasts & projected actuals column for May 07 in the beginning of the report (columns #2 and #3). These columns remain there even when the report is scrolled horizontally.
Now that the report is set up properly, the manager is ready to update current week projections.
The manager now starts reviewing projections from each sales rep.
The sales rep for Computers category goes first. She expects to close the current week for Projectors and Screens subcategory at 412k (instead of the current 383k)
The manager double clicks the projections which shows the current unscaled value 383082…
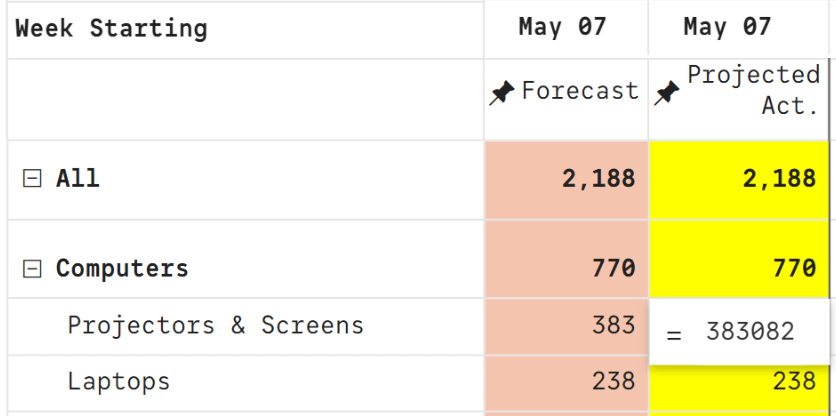
… and replaces the value with 412k (yes, you can enter numbers in scaled format)…
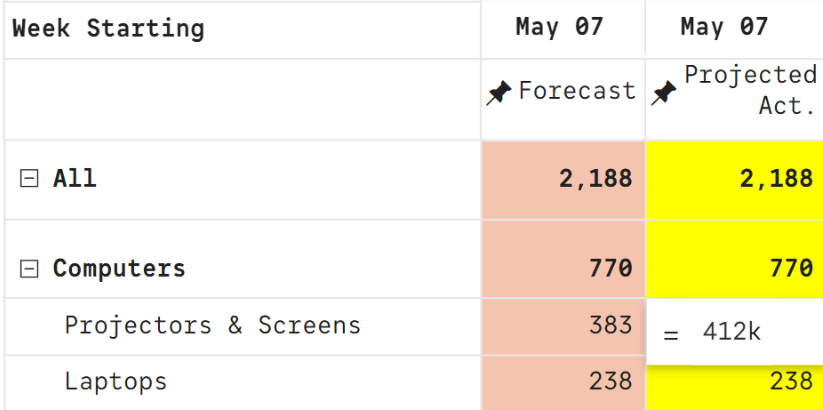
… and presses Enter. This action not only updates the value for Projectors & Screens, but also rolls it up to Computers category and All automatically.
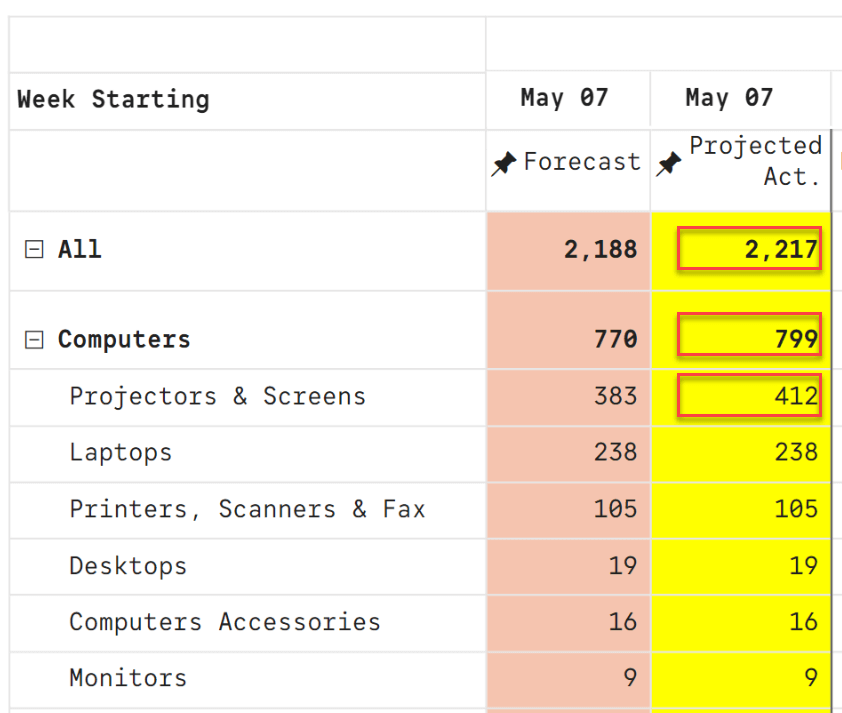
The manager then goes on to update the remaining subcategory projections with the sales rep.
***
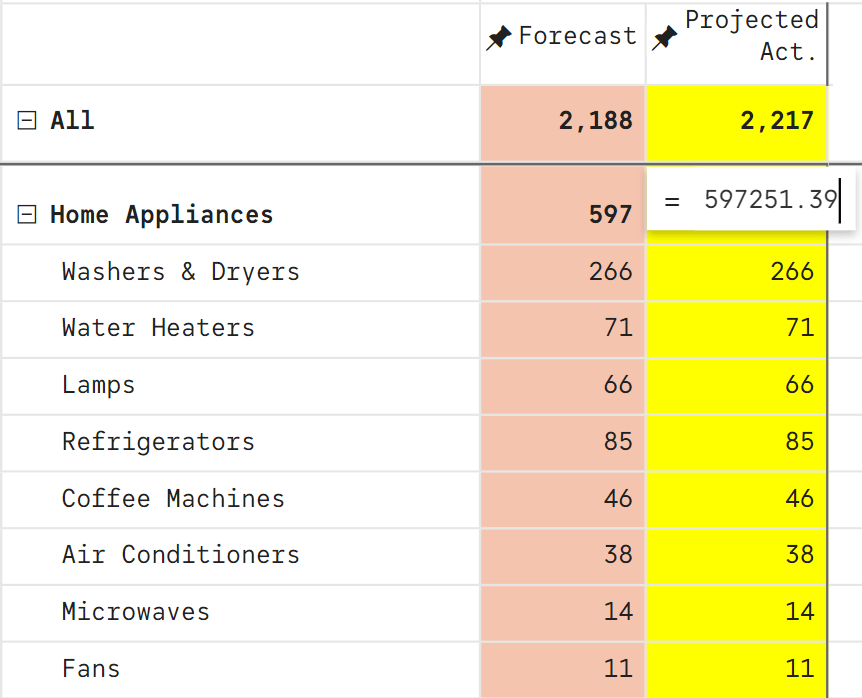
Once the values for Computers category are updated, the manager moves on to the next category Home Appliances. This is managed by a different sales rep, who is not on the call. To be brief, the manager wants to increase the projections by 10% for the entire category, and discuss things later with the rep in detail.
To capture this, the manager scrolls down the table (note how the All row is frozen at the top), double-clicks the projection for Home Appliances…
….and appends +10% (yes, you can express changes in percentage too) ...
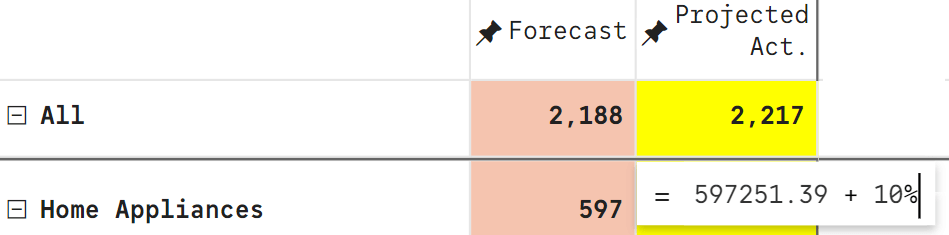
… and clicks Enter. All subcategory items under Home Appliances register a proportional 10% increase (e.g., Washers & Dryers from 266k to 293k)
Imagine the convenience and time savings when your data has hundreds of line items. Just updating your parent by x% propagates changes automatically to children, and you need to only handle the outliers.
In addition, any subsequent changes to the descendant line items (e.g., Washers & Dryers) will automatically roll up to the top. In this sense, Inforiver is bi-directional – and it does not give you circular reference errors which you will encounter in spreadsheets for actions like the above.

Finally, for each change done by the manager, the YTD variance automatically gets updated. You can notice that the manager has brought down the YTD Var % deficit to -6.3% (from the original -6.7% - as seen in the very first image above)
While we have only seen numeric values being entered so far in the report, Inforiver also supports manually keying in text values, dropdown and date fields as shown below. However we have not used this template in our report for the purpose of brevity. To learn more, refer our blog 5 types of manual data entry options in Power BI.
Inforiver delivers great productivity and efficiency backed by an engaging user experience for scenarios that require data input, editing and updates right within Power BI. It also allows you to
In the subsequent blog, we’ll use the same report as above and proceed to explain how Inforiver facilitates conversations & collaboration right from within your Power BI report.
To learn more about Forecasting in Power BI, press here.
***
This post forms Part 2 of the 4-part series on Driving Productive Sales Meetings with Power BI. Visit other blogs in the series by clicking on the links below.
Part 1: Drive Productive Sales Meetings with Power BI - Introduction
Part 2: Input, Edit & Update Data (sales projections) in your Power BI report
Part 3: Facilitate data-driven comments & conversations
Part 4: Write back and save your projections to an on-premises or cloud SQL database or a shared drive (e.g., OneDrive) and other considerations (e.g., email report scheduling, audit trail)

Inforiver helps enterprises consolidate planning, reporting & analytics on a single platform (Power BI). The no-code, self-service award-winning platform has been recognized as the industry’s best and is adopted by many Fortune 100 firms.
Inforiver is a product of Lumel, the #1 Power BI AppSource Partner. The firm serves over 3,000 customers worldwide through its portfolio of products offered under the brands Inforiver, EDITable, ValQ, and xViz.