Upcoming webinar on 'Inforiver Charts : The fastest way to deliver stories in Power BI', Aug 29th , Monday, 10.30 AM CST. Register Now
Upcoming webinar on 'Inforiver Charts : The fastest way to deliver stories in Power BI', Aug 29th , Monday, 10.30 AM CST. Register Now
Most of us would have encountered at least one Power BI report where we felt the need to enter or key in data manually inside the table or matrix. Unfortunately, the native Power BI table or matrix does not allow it. You will need to use Power Apps to enable it. Some third-party visuals allow it directly, but the capability and user experience are mostly limited.
Inforiver provides seven (7) different options to manually enter data in your Power BI report.
Note: The ability to directly double-click a cell and edit/update values is not included in this list. We are only exploring columns you can create in Inforiver exclusively for capturing data through manual user input.
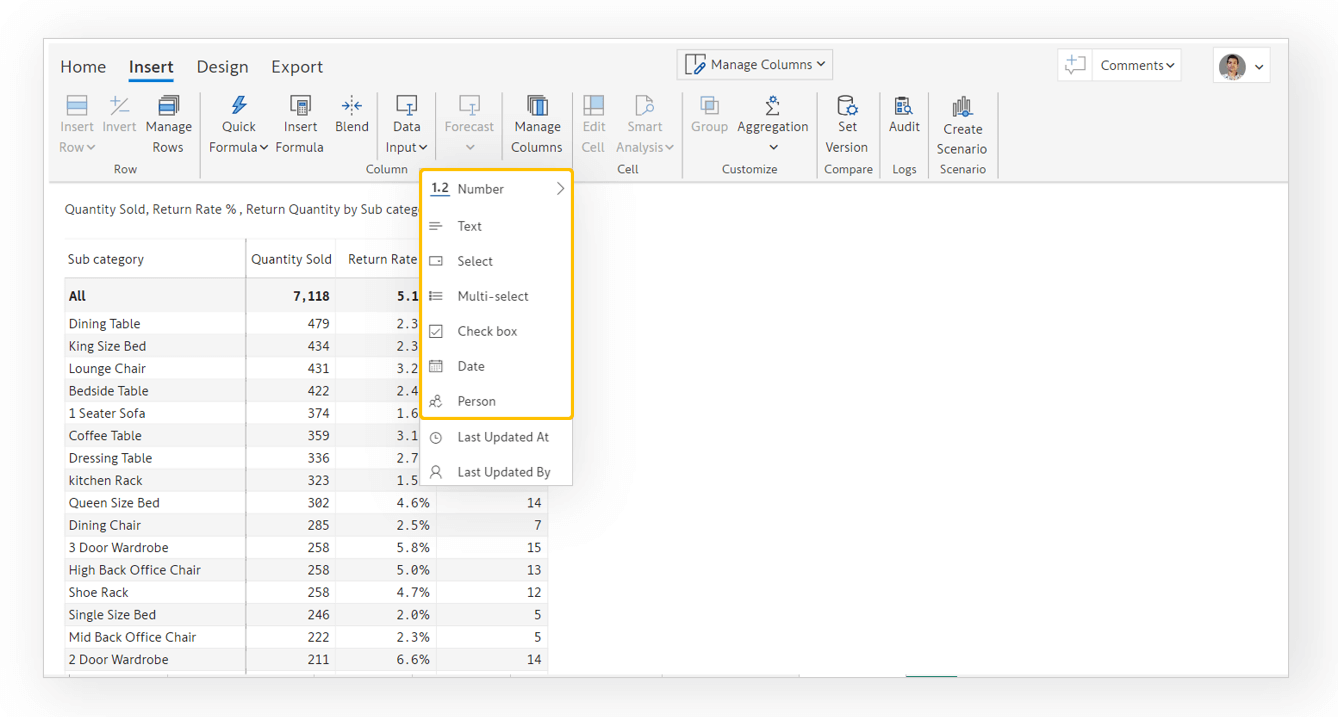
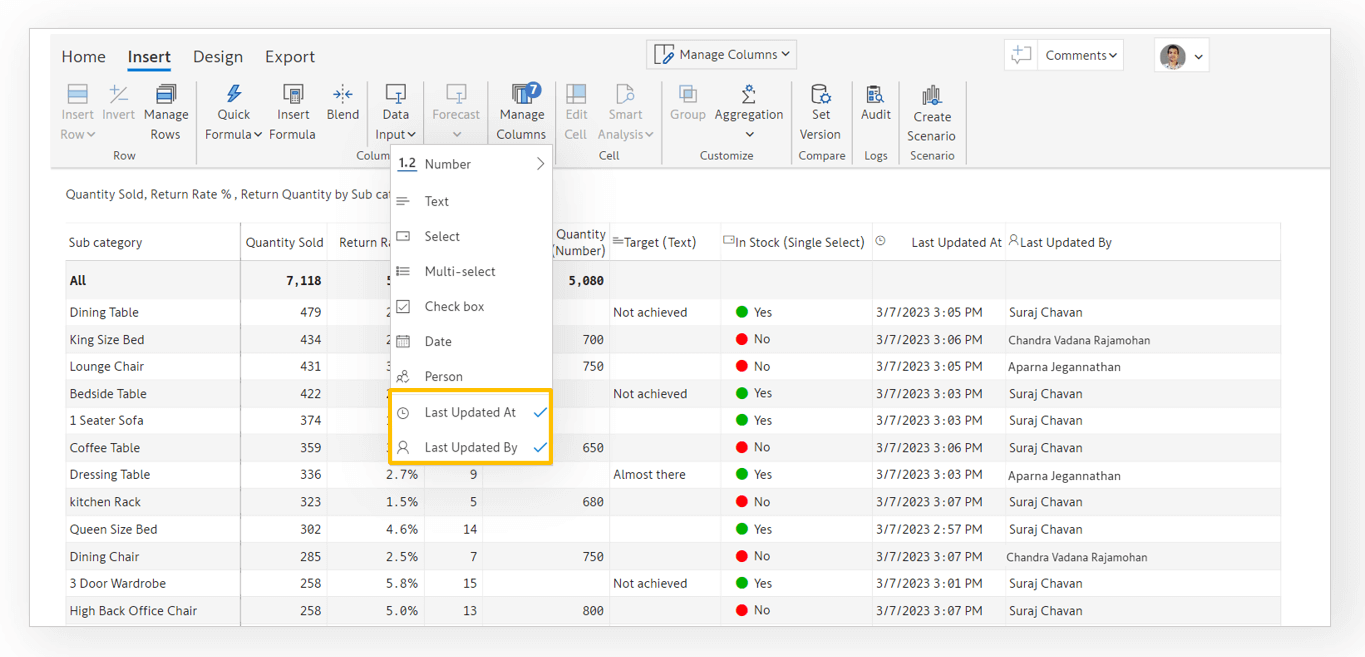
You can start inserting a column to capture your data inputs by clicking on Insert --> Data Input. This action reveals seven manual data entry options:
Note that Person is available only in Inforiver Enterprise. You can also see two other options – Last updated at and Last updated by which are covered towards the end of this blog.
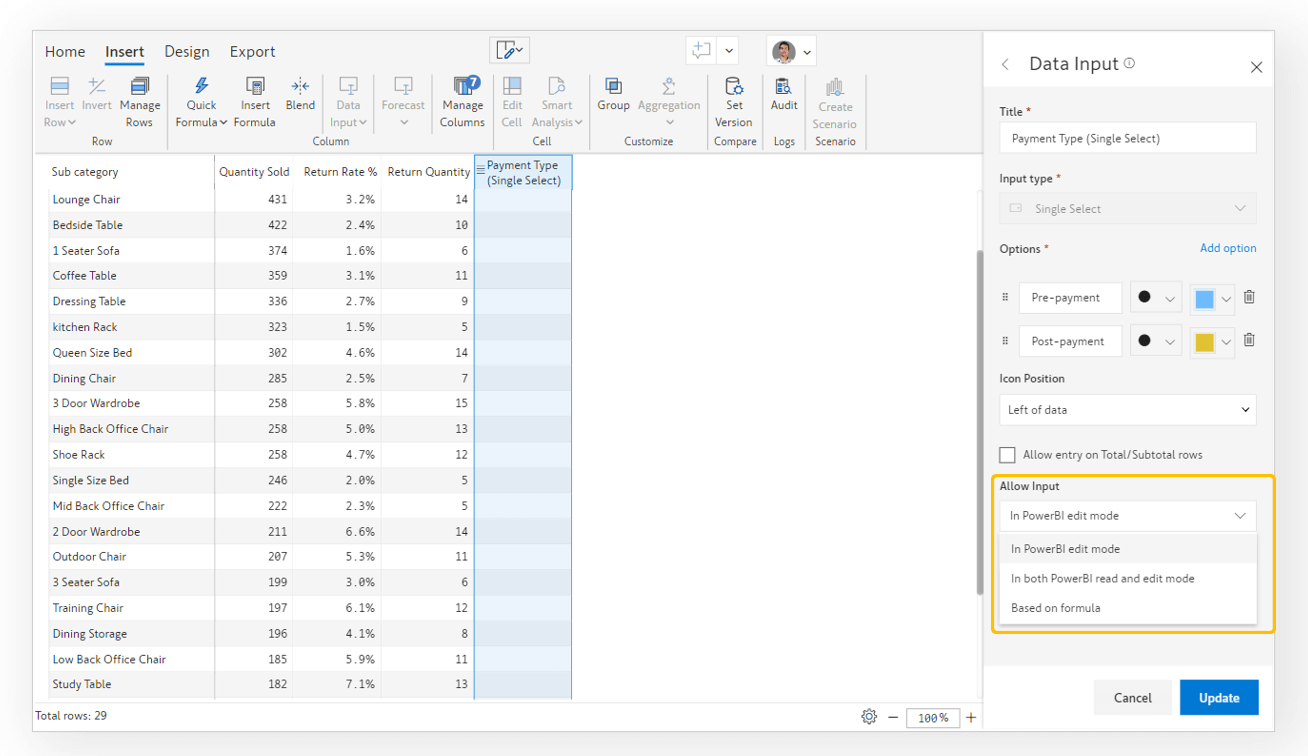
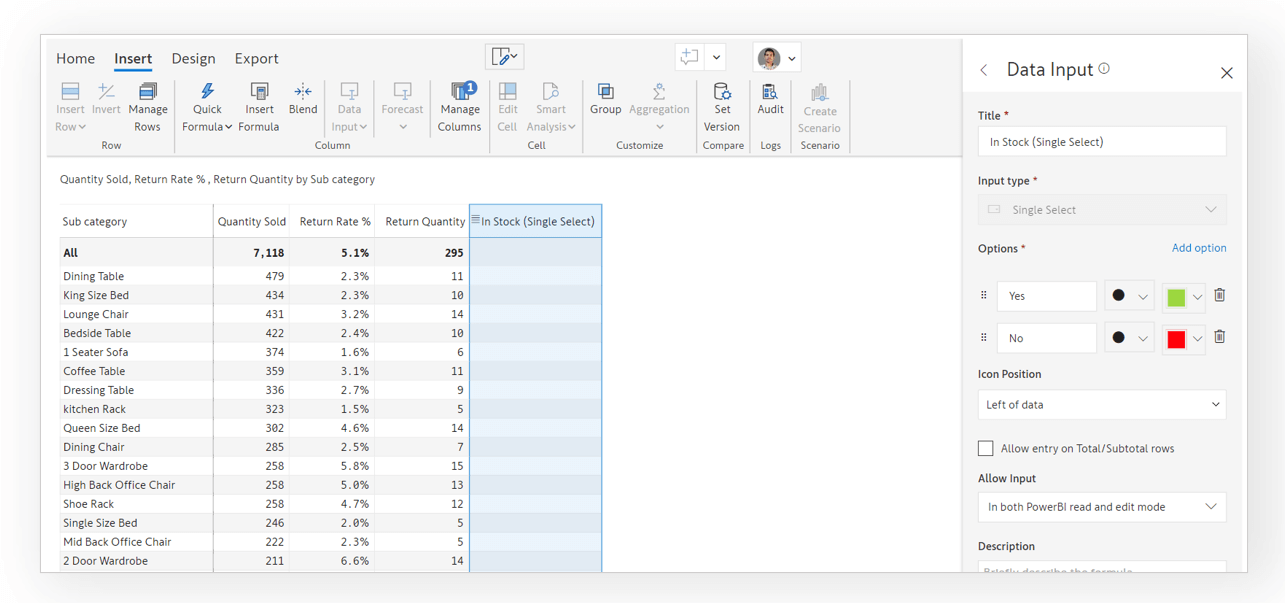
When you select any type, you are taken to a configuration screen. Amongst several options, you can define whether data entry should be restricted to edit mode, or if you would like the report consumers in reading view to be able to enter data as well. In the example shown below, we are creating a column dedicated for capturing a single value from the dropdown.
When I create a data input column of type Single Select, Inforiver allows me to create my own list or use one of the preset options. When I hover over an option, I can preview the dropdown values.
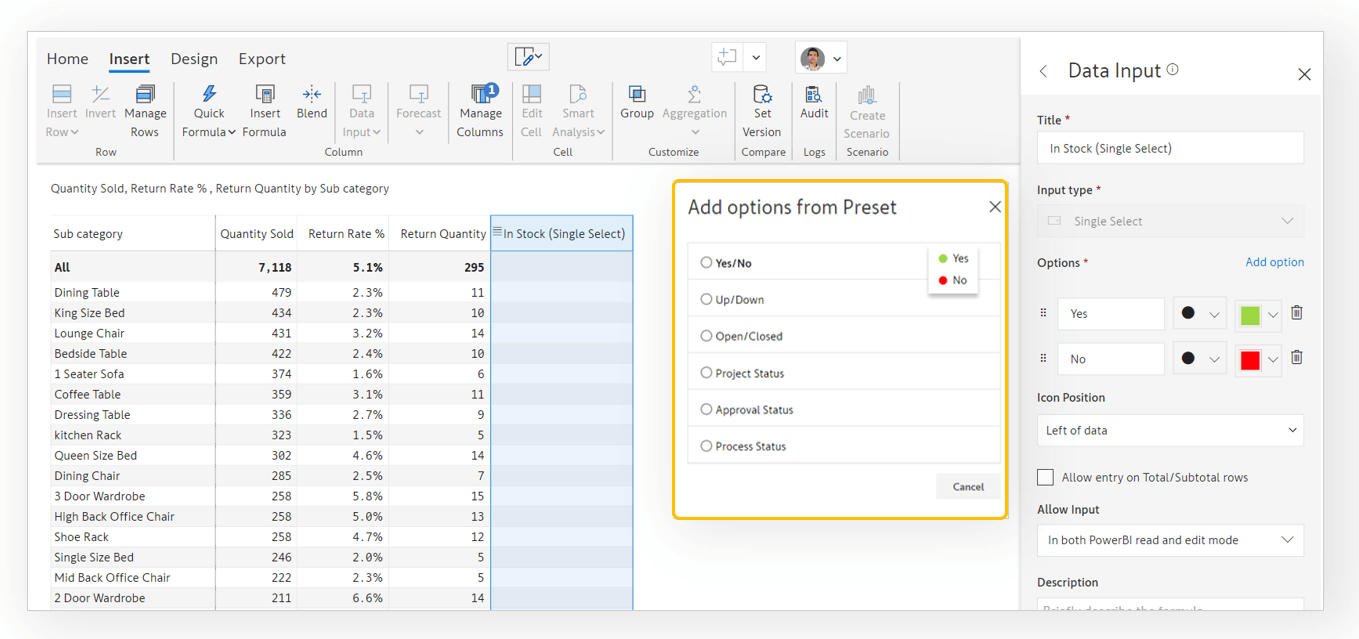
When I click on Yes/No, it takes me to the configuration screen that I can customize.
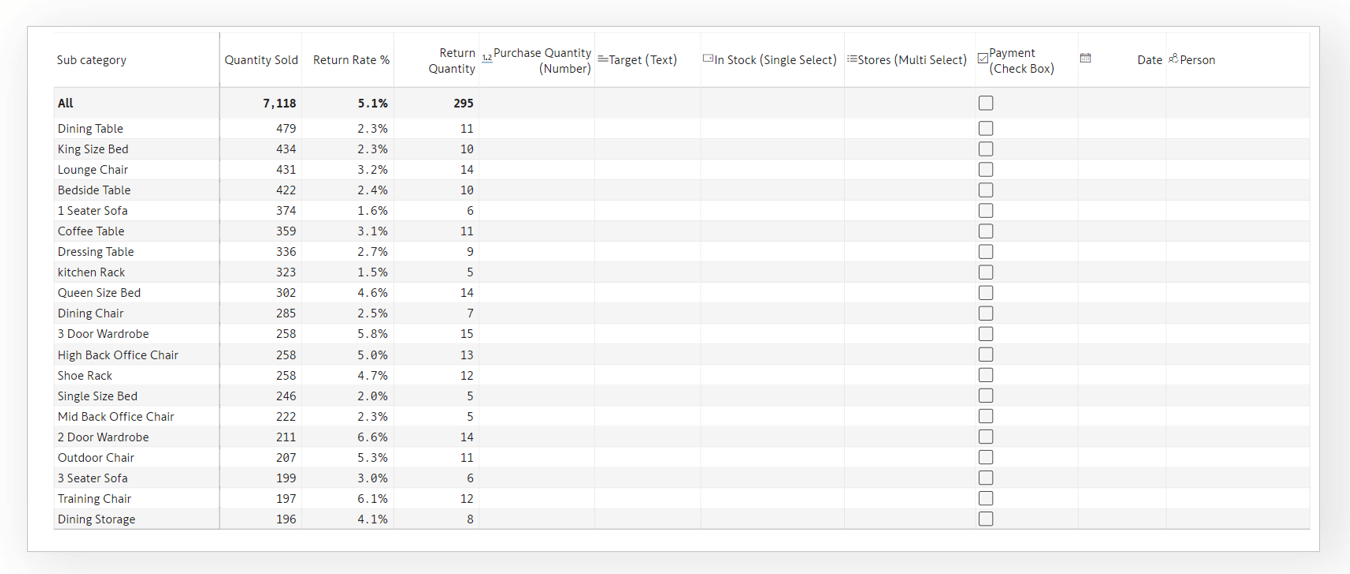
I have gone ahead and created columns for each of these types below. Note that the number and date column headers are automatically right aligned, while the text & dropdown column headers are left aligned. We at Inforiver have taken care of the finer details so that you can sit back and enjoy the experience.
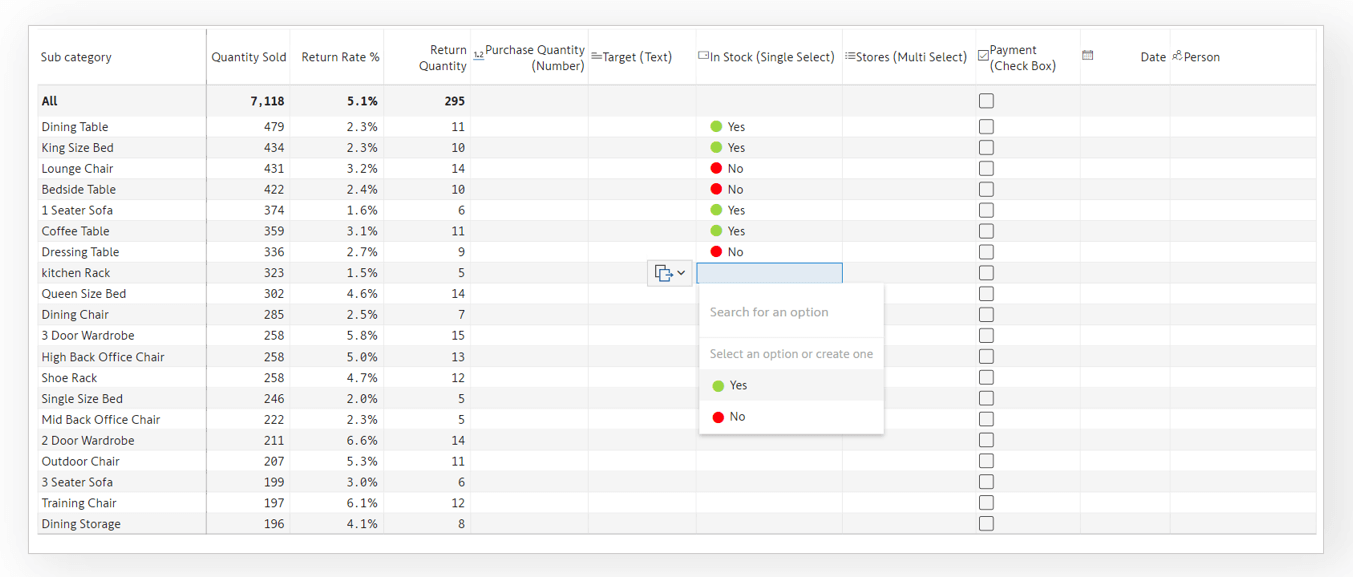
When I choose either of the two dropdown fields (Single Select or Multi Select), I can see the options listed in a dropdown.
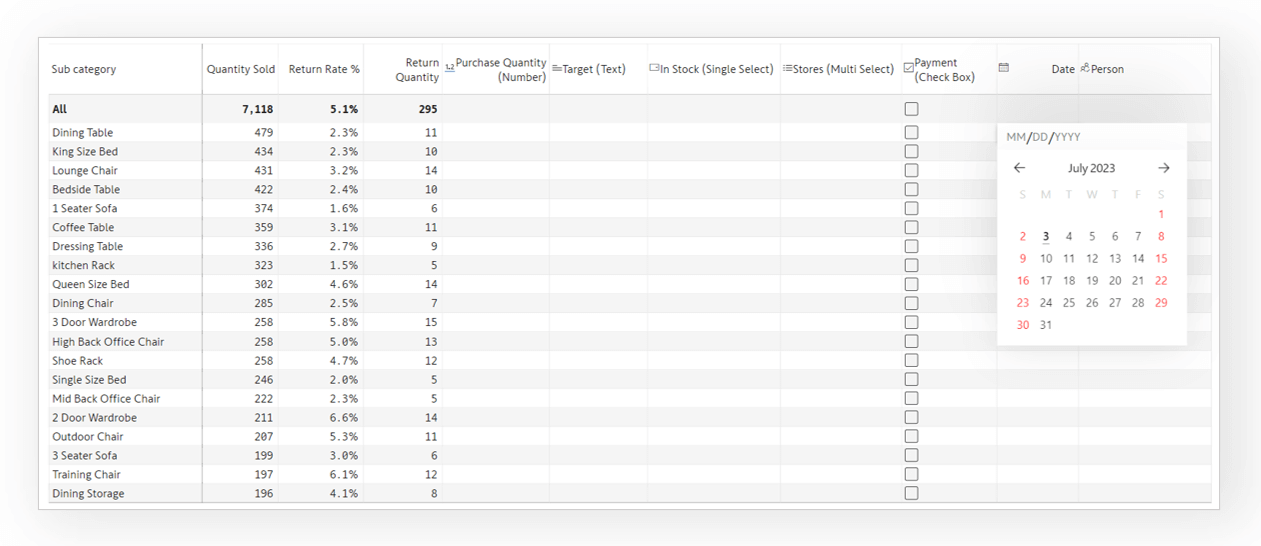
When I select a date field, I get to see a date picker.
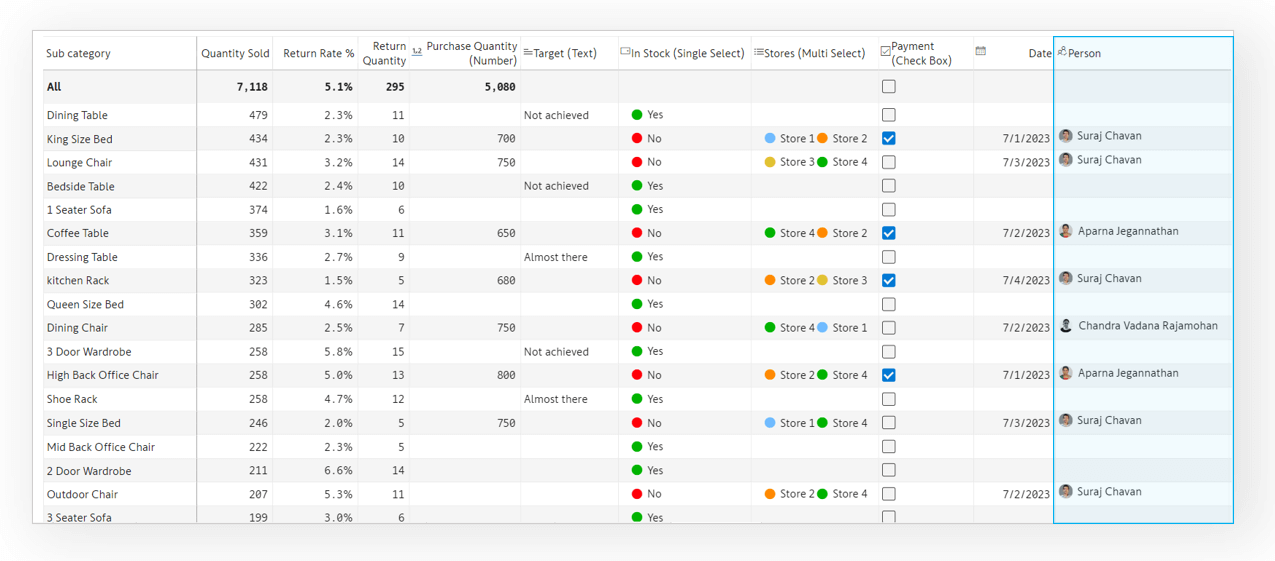
In the ‘Person’ column, you can input users from your organization. Double-click on any of the cells. You can see a list of the users within the organization. Select the desired user(s).
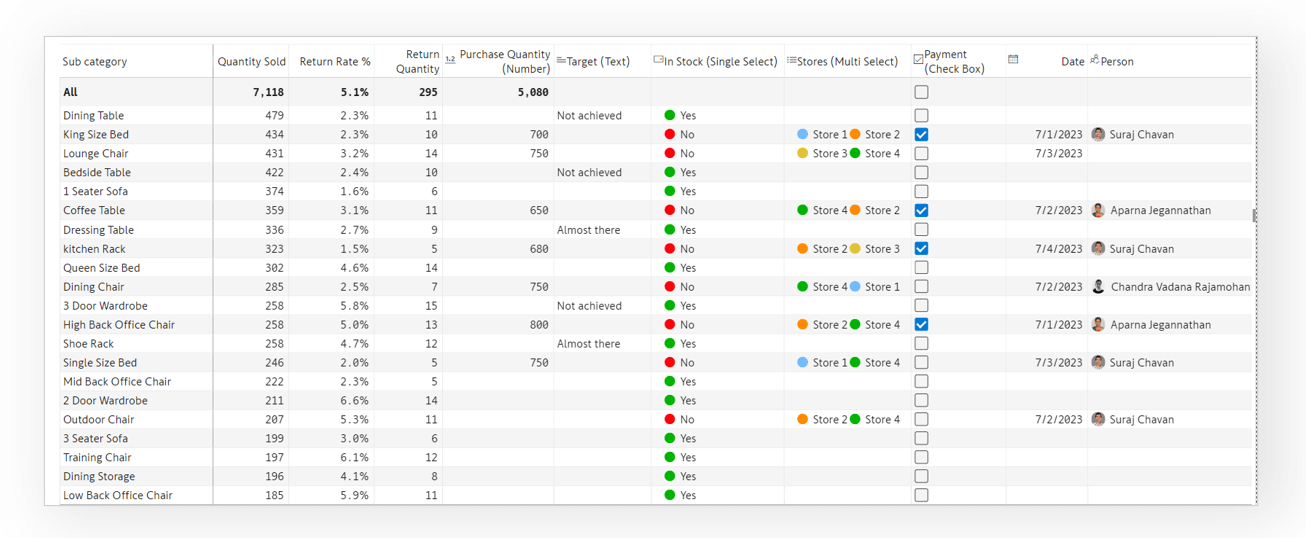
Here are a few values that I have managed to enter in these columns. What do you think?
Once a data input column is added, two columns – Last updated at and last updated by get enabled which captures metadata for changes in data input column at a row level.
Note: These 2 columns are enabled once you add a data input column and can be found in the data input dropdown. They can also be enabled/disabled from ‘Manage Columns’.
Note that there are other data entry options too – in the form of notes & comments, and also the simulation feature. To keep things simple, we have not covered them for now.
Note that all the data entries & updates are tracked by Inforiver’s interactive & filterable audit trail log - which helps you keep track of what has changed in the report.
Yeah, this is great. But can I write back this data to a database?
Absolutely. All of this data captured by Inforiver can be written back to a database - on-premise or cloud SQL, Snowflake, Azure and more. You can even write it to a shared folder like OneDrive. Or simply export to PDF or Excel.
Try out these features in Inforiver today.
Learn how Inforiver's writeback capability can transform your Power BI reports.

Inforiver helps enterprises consolidate planning, reporting & analytics on a single platform (Power BI). The no-code, self-service award-winning platform has been recognized as the industry’s best and is adopted by many Fortune 100 firms.
Inforiver is a product of Lumel, the #1 Power BI AppSource Partner. The firm serves over 3,000 customers worldwide through its portfolio of products offered under the brands Inforiver, EDITable, ValQ, and xViz.