Upcoming webinar on 'Inforiver Charts : The fastest way to deliver stories in Power BI', Aug 29th , Monday, 10.30 AM CST. Register Now
Upcoming webinar on 'Inforiver Charts : The fastest way to deliver stories in Power BI', Aug 29th , Monday, 10.30 AM CST. Register Now
Quite often we would like to insert a row in our table / matrix reports in Power BI and enter our own data. For example, a financial statement report connecting to a database query may be able to fetch revenue & expense metrics. But it might not retrieve the number of shares outstanding. Similarly, a sales report can leave out the sales data for a newly launched product category.
To address such scenarios, Inforiver allows users to insert a static row for your matrix style reports with where you can input or enter the data.
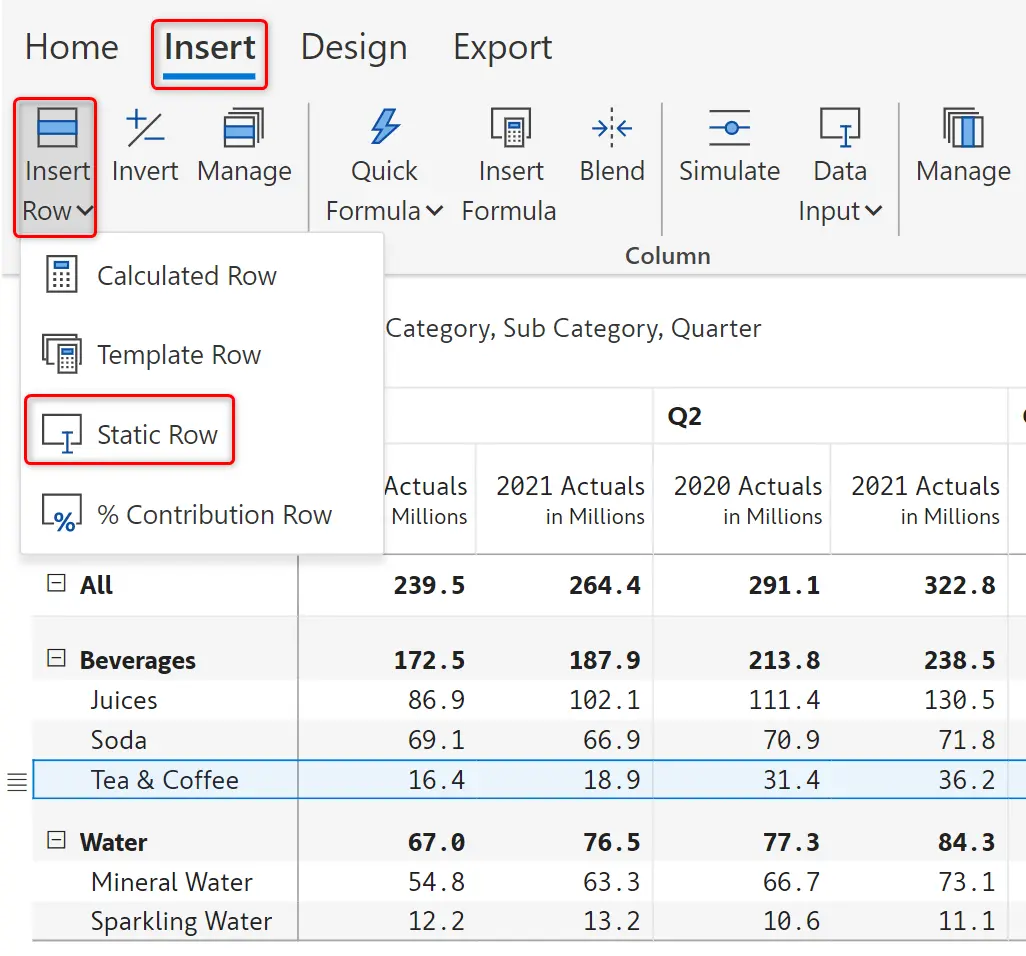
To perform this, go to Insert -> Insert Row -> Static Row from the tool bar.
Then type in the name of the row header or category. In this case we are making an entry 'Specialty Beverages'. We keep the option 'Include in Total' enabled. This ensures that any values that we type in for 'Specialty Beverages' also updates the parent row 'Beverages'.
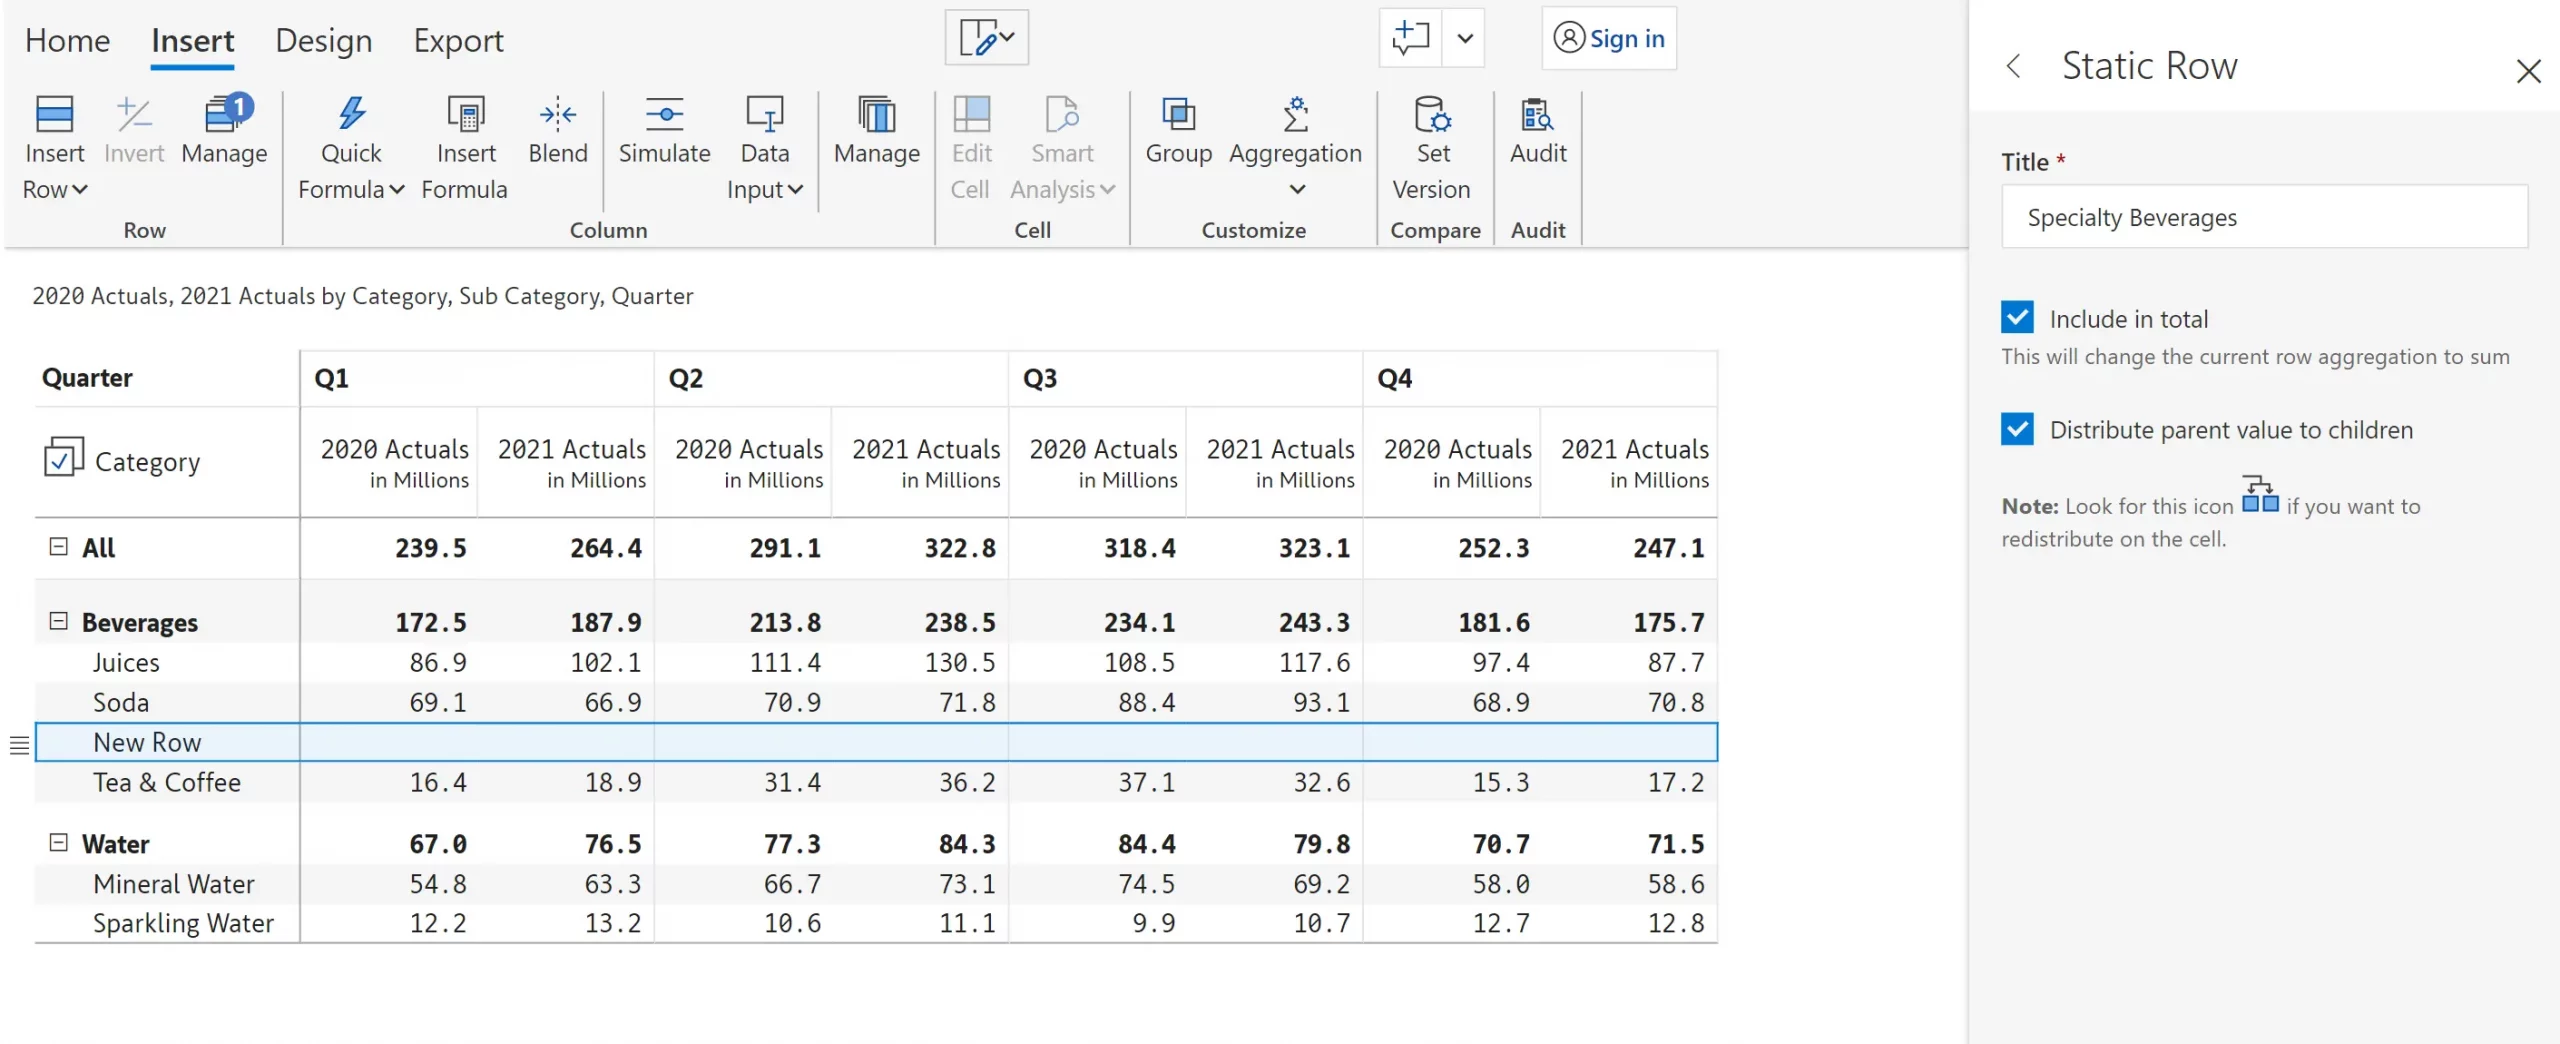
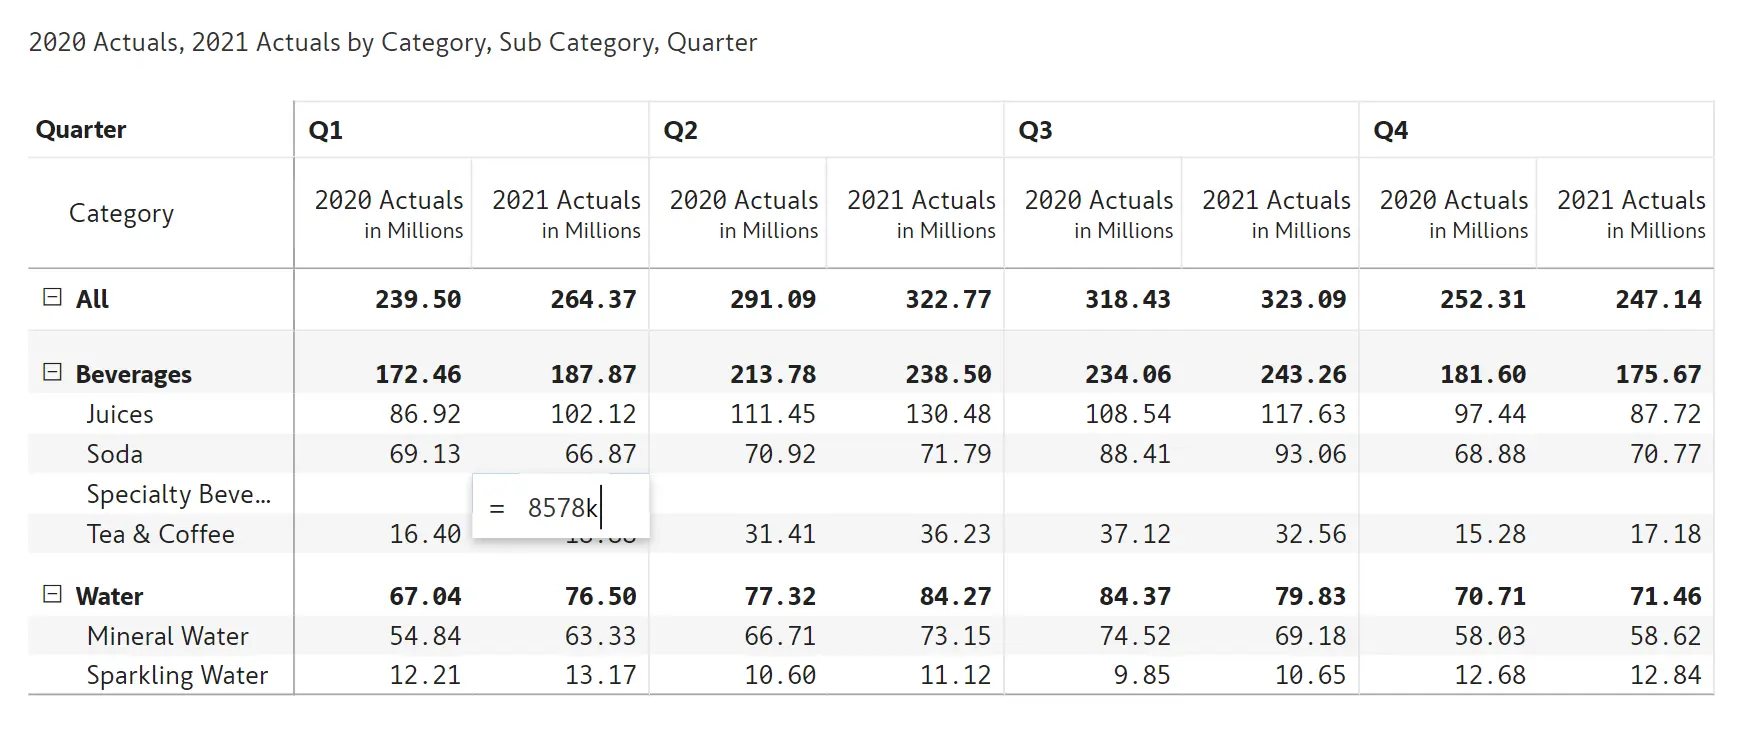
You will see an empty record created right beneath 'Tea and Coffee', the row that was originally selected prior to the 'Insert Row' operation. Type in a value against 2021 Actuals, say 8578k. Note that Inforiver allows entry of scaled values (e.g. 45.3m instead of 45,300,000).
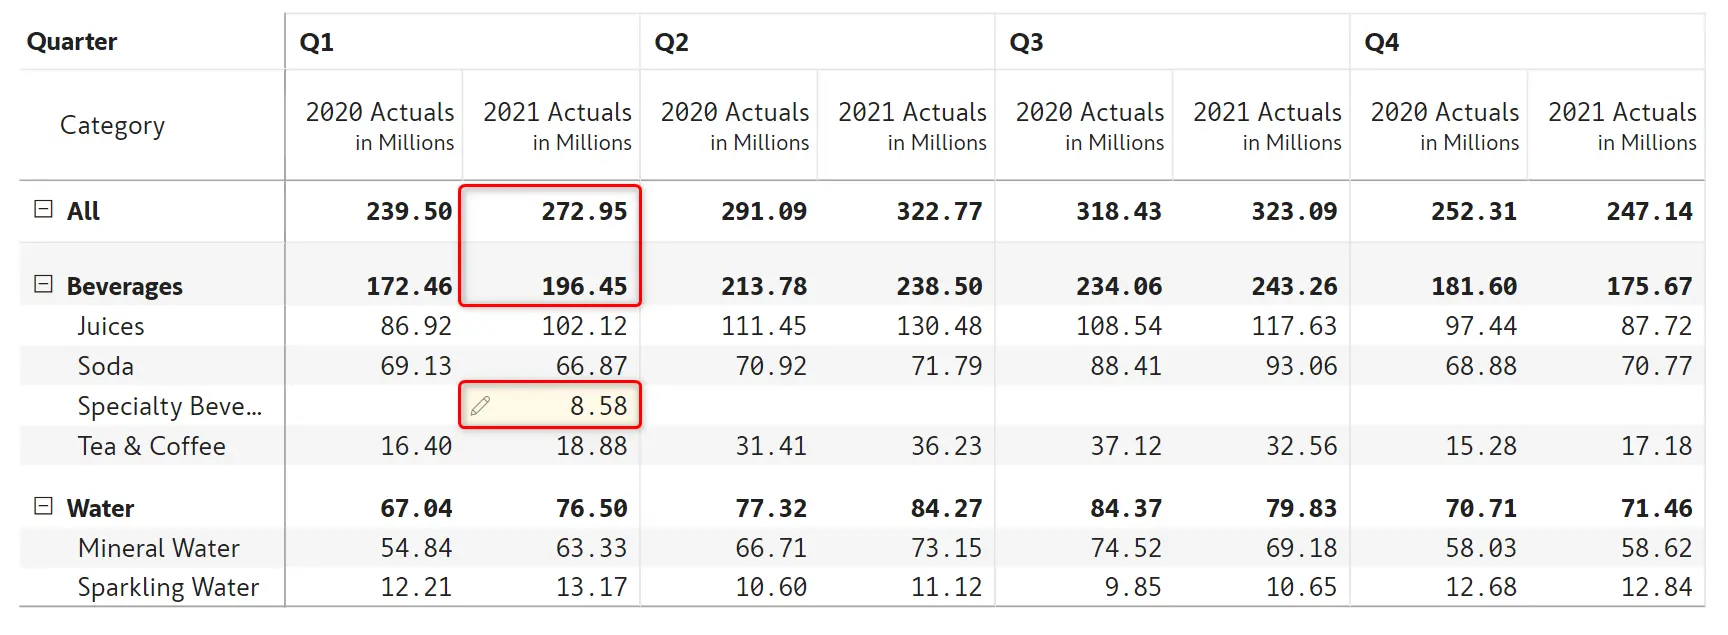
Now press the Enter key or tab out. This converts the value to the default measure scale, which is in millions (as indicated in the header title). Also, the 'Beverages' and 'All' categories totals are also updated.
For downstream calculations, you can also use the option to insert rows using the Static Row option. Choose 'Calculated Row' instead of 'Static Row' in the very first step.
To learn more, check out the blogs on 5 types of manual data entry options and inserting calculated columns/measures.
Curious about Inforiver? Read why Matt Allington (Self Service BI Expert + Microsoft MVP) , Excelerator BI prefers Inforiver over the Analyze in Excel capability that comes with Power BI for ad-hoc analysis.
Explore Forecasting in Power BI here.
Related Power BI Ideas: Need ability to add a row to a table and manually type in the data

Inforiver helps enterprises consolidate planning, reporting & analytics on a single platform (Power BI). The no-code, self-service award-winning platform has been recognized as the industry’s best and is adopted by many Fortune 100 firms.
Inforiver is a product of Lumel, the #1 Power BI AppSource Partner. The firm serves over 3,000 customers worldwide through its portfolio of products offered under the brands Inforiver, EDITable, ValQ, and xViz.