Upcoming webinar on 'Inforiver Charts : The fastest way to deliver stories in Power BI', Aug 29th , Monday, 10.30 AM CST. Register Now
Upcoming webinar on 'Inforiver Charts : The fastest way to deliver stories in Power BI', Aug 29th , Monday, 10.30 AM CST. Register Now
Welcome to the Inforiver Matrix December 2022 update. We are thrilled to announce several new features and key enhancements (for all the editions) most anticipated by our Inforiver community!
Key enhancements in this v1.8 release are listed below. Feel free to jump to any specific section for more details.
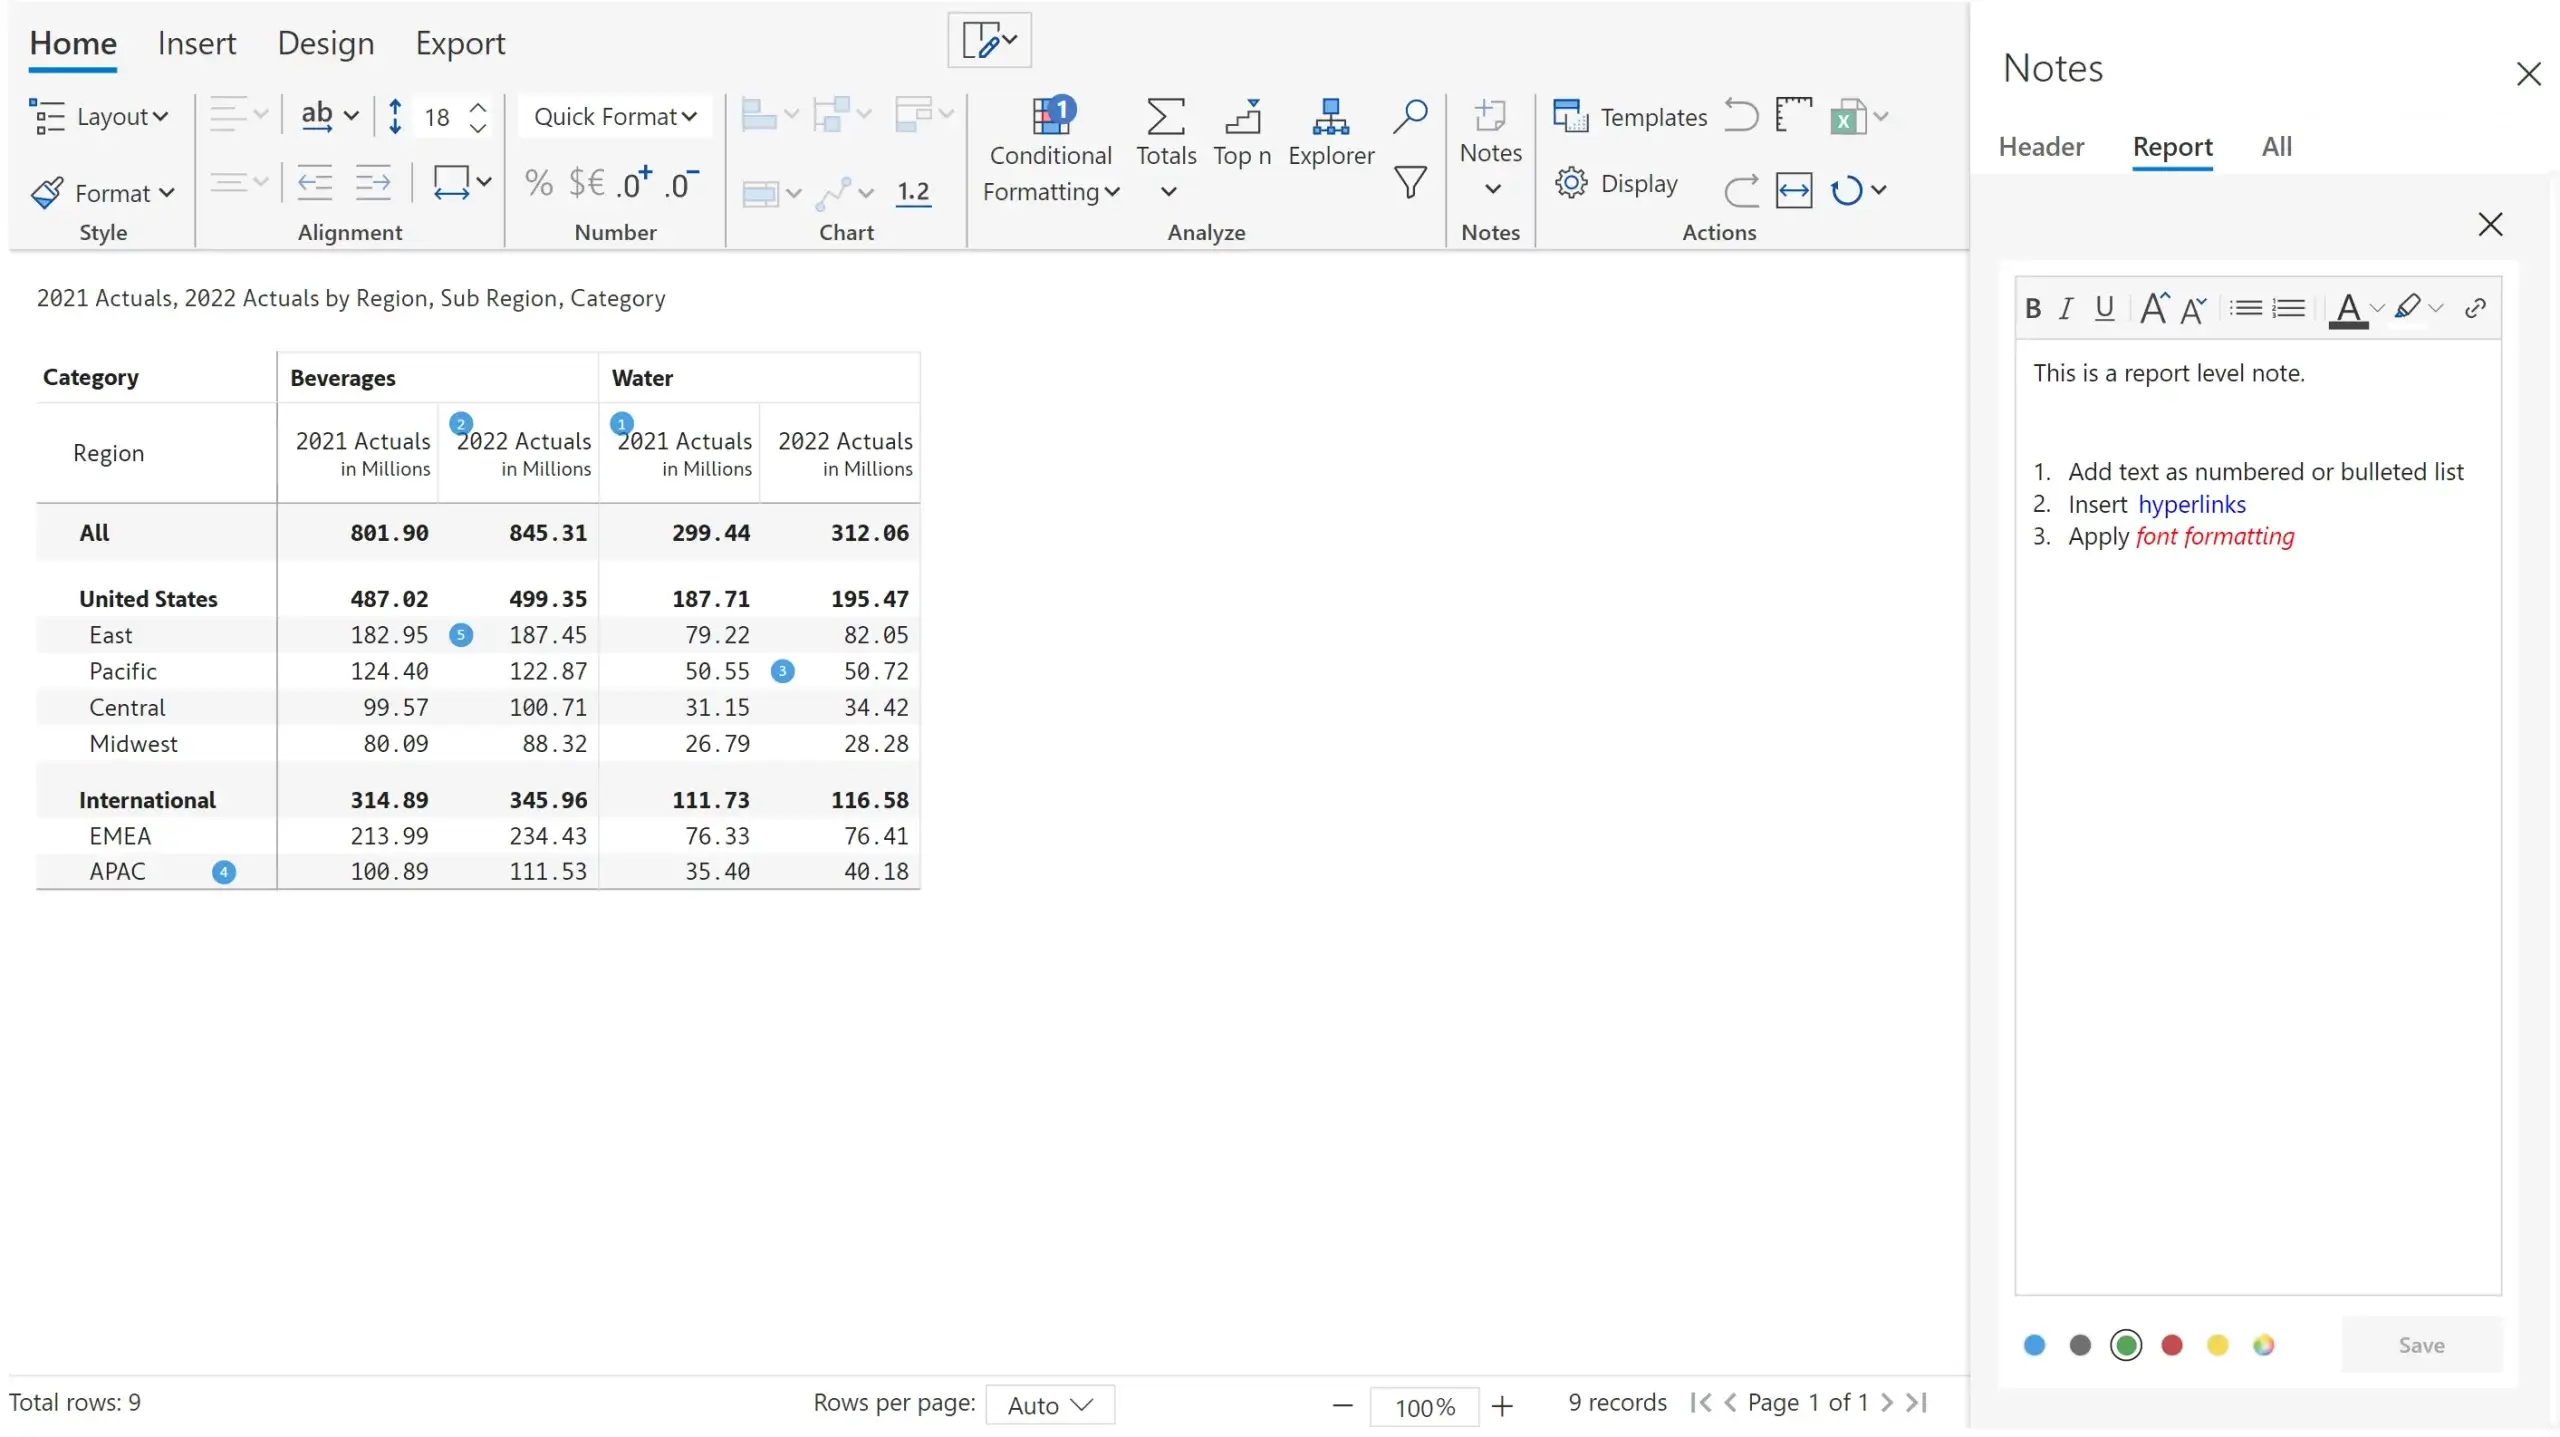
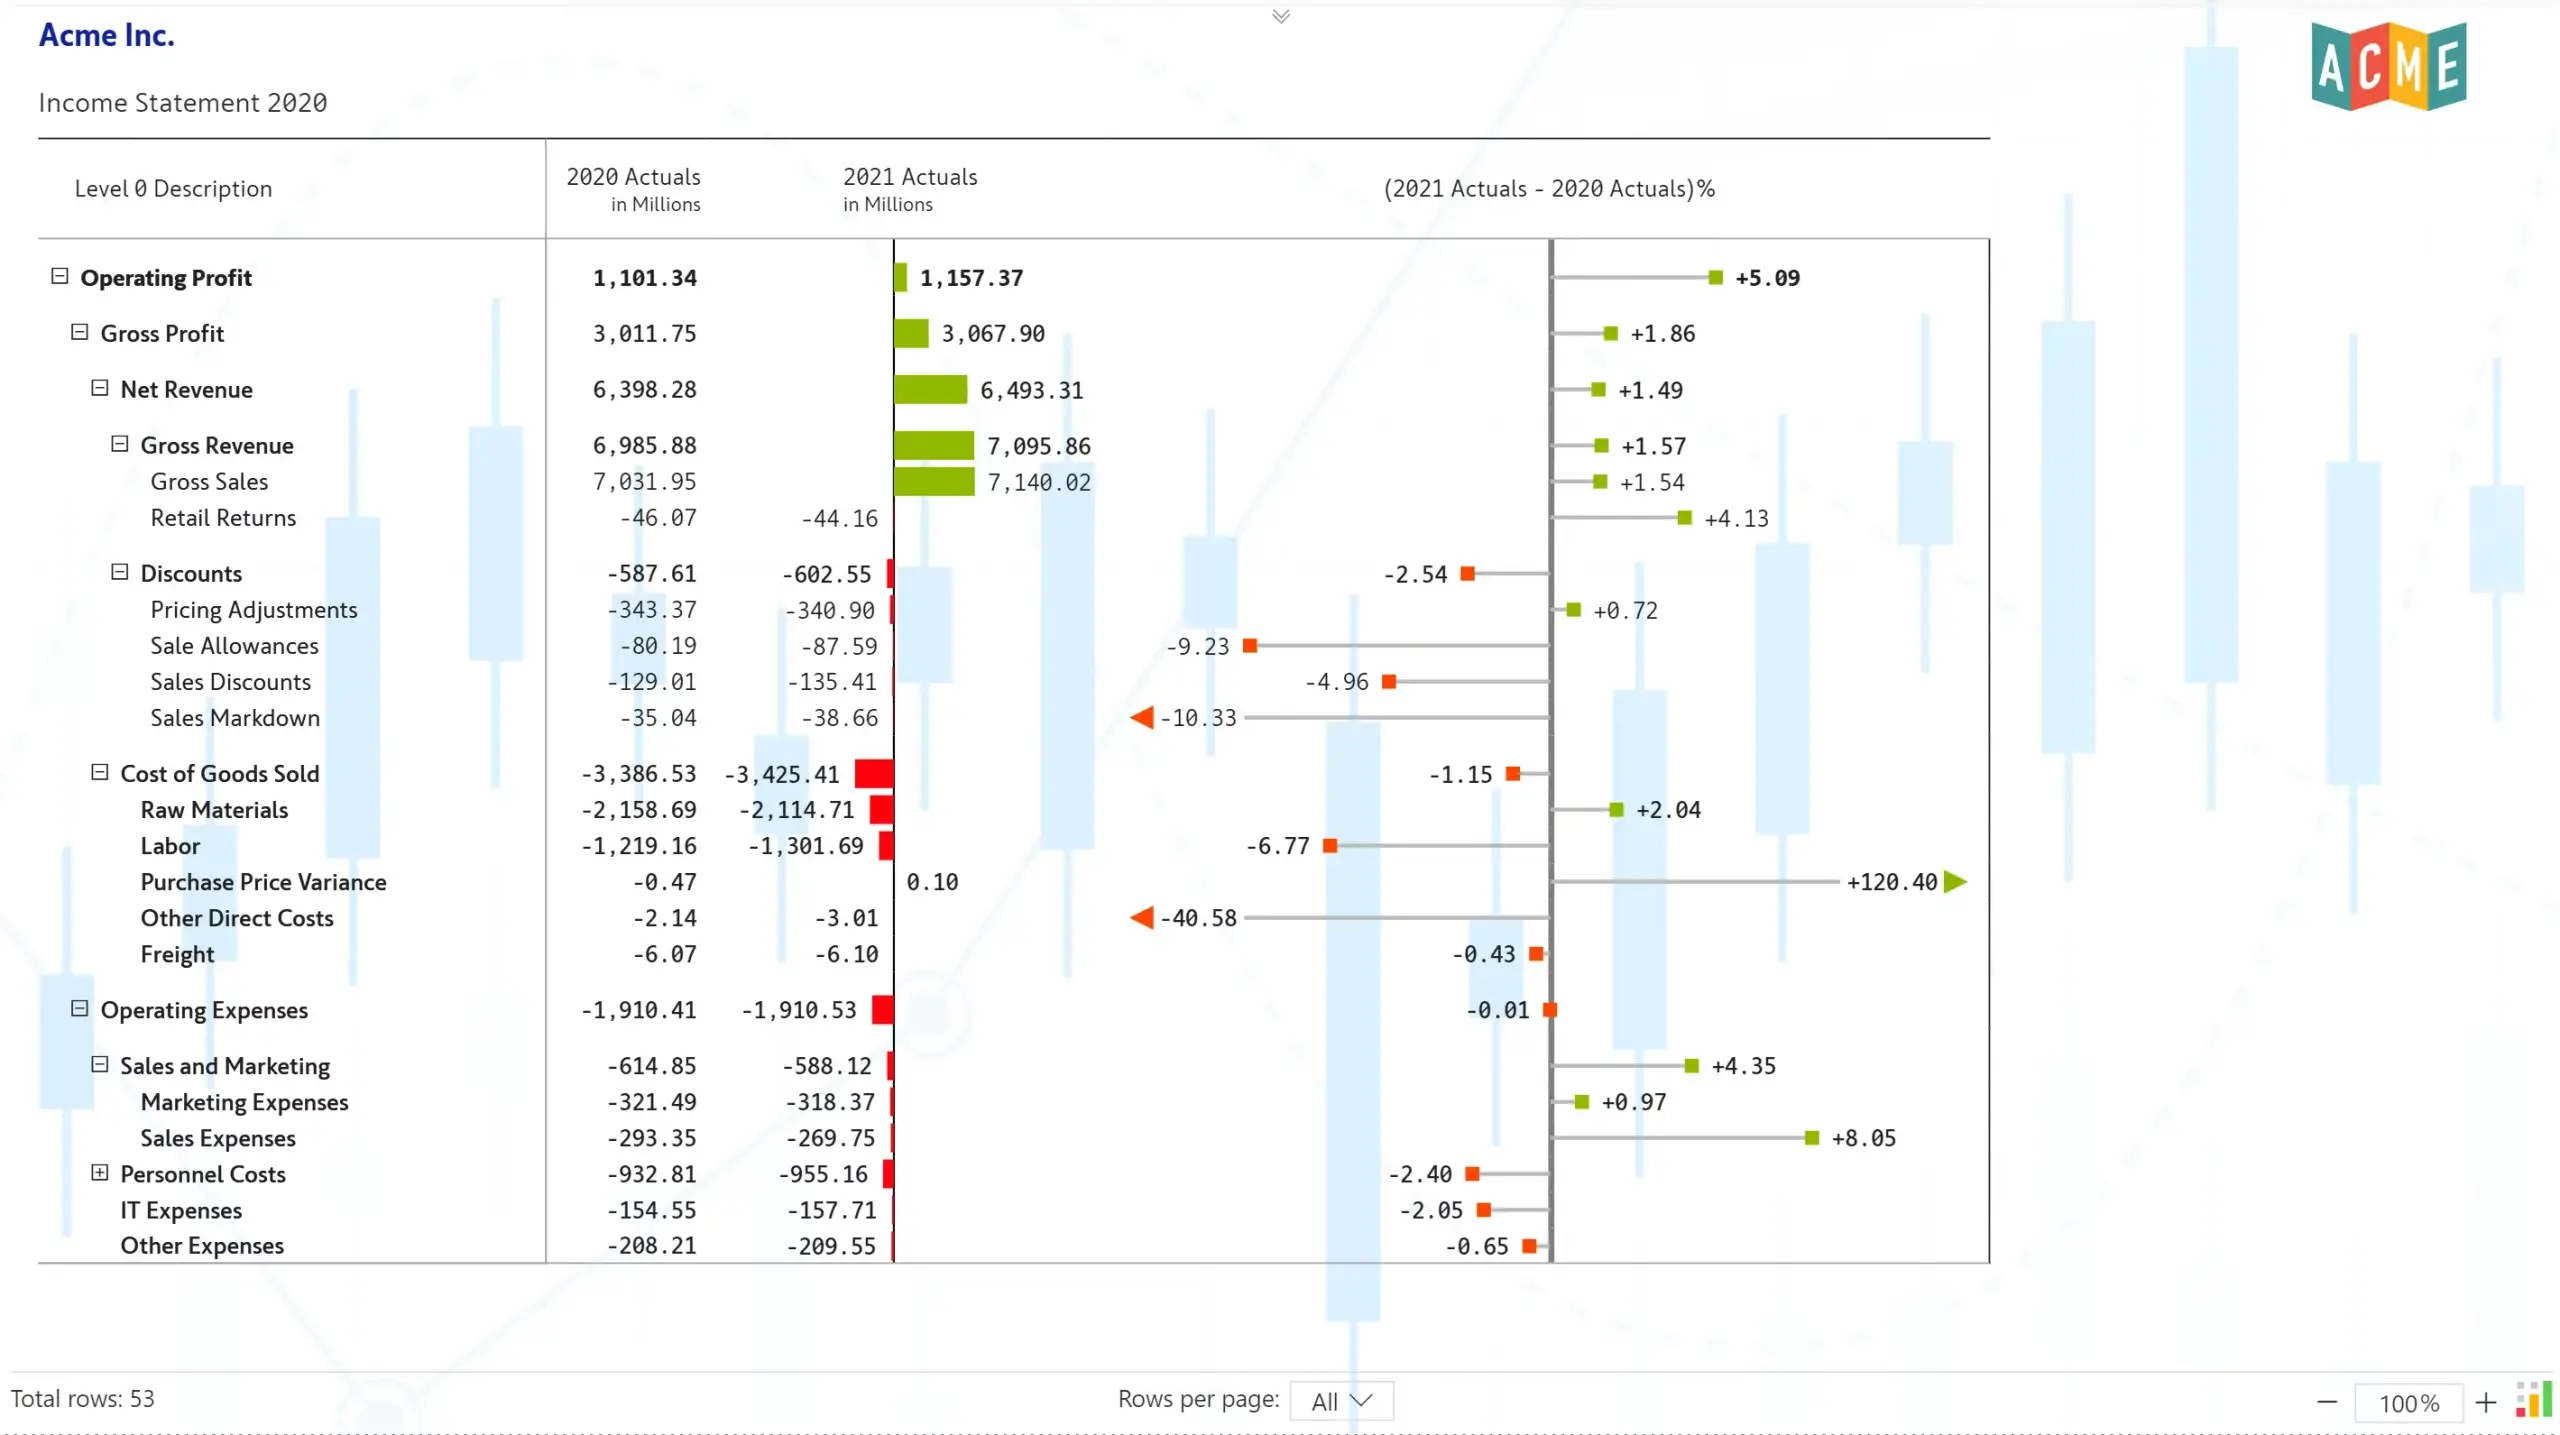
Inforiver’s notes capability has been revamped in the December version to include a lot of feature requests from customers.
You can now enter notes in a larger screen and add numbered/bulleted lists, hyperlinks and apply rich formatting.

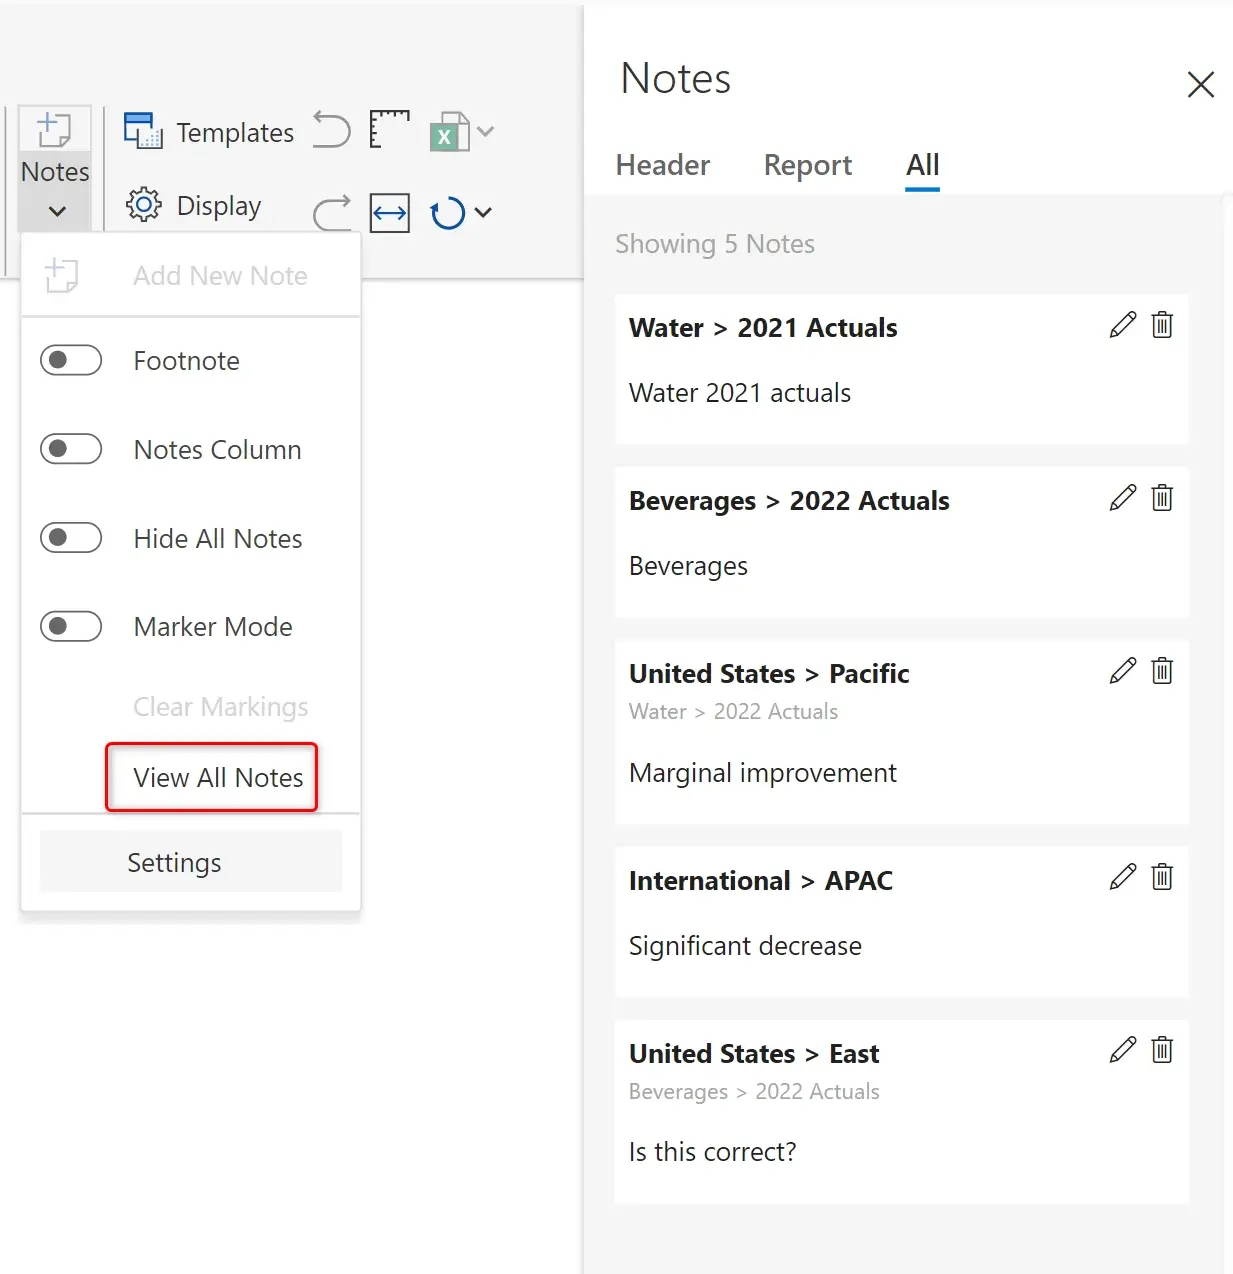
With Inforiver, you can also add notes and explanations at the report level as shown below.
‘View all notes’ option enables you to view all the notes in the measure level notes in the report.
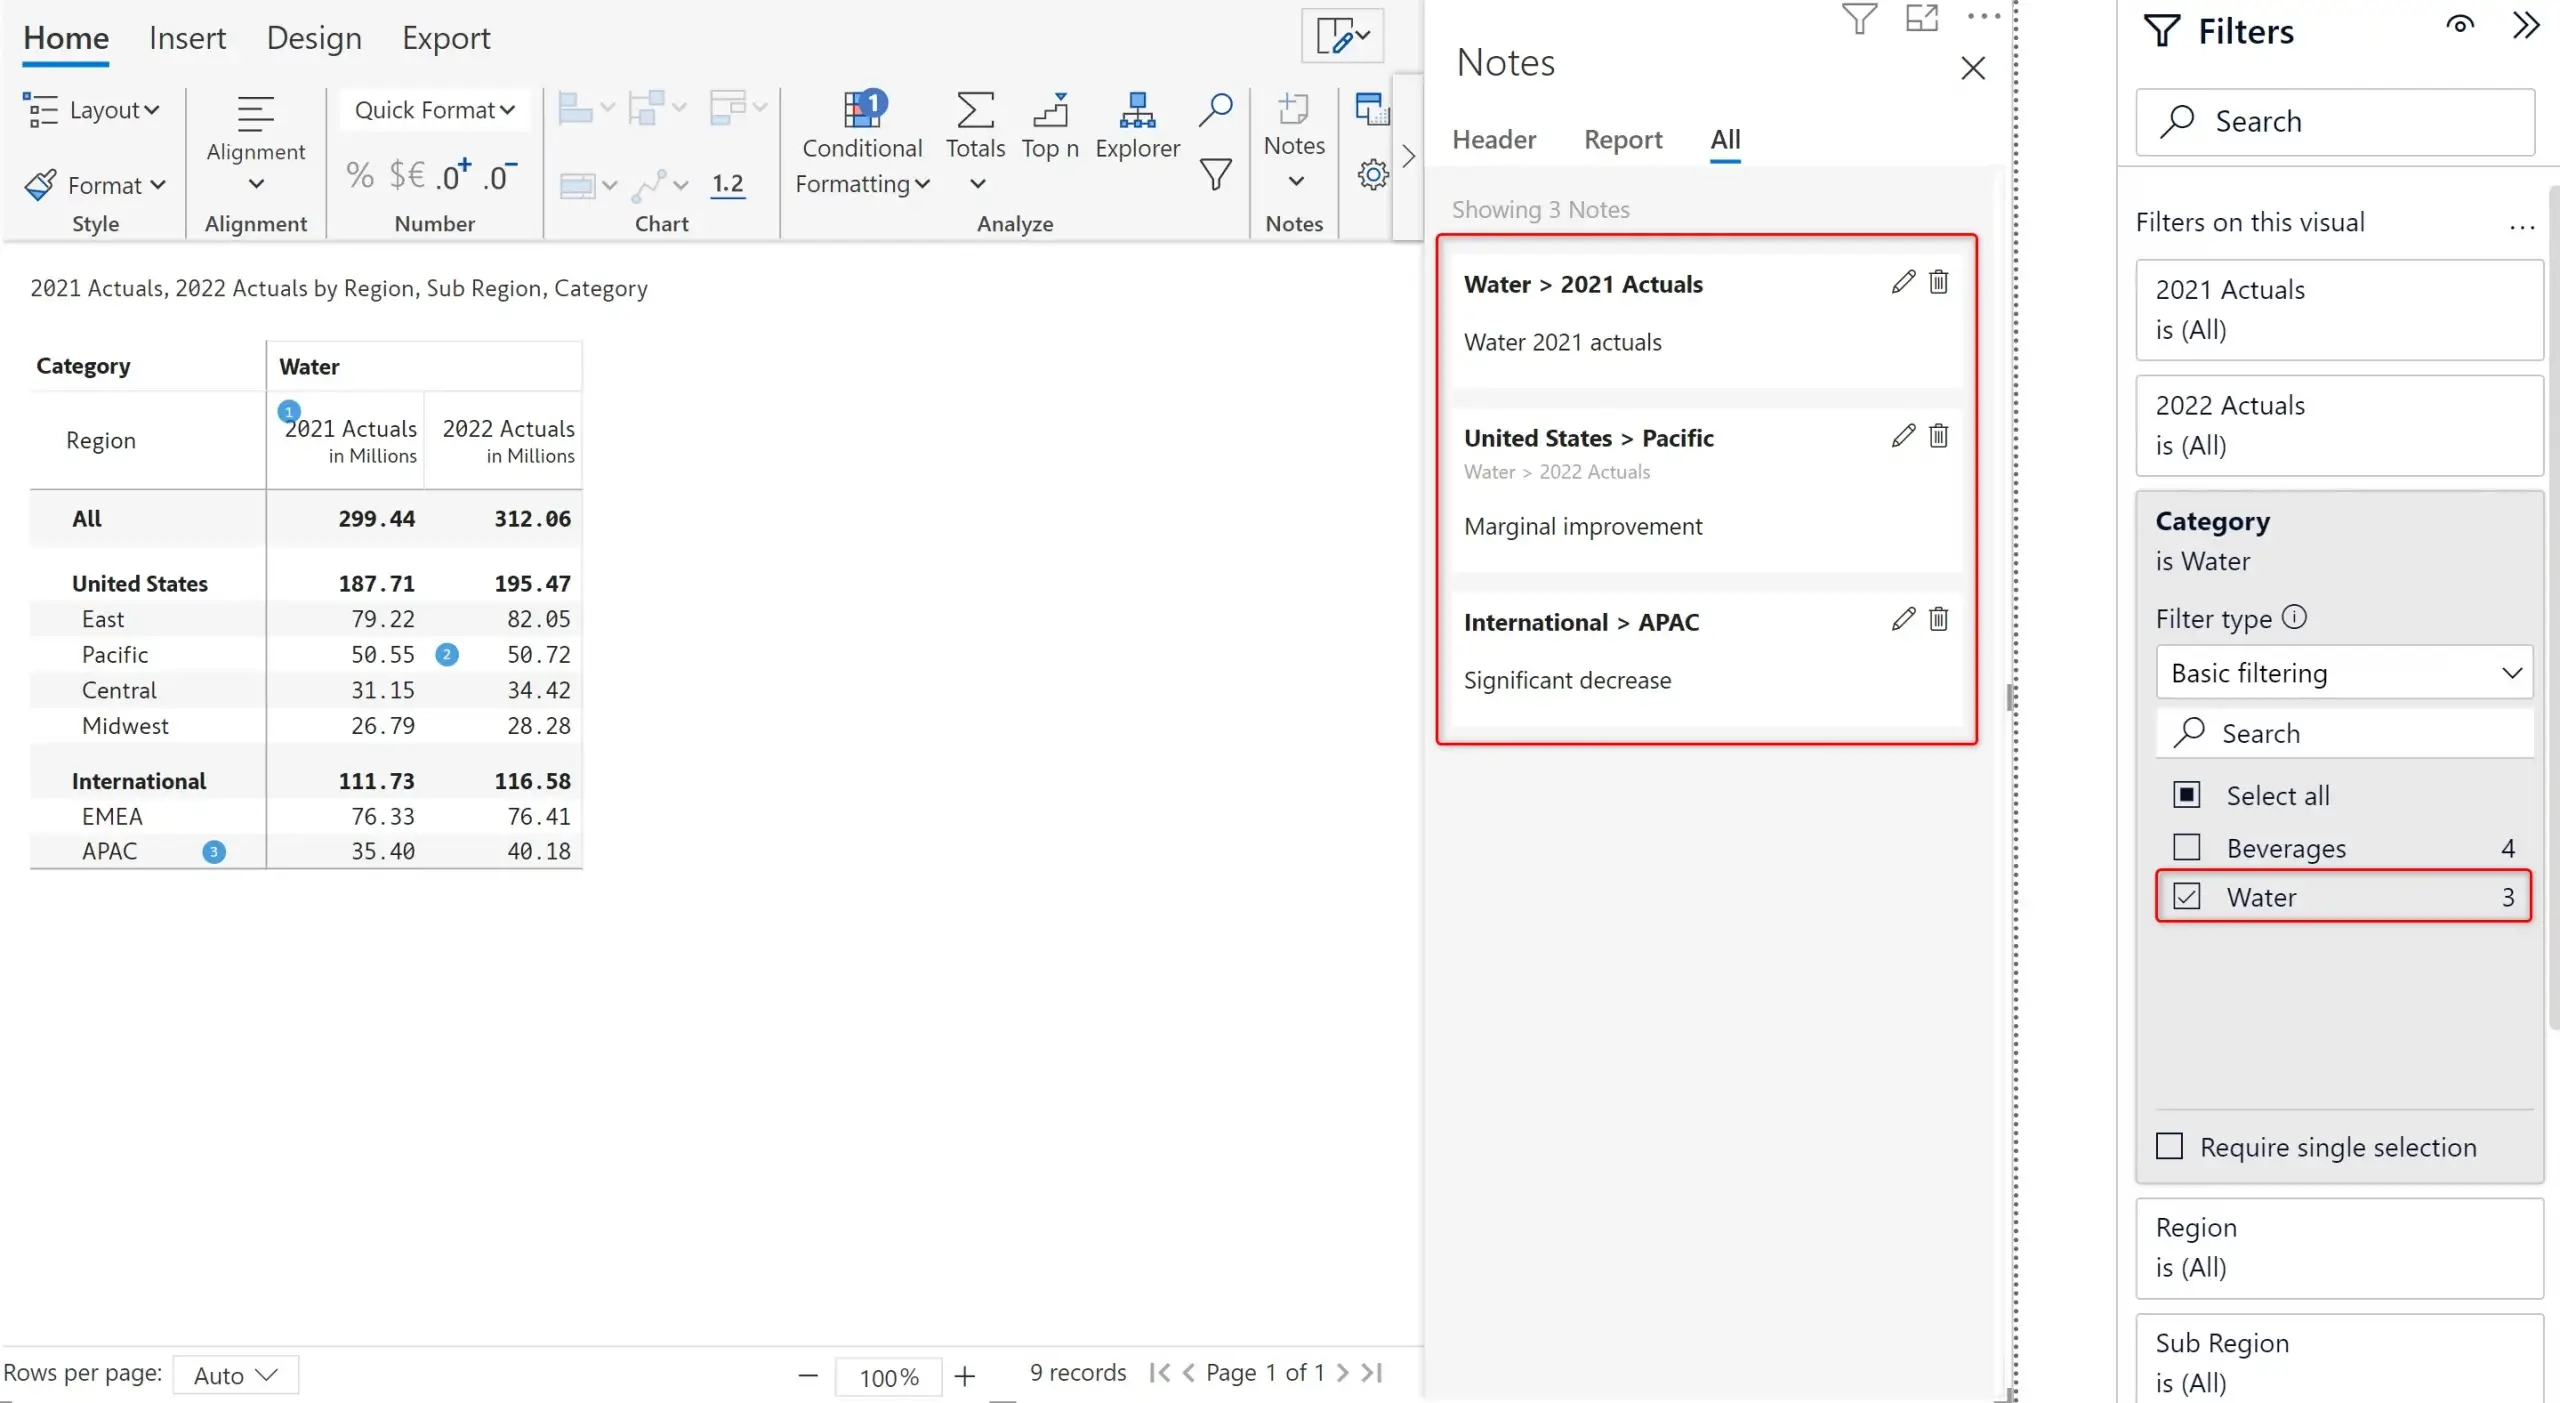
Inforiver also provides the ability to filter notes based on the Power BI filter selection. In the below image, filter Category to show only ‘Water’. The notes in Inforiver have been filtered accordingly.
Note that the field that is to be filtered must be added as part of the Inforiver visual.
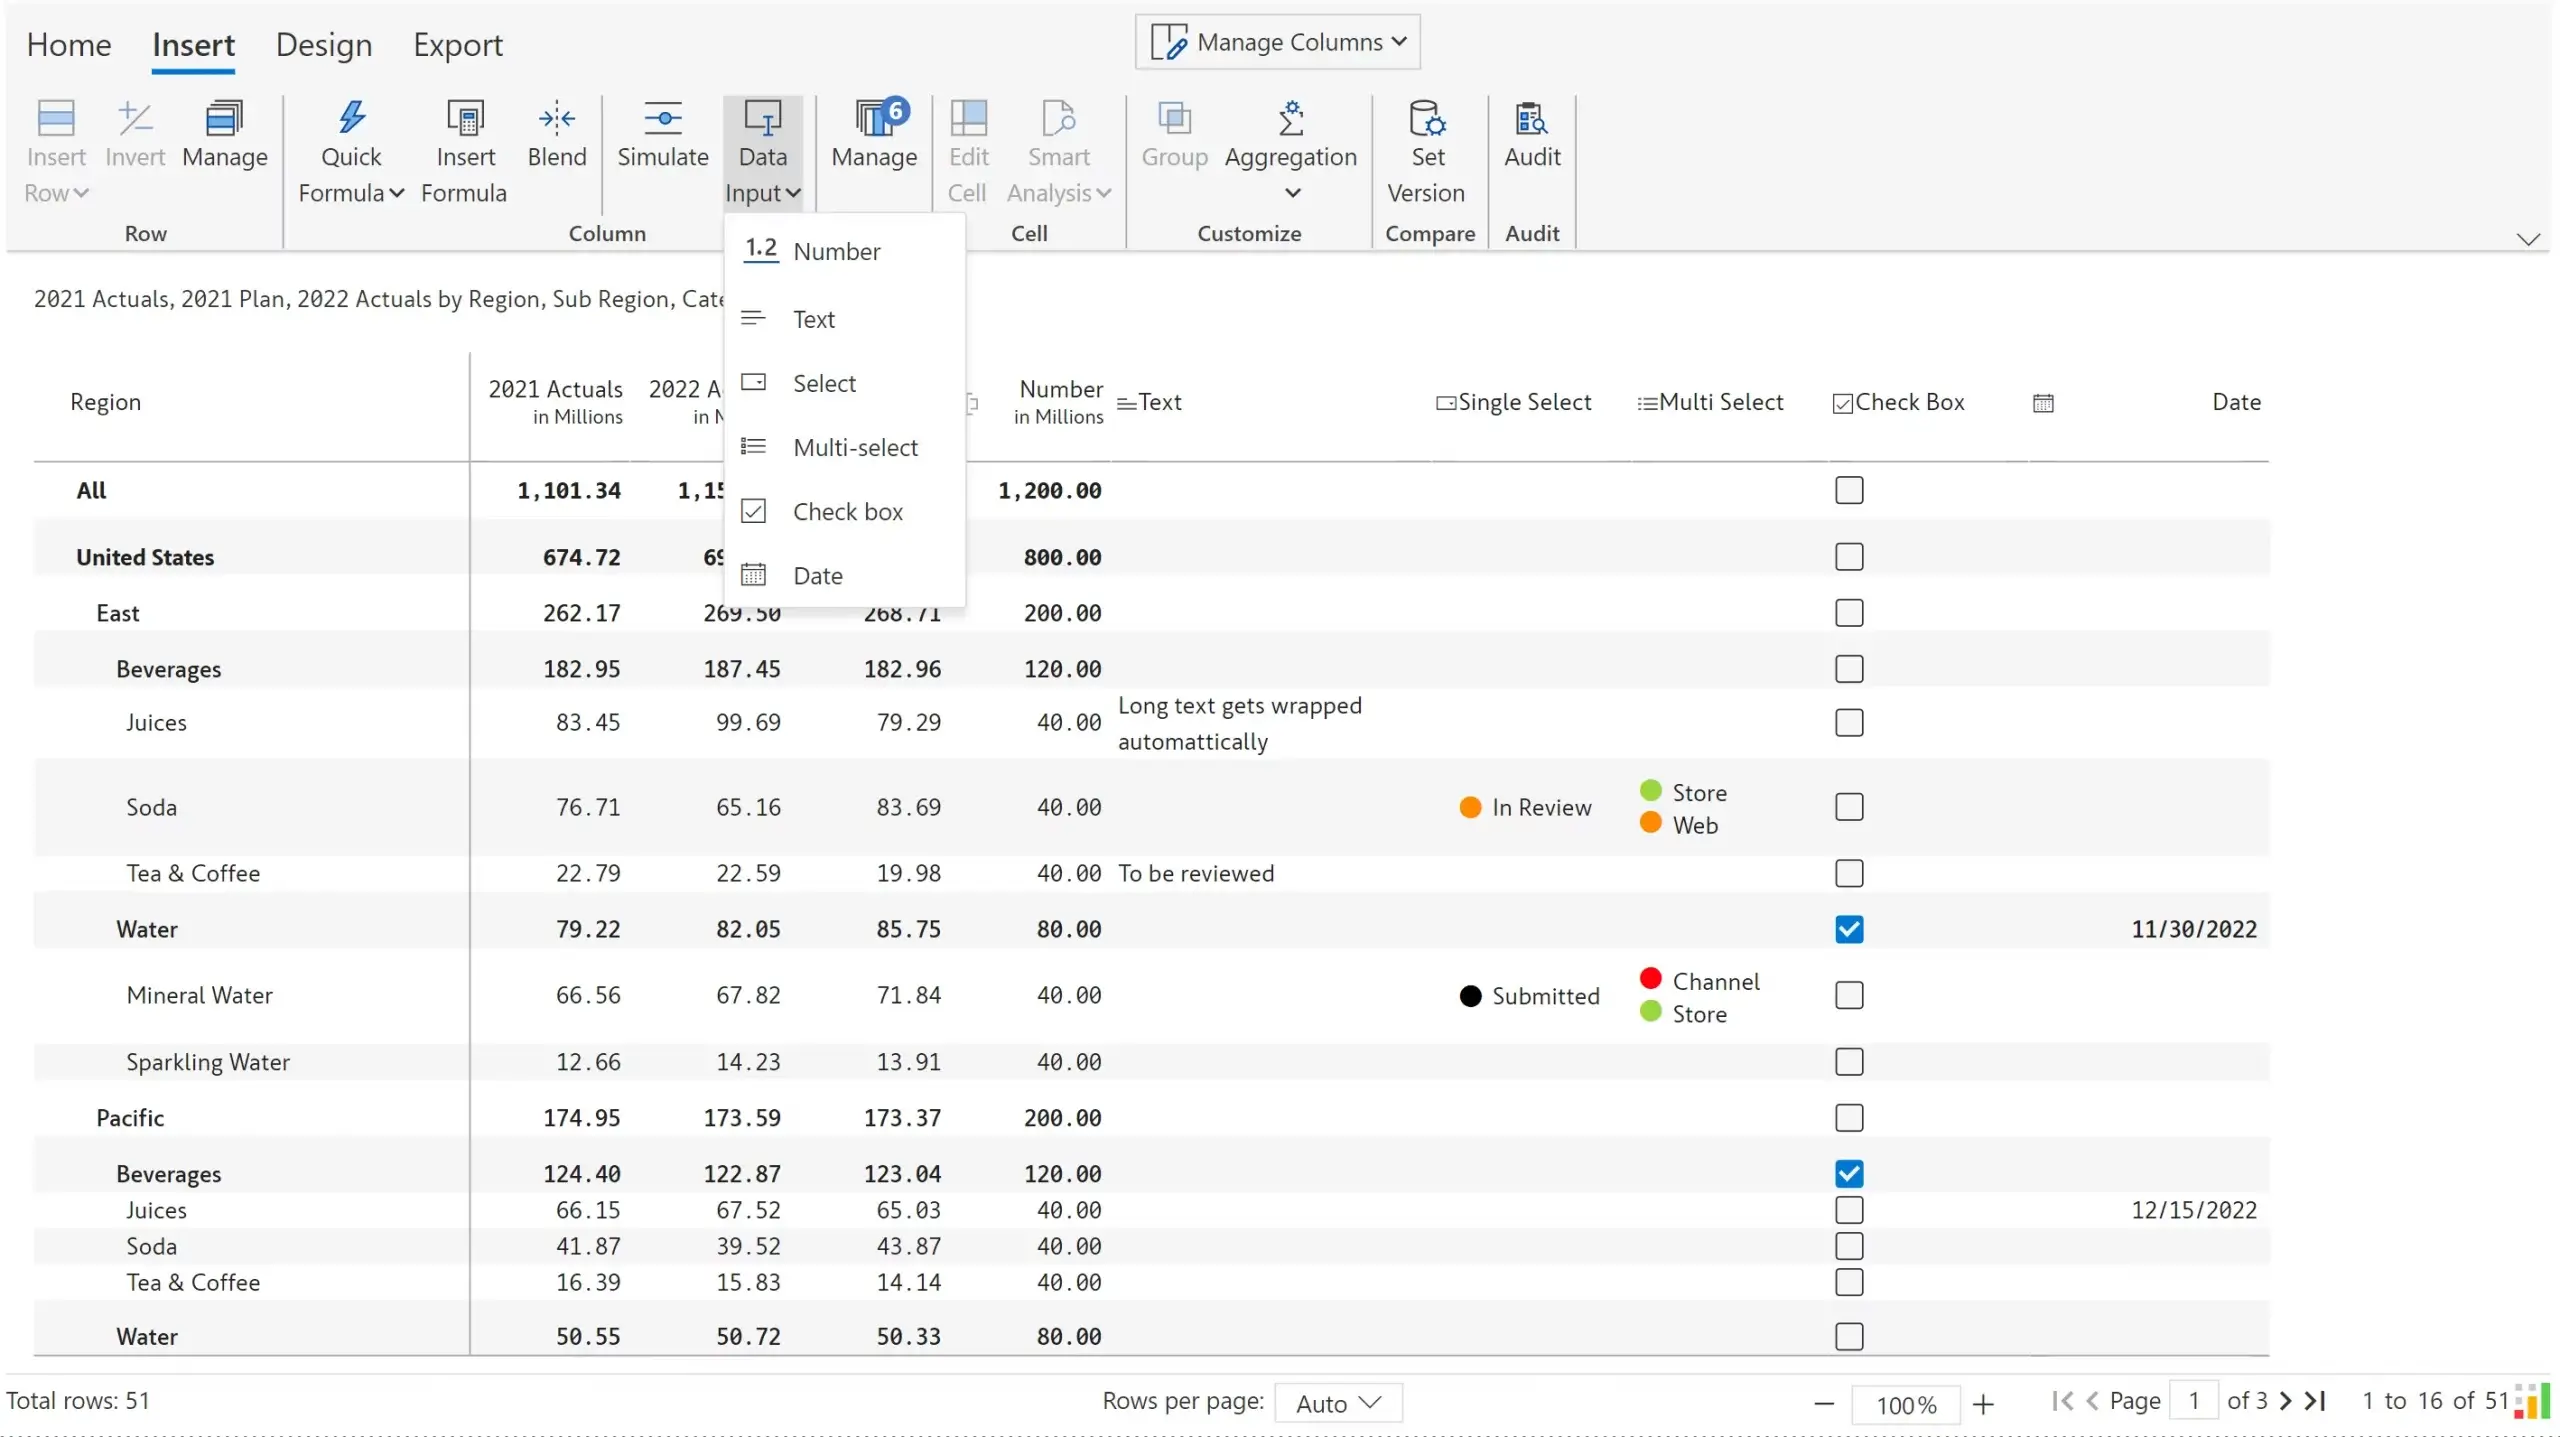
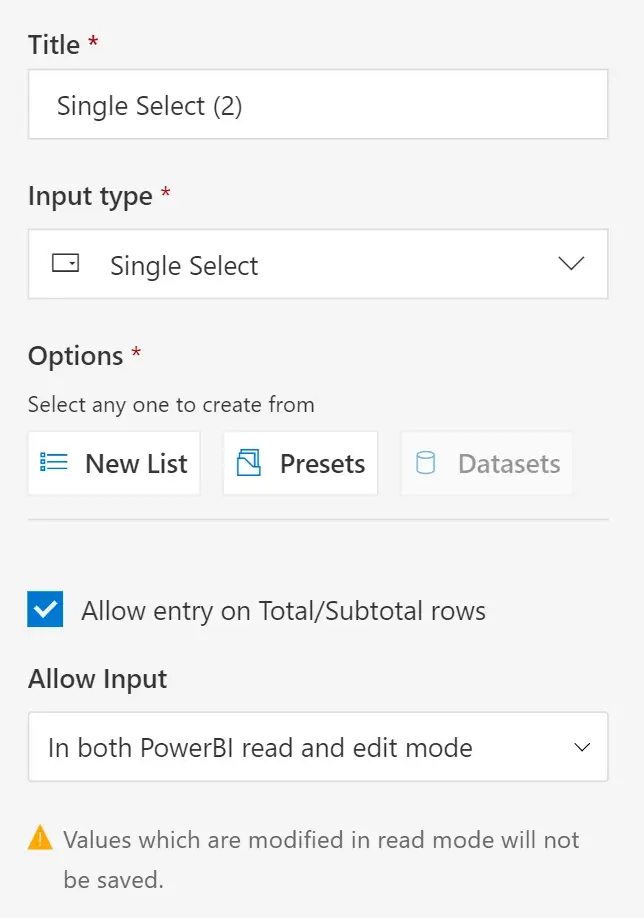
The December release of Inforiver Matrix introduces support for manual data input columns – text, dropdown, check box and date (which were previously available only in Inforiver Enterprise) as well as the ability to offer these input fields for report readers/viewers which is explained below in point 3 – Data input and simulations in reading view.
It must be noted that for the below listed points, Inforiver Enterprise needs to be used. In Inforiver Matrix, these options are either greyed out or shown as warnings.
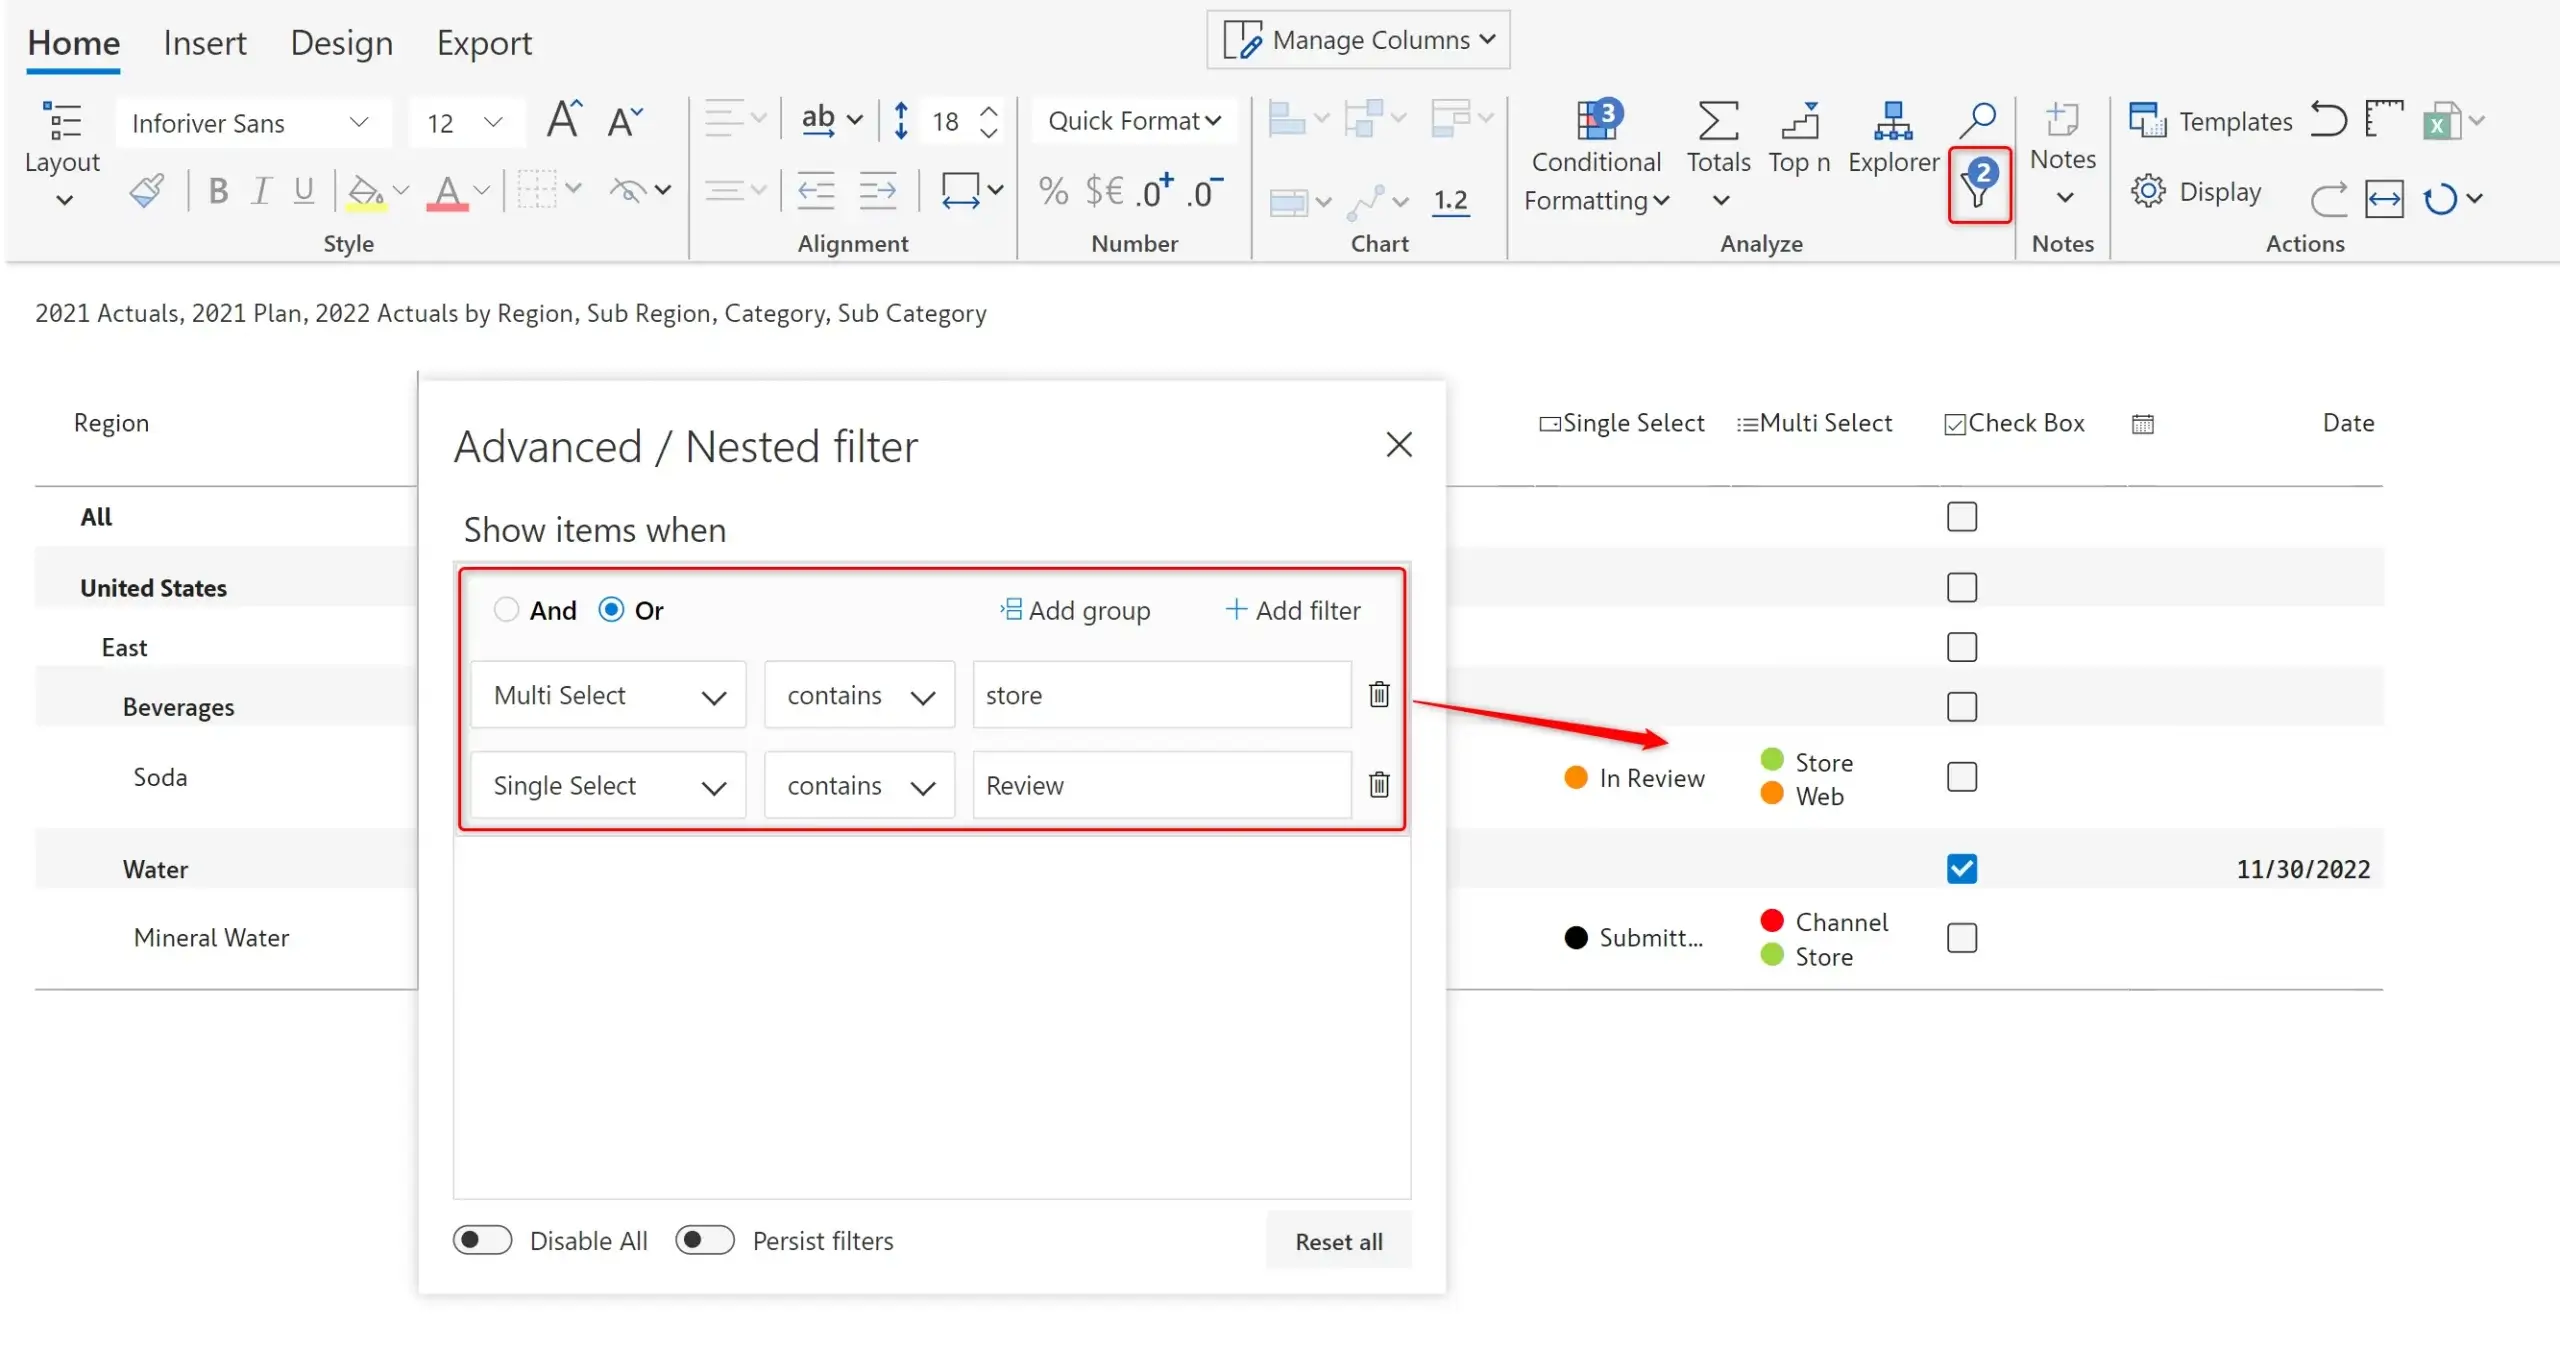
Data input columns can be filtered using the nested AND/OR filter as shown below.
Let’s consider a scenario – There is an overall budget for 2023 which is distributed to the regions based on 2022 Actuals. Certain regions and their sub-regions can have a fixed budget, and the budget has to be reallocated once these changes are made.
This can be easily achieved using Inforiver Matrix as shown below.
a) Insert a numeric data input column for 2023 Budget as shown below. Enter the budget 1.2b and distribute by 2022 Actuals.
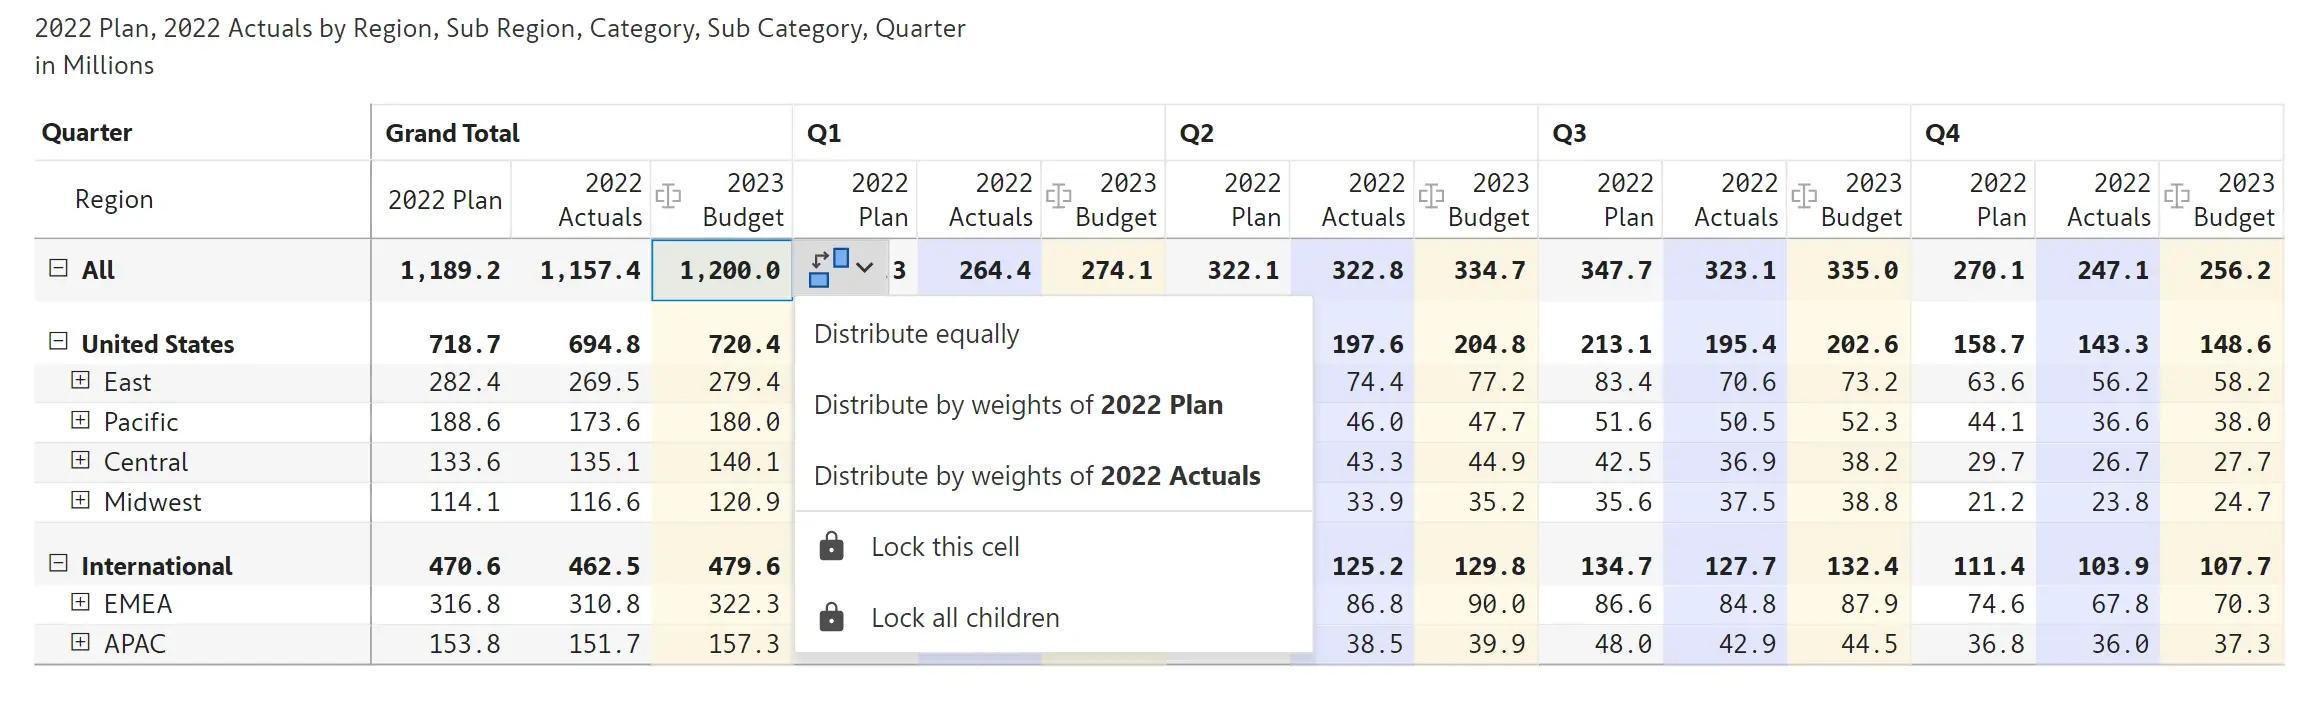
b) Update the budgets for Pacific and Midwest and lock the cells.
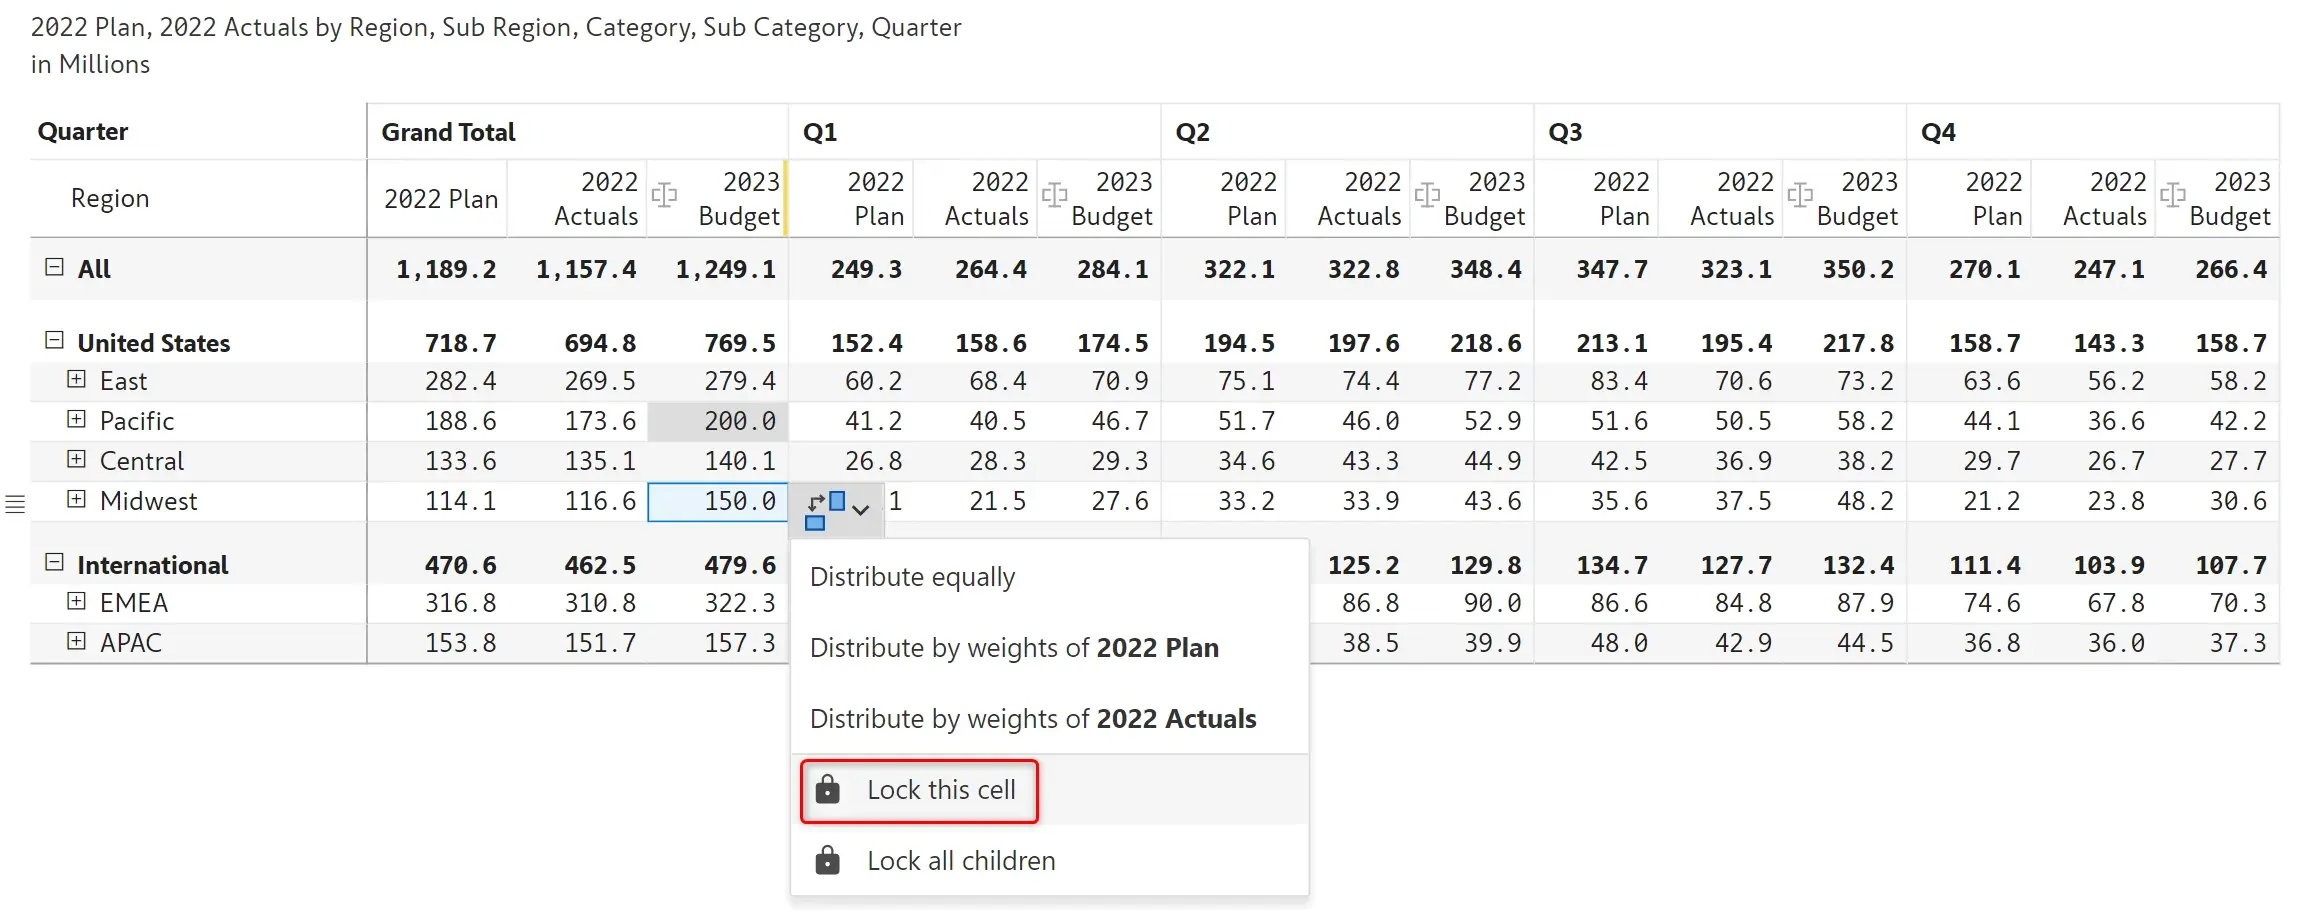
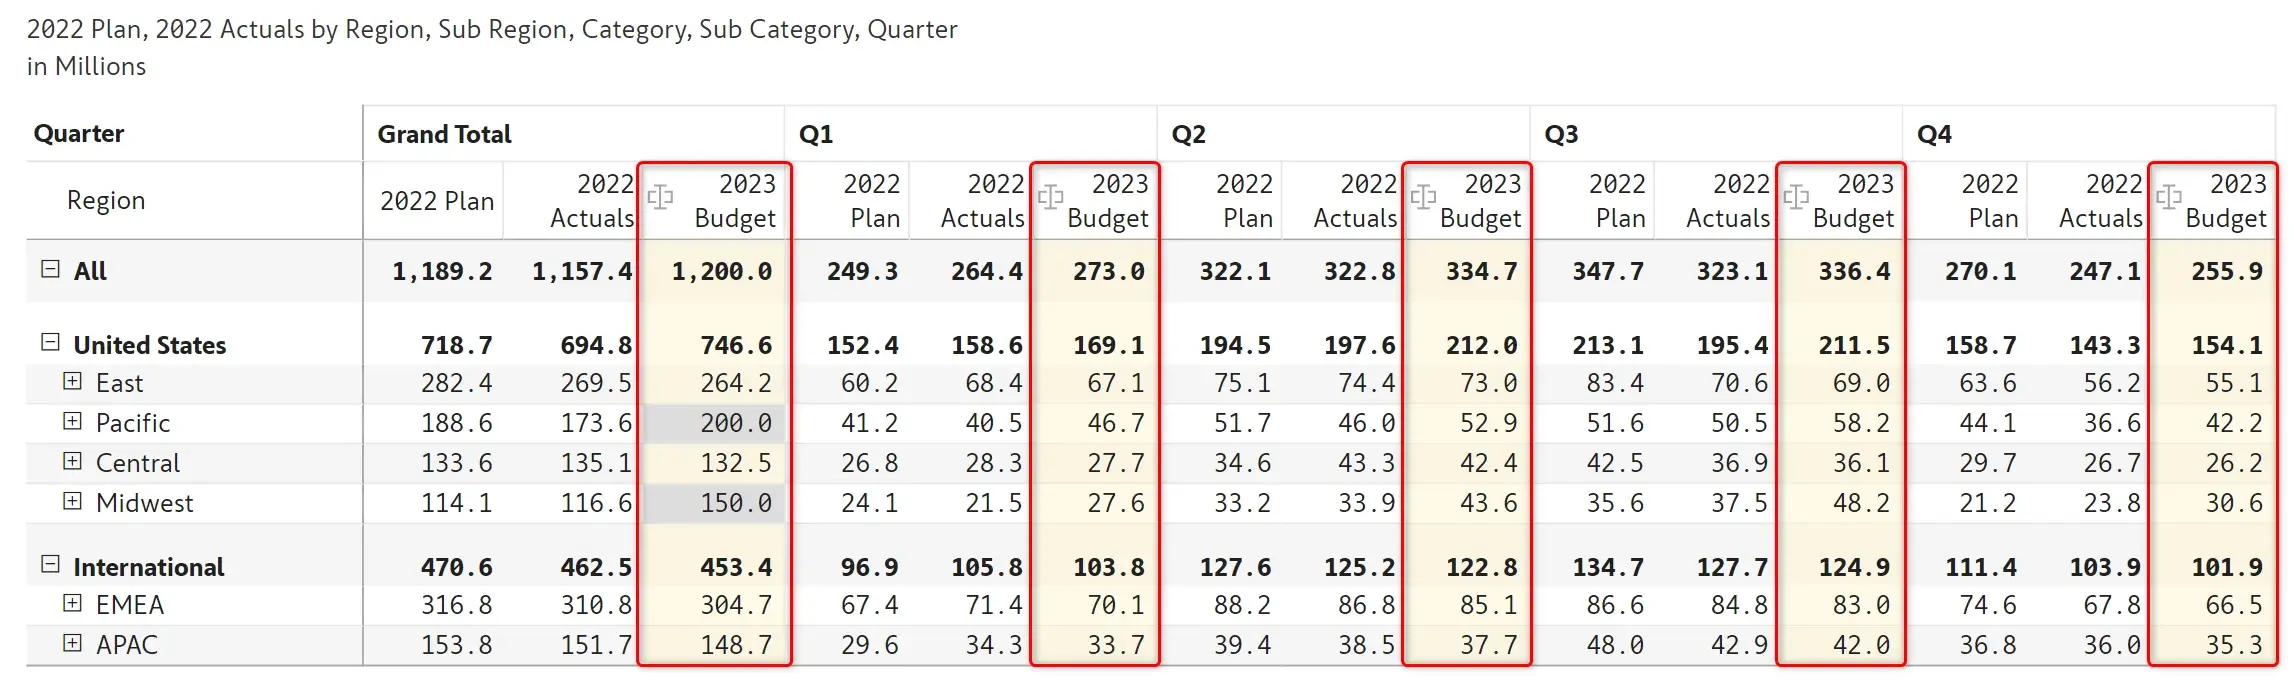
c) The overall budget has increased to 1249.1m, let’s enter 1.2b again as the overall budget. The budgets get redistributed as shown below.
You can also lock at the subtotal level which would freeze the values including all children using the ‘Lock all children’ option.
Similarly, simulations can also be locked at a cell level. In the below example, Pacific is increased by 10% and locked.
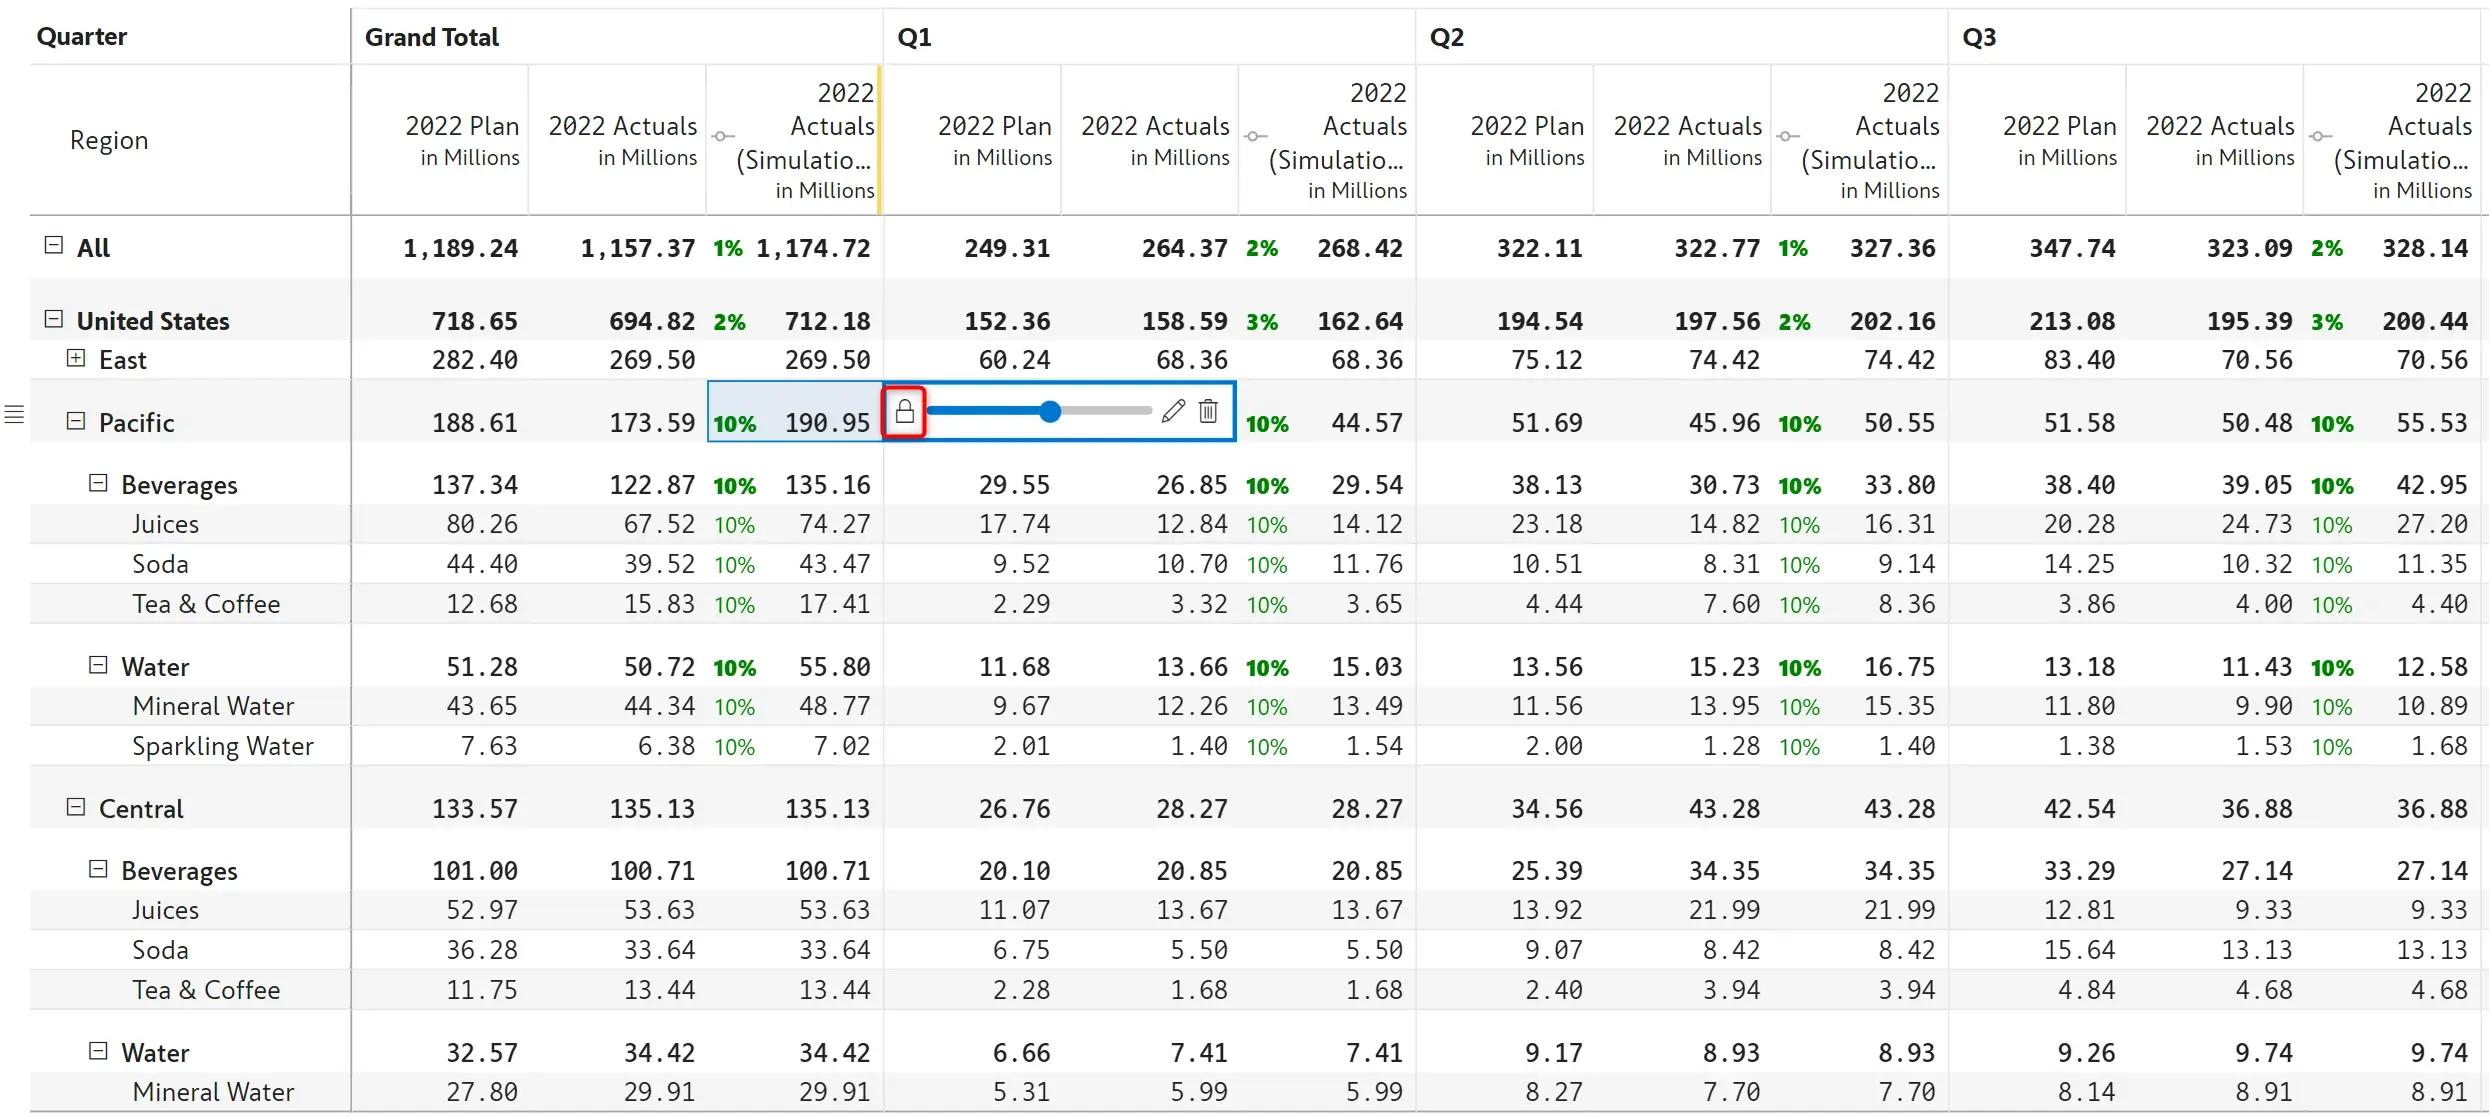
When one of the sub categories – Juices, is updated to 7%, simulations for the other sub categories get adjusted to maintain the 10% increase for Pacific.

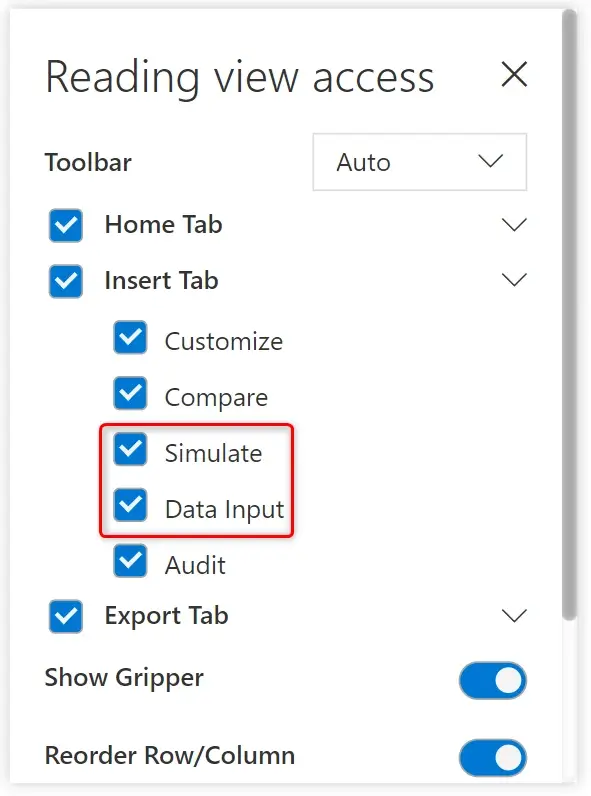
With the Inforiver Premium Matrix 1.8 release, the report viewer would be able to derive a lot more value out of Inforiver. They can perform data input, simulations, 1-click variance analysis, notes, annotations and more which is explained in this video. Note that these changes can’t be saved, but it can be exported as an Excel and shared with other users.
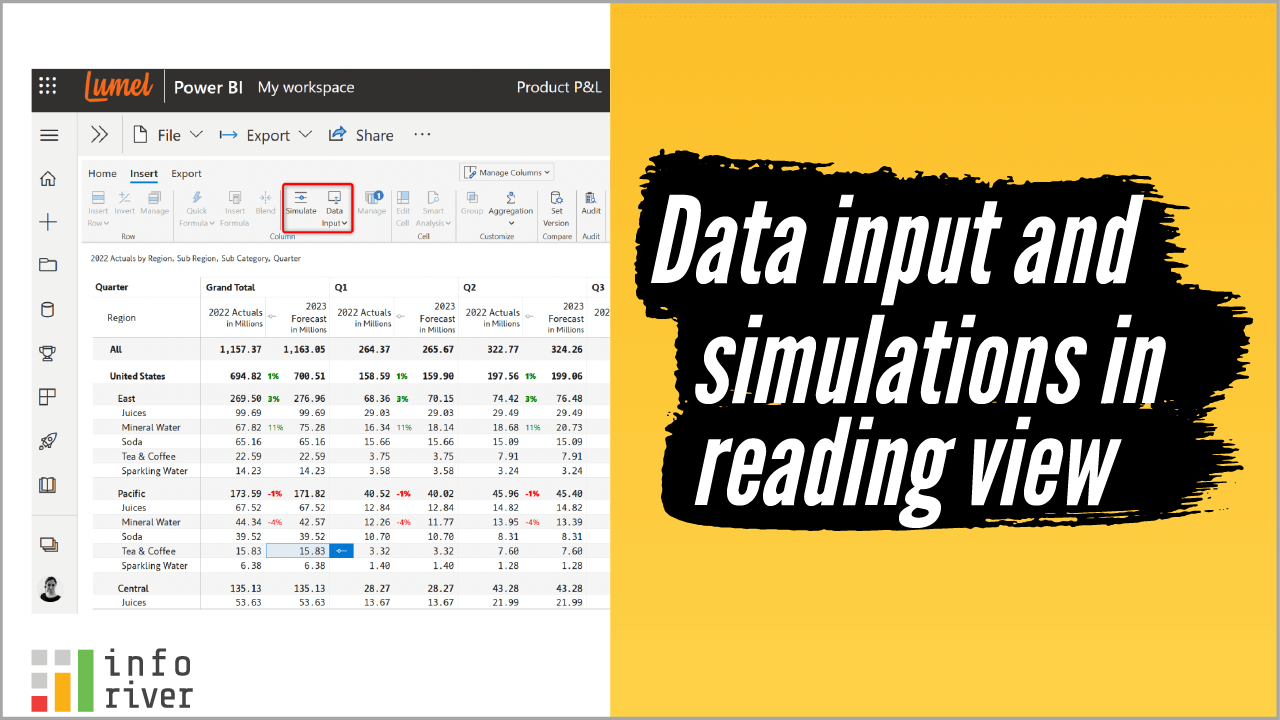
The ability to offer this insert capability - data input and simulate - can be turned on/off using the reading view access.
This enables organizations purchasing the premium developer – unlimited viewer licenses to allow the report viewers to leverage important functionalities.
It is now possible to insert dynamic titles based on Power BI slicer selection.
In this example, selections in the Brand Name and Product Category slicers are reflected in the Inforiver header.
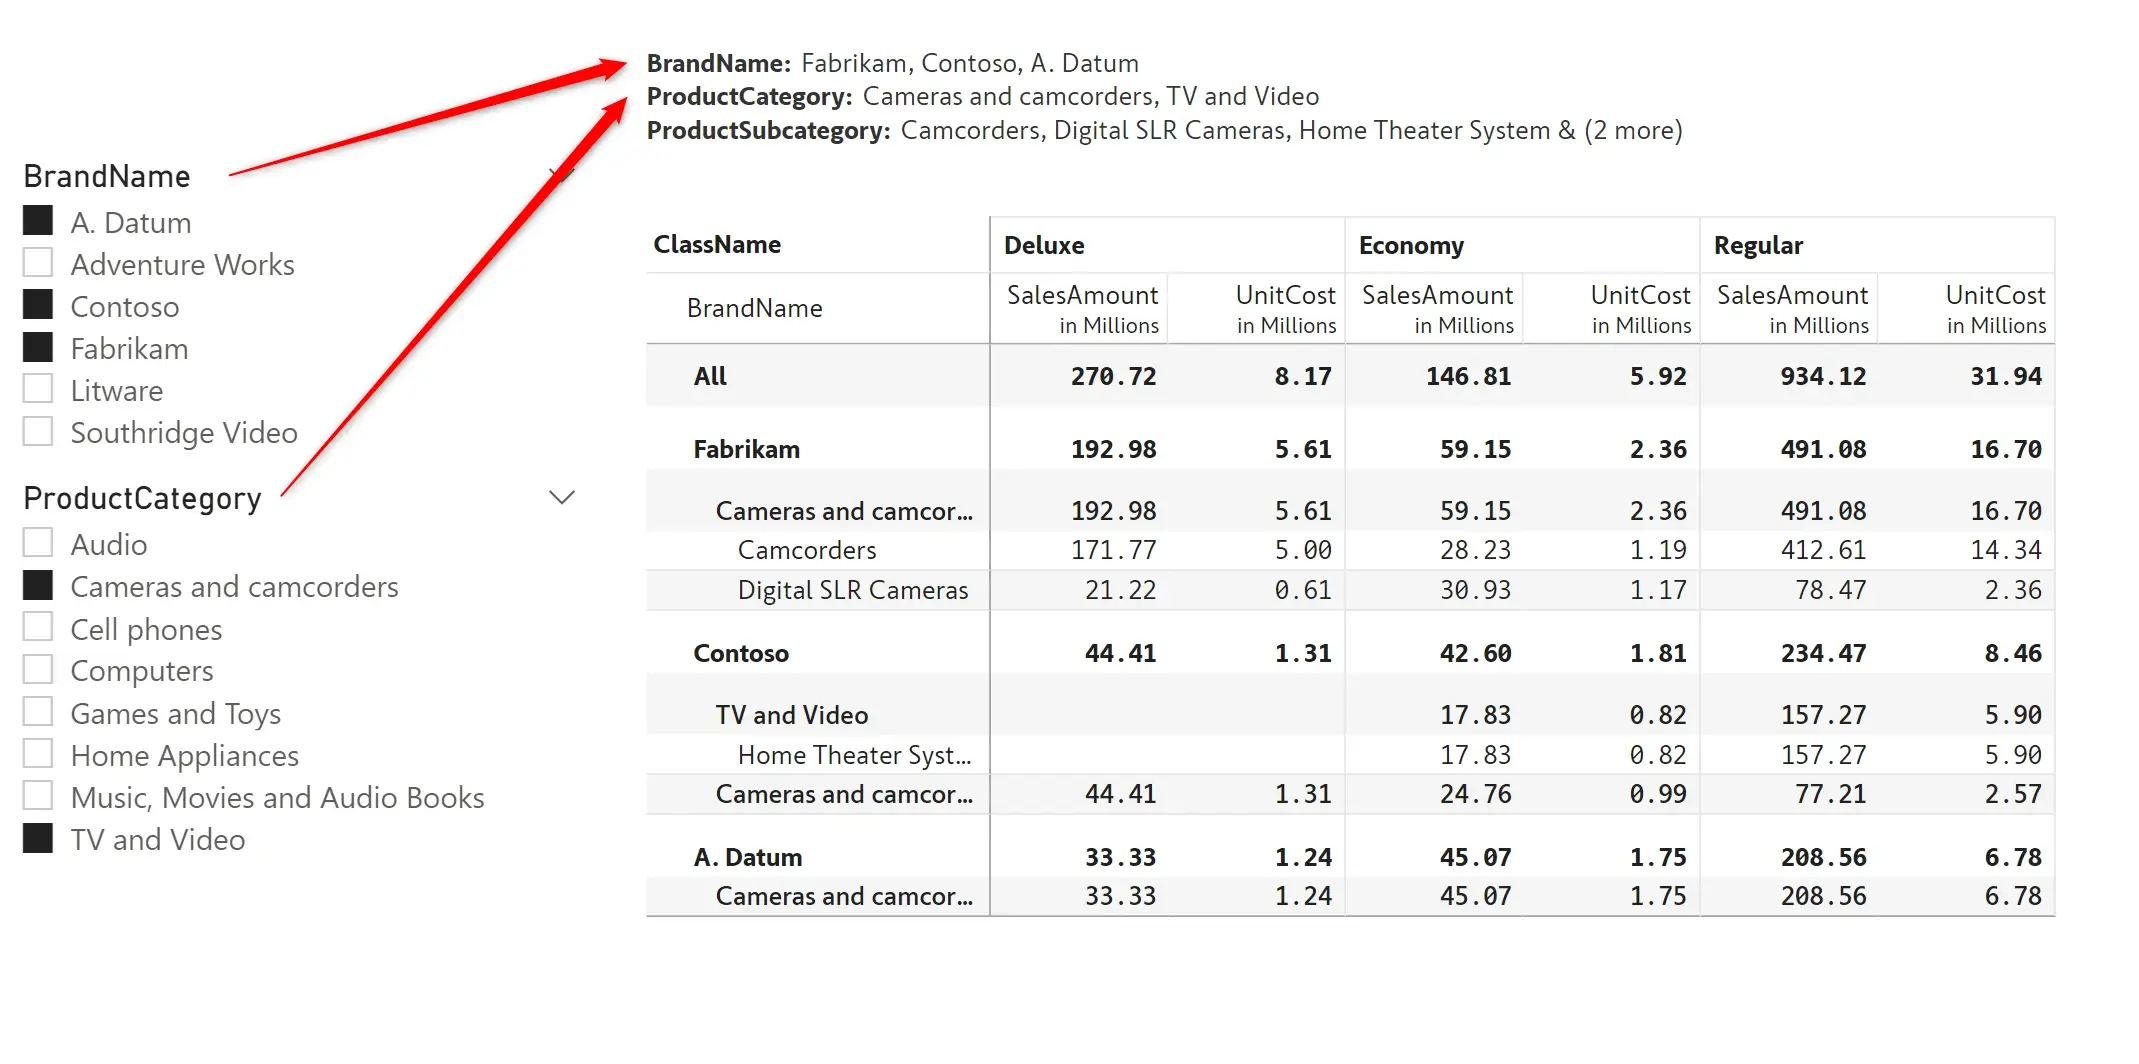
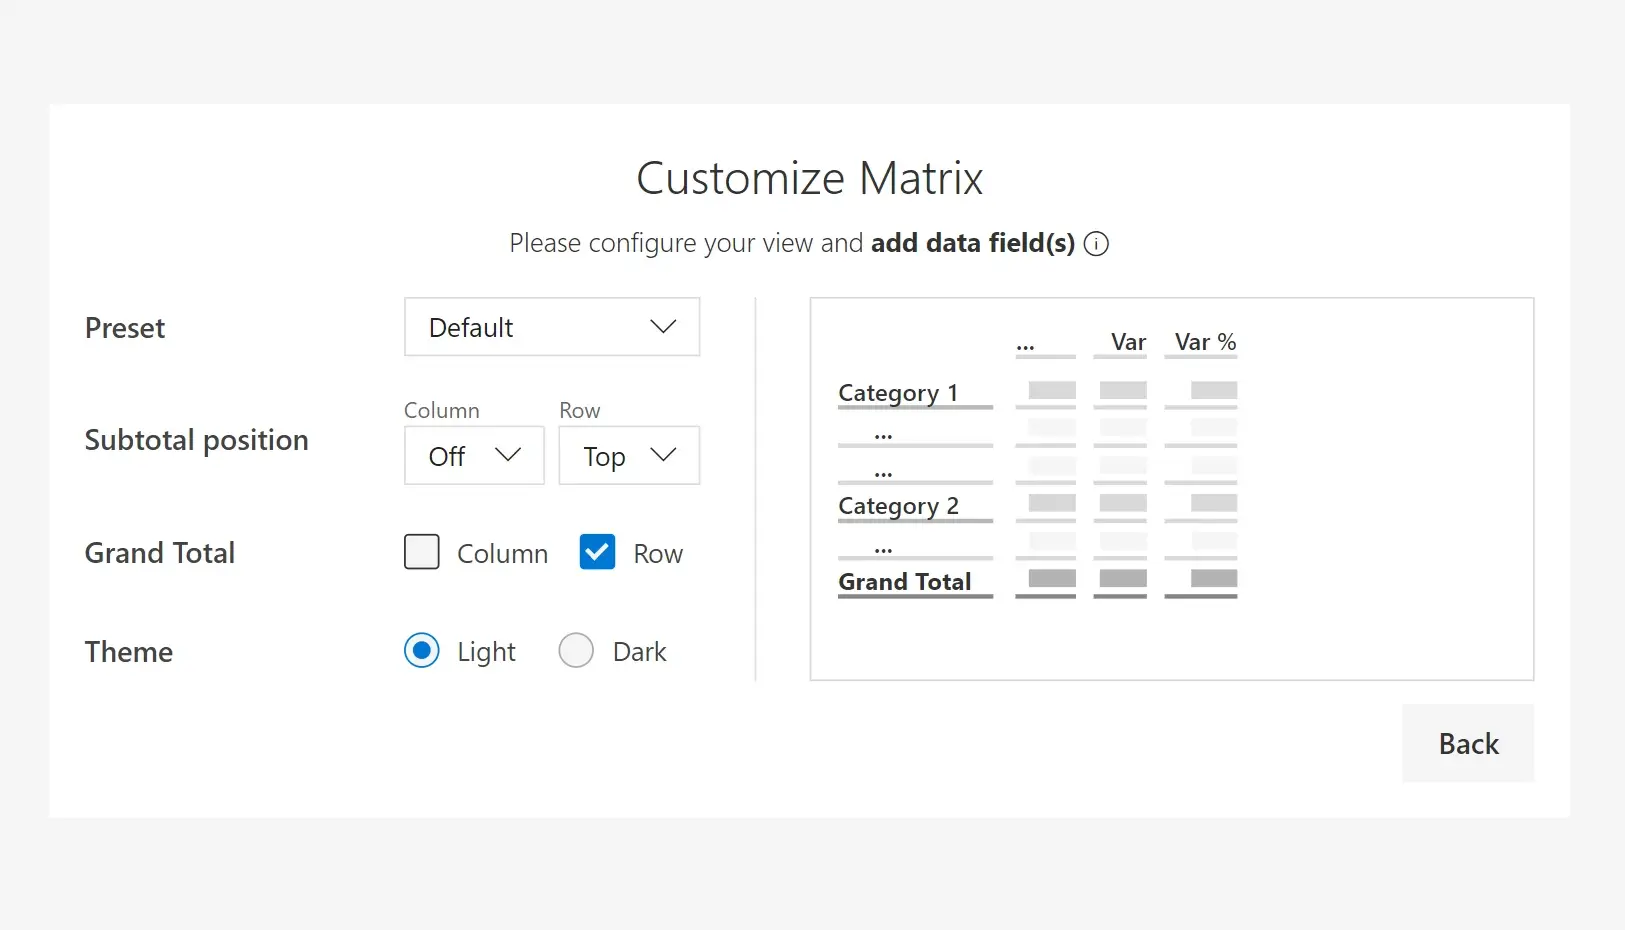
This can be achieved by using the highlighted preset and customizing as required. (Note: To obtain the header shown in the previous image, remove the report title and column members section.)
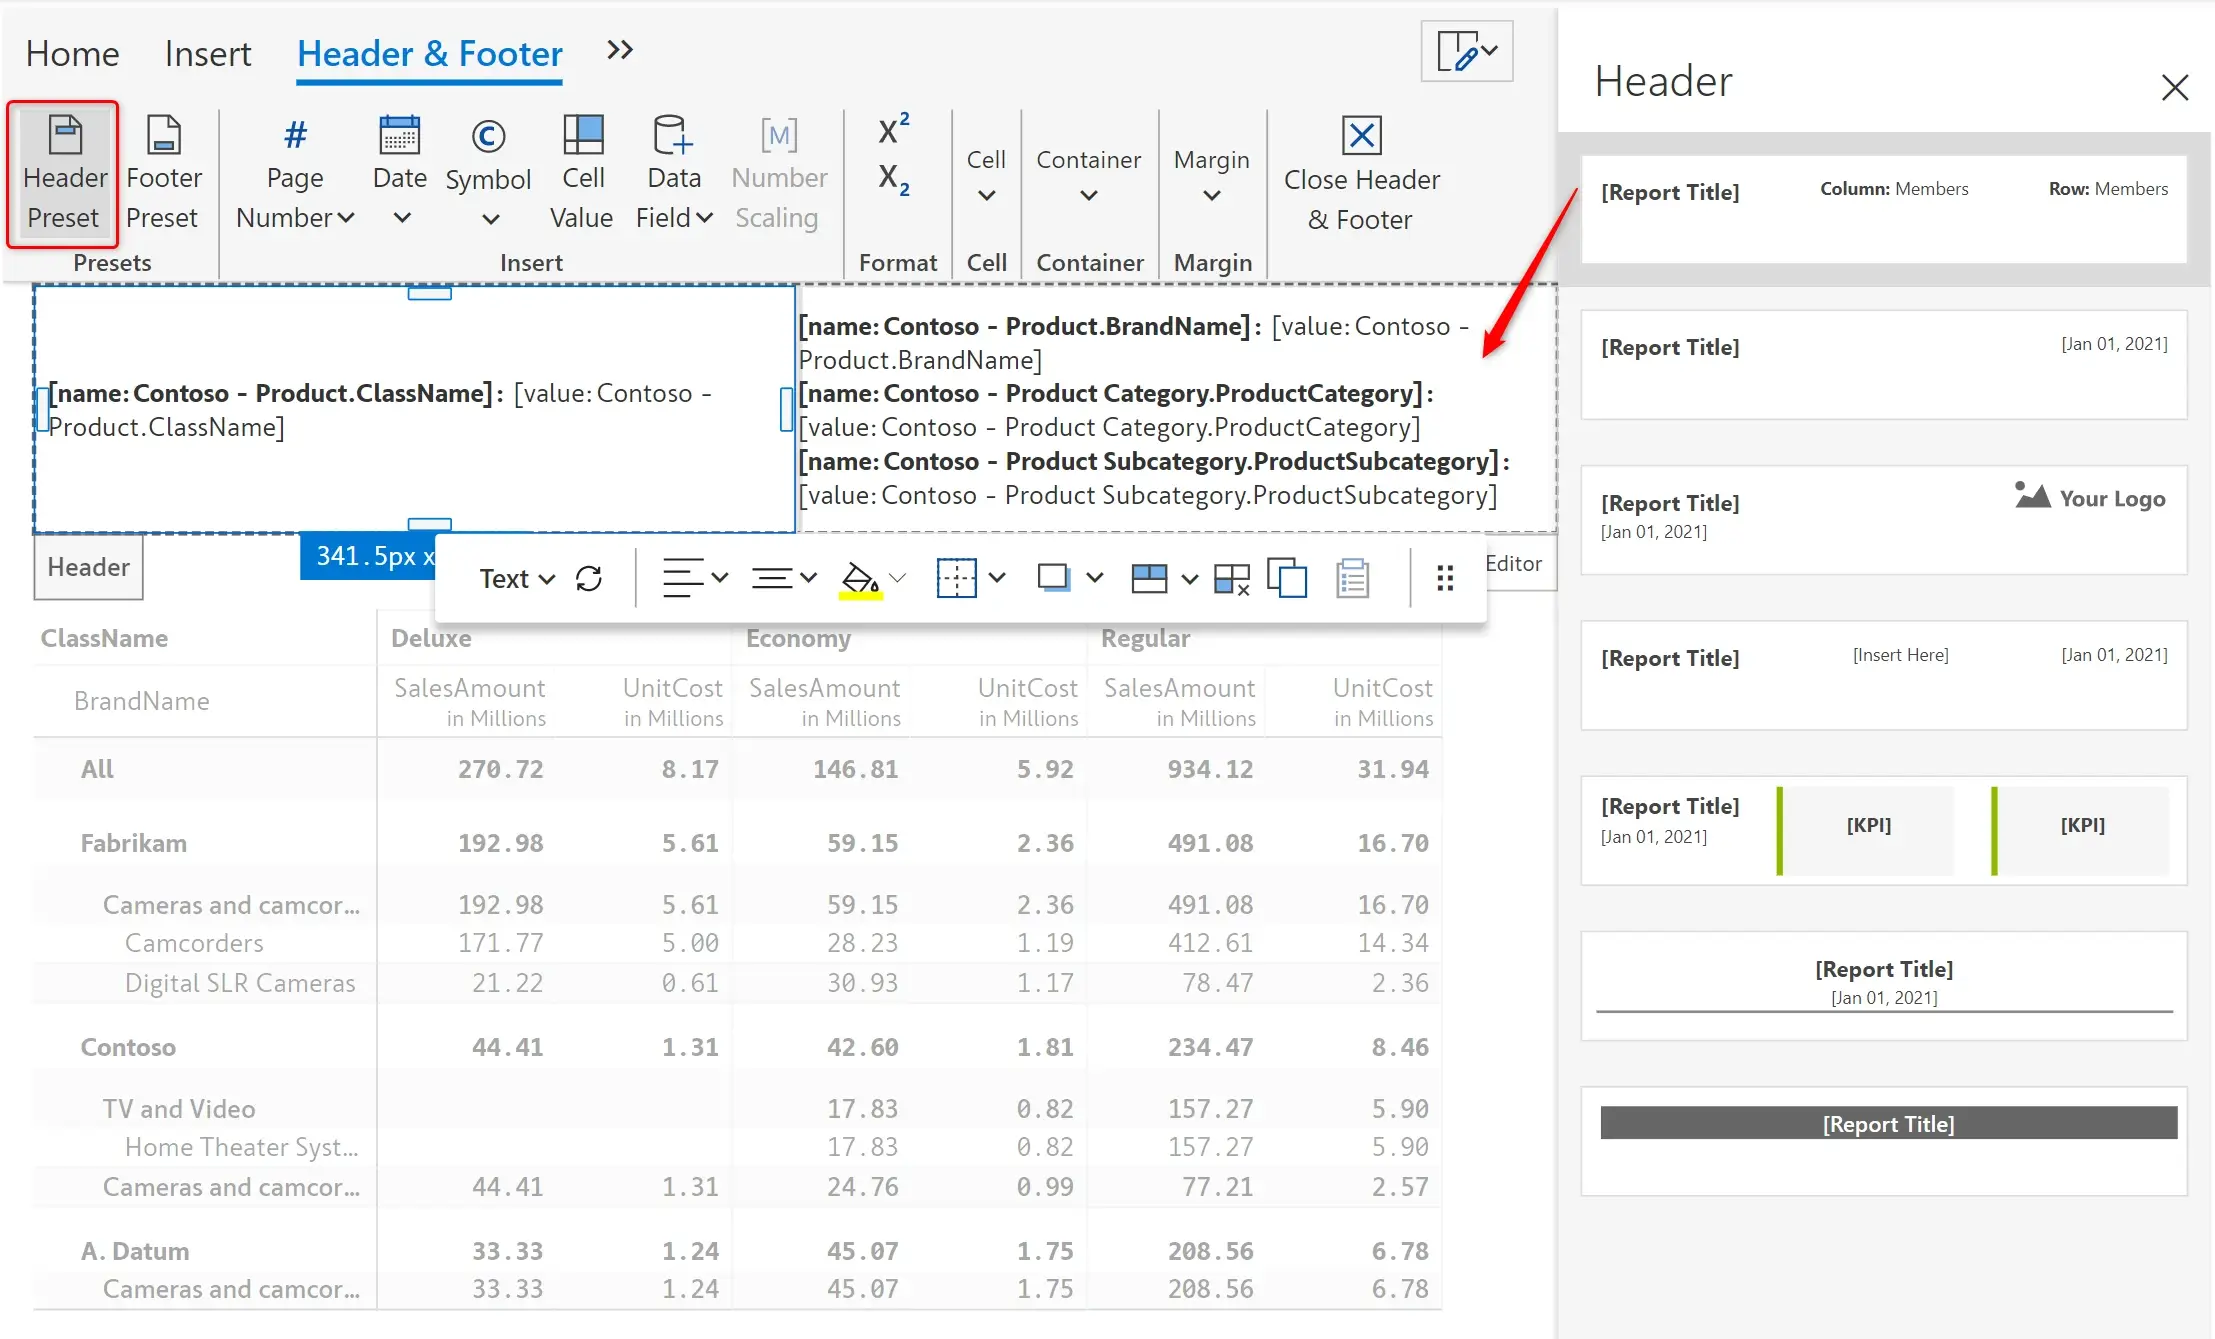
Note that Brand Name and Product Category fields must be assigned to Inforiver visual for this feature to work.
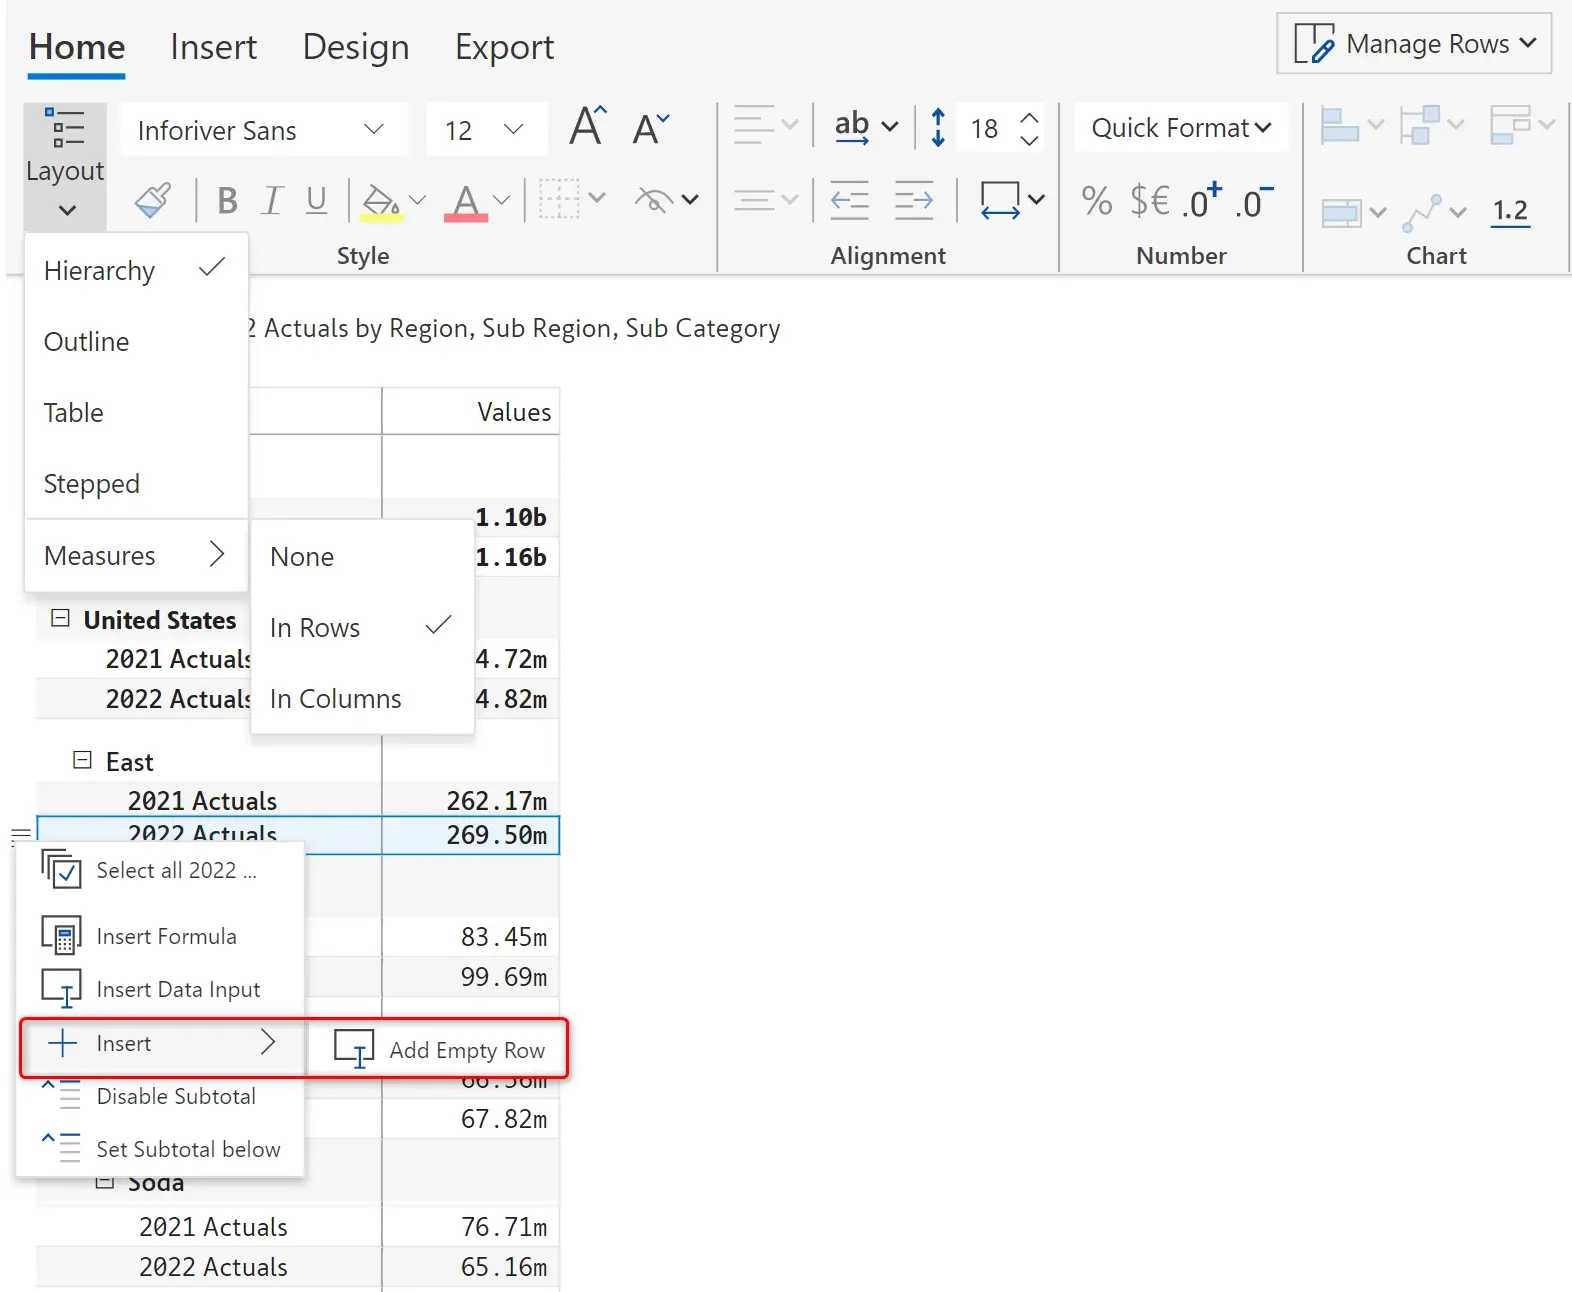
You can now create and format financial statements and reports by adding white spaces as required using the insert empty row option.
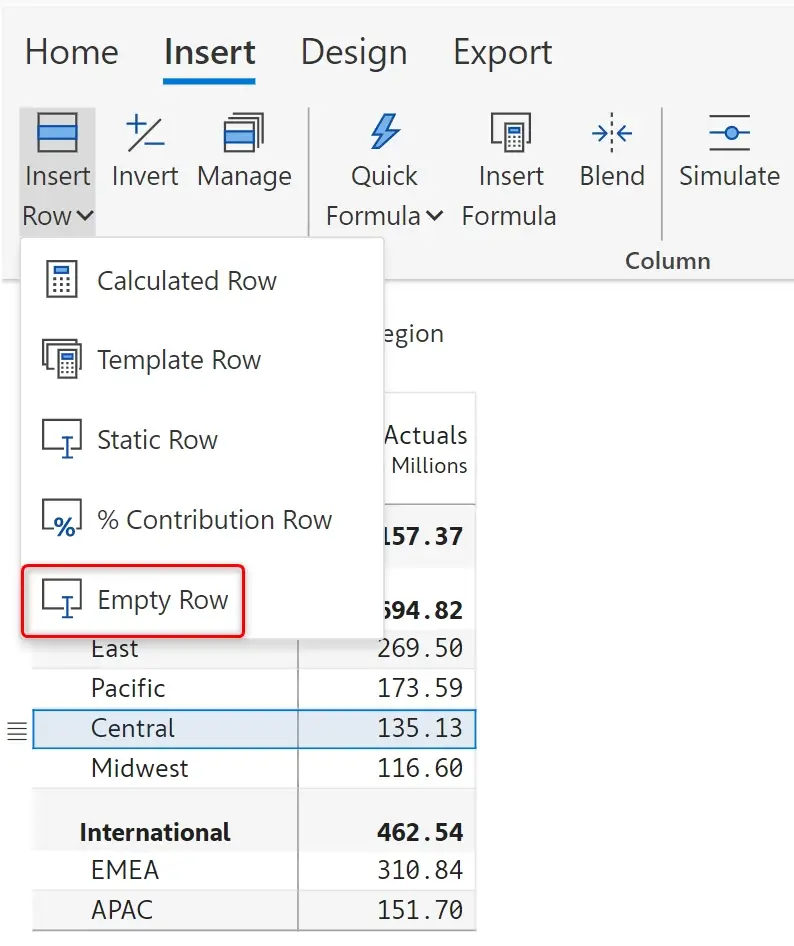
This is also very useful when used with the measure in rows option, as you can now easily insert empty rows and capture static values.
Long row hierarchies can be wrapped automatically by enabling the ‘Auto wrap columns’ option as shown in the below image.
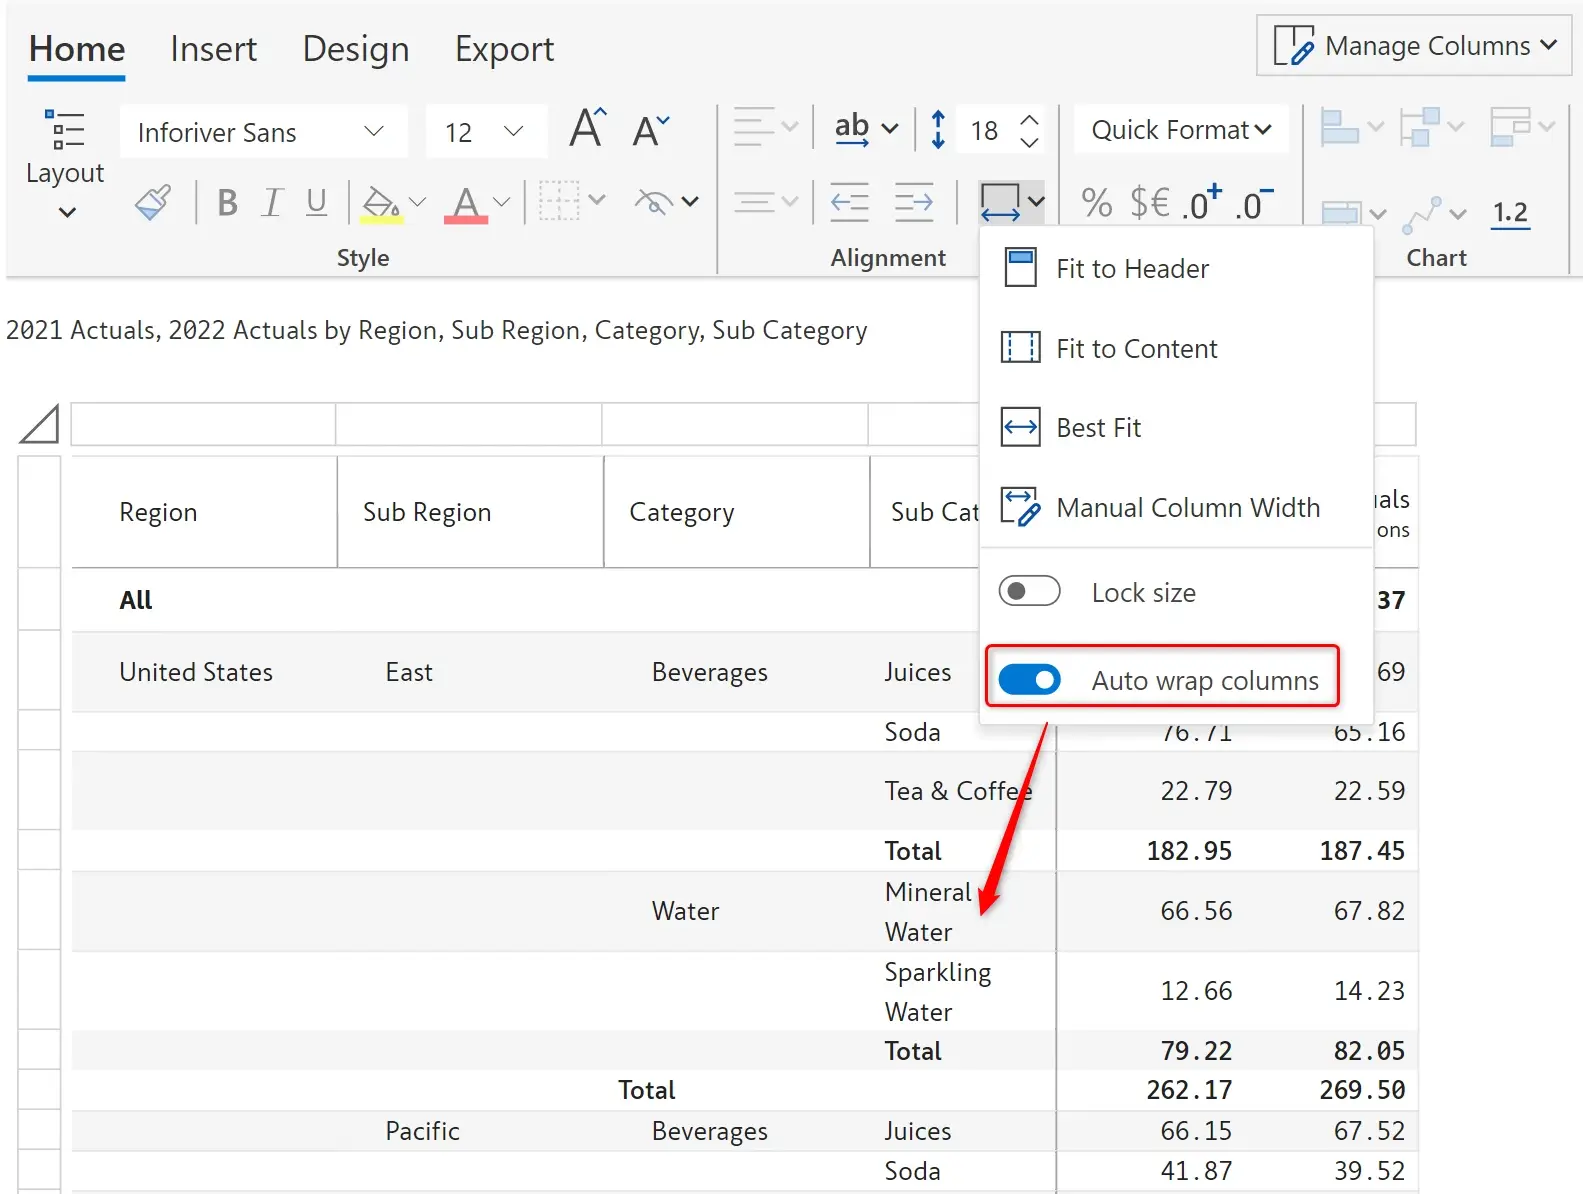
To wrap the column header for the row hierarchy columns, enable the ‘Column header word wrap’ option.

Note that till v1.7, only column category/measure headers were auto wrapped.
On popular request, we have introduced support for transparent report background in v1.8. This means any image/background color that you use in your Power BI report gets reflected in the Inforiver visual as shown in the below image.
To apply an image background, in Display settings -> General, set ‘Canvas background’ as ‘No fill’ and ‘Row Highlight’ as ‘Off’. In the Power BI visualizations pane, add the image in Format page -> Canvas background.

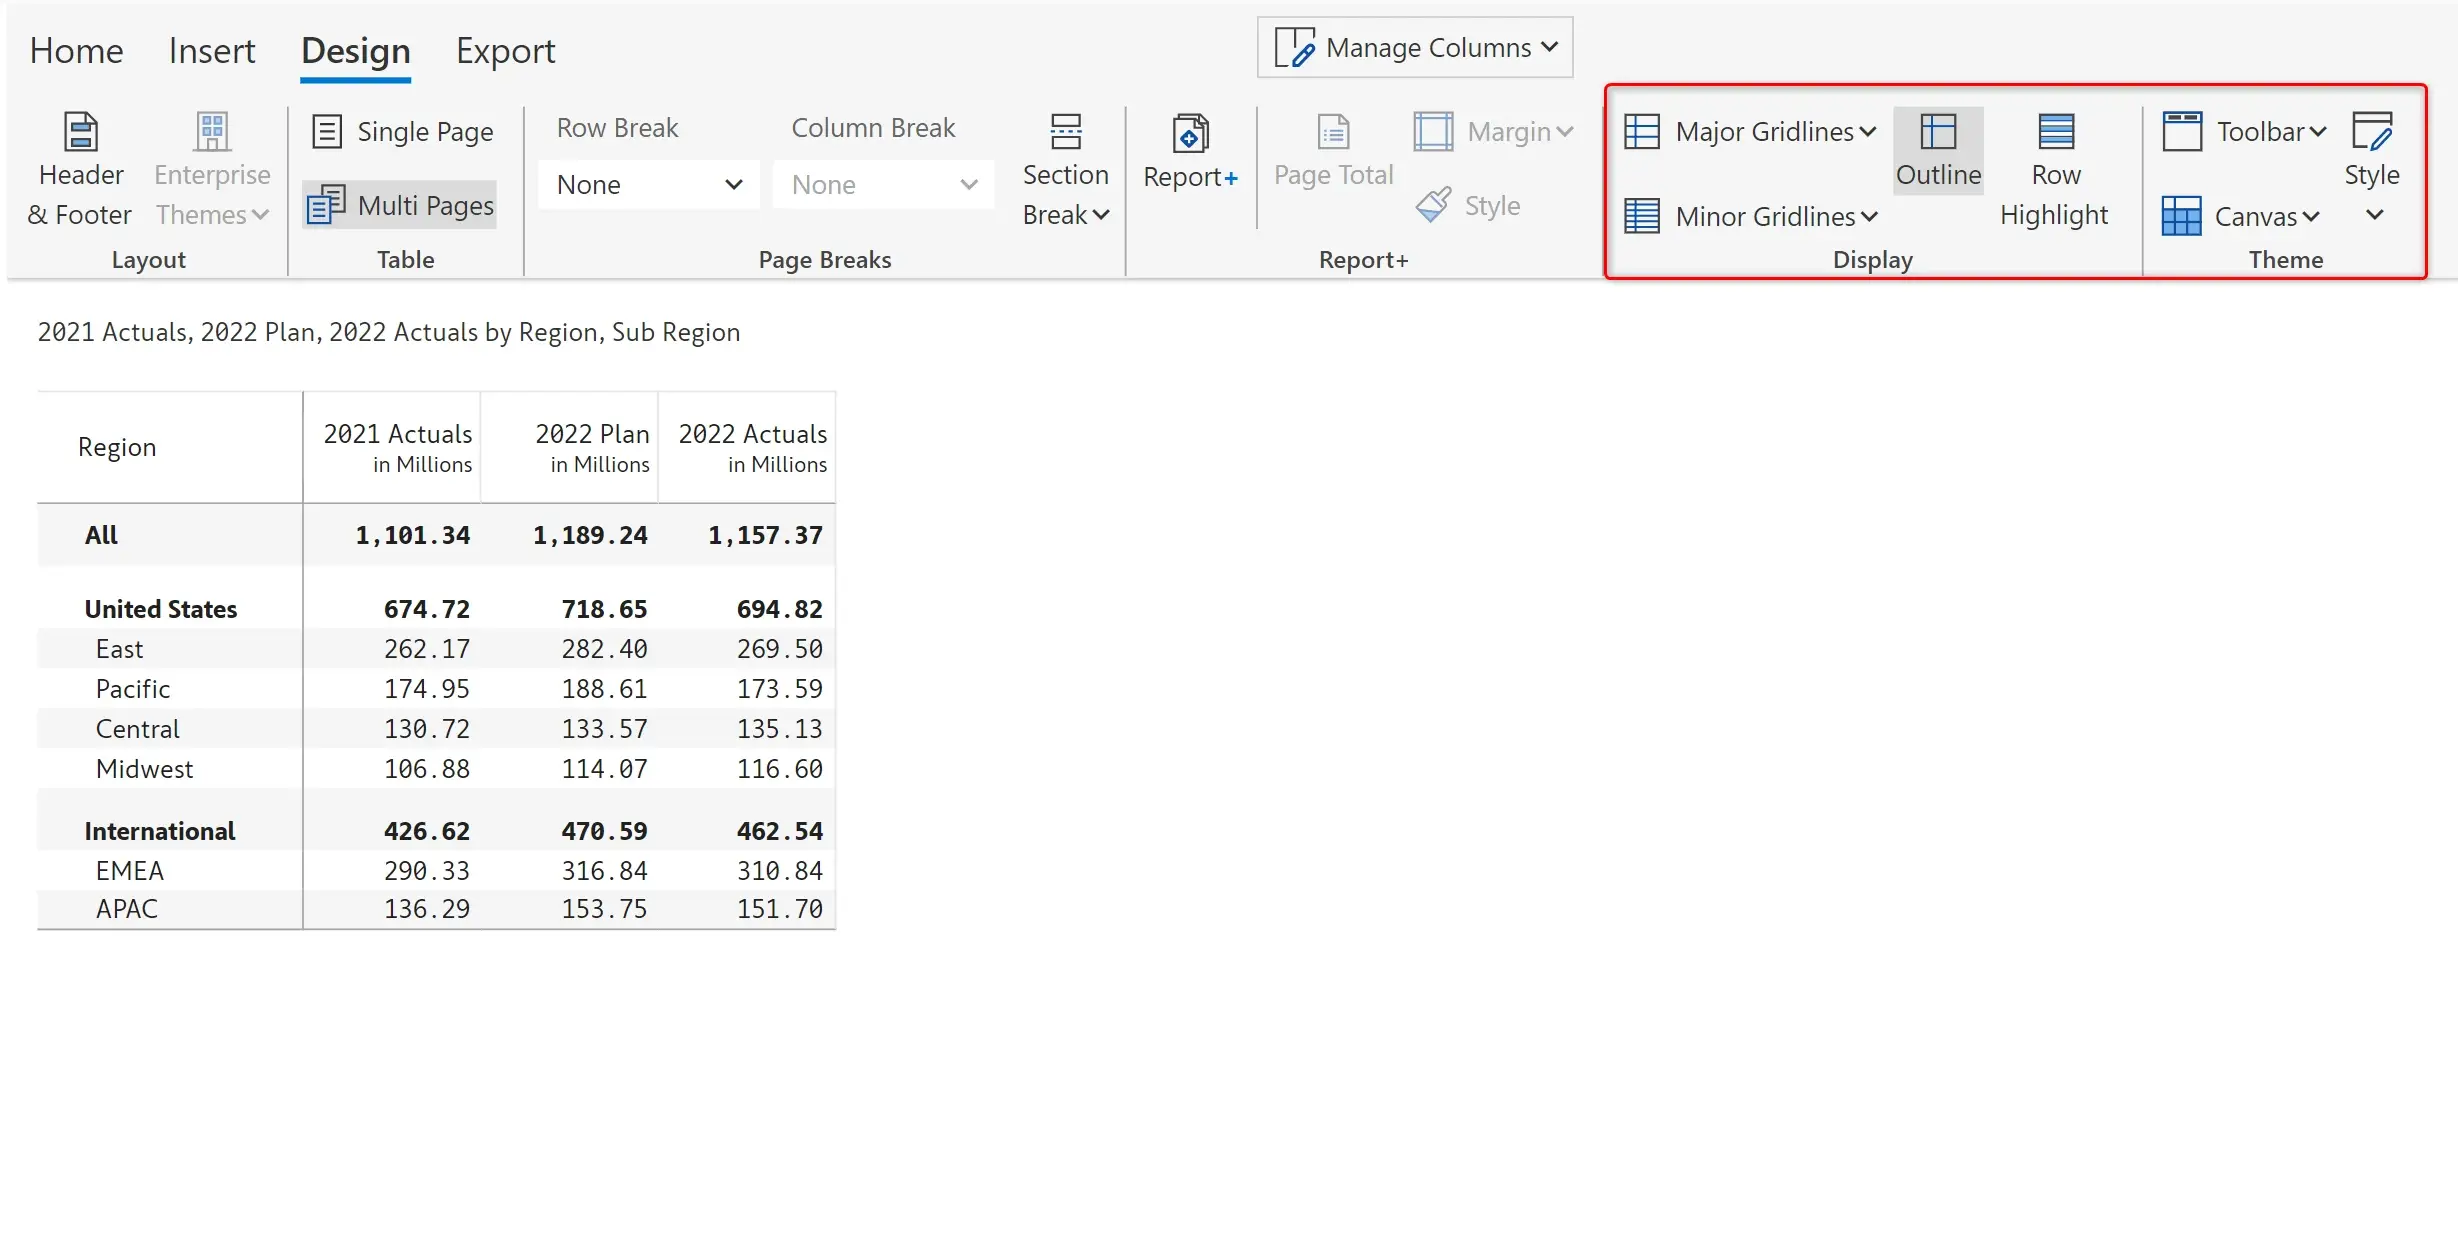
Frequently used options such as toolbar & canvas theme, major & minor gridlines that are available in ‘Display Settings’ have been added to the ‘Design’ tab for improved discoverability.
Using the ‘Measure only highlight’ option, you can apply banded rows only to the measures to recreate some of the Excel table layouts. You can also find options for major and minor gridlines and outline in the Display section.
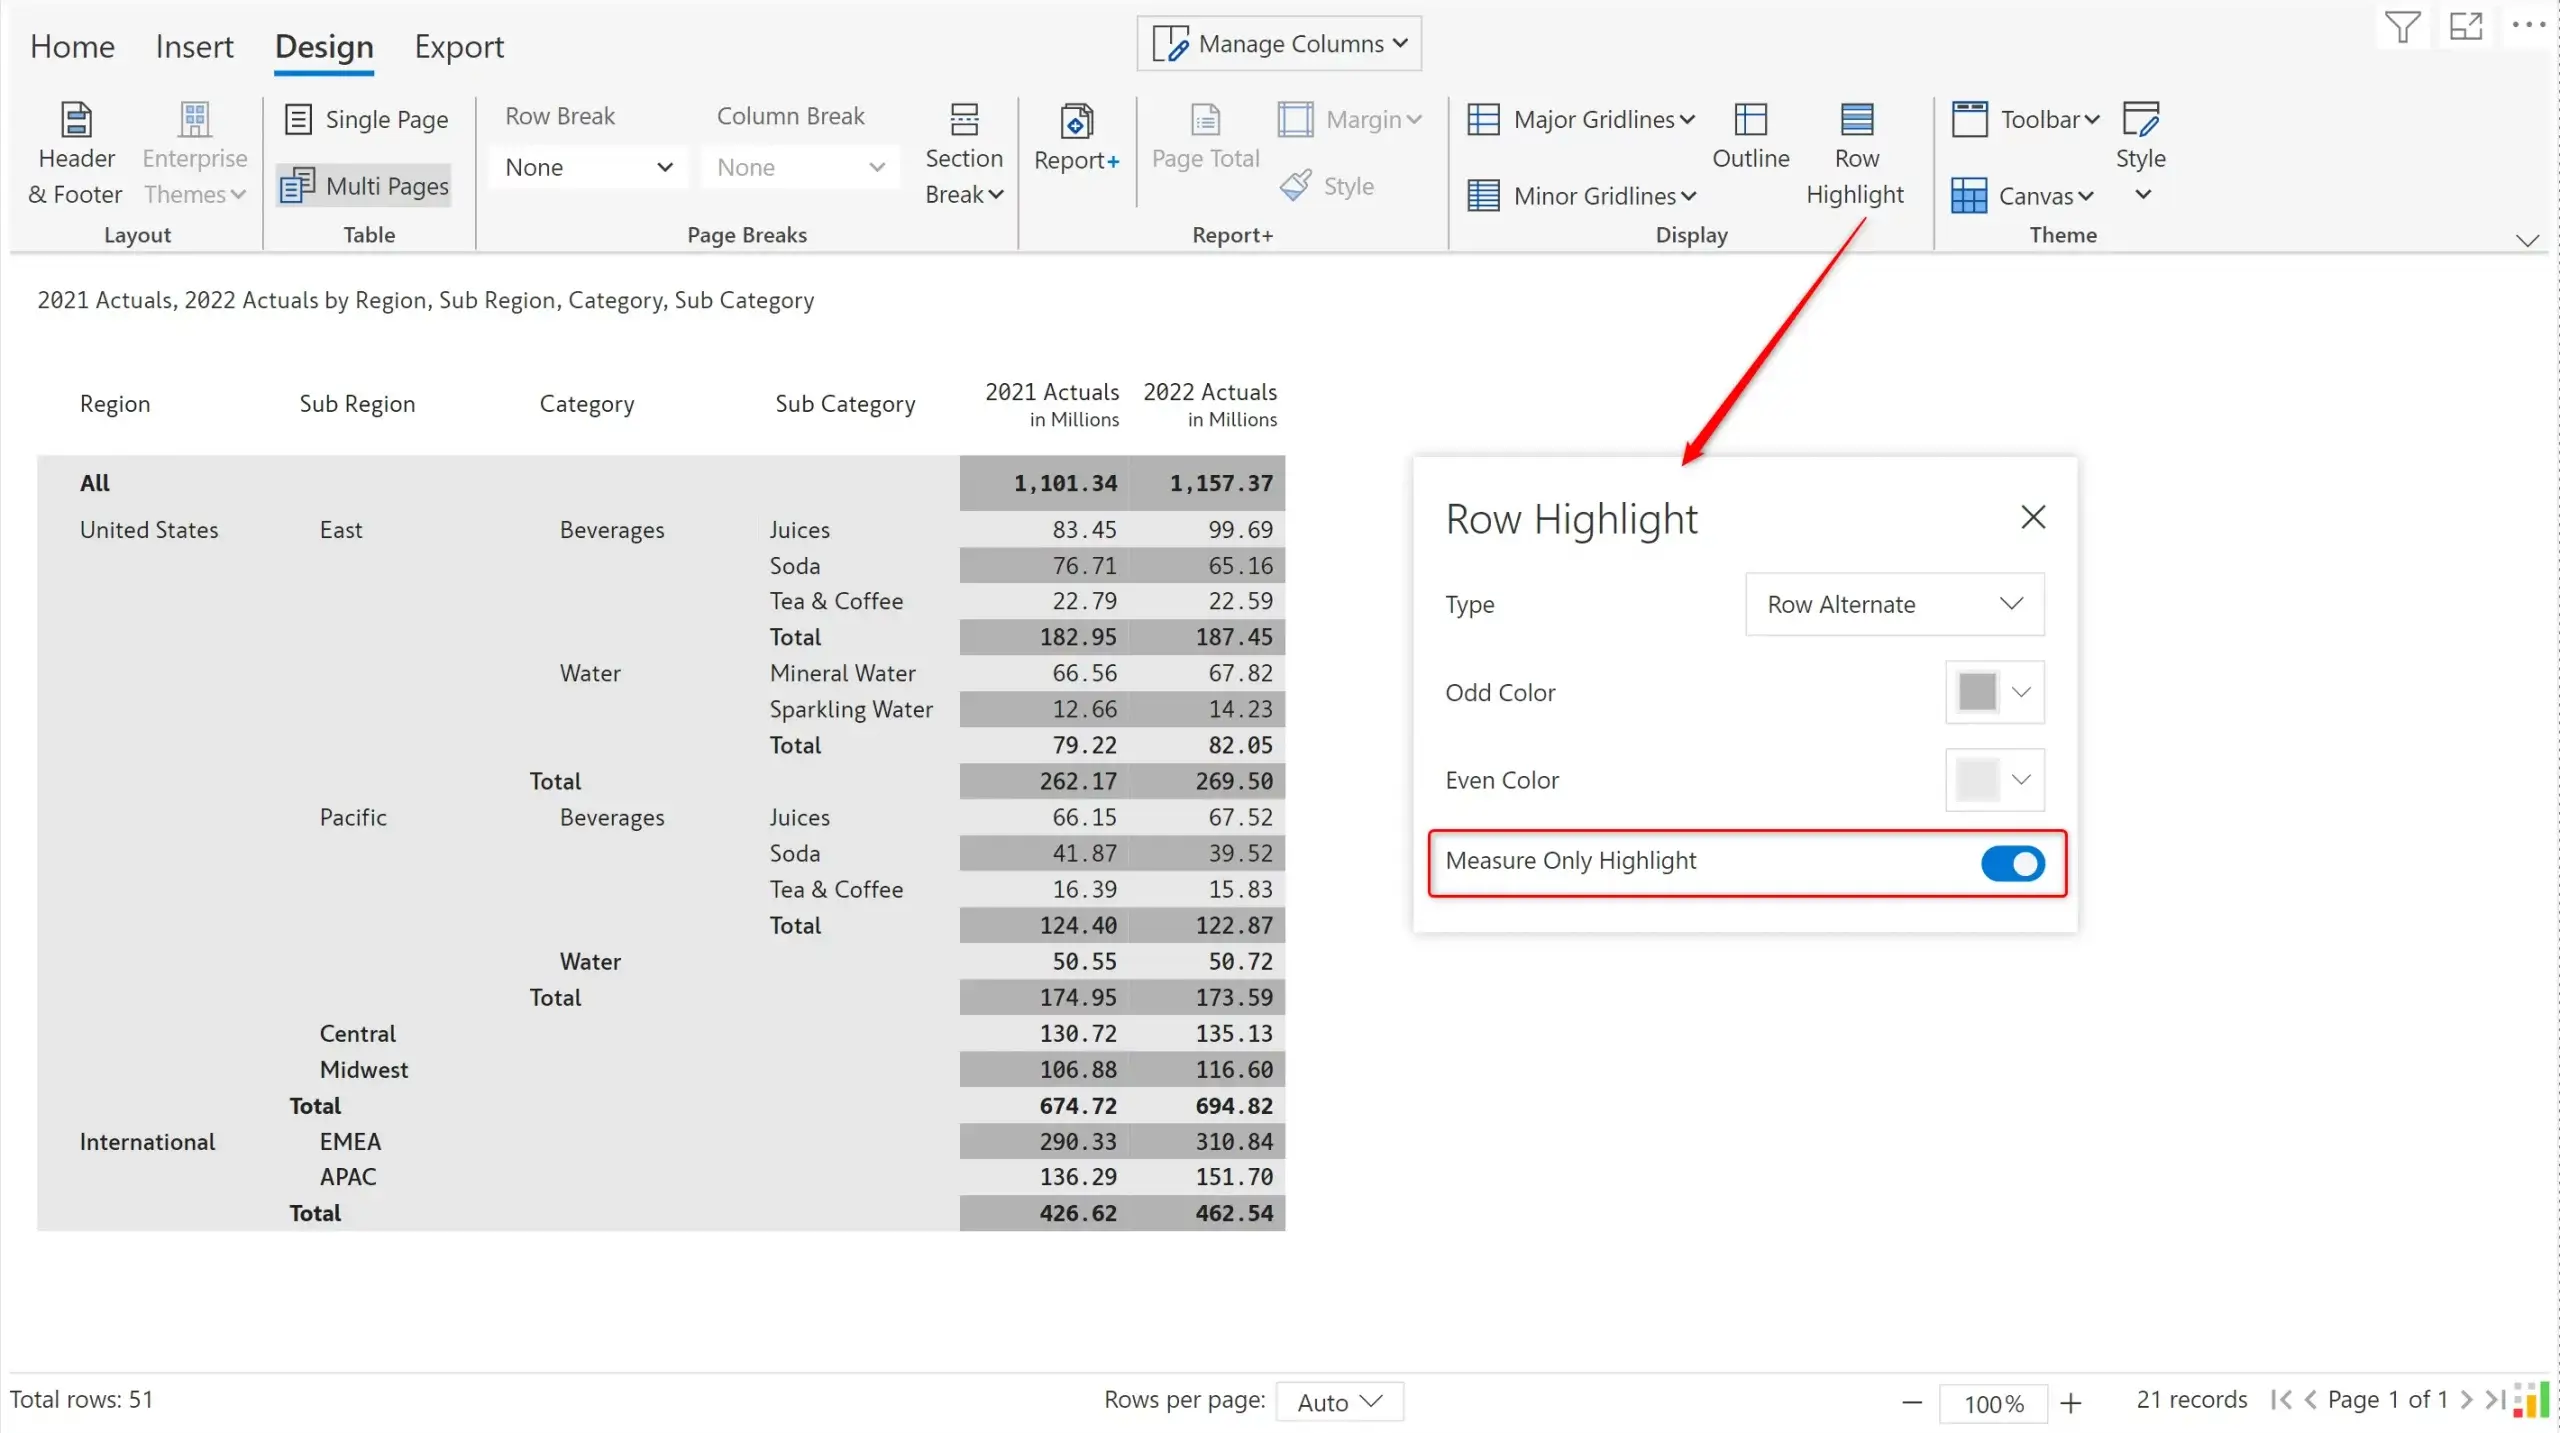
Note: To apply a background color to the row headers, enable ‘Rails’ as highlighted in the ‘Actions’ section, select the columns and use the ‘Fill color’ option.
The launch wizard has been redesigned to display the properties in a single pane for improved usability.
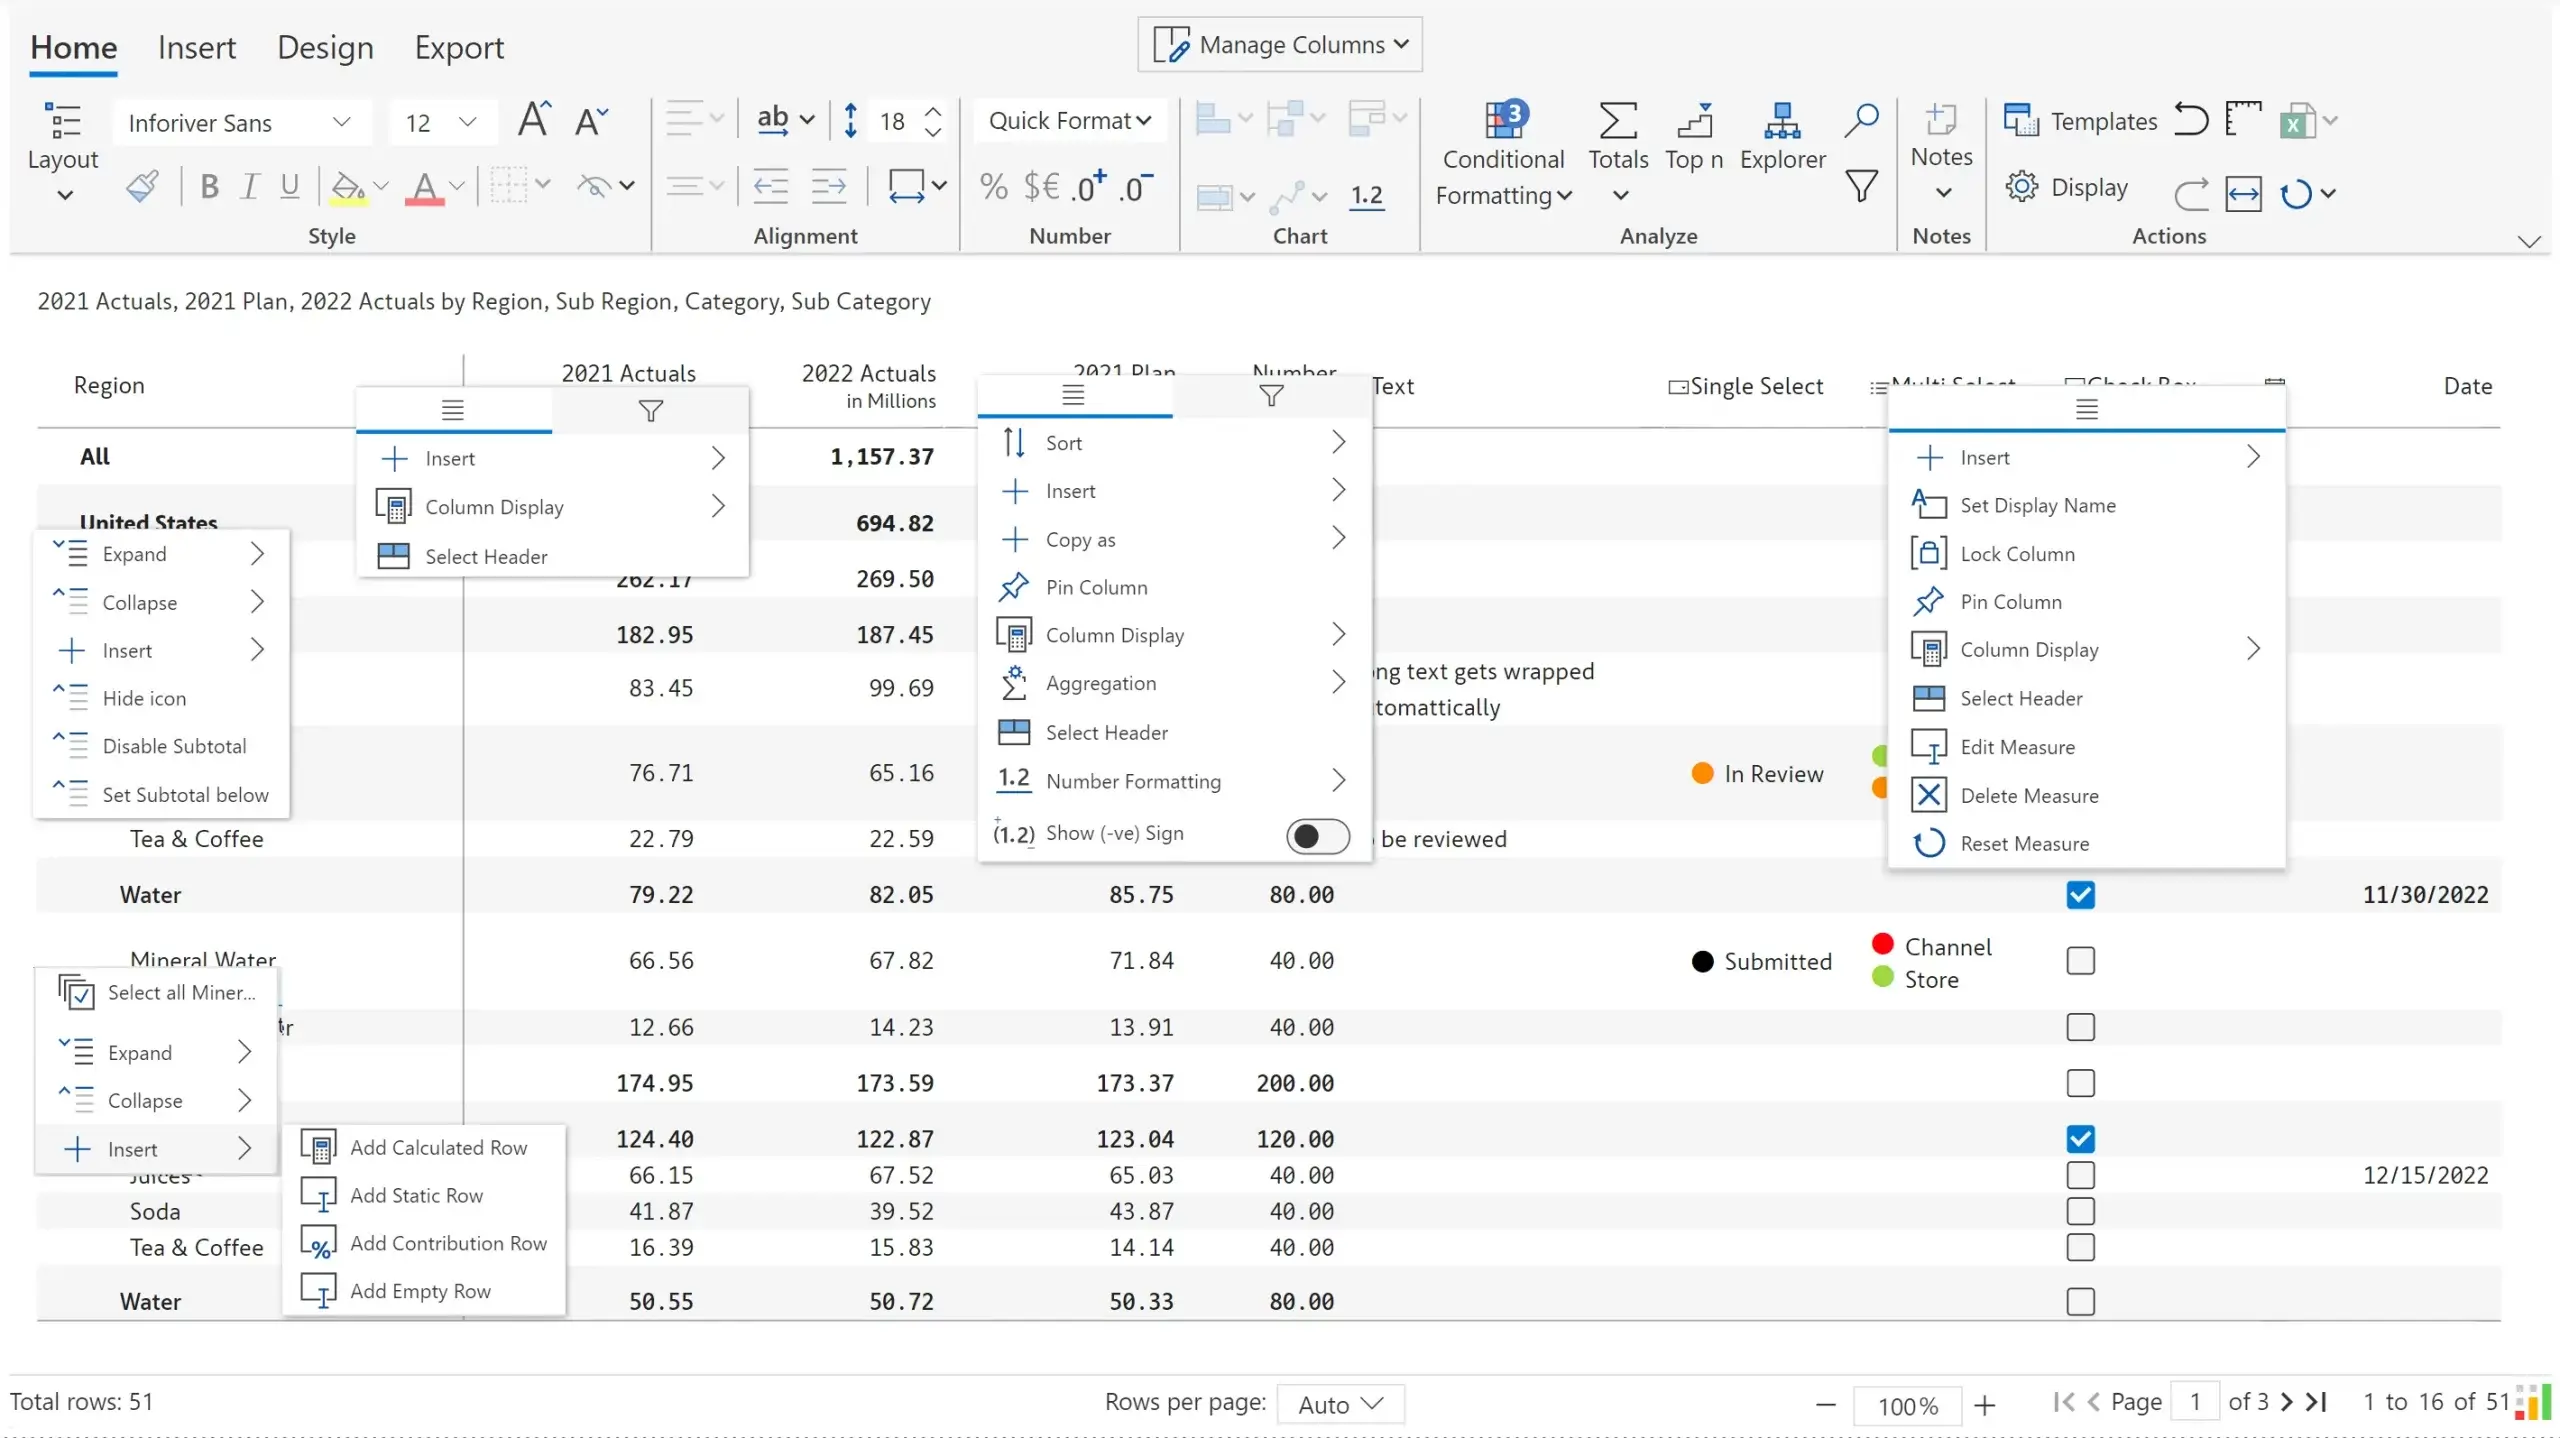
Row and column grippers have been enhanced to improve discoverability of key features along with right-click enabled for column and row selection as well.
Grippers for calculated measures, data input columns, subtotal rows, and child rows are shown in the below image as a sample.
In addition to these features, we also have several enhancements and bug fixes as part of this release.
Note: Version 1.8 is currently available only in our website as of December 7th and it would take about 2 weeks in the AppSource.
We have introduced the Premium developer license for Inforiver Matrix which is $95 per developer per month for unlimited viewers. With this license, a named developer will be able to create and share reports with unlimited viewers in the organization (no license assignment for viewers is required). For more details, visit this page.
We have retired the developer-only subscription plan early 2024. To know more click here.
We'd love to hear your ideas for Inforiver – be it a cool new feature or an improvement on existing features. Visit the Inforiver Community to share your ideas, vote on other submissions, and interact with other users.

Inforiver helps enterprises consolidate planning, reporting & analytics on a single platform (Power BI). The no-code, self-service award-winning platform has been recognized as the industry’s best and is adopted by many Fortune 100 firms.
Inforiver is a product of Lumel, the #1 Power BI AppSource Partner. The firm serves over 3,000 customers worldwide through its portfolio of products offered under the brands Inforiver, EDITable, ValQ, and xViz.