
Upcoming webinar on 'Inforiver Charts : The fastest way to deliver stories in Power BI', Aug 29th , Monday, 10.30 AM CST. Register Now
Upcoming webinar on 'Inforiver Charts : The fastest way to deliver stories in Power BI', Aug 29th , Monday, 10.30 AM CST. Register Now
In one of our previous posts titled The Business Case for Top N + Others, we briefly looked into the following:
In this blog, we will look at how Top N analysis can be implemented in Excel and Power BI. While looking at Power BI, we’ll explore both the traditional DAX-based implementation and the instant no-code implementation using Inforiver.
Excel provides a lot of flexibility in how you can implement Top N analysis.
One option is to invoke Top N from the Pivot Table context menu.
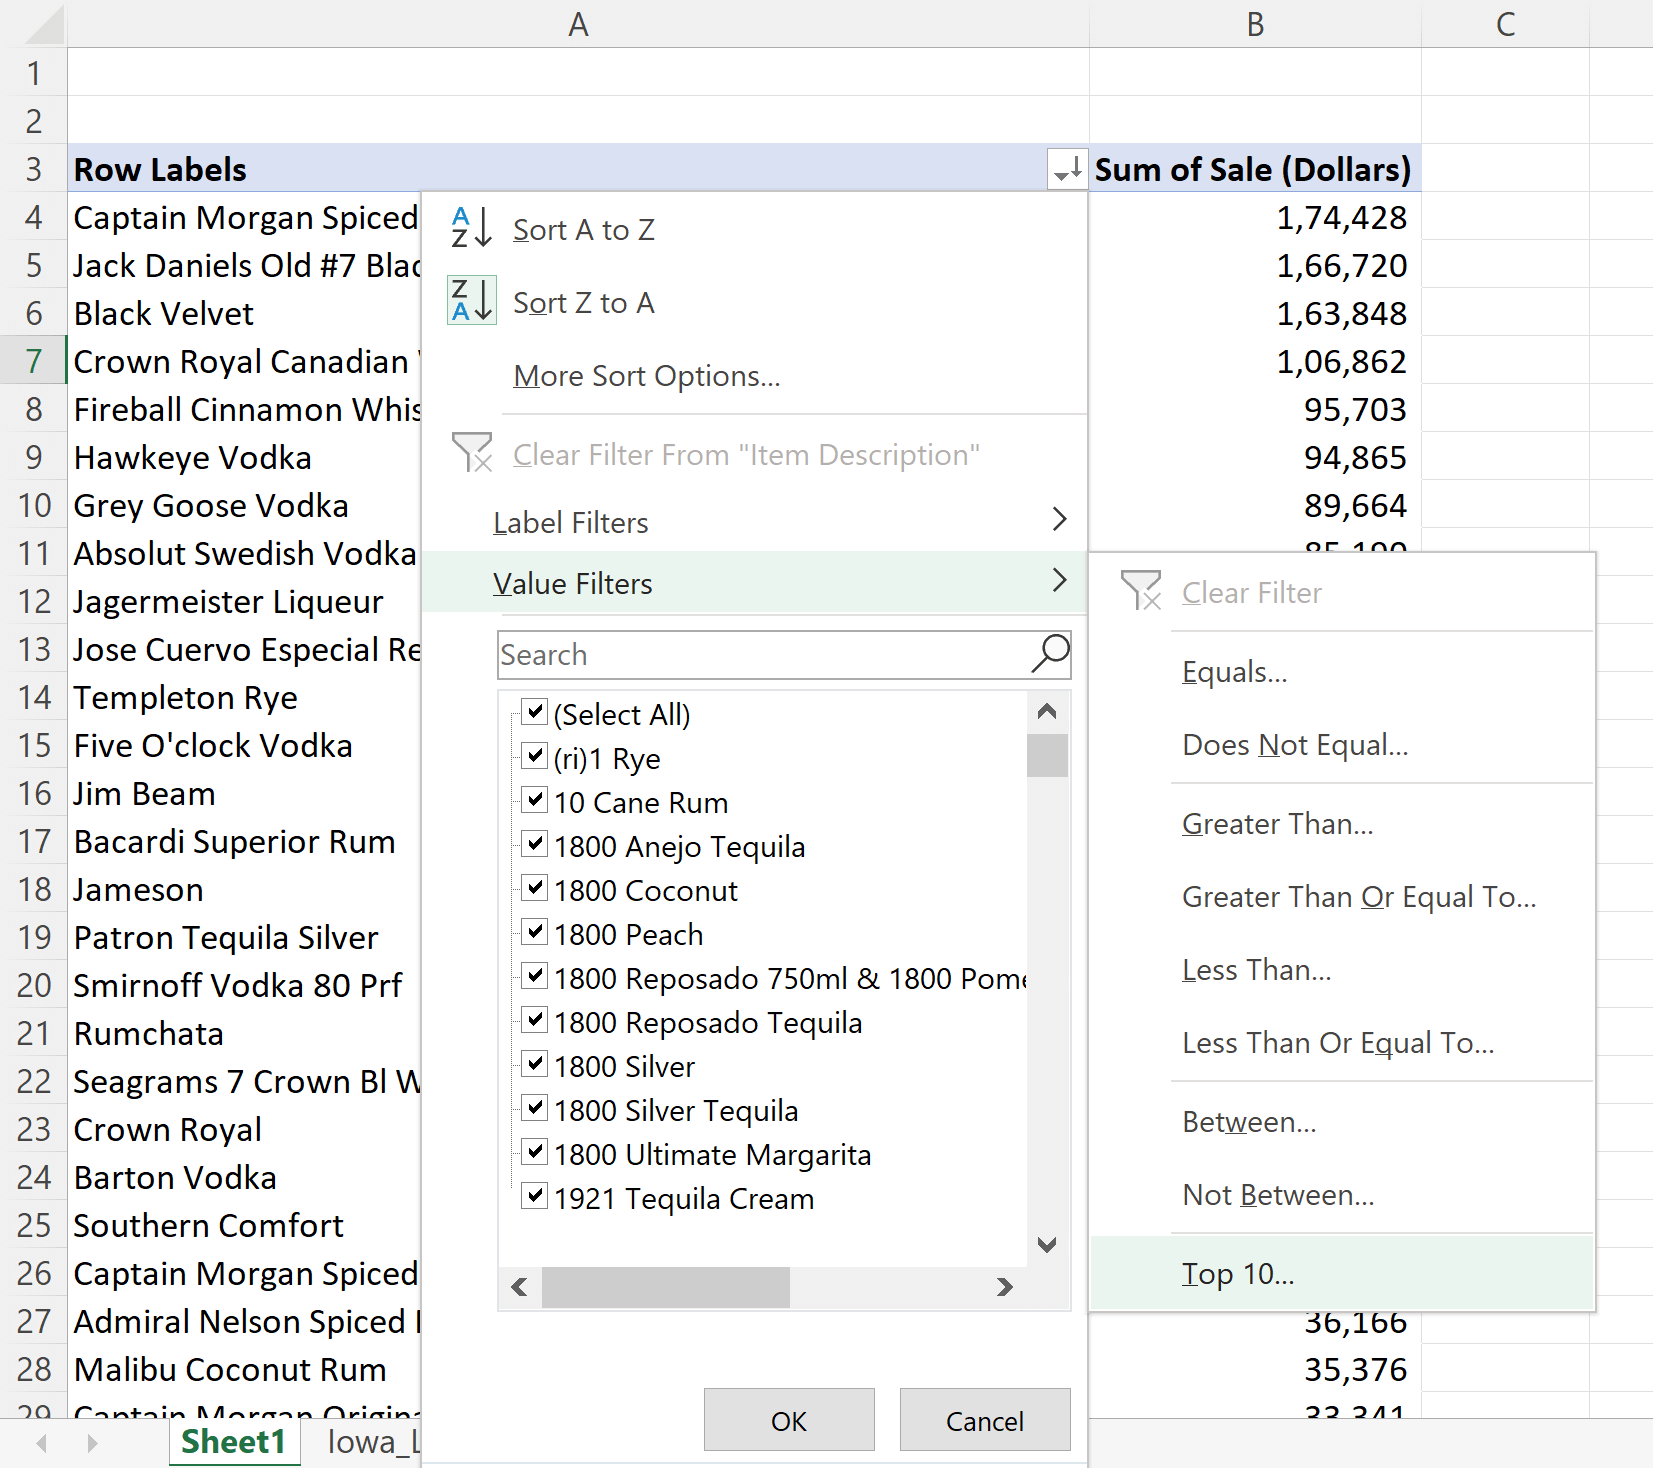
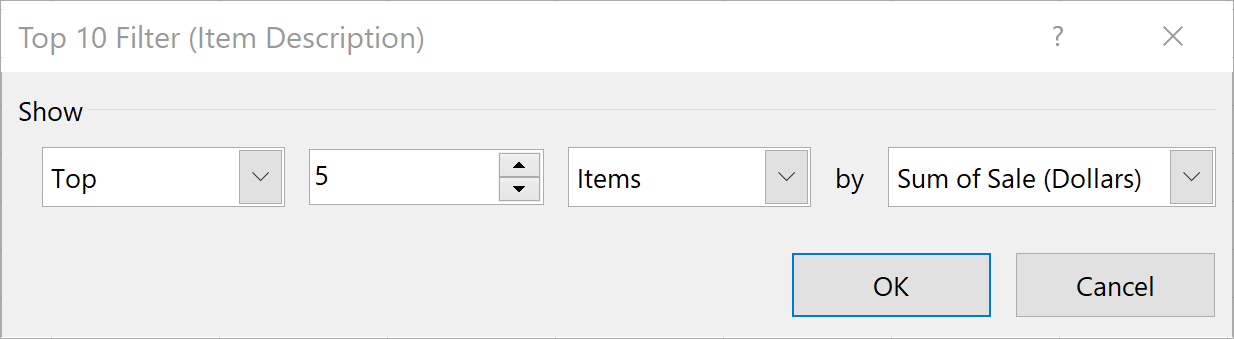
This shows a prompt where you can customize the settings to, say, Top 5.
This produces the following output.
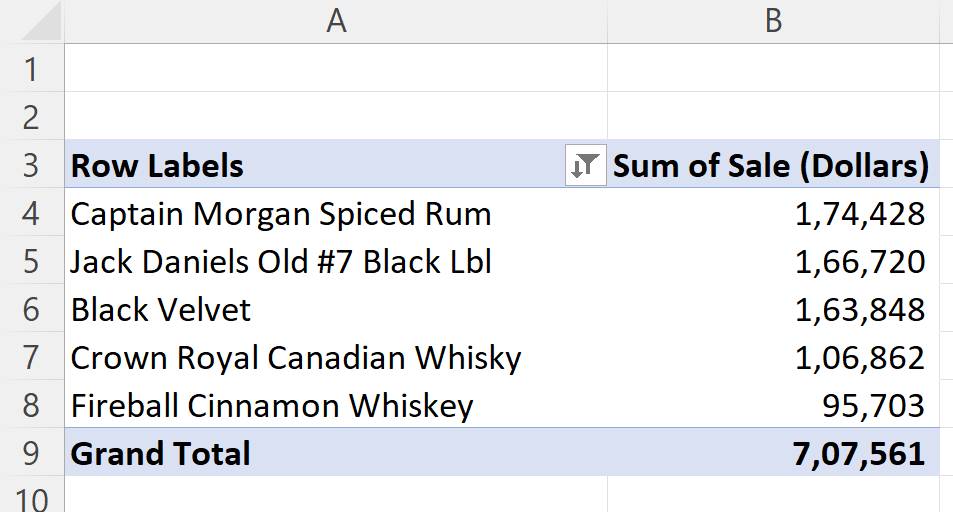
In our previous post, we learned why Top N analysis is served better with an Others row. However, the Pivot Table approach above does not include an Others row by default.
To add an Others row, you need to use Power Pivot and DAX as outlined in this post Displaying Top N, Bottom N, and All Others by P3Adaptive.
You can also make your Top N semi-dynamic by using slicers. This offers better flexibility compared to the previous approach but is still not a fully dynamic solution.
If you are looking to keep things simple (without using Pivot Tables), you can just filter an existing table by using FILTER and LARGE functions and implement Top N. You can add the Others row and the grand total at the end manually.
Another interesting method to implement Top N in Excel is to use dynamic arrays.
While Excel delivers a variety of options, none of them are comprehensive and dynamic at the same time.
By comprehensive, we refer to the ability to:
a) deliver our preferred format of having an Others row with a grand total
b) list rows in descending order of value, except for the Others row
c) to perform nested combinations of Top and Bottom N
d) to support N for numeric or percentage values
By dynamic, we refer to the ability to
a) set Top N analysis quickly
b) switch between various values of N, and even between numeric and percentage values instantly (without modifying the script or layout)
c) switch between Top and Bottom N analysis instantly
We’ll now look at how Power BI implements Top N.
Just as with Excel, Power BI provides a few options to implement Top N too.
One way to filter Top N items is to use the filter pane. However, this does not provide an option to include the Others row in the matrix.

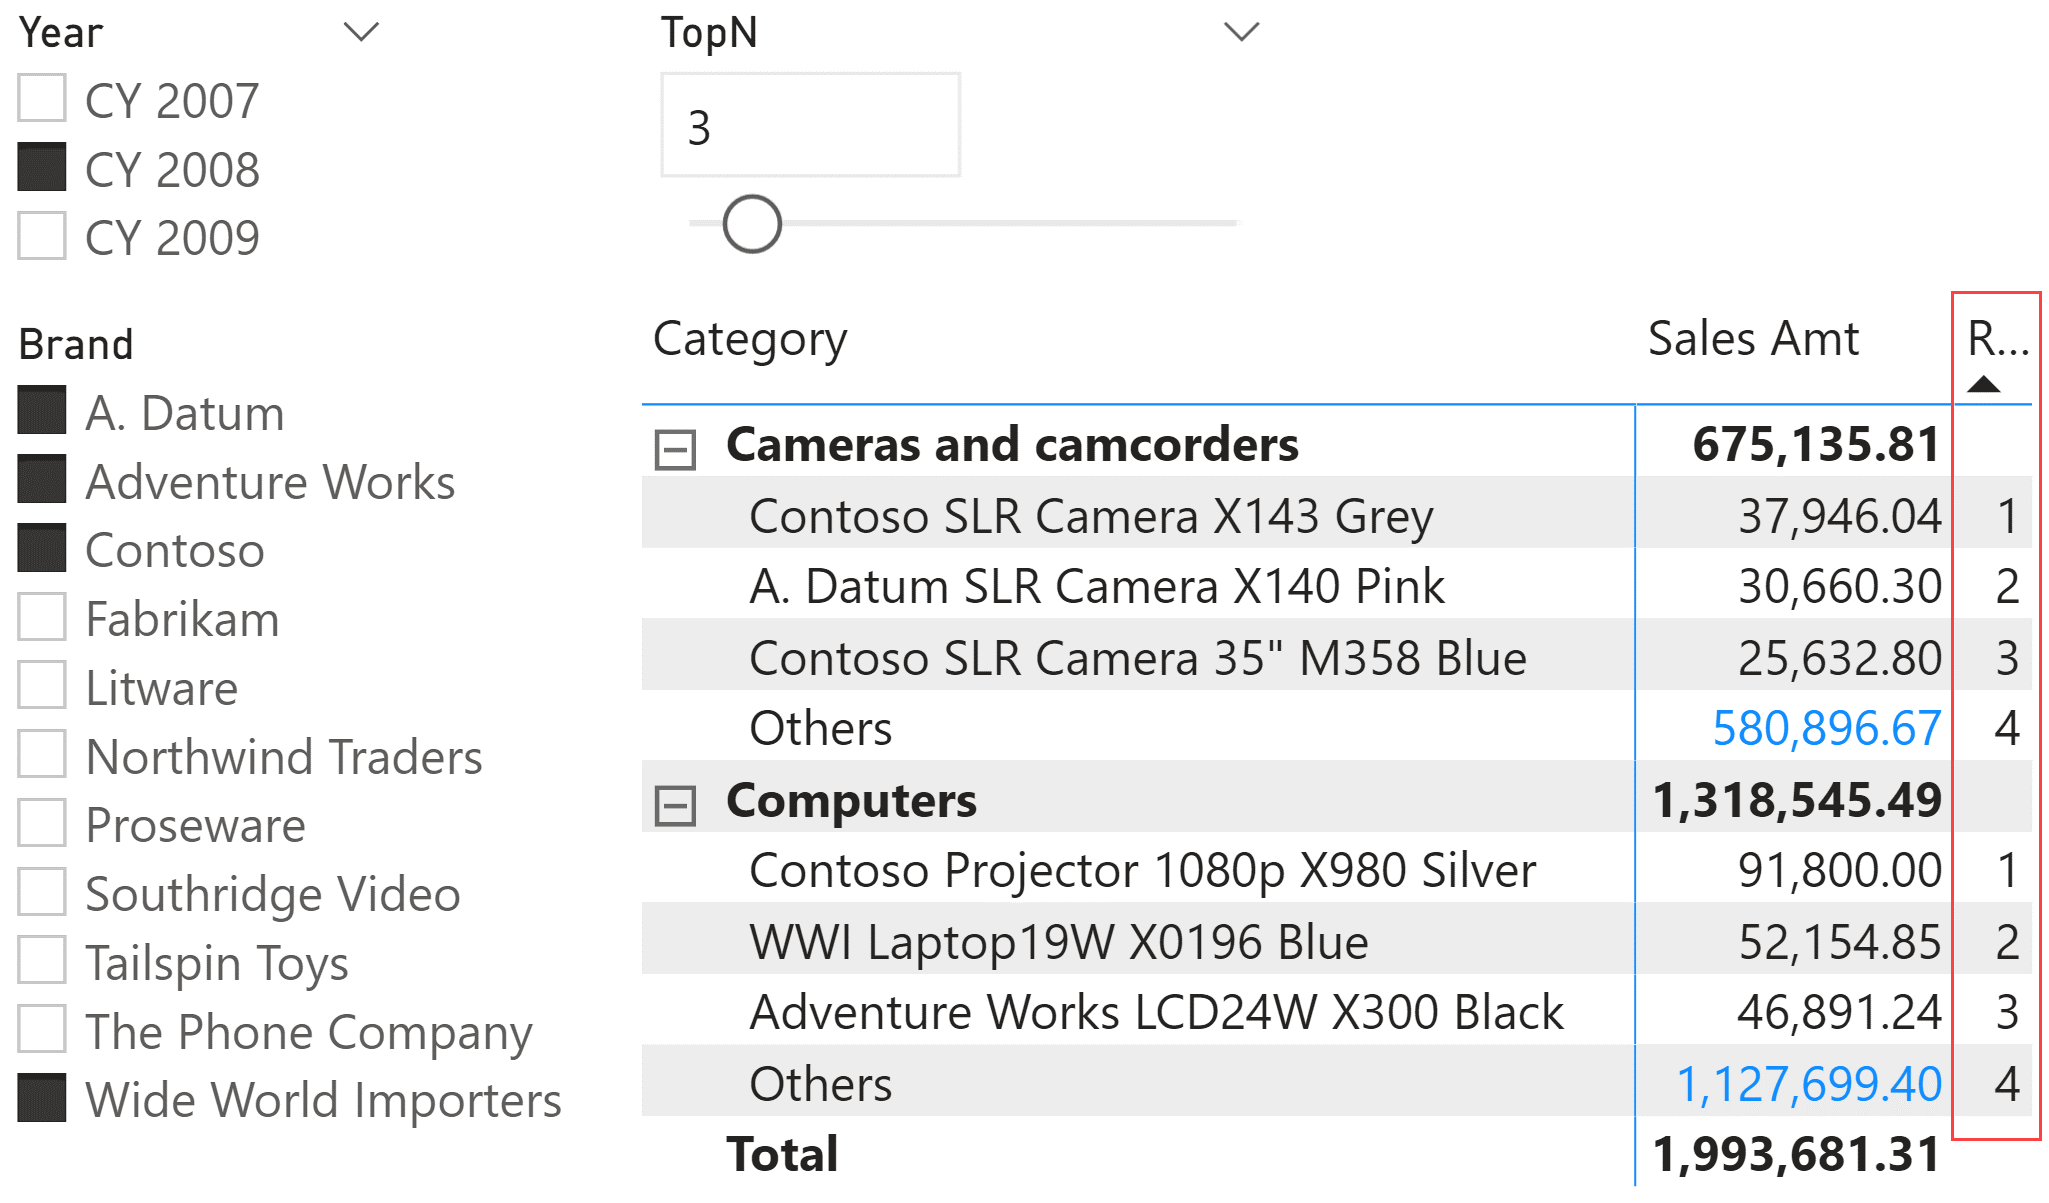
You can deliver advanced Top N + Others functionality by using DAX, as seen in this example from SQL BI. This approach adds an Others Row, with subtotals and grand total, and you can play around with various measures and values of N.
While this repeats the Top N for each category, it is not a truly nested multi-level Top N (as the parent category is not restricted to Top N values).
This approach is also not fully dynamic. The significant use of DAX also keeps such a solution out of reach for most Power BI users. Even the expert DAX users will find significant improvement in productivity by using the option outlined below.
For a truly dynamic and comprehensive Top N implementation, let us explore a solution using Inforiver with the following characteristics:
a) It does not require users to code – you can set it up in seconds
b) It gives you the option to enable/disable Others row
c) It sorts values by default in descending order, except for the Others row that always appears at the bottom
d) It supports Top and Bottom variants for a given N
e) It supports both numeric and percentage values for N (e.g., Top 10 products or Top 5 percentage)
f) It supports multi-level and nested top N configurations (e.g., Top 10 products from Top 3 categories in the Top 2 regions = 60 records); also supports a combination of Top and Bottom N (e.g., Bottom 3 products in the Top 3 regions).
g) It is highly flexible and dynamic – you can change the configuration anytime or disable it in seconds
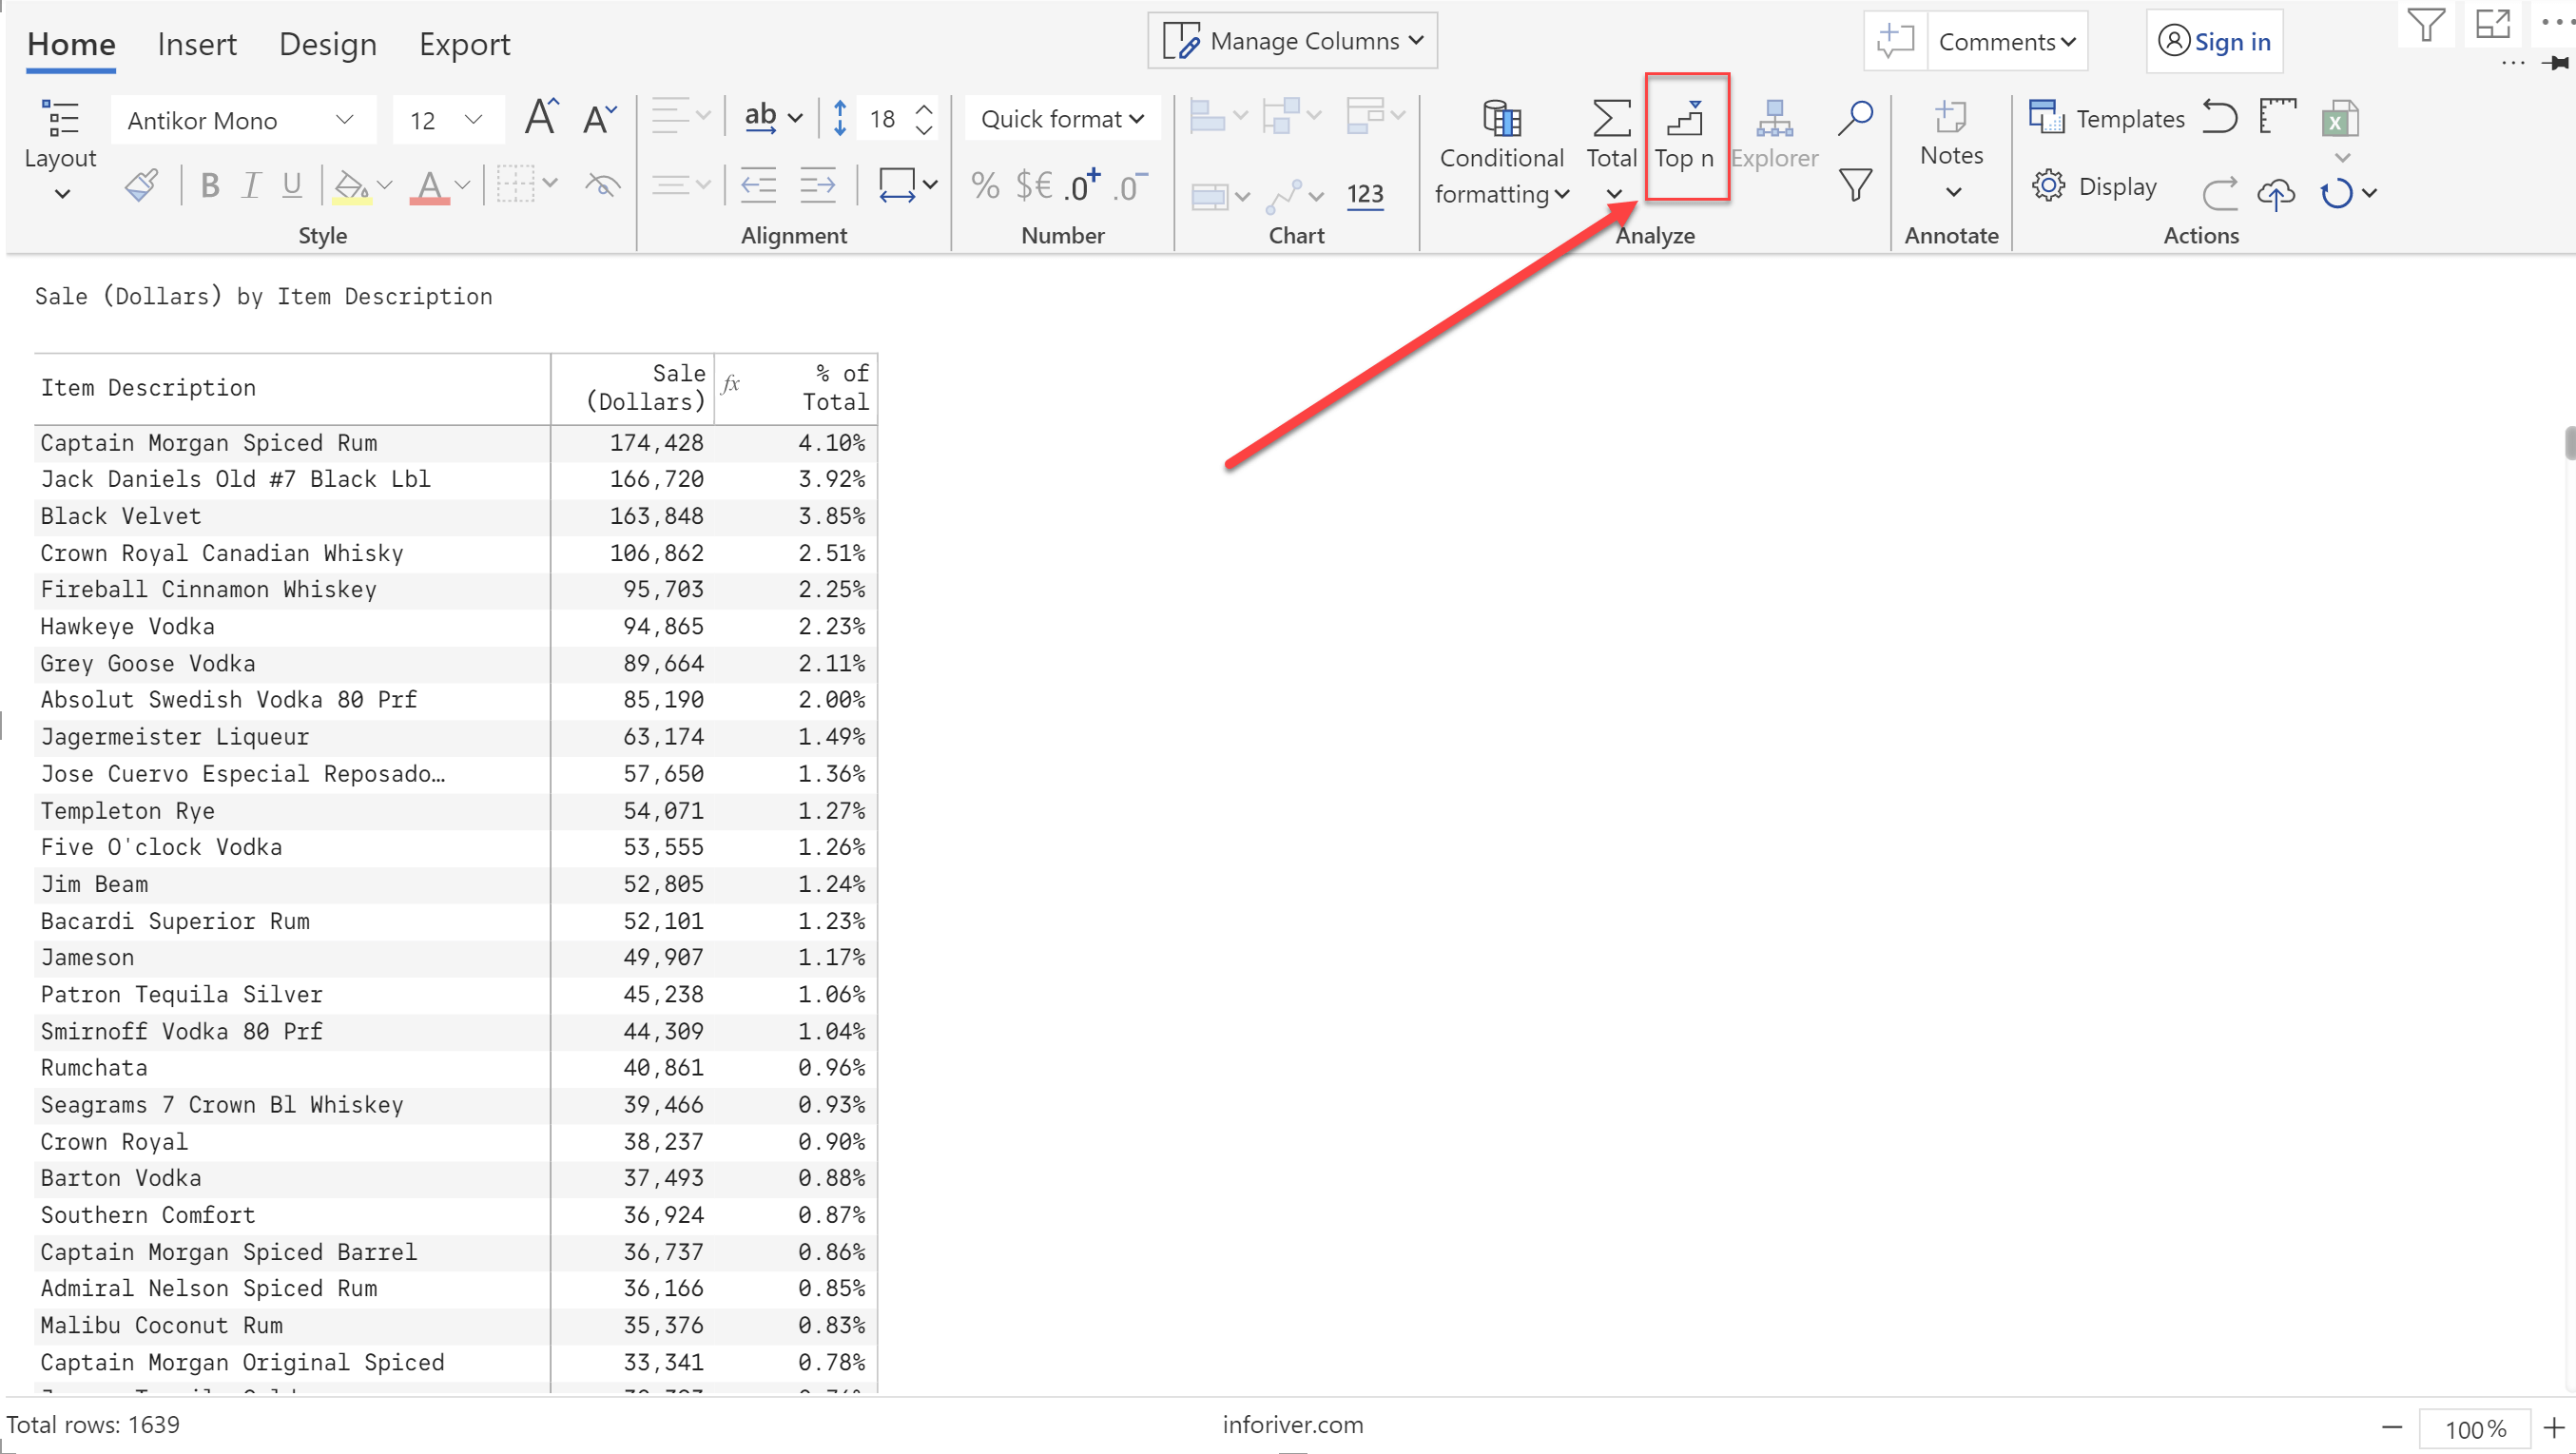
With Inforiver, you can set up a Top N filter anytime by clicking on the icon labeled ‘Top N’.
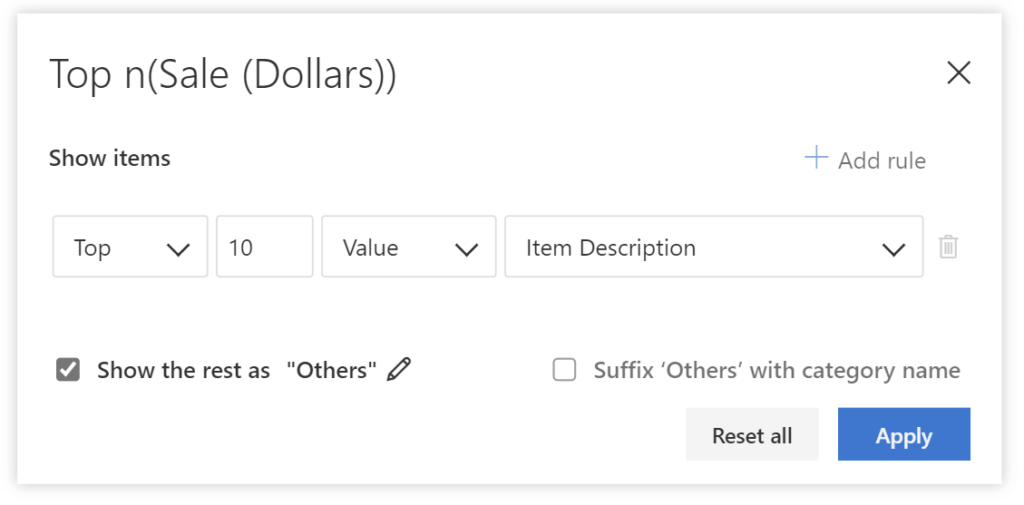
This opens a pop-up window. Fill in the following to filter the Top 10 items (to show the top 10% of items, just change the selection ‘Value’ to ‘Percentage’).
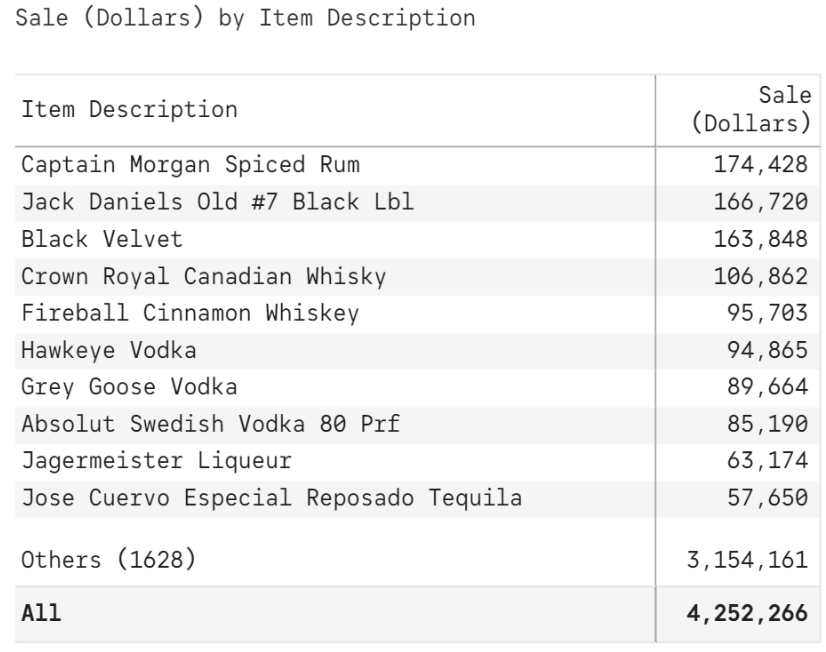
On clicking Apply, Inforiver immediately displays the following top 10 items with Others. It also indicates how many items are a part of the Others row (1628 items) – something that we have not seen in any solution yet.
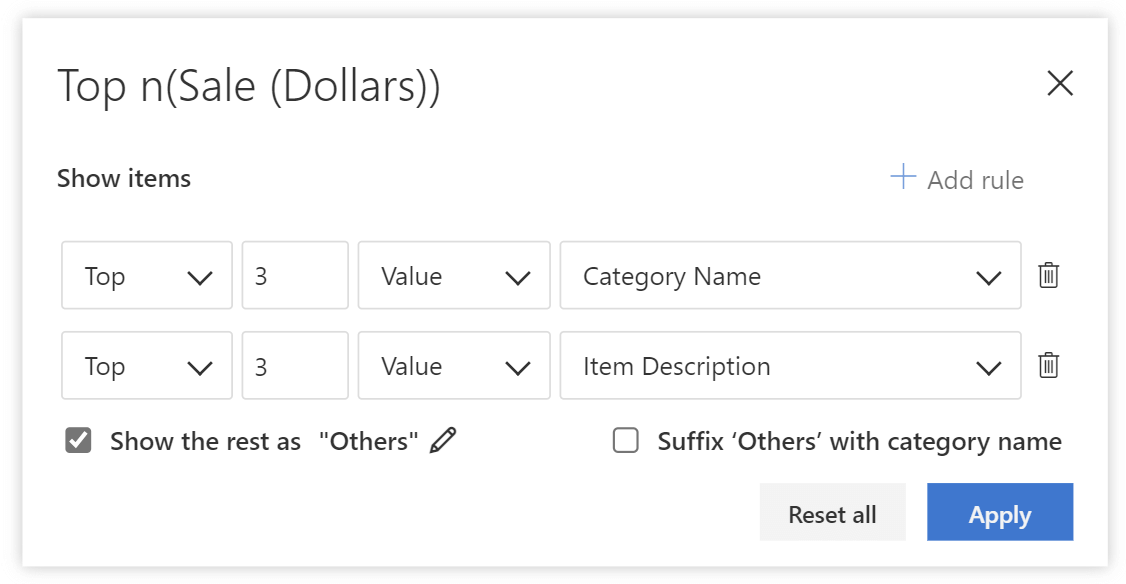
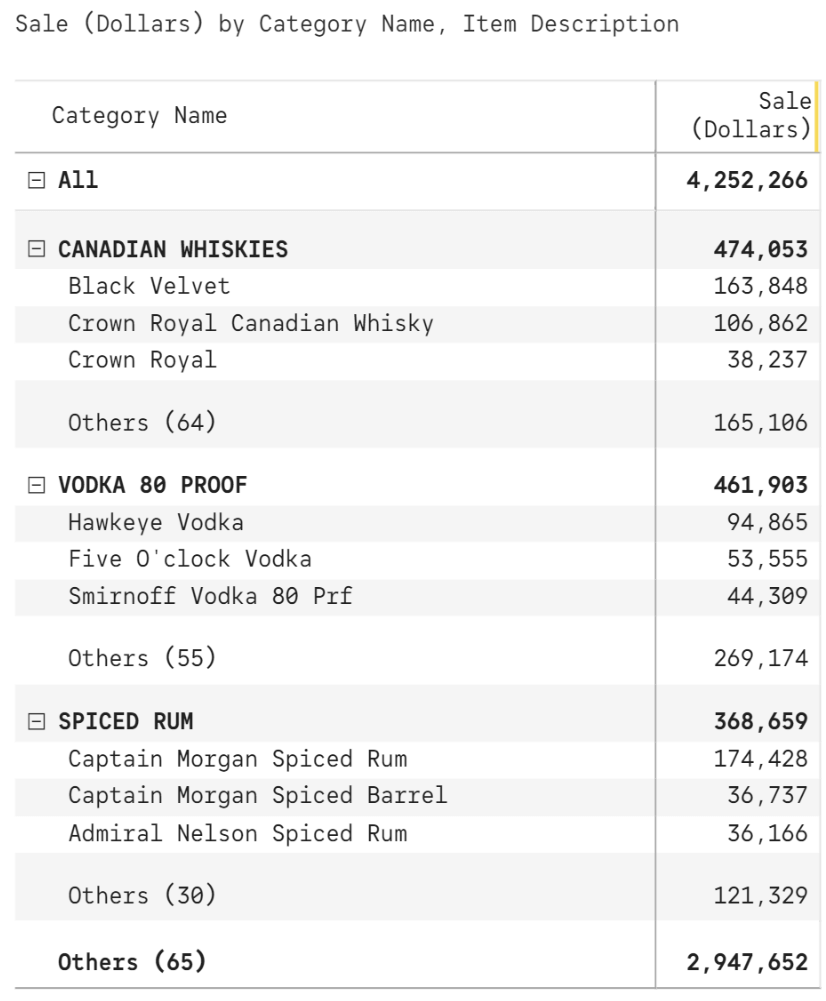
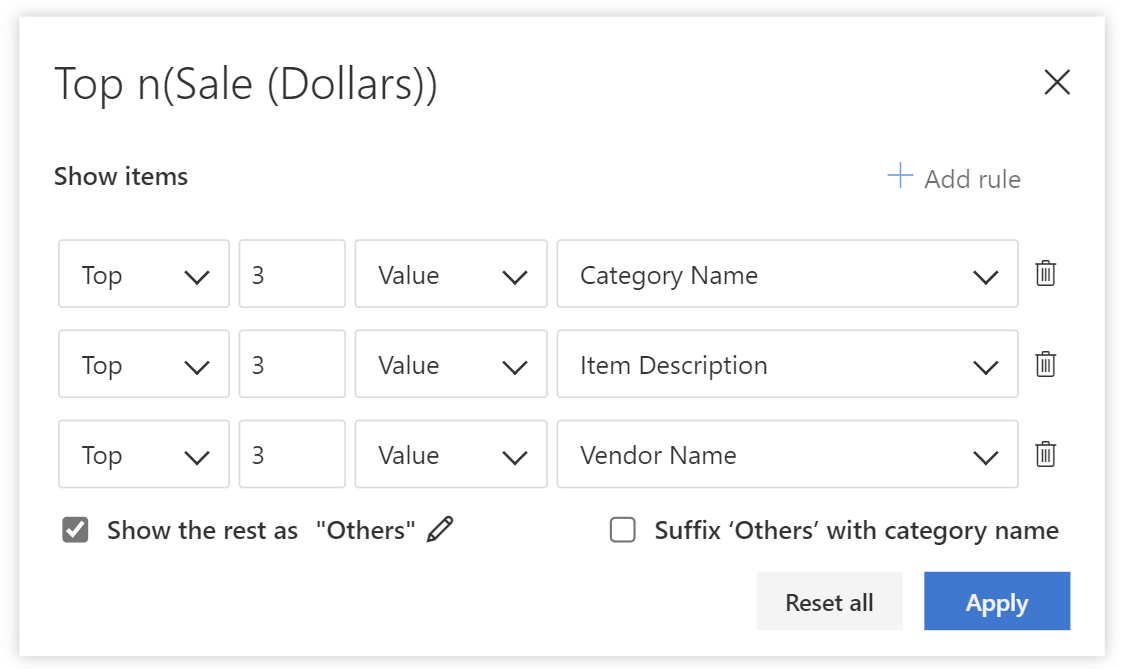
To do a nested Top N, say Top 3 items in each of the Top 3 categories, create multiple rules by clicking on the ‘Add rule’.
The above setup displays the following output. Note that the Others row is available for both parent and child items. In addition, since this is a nested hierarchy, it may be preferable to move the grand total to the top as shown below.
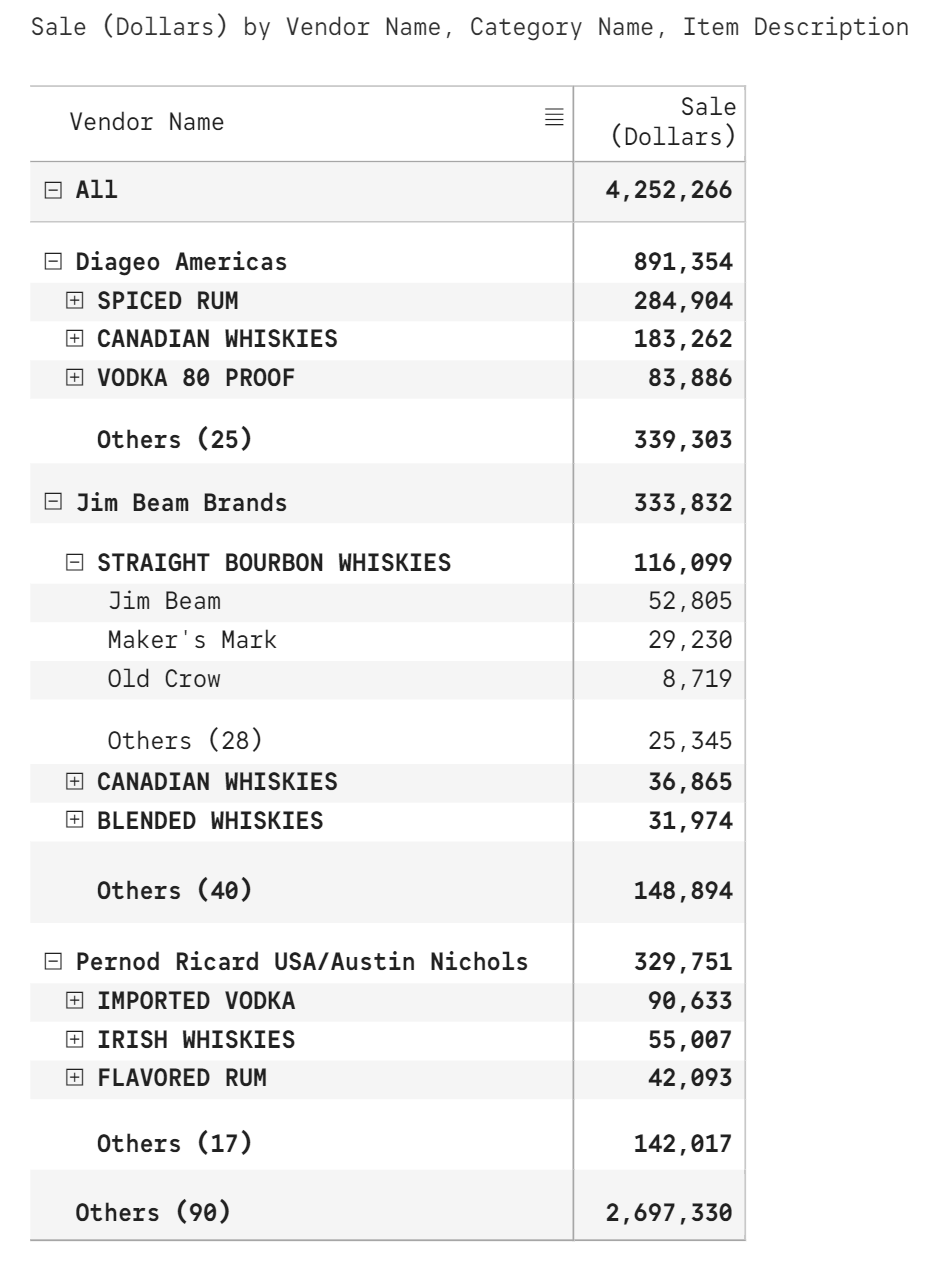
You can increase the number of hierarchy levels even beyond two (2). Just add another rule to configure the third category.
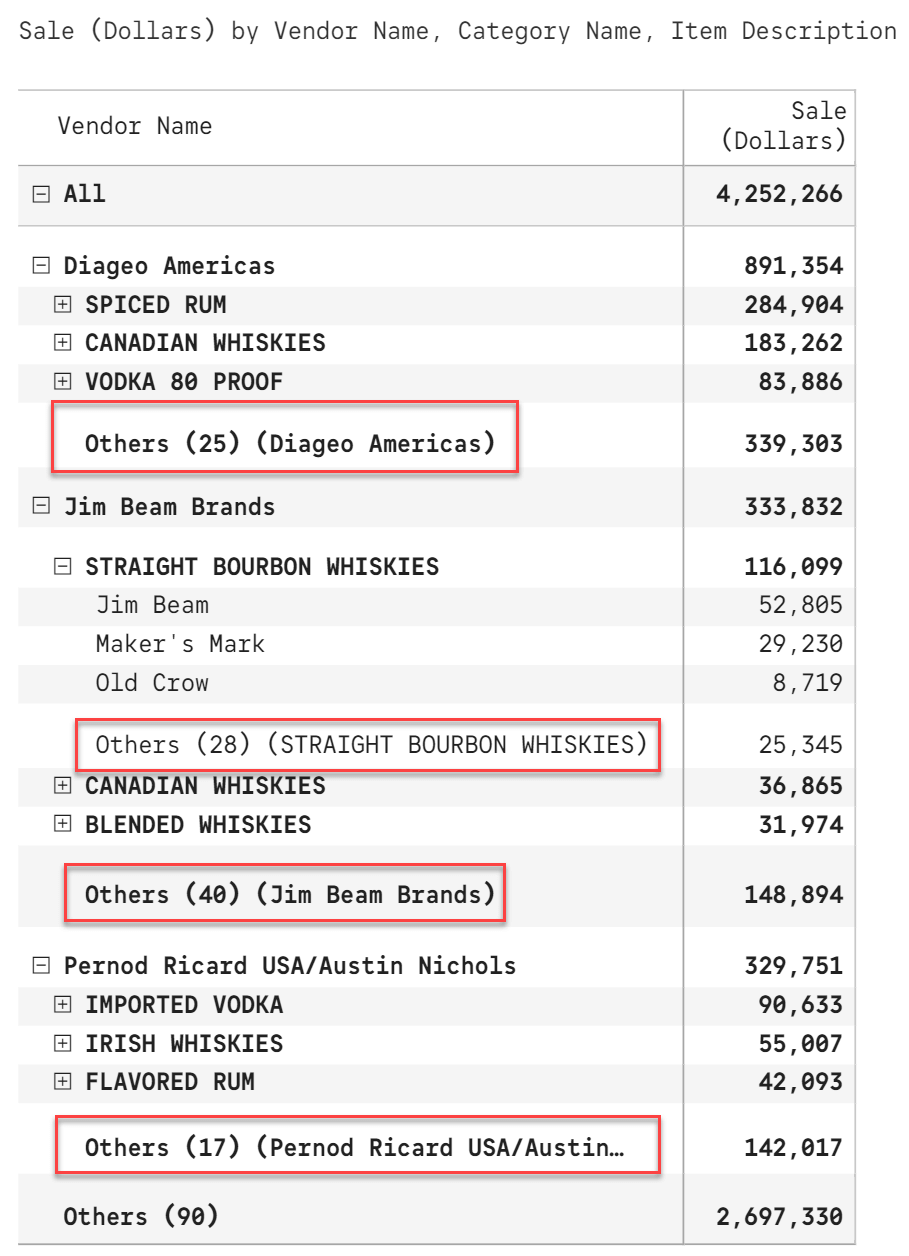
This configuration gives the following output. To keep the image compact, only STRAIGHT BOURBON WHISKIES are expanded to reveal its children.
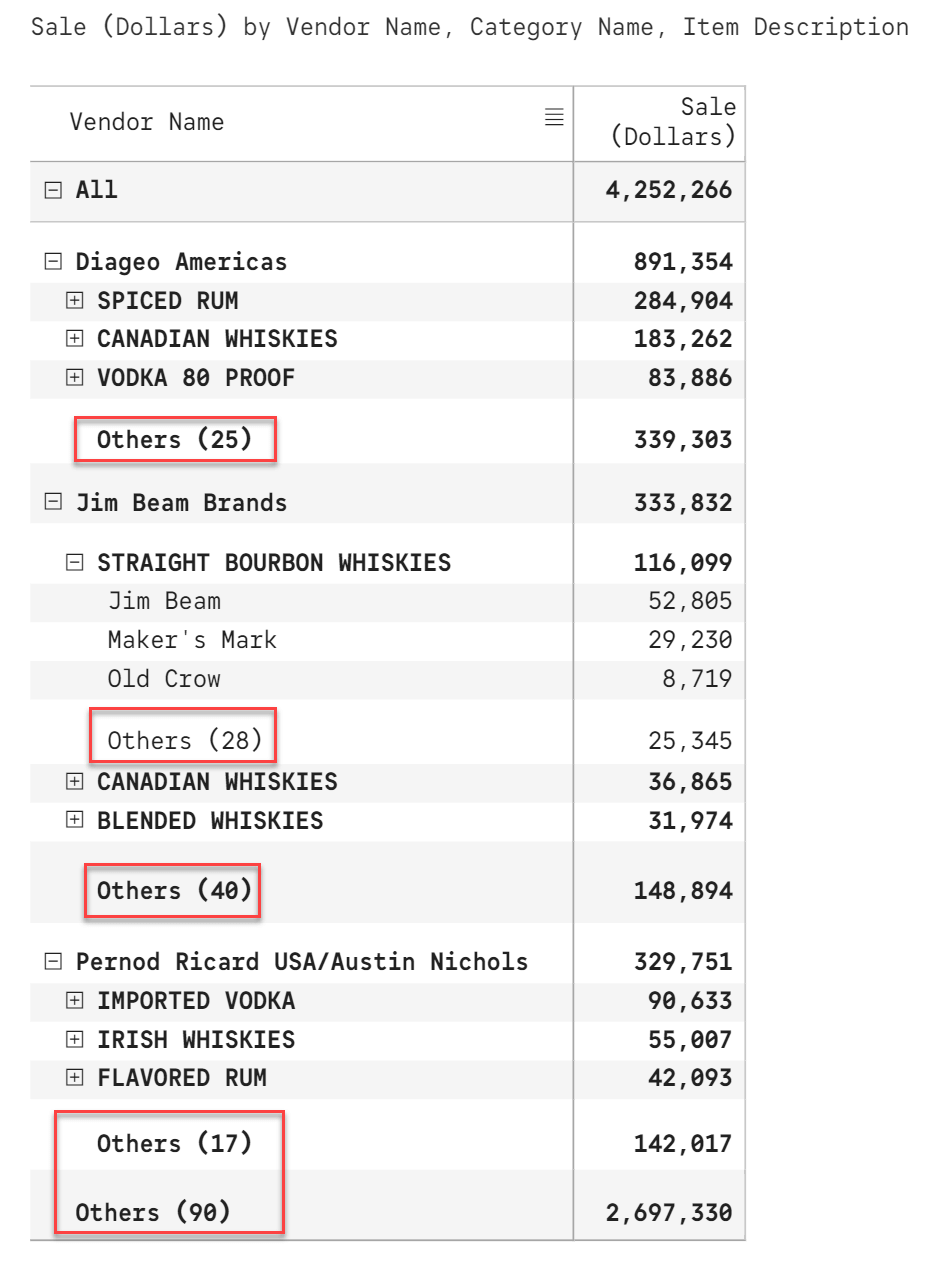
Can you think of any way in which the multi-level and nested implementation above can be enhanced further?
Well, if the report is going to require a scroll or is going to run into multiple pages, it may not be clear as to what a specific Others row refers to. Sometimes, having multiple Others in a single view may also cause confusion.
To address this, Inforiver provides another option.
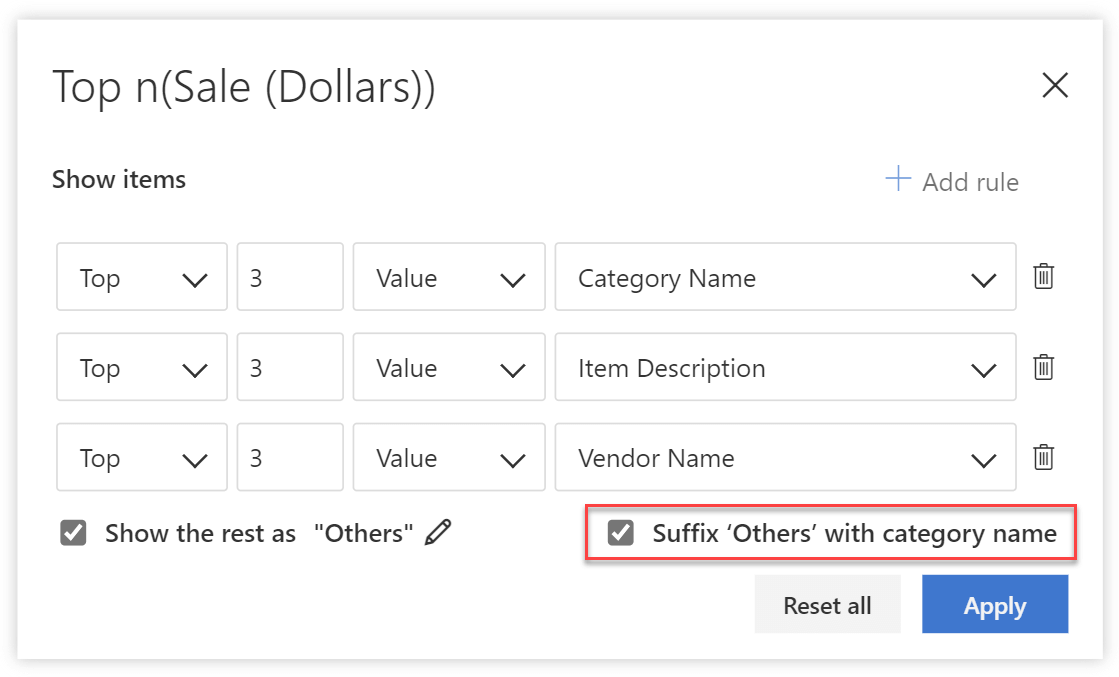
This appends the category name to Others to each instance of others, except the one at the outer-most level.
While we did not exclusively discuss Bottom N + Others, everything that applies to Top N equally applies to Bottom N.
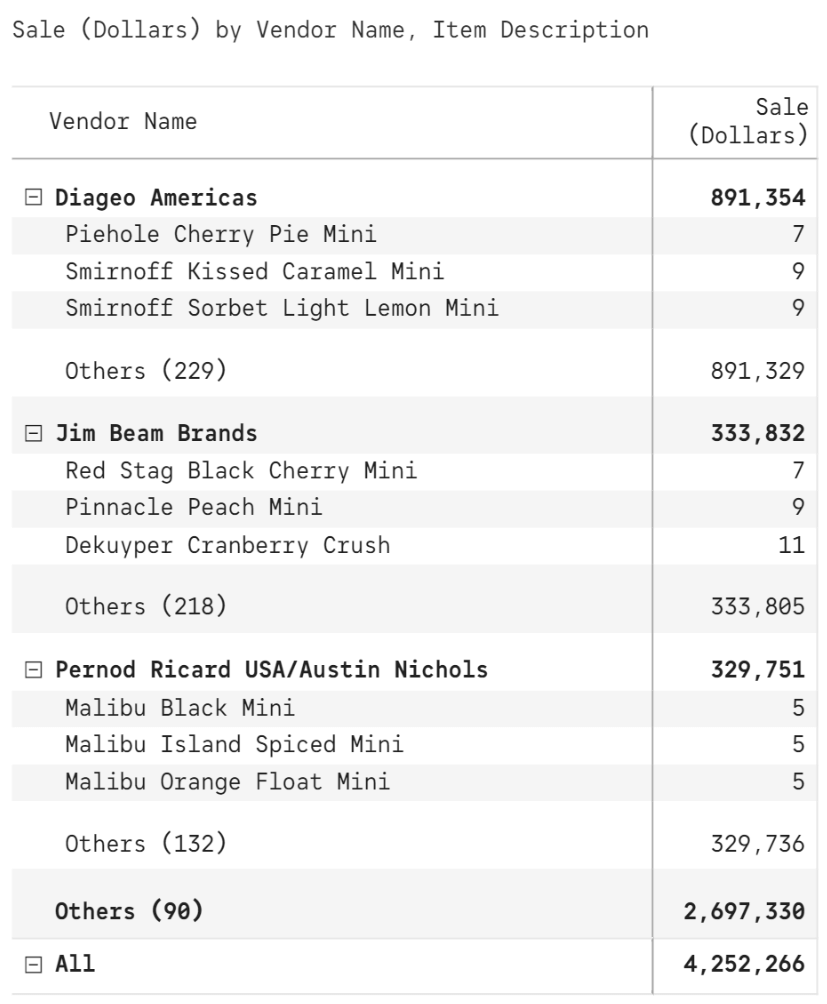
With Inforiver, you can do a nested combination of Top and Bottom N. For example, you can set up the report to show the least sold items (Bottom N) belonging to the leading liquor vendors (Top N) as below.
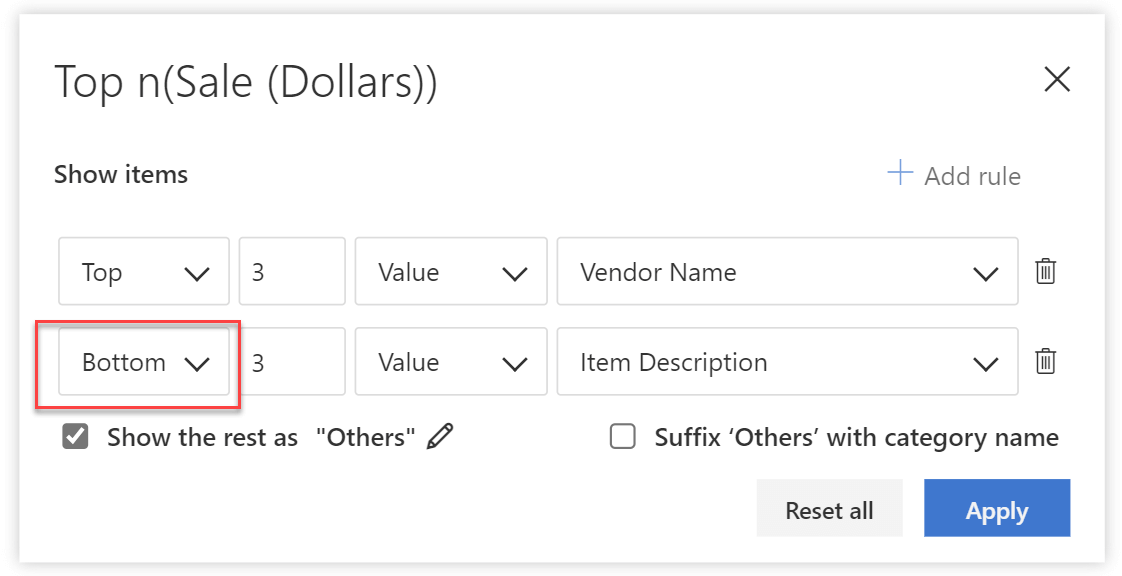
This provides the following output.
***
While Tableau is not a core focus of this post, Top N is a more commonly discussed feature in Tableau implementations. Given this, let us quickly look at how Tableau handles Top N and its variants.
Setting Top N with Tableau is not as quick and easy as it is with Inforiver as you still need to type in some formulae. However, implementing Nested Top N + Others in Tableau, while possible, requires a considerable amount of design effort.
For organizations looking to migrate their existing Tableau reports to Power BI, Inforiver offers a rapid migration path.
To conclude, Top N + Others capability is not comprehensively addressed by tools in the market today. There is a gap that exists between what users need, and what the analytics tools can deliver, even after considering their scripting capabilities.
Inforiver delivers Top N + Others, and many more such capabilities using a powerful & intuitive no-code user experience. This delivers the power of Top N analysis and other such features into the hands of numerous users who are not conversant with DAX. Inforiver’s out-of-the-box capabilities also help organizations using reporting tools such as Tableau, Qlik, MicroStrategy, and Spotfire rapidly migrate reports to Power BI. .
Did you try out the Top N feature of Inforiver? If so, visit the Inforiver community and let us know what you think.

Inforiver helps enterprises consolidate planning, reporting & analytics on a single platform (Power BI). The no-code, self-service award-winning platform has been recognized as the industry’s best and is adopted by many Fortune 100 firms.
Inforiver is a product of Lumel, the #1 Power BI AppSource Partner. The firm serves over 3,000 customers worldwide through its portfolio of products offered under the brands Inforiver, EDITable, ValQ, and xViz.


