Inforiver

Upcoming webinar on 'Inforiver Charts : The fastest way to deliver stories in Power BI', Aug 29th , Monday, 10.30 AM CST.    Register Now

7 things to consider when you migrate reports from Tableau to Power BI

by Inforiver | Sep 14, 2022 |

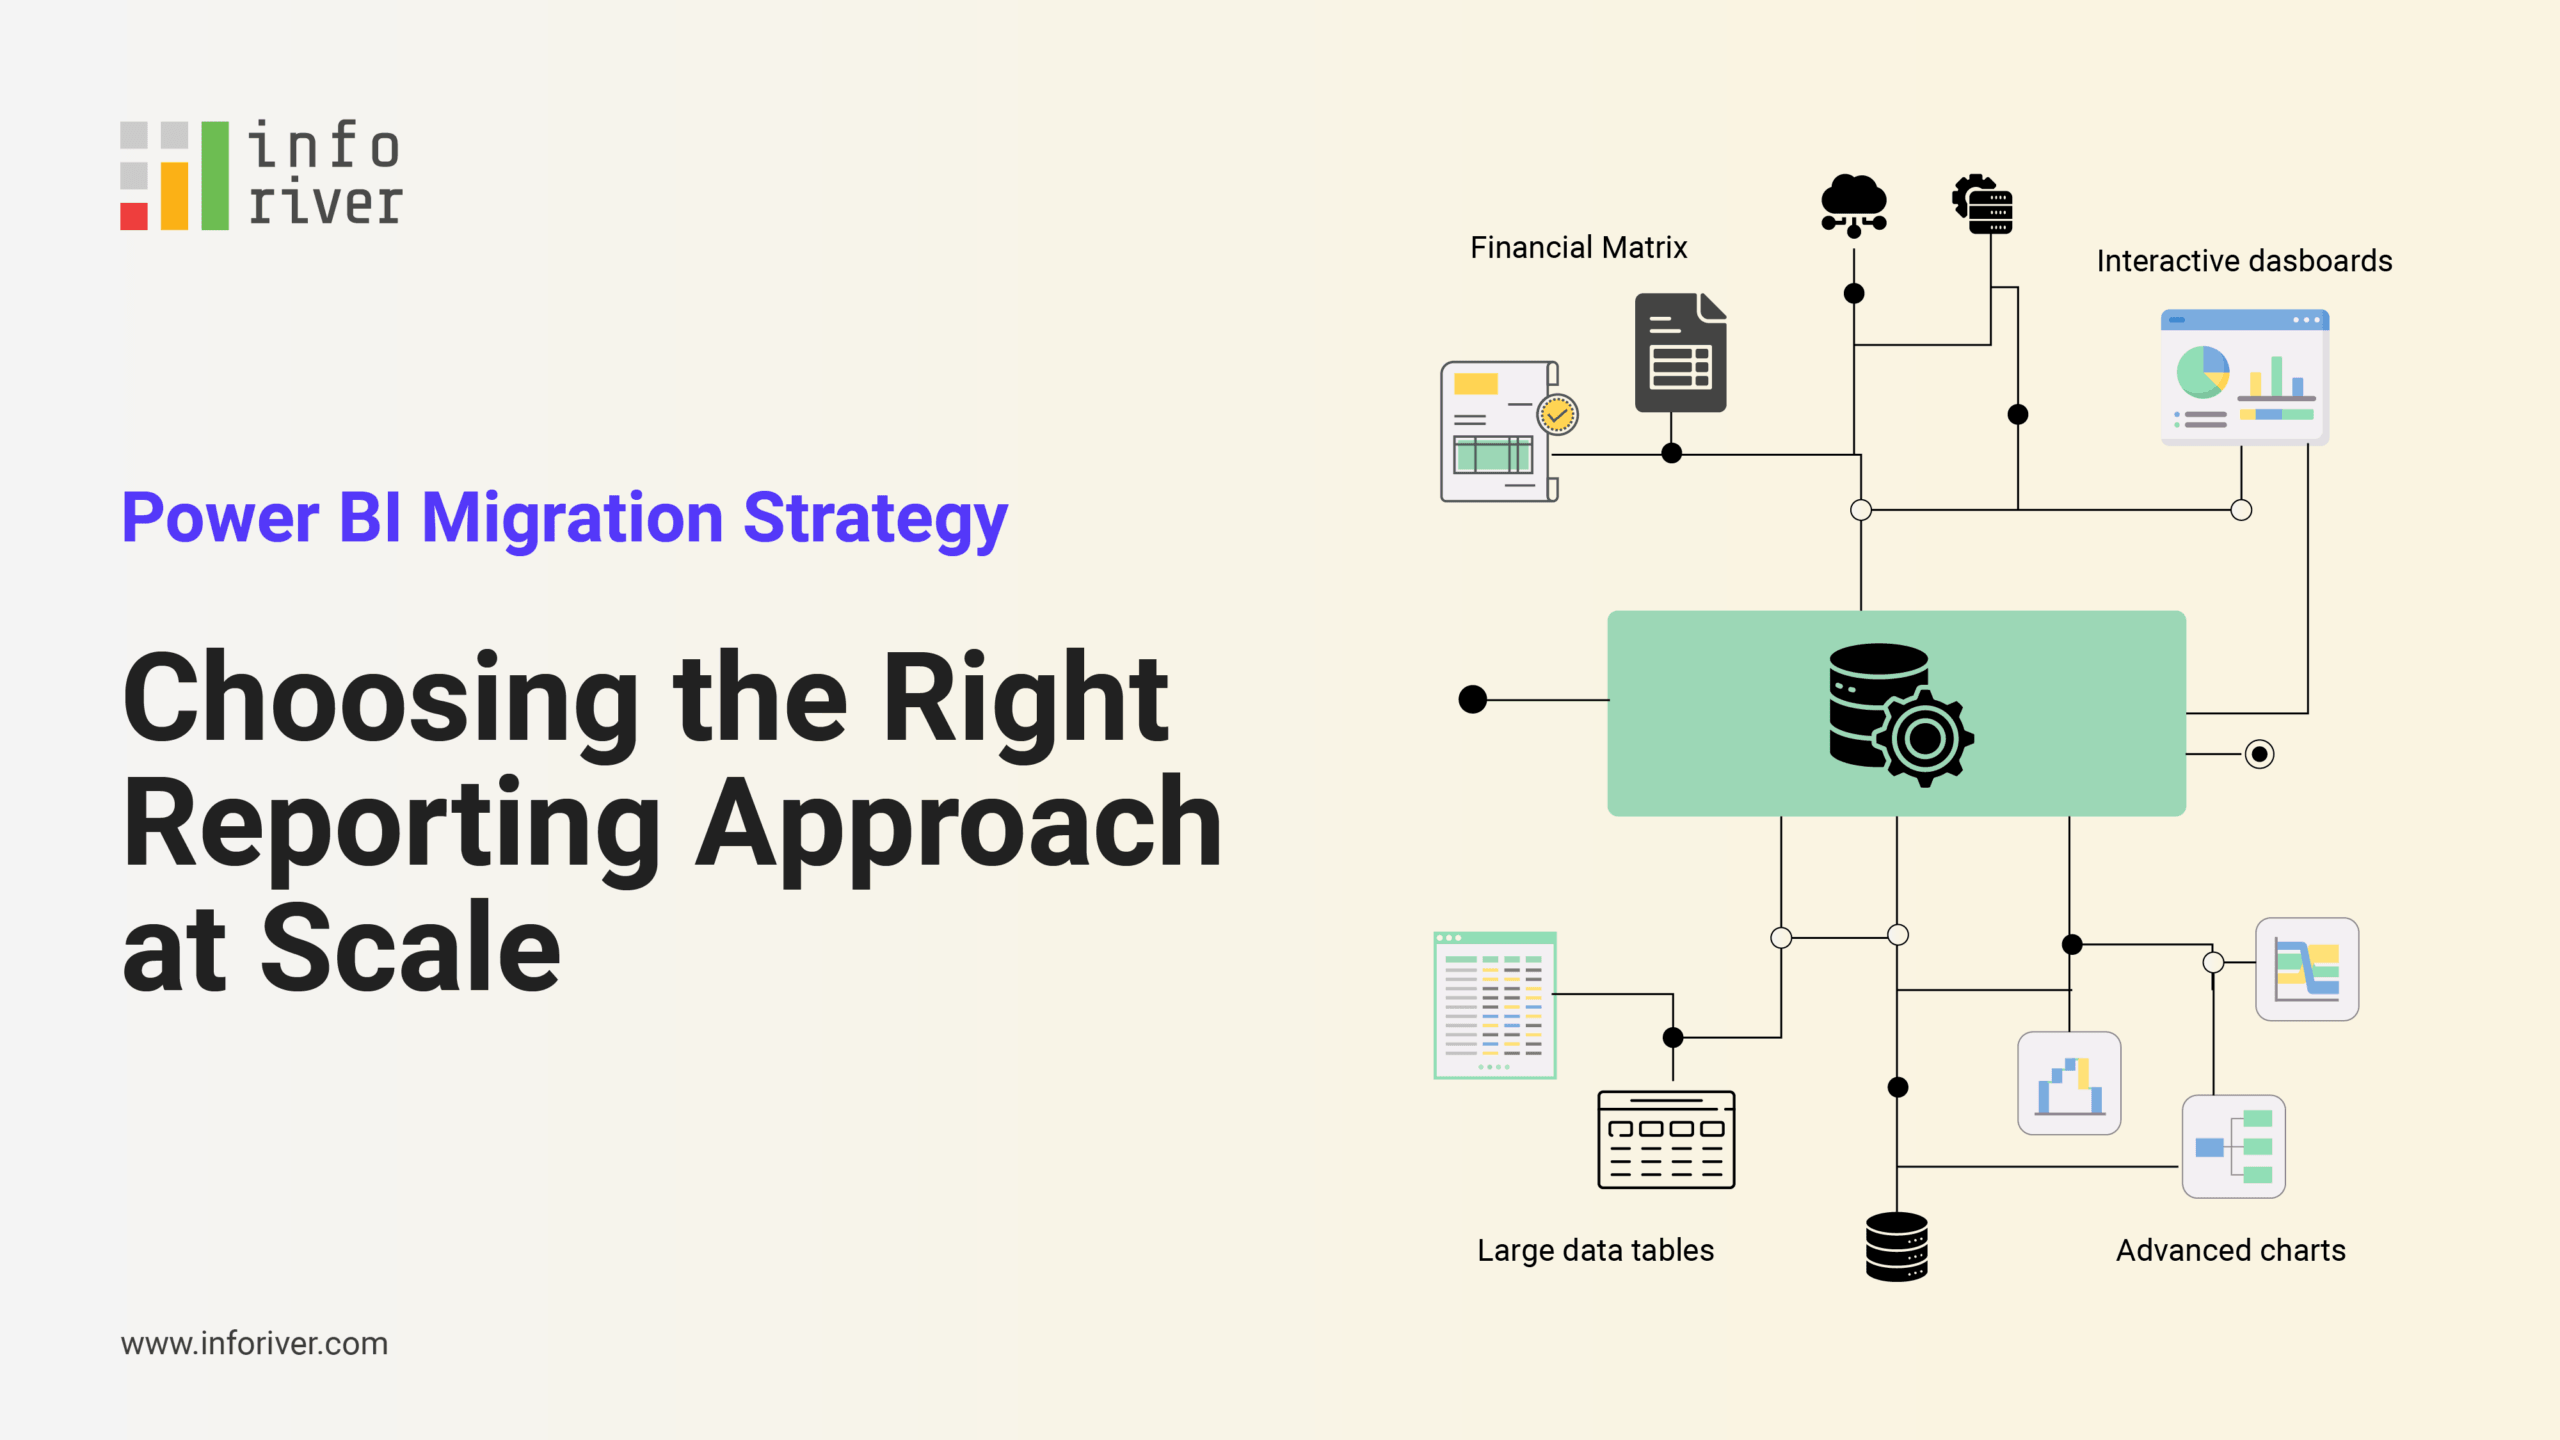
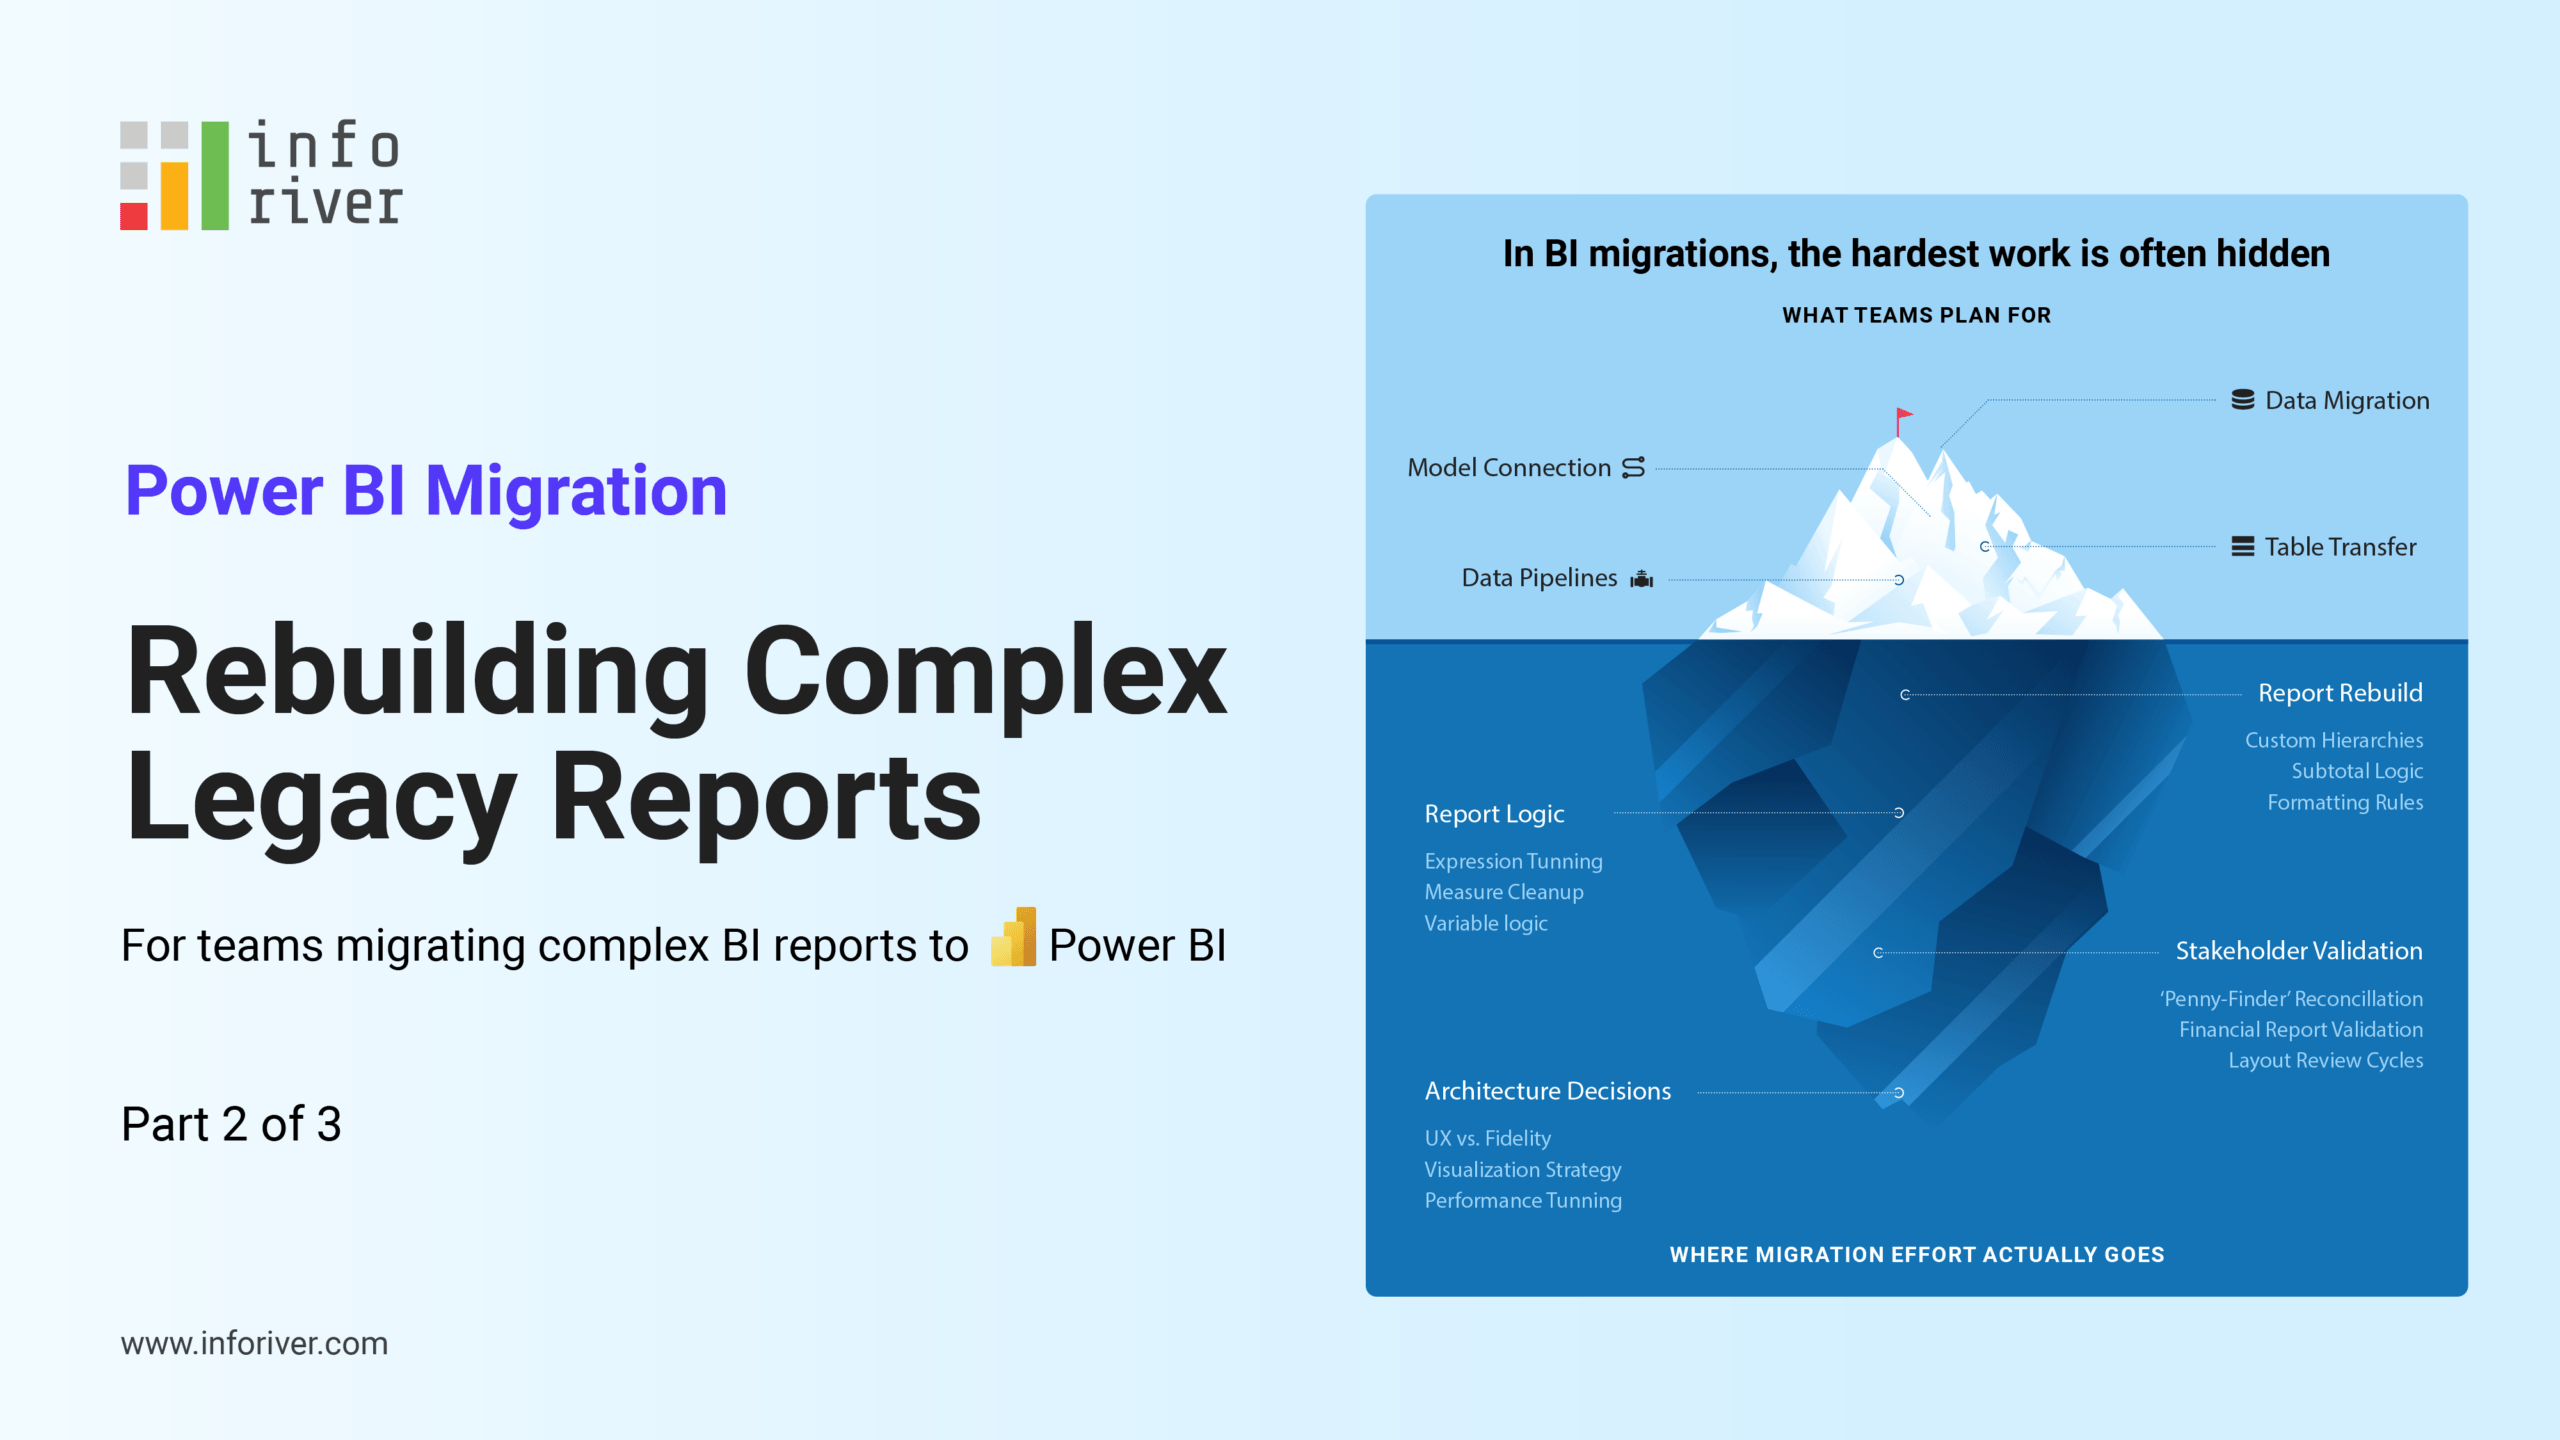
Migrating reports from Tableau to Power BI can get highly complicated depending on your report volume.  

To ensure that your migration initiative goes successful, you need to consider the following factors before you commence the initiative: 

  1. Infrastructure: Understand the licensing landscape of Power BI as you have several options to choose from. Figure out which offering works best for you – Power BI Pro, Power BI Premium (by Capacity), Power BI Premium Per User, or Power BI embedded. Keep in mind any changes to your consumption & usage patterns in the interim and long run. 
  2. Administration & Workspace Management: You need to ensure that your Power BI administrators are prepared and adequately engaged in the process. In many organizations, the business units take an independent decision to migrate to Power BI and subsequently assign administration to IT at the time of rollout. Ensure that you do not end up with an IT that has neither the interest nor experience in administering the transition.  
  3. Business Operations Continuity: Migrate all the reports on time. The biggest dampener for any migration initiative is a prolonged transition keeping your users to second-guess when their reports are going to be migrated. Ensure that your business users continue to receive insights during and immediately after the migration, without encountering any outage, reporting errors or operational interruptions. 
  4. User Training: Switching tools requires a change in mindset, and it is highly critical that the key users are trained in Power BI. Failure to adequately train the users may hinder the transition or even derail the success of migration. The last thing you need is users continuing to hang on to their old Tableau reports as they do not understand the new toolset well.  
  5. Specialist support: Tableau is primarily a visualization tool, whereas Power BI is a model-based reporting & visualization tool. For your team to make the transition successfully, you need to have more than Power BI developers. You will require experts in data warehousing, modeling and M/DAX scripting. If you do not have these skills in the organization, consider hiring specialists or consultants to support at least till the critical reports are migrated. 
  6. Migrate stories, not report layouts: When you migrate Tableau reports, do not try to methodically recreate report UI element-by-element in Power BI. Instead, quickly re-assess the UI and deliver a design or layout that is best supported by Power BI. You may think that redesigning report layouts may require additional efforts and will take longer, but you will be surprised. It is typically a lot easier than you think. 

    The reason is that each product has its own characteristics, and one feature best supported by a tool may not be supported well by another. E.g., bullet charts inside tables are not supported by Power BI – something many organizations have used in Tableau. Instead of trying to replicate this in Power BI, you may find it a lot easier delivering what the user is looking for - till date sales performance (MTD/QTD/YTD) against a benchmark.

    Thus, by being open to design & layout modifications, you may be able to migrate to Power BI a lot more easily. 
  1. Leverage third-party visuals: The third-party visuals ecosystem is non-existent in Tableau. By considering third party visuals, you will get to unlock a lot of Tableau’s features not normally found in Power BI. For example, with Inforiver Charts & Matrix, you will be able to deliver the following:  
  • Graphical tables (charts inside tables) – with support for bar / column / spark line / bullet / waterfall / dumbbell range and many other charts 

    Graphical Tables
  • Visual-level formula engine to perform quick calculations – this method is 20x faster than leveraging DAX, which can be extremely frustrating for beginners. Leveraging visual-level calculations also increases migration velocity. When you consider 500+ reports, the time savings can be extraordinary 

    Formula Engine
  • Extensive formatting options  
  • One-click design templates  
  • Support for formatted and paginated reports with icons in report headers 
  • Formatted exports to Excel & PDF 

Any tool or software migration brings a lot of anxiety to stakeholders, but it need not be the case if you are well prepared and flexible. 

Looking to migrate your Tableau reports to Power BI? Reach out to us to learn how Inforiver can accelerate your migration efforts and mitigate transition risks. 


Share this on:

Get Inforiver brochure

Maximize your business potential with Inforiver's paginated reporting, data entry, planning & budgeting capabilities
Download now
Inforiver
About Inforiver!
Inforiver is the fastest way to do everything in Power BI. It enables citizen developer productivity and unleashes true self-service with our intuitive and interactive no-code data app suite for Microsoft Power BI. The product is developed by Lumel Technologies Inc, who are #1 Power BI Visuals AppSource Partner serving over 3,000+ customers worldwide with their xViz, Inforiver, and ValQ offerings.
Other Products
Inforiver Logo
IBCS Certified
Power BI certified

About Inforiver!

Inforiver is the fastest way to do everything in Power BI. It enables citizen developer productivity and unleashes true self-service with our intuitive and interactive no-code data app suite for Microsoft Power BI. The product is developed by Lumel Technologies Inc, who are #1 Power BI Visuals AppSource Partner serving over 3,000+ customers worldwide with their xViz, Inforiver, and ValQ offerings.

Headquarters
5920 Windhaven Pkwy, #130
Plano TX 75093
ValQ
xViz
BI Hub
linkedin facebook pinterest youtube rss twitter instagram facebook-blank rss-blank linkedin-blank pinterest youtube twitter instagram