
Upcoming webinar on 'Inforiver Charts : The fastest way to deliver stories in Power BI', Aug 29th , Monday, 10.30 AM CST. Register Now
Upcoming webinar on 'Inforiver Charts : The fastest way to deliver stories in Power BI', Aug 29th , Monday, 10.30 AM CST. Register Now
In business scenarios, it is very common for decision-makers to examine the following:
This type of analysis is also in line with the Pareto principle, which states that 80% of consequences arise from 20% of the causes.
The Top N analysis does exactly that.
Let us explore this further with an example to understand the utility of Top N reports and its variants.
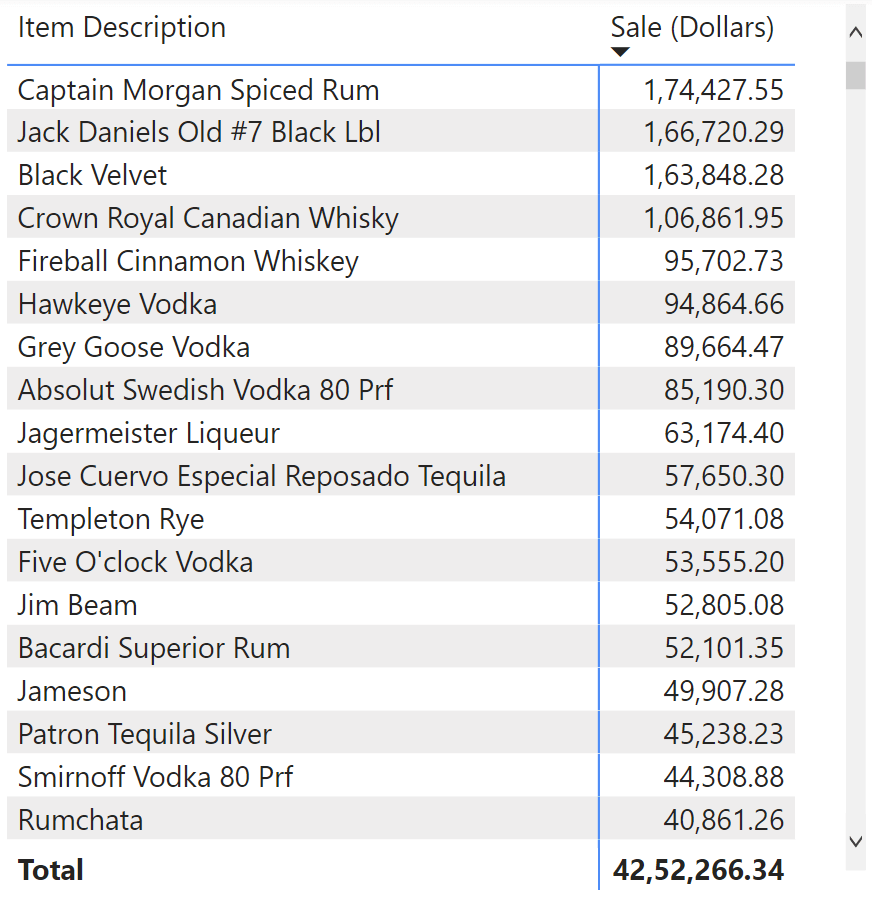
Consider a liquor sales dataset[1] that tracks transactions across various retail outlets at the line-item level. When we list all the liquor items sold by revenue, we get the following 1600+ rows.
Having such a long list in a report can get unwieldy. We can restrict this report, say, to the top 4 products, which would give us this.
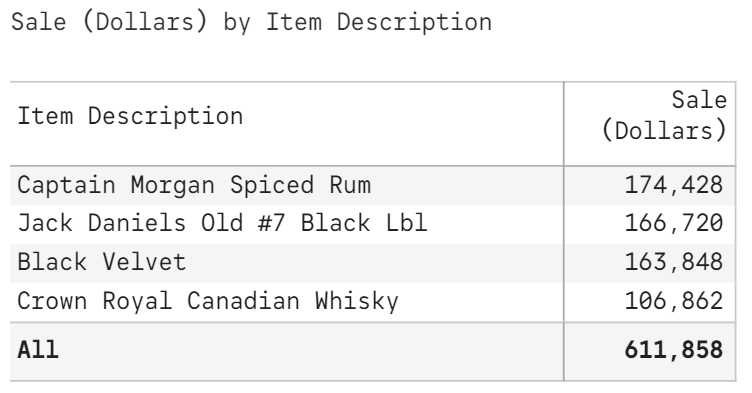
While this format tells us what the top selling products are, it has one minor issue. The total 611,058 does not add any value by itself. It is just information without insight.
One option we have is to just disable or hide the total row.
Another option worth exploring is to have the total row continue to show the sales for all the products – instead of just the top 4 – as shown below.
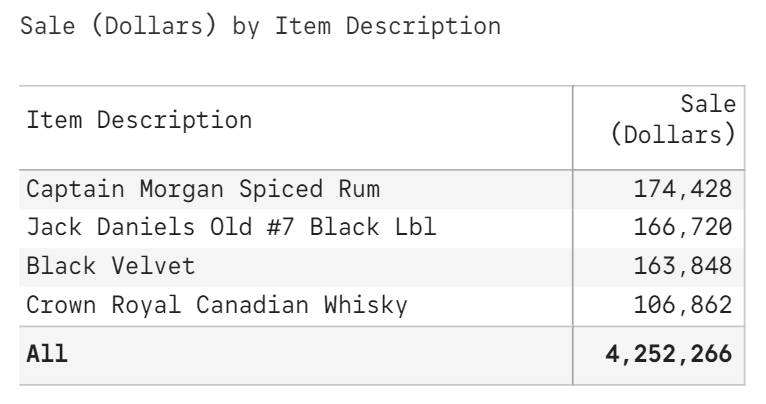
The totals here are meaningful. They even help us do a mental calculation of the contribution from the individual items.
However, having a table that mathematically doesn’t add up is never a good idea. Anyone looking at the table may wrongly infer that the top 4 products contribute to 4.2M in sales.
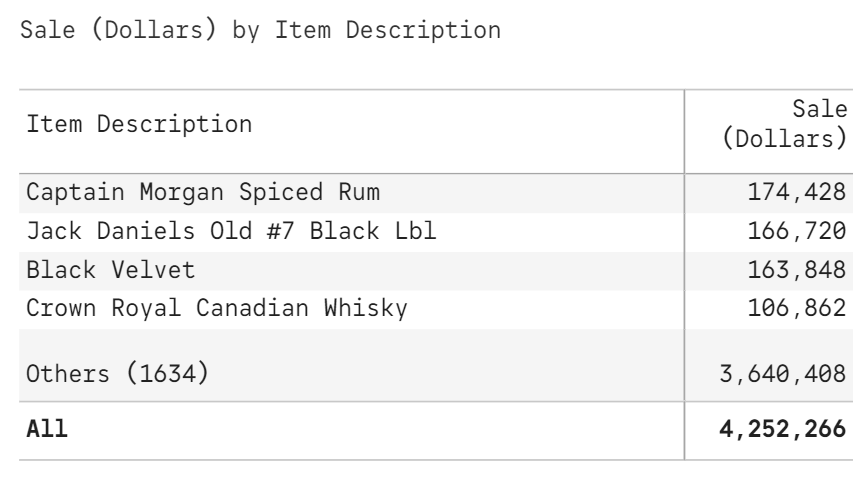
It is for this reason that a separate ‘Others’ row is very helpful. This row can track sales contributed by all the remaining items.
Refer to the improved version of the Top 4 snapshot below. It also goes a step further and adds a nice touch by displaying that there are 1,634 products grouped under Others.
This report can be enriched further by displaying the percentage contribution of each item against the grand total.
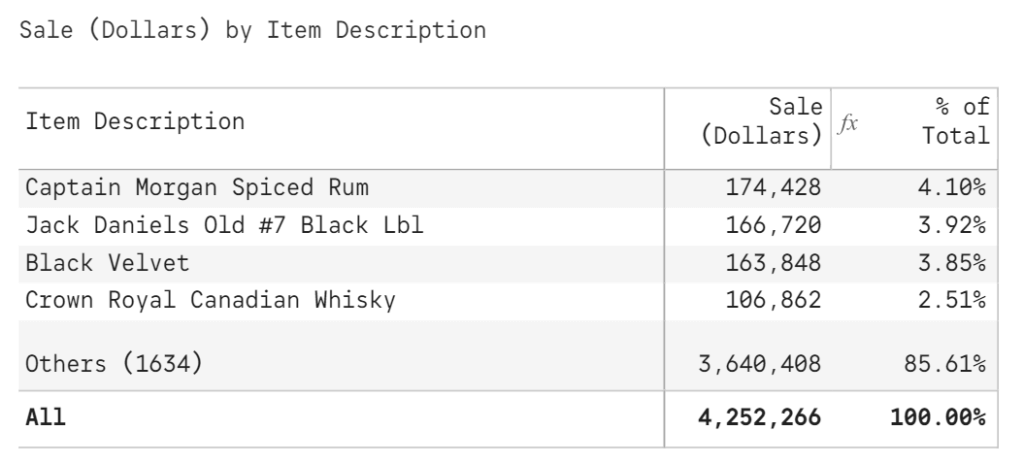
From the above format, we can quickly observe that the sales of everything other than the Top 4 constitutes ~85% of sales. We thereby quickly infer that the top 4 deliver ~15% of sales.
The Top N + Others is said to be dynamic when you can change the order of N instantly, without having to spend time rebuilding the report. The dynamic top n variant can be a powerful tool in the hands of analysts.
Note that N can be numeric (e.g., Top 5) or a percentile (e.g., Top 10%). The best implementations of dynamic top n allow you to switch between numbers and percentiles at will.
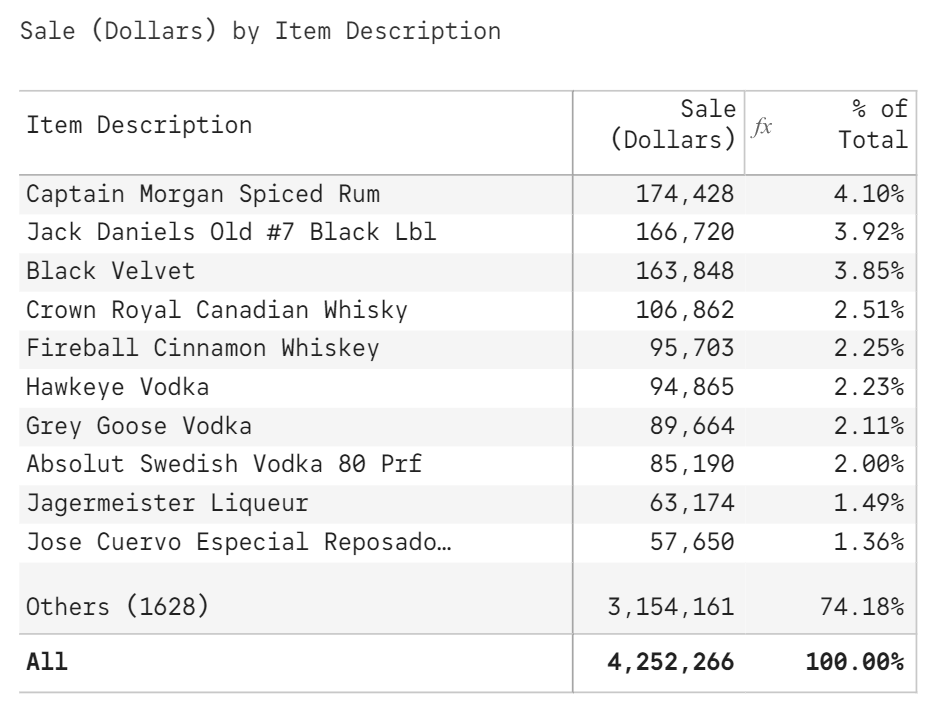
In this example below, we have changed N to 10. You can quickly note that the Top 10 products contribute to ~26% of the sales. From the same table, you can also infer that the Top 3 products contribute to ~12% of sales.
Given the utility and flexibility of such an analysis, it is not surprising that the Dynamic Top N + Others is a very common requirement in organizations of all sizes and types.
Let’s look at another advanced form of the Top N analysis – the Nested Top N + Others.
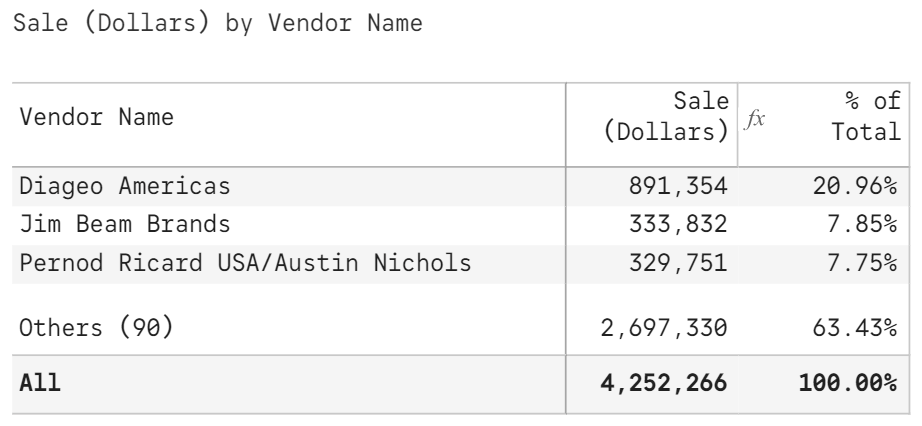
The 1600+ products in our dataset are supplied by 90+ vendors.
Let’s assume that our firm has some budget available to run product promotions. It can go ahead and choose, say, choose Top 10 products directly from the list shown above.
However, running promotions requires the organization to coordinate with the respective vendors. To keep the promotions focused & effective, the firm decides to restrict promotions to the Top 3 products from each of the Top 3 vendors. This is an example of nested Top N.
When we look at the top 3 vendors, we get the following.
The top 3 products from each of the above vendors are shown below. Note that the 9 products listed below are different from the first 9 products showcased in the Top 10 report above.
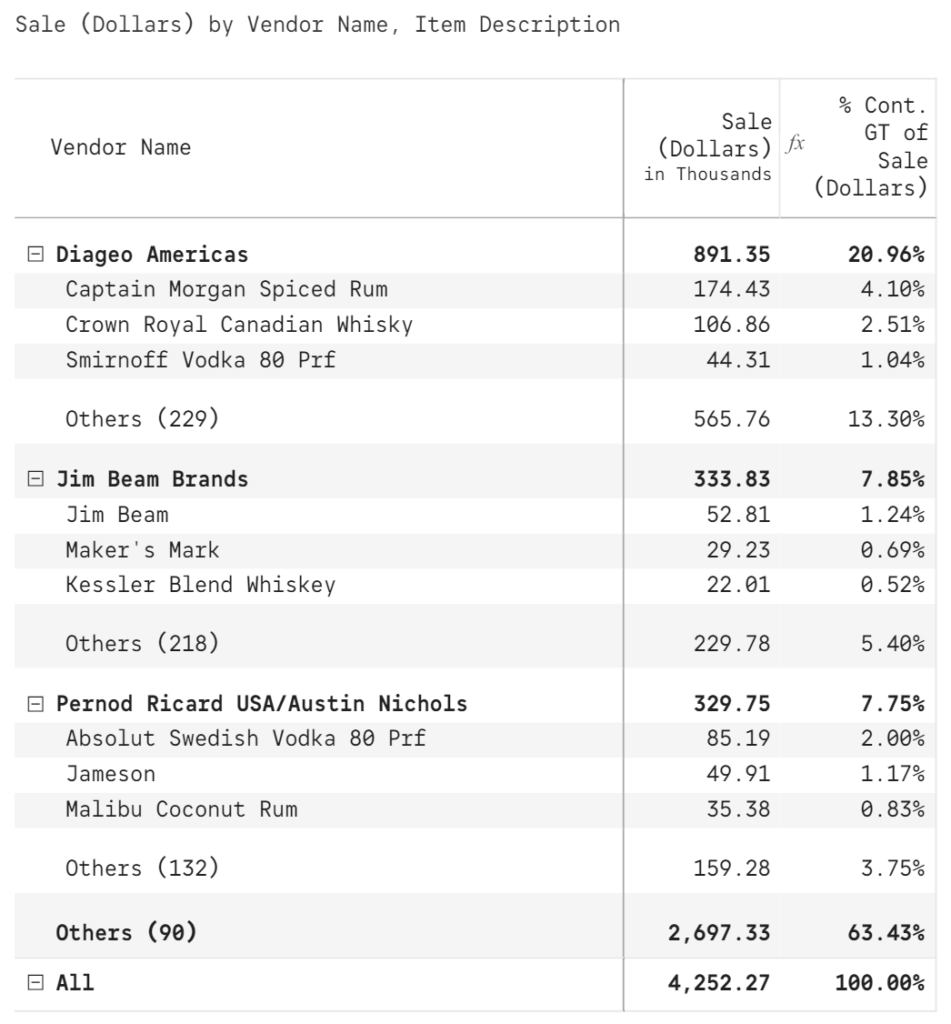
The Nested Top N report above also features Others for each category – vendors and products. This ensures that the company-level total of 4.3M tallies with the individual numbers.
There are several other practical applications to using the Nested Top N + Others.
We can also extend such nesting to more than two levels.
Let’s assume that the firm plans to do in-store promotions for these shortlisted products. It decides to choose top 3 stores for each of the products in the above list.
The three-level Nested Top N + Others report looks like the following. The vendors are highlighted in yellow so that you can spot the top 3 products for each vendor easily.
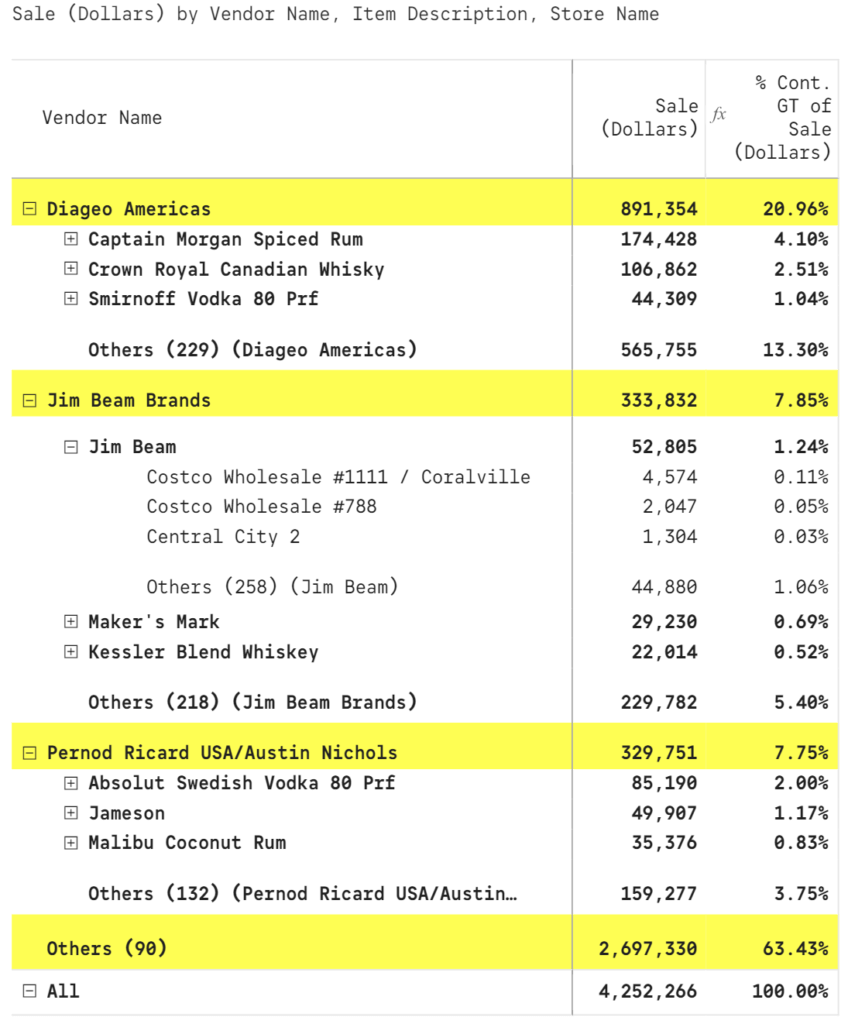
To keep the image compact, the Top 3 stores are revealed only for one product (Jim Beam). When you expand all branches, you would at the most have 27 distinct stores (3 vendors x 3 products x 3 stores).
Note that we have 1400+ stores in the dataset. So selecting 27 stores for promotions using the above method results in a highly focused campaign.
***
The Bottom N analysis and its characteristics are very similar to Top N that everything that we learnt above equally applies to Bottom N. Note that when it comes to nested combinations, there can be interesting use cases to a mix of Top N and Bottom N (e.g., Least profitable 3 products from the Top 3 vendors).
***
Despite a variety of practical applications to Top N analysis, many tools fall short in delivering truly dynamic & nested Top N + Others capabilities to users.
In one of our upcoming blogs, we’ll look at a couple of tools - Excel and Microsoft Power BI – and explore how Top N analysis can be implemented.
[1] Source: Partial extract from Iowa Liquor Sales data - https://data.iowa.gov/Sales-Distribution/Iowa-Liquor-Sales/m3tr-qhgy

Inforiver helps enterprises consolidate planning, reporting & analytics on a single platform (Power BI). The no-code, self-service award-winning platform has been recognized as the industry’s best and is adopted by many Fortune 100 firms.
Inforiver is a product of Lumel, the #1 Power BI AppSource Partner. The firm serves over 3,000 customers worldwide through its portfolio of products offered under the brands Inforiver, EDITable, ValQ, and xViz.


