Inforiver

Upcoming webinar on 'Inforiver Charts : The fastest way to deliver stories in Power BI', Aug 29th , Monday, 10.30 AM CST.    Register Now
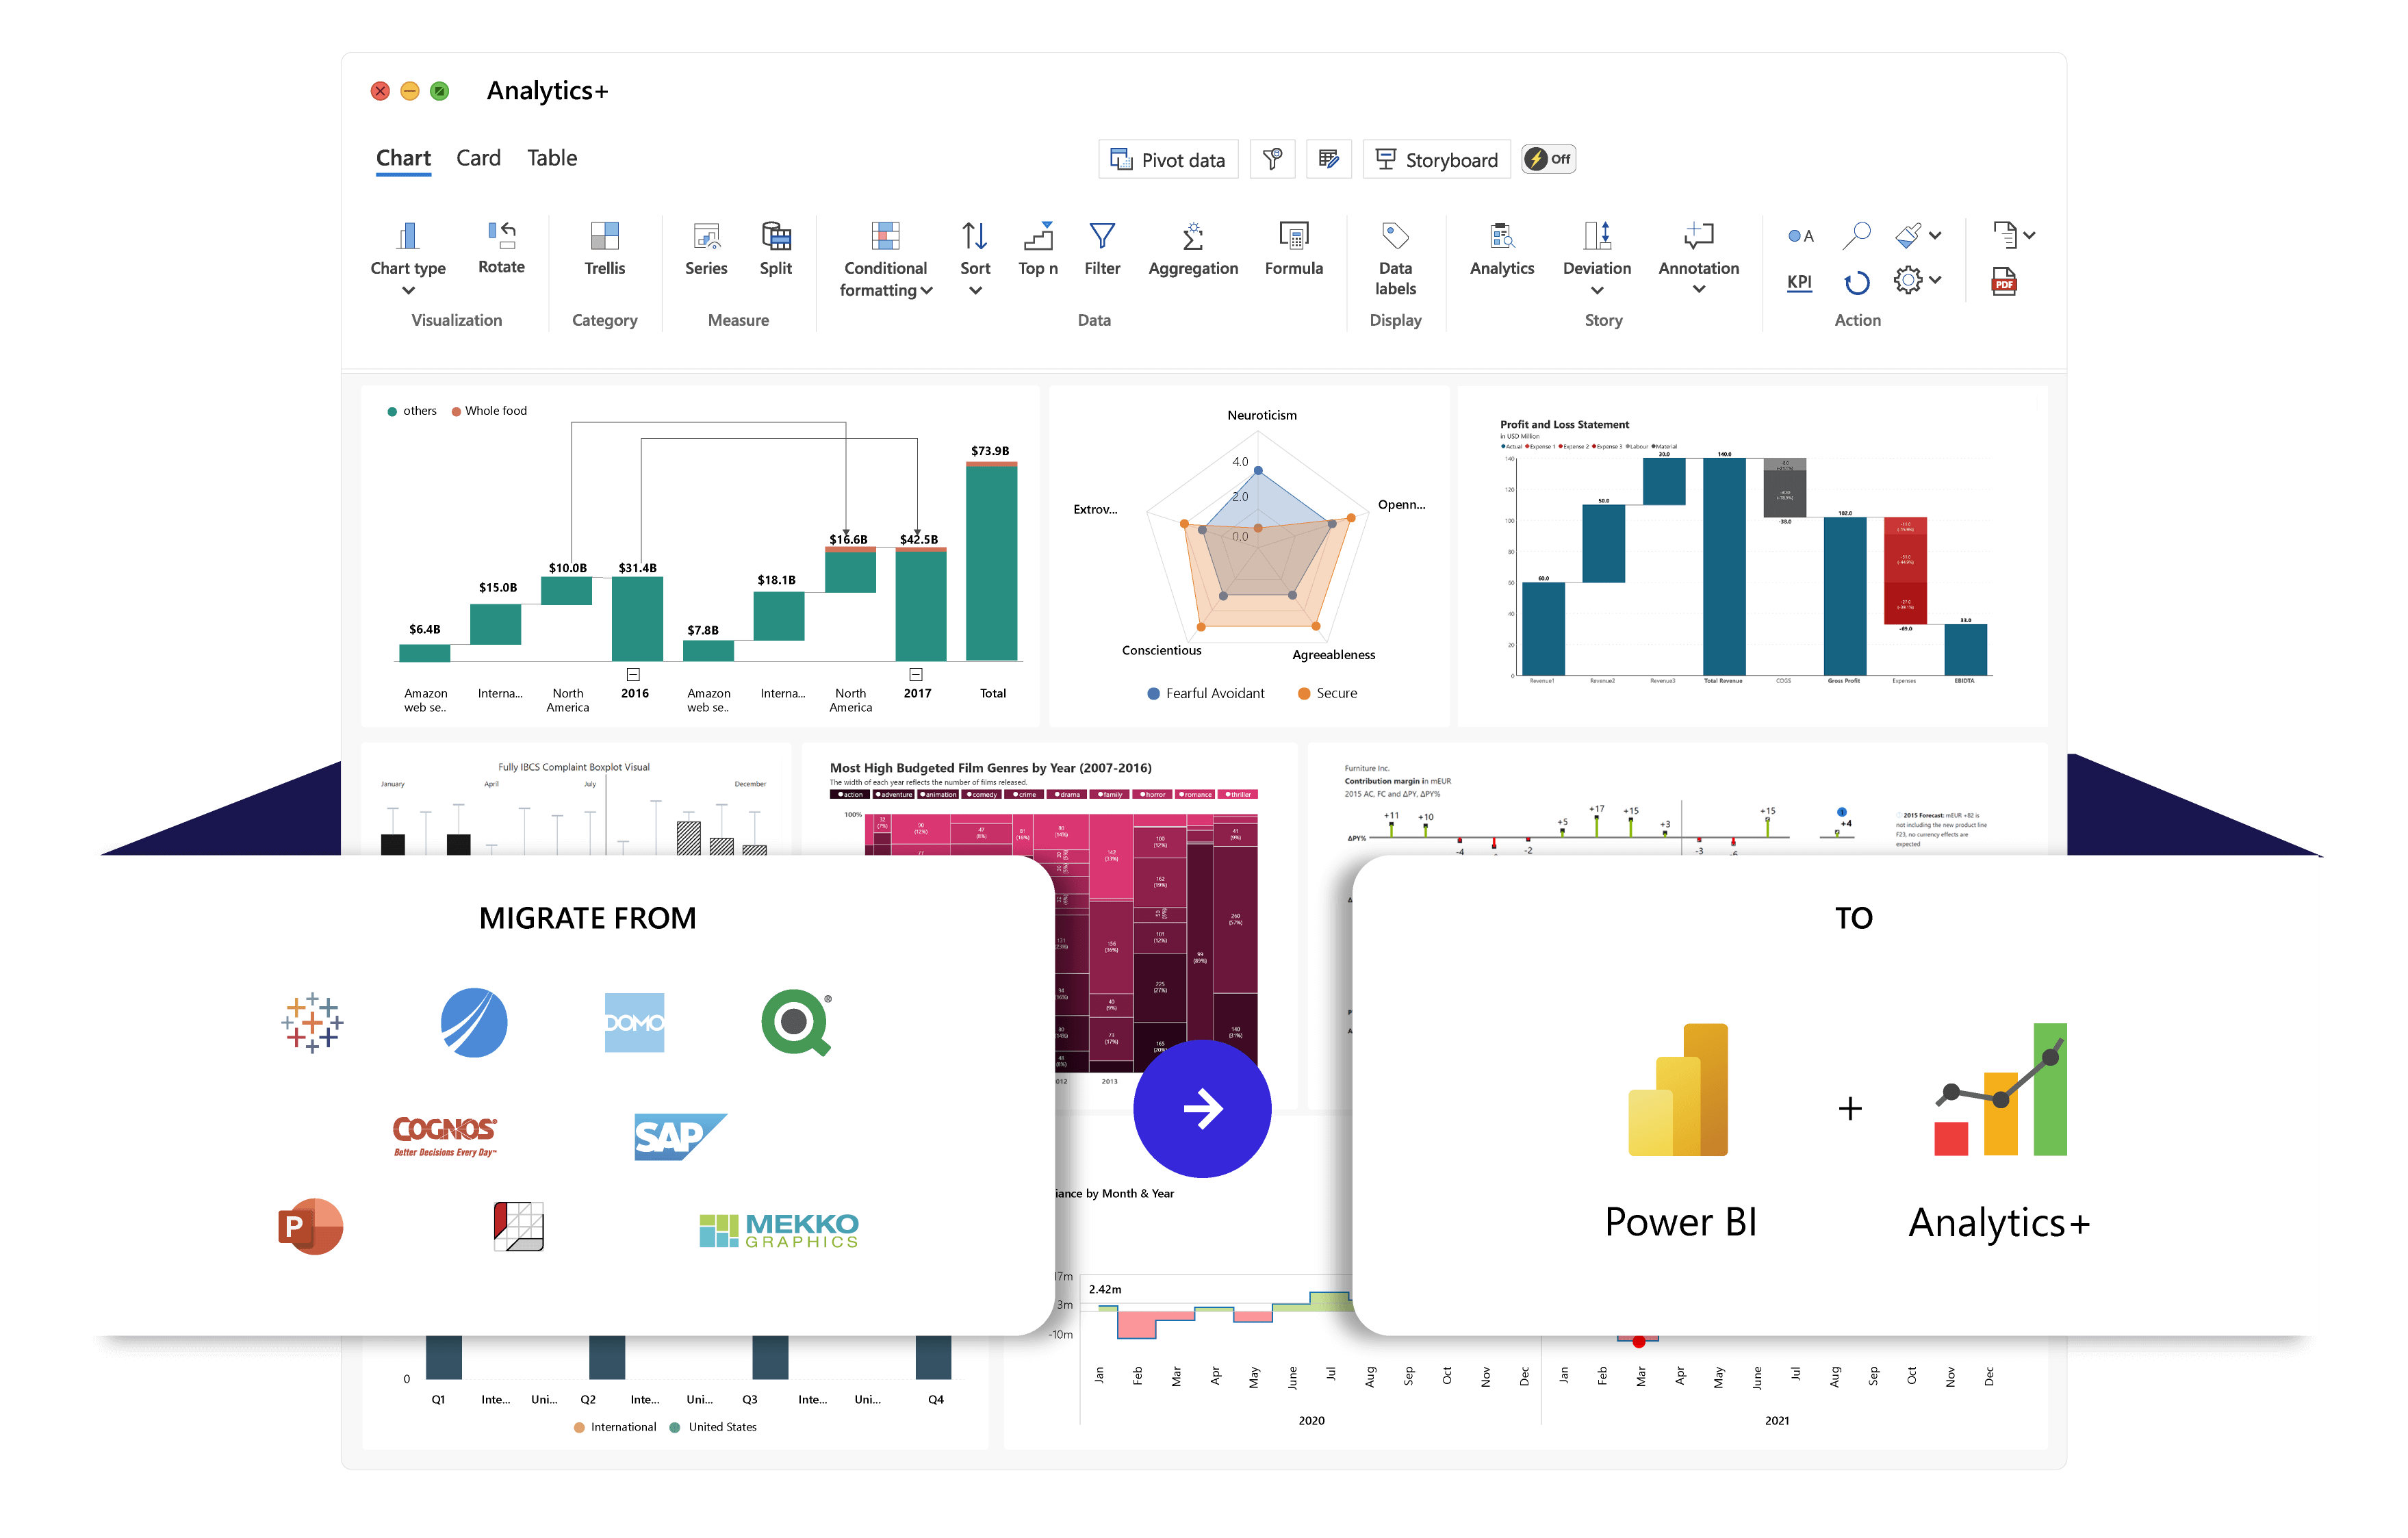
Migrate and consolidate your analytics in Power BI

Certificates

Support 10x more data points than Power BI

Datapoints
Most native Power BI visuals support only 3,500 data points. With Analytics+, you can render more 30k data points.
Try for FREE

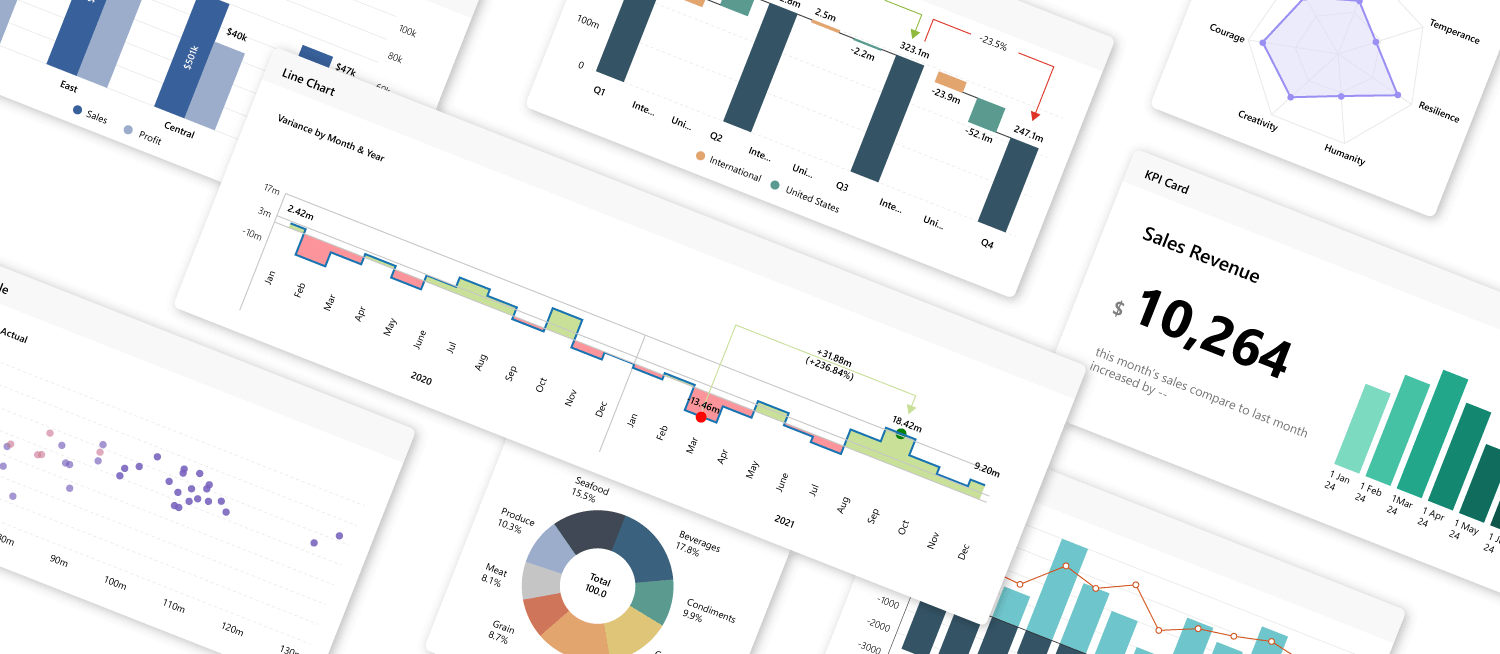
Deliver advanced charts

Leverage advanced visualizations available in tools like Tableau, Qlik & Spotfire but unavailable in Power BI.
Marimekko Strategicbox & whisker plotAdvanced Waterfall Strategic ChartsBullet Strategic ChartsStorytelling Strategic Chartsdual-axis-chartsHistogramexecutive-funnel

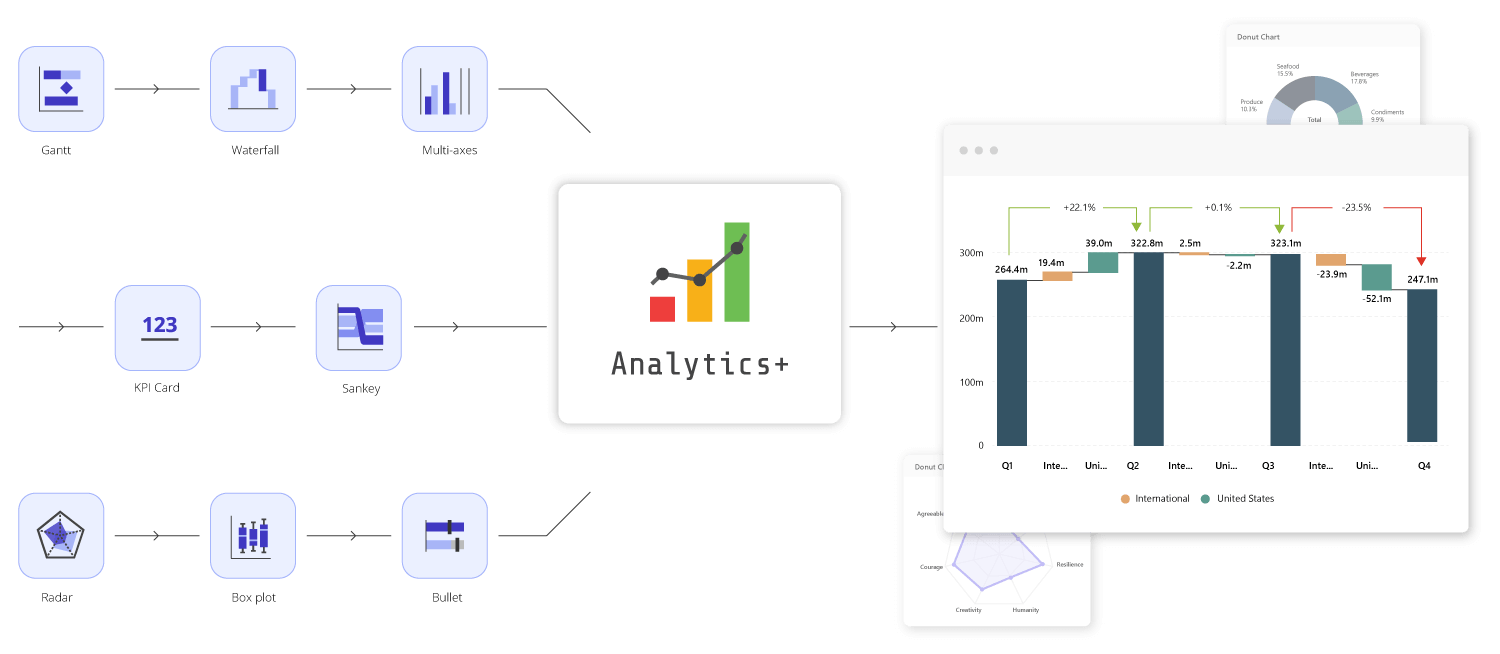
Get 50+ additional charts not in Power BI

Migrate from other tools to Power BI without having to re-think your storytelling due to missing charts

Enhance your storytelling

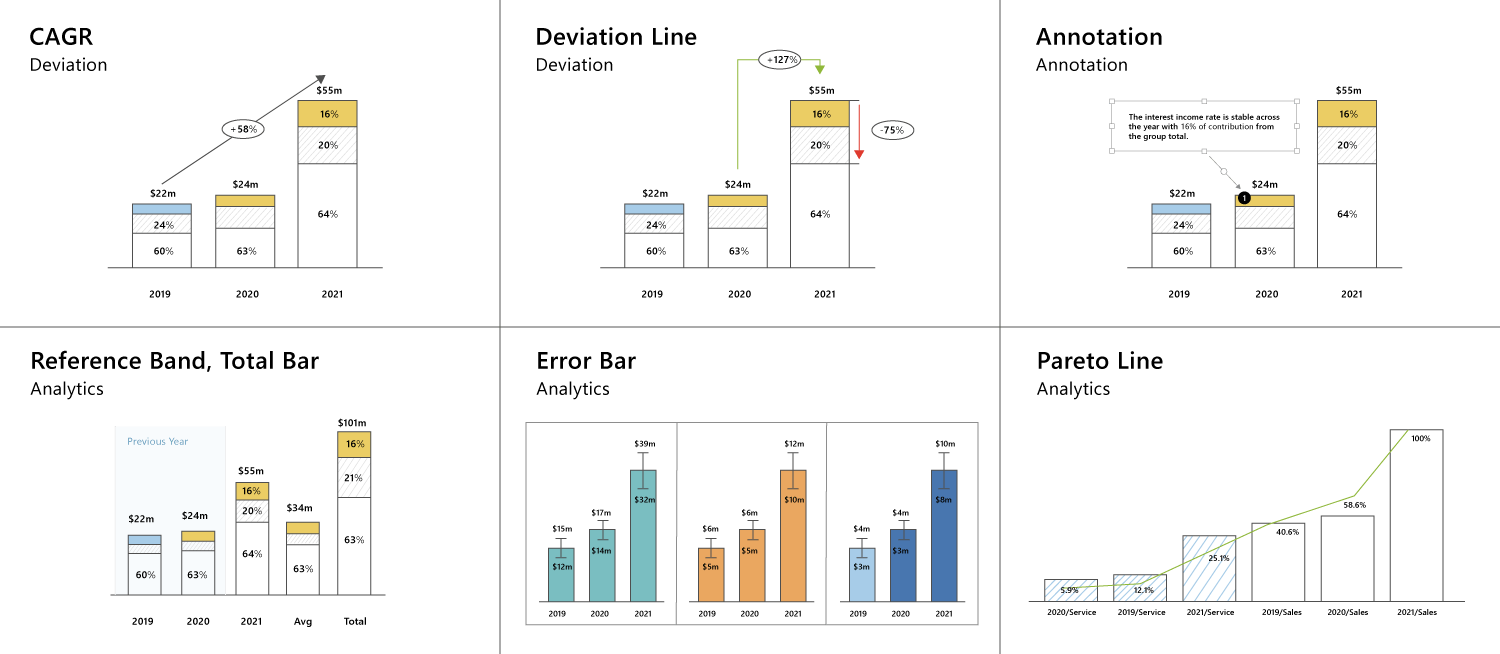
Leverage a range of capabilities to enhance storytelling, including:

Analytics

  • Reference lines/bands
  • Trendline
  • Error bar
  • Pareto Analysis

Deviation

  • Multiple deviations
  • CAGR

Annotations

  • Data point annotations
  • Canvas annotations
Enhance your storytelling
Know more

Incorporate standards & best practices

Leverage industry-leading best practices and standards. Inforiver is IBCS (International Business Communication Standards) certified.
IBCS reviewIBCS certifiedLearn more

Implement in-visual calculations & formatting 

Insert & visualize custom calculations using an intuitive formula editor
Implement in-visual calculations & formatting

Deliver compelling user experiences

Pivot Data Interface
Transform data structure by splitting categories & measures, and easily visualize complex data structures.
Toolbar
Leverage modern toolbar to interact and configure your visuals with ease; can be turned on/off in reading view
Side Panel
Improve productivity & efficiency by directly configuring style and formatting options from the on-demand side panel
Chart Wizard
Find the right chart, configure display properties, and set analytics options in one seamless onboarding screen.
On-object Interaction
Enhance user speed with mini toolbar over each element. Interact directly with each component intuitively.
Accessibility Features
Make your reports accessible with hierarchical axis, lasso, annotation, export to PDF, zoom and more.

Migrate from Tableau/Qlik/Spotfire to Power BI

Address key gaps in visuals, features and capabilities while migrating to Power BI
Missing Visualizations
Missing Features and UX
Core Power BI Gaps

1. Distribution

  • Box-and-Whisker plot
  • Histogram
  • Swarm plot
  • Dot plot

2. Comparison

  • Funnel/Pyramid chart
  • Bullet chart
  • Arrow plot
  • Slope graph
  • Dumbbell plot

3. Hierarchical/Relationship

  • Hierarchical treemap
  • Nested Bar/Column chart
  • Packed bubble Marimekko
  • Sankey [Release 5.0]

4. Sparklines

  • Sparkline support for all chart types

5. Multi-Dimensional Analysis

  • Parallel coordinates (Bump)
  • Radar/Polar chart

6. Measure-based

  • Measure breakdown waterfall chart
  • Measure-only support

7. Small Multiples/Trellis

  • Trellis support for all chart types
  • Multi-dimensional (x,y,z axes) trellis/small multiples with hierarchy support

8. Table

  • Conditional formatting
  • Row sparklines
  • Customization

1. Chart Customization

  • Synchronize axis for dual axis chart
  • Adding grand total
  • Highly customizable chart
  • Error bars and analytics support
  • Conditional formatting icon support for tables
  • Rich themes and formatting
2. Interaction & Filtering
  • Customize charts with
    on-object interactive options
  • Lasso selection and zooming capabilities to focus on specific parts of a high-volume visualization
  • Exclude values through legends

3. Reading View UX

  • Visual data exploration by switching chart types
  • Toggle visibility of visual elements like labels, axis, etc.,
  • Ad-hoc analysis by mapping data into different buckets

4. Storyboarding

  • Rapidly build dashboards using templates and accelerators
  • Advanced layering and arrangements of visual elements
  • Bundling various charts and elements as component groups

1. Visualize 30K+ Data Points

  • Power BI visualizations cannot visualize more than 3.5k datapoints

2. In-Visual Calculations

  • Perform calculations directly within the visual with NO DAX
  • Inbuilt variance calculations

3. Data Prep & Transformation

  • Pivot data - data catalog like tableau
  • Make easy edits to category labels with summary table
  • Split measures into trellis
  • Split categories into measures
  • Measure grouping capabilities

4. Story Telling and Annotations

  • Contextual annotations tied to the data point
  • Deviation and CAGR support
  • Visual storytelling with reference lines/bands
  • Dynamic analytics support (pareto, trendlines, error bar, etc.,) 
Watch the Webinar

Featured videos

Featured Blogs

3 ways to create a budget in powerbi featured3 ways to create a budget in powerbi featured3 ways to create a budget in powerbi featured

Upcoming webinar

The Ultimate No-Code Data Writeback in Power BI

Date & time: Oct 17, 2024, 11 AM CDT I Speaker: Gopal KrishnamurthyFounder/CEO

Register now
Box Whisker Plot Demo
Advanced Waterfall Charts Demo
Marimekko Charts

Implement advanced features

Leverage hierarchical navigation, advanced small multiples, formatting and more
hierarchical small multiples analytics plusconditionally format kpi headers analytics plusmeasure in row small multiples analytics plusflexible-chart-comparison-small-multiplesmanually-group-measurestop-n-in-small-multiplesconditional-formattingApply-rich-themesexport-to-pdf

Get your Free eBook

Explore the art of the possible with Analytics Plus

Get Inforiver brochure

Maximize your business potential with Inforiver's paginated reporting, data entry, planning & budgeting capabilities
Download now
Inforiver

Inforiver helps enterprises consolidate planning, reporting & analytics on a single platform (Power BI). The no-code, self-service award-winning platform has been recognized as the industry’s best and is adopted by many Fortune 100 firms.

Inforiver is a product of Lumel, the #1 Power BI AppSource Partner. The firm serves over 3,000 customers worldwide through its portfolio of products offered under the brands Inforiver, EDITable, ValQ, and xViz.

linkedin facebook pinterest youtube rss twitter instagram facebook-blank rss-blank linkedin-blank pinterest youtube twitter instagram